Well, election day came and went and everyone was glued to the internet to find out the results.
I took the extra step of logging all of the election night return files posted by the VA department of elections (“ELECT”) at 5 minute increments, as I wanted to plot the results over time as the numbers came in.
The data is from this link on ELECT’s website: https://enr.elections.virginia.gov/results/public/api/elections/Virginia/2023-Nov-Gen/files/json
I used a simple wget script to grab this file once every 5 minutes (approximately).
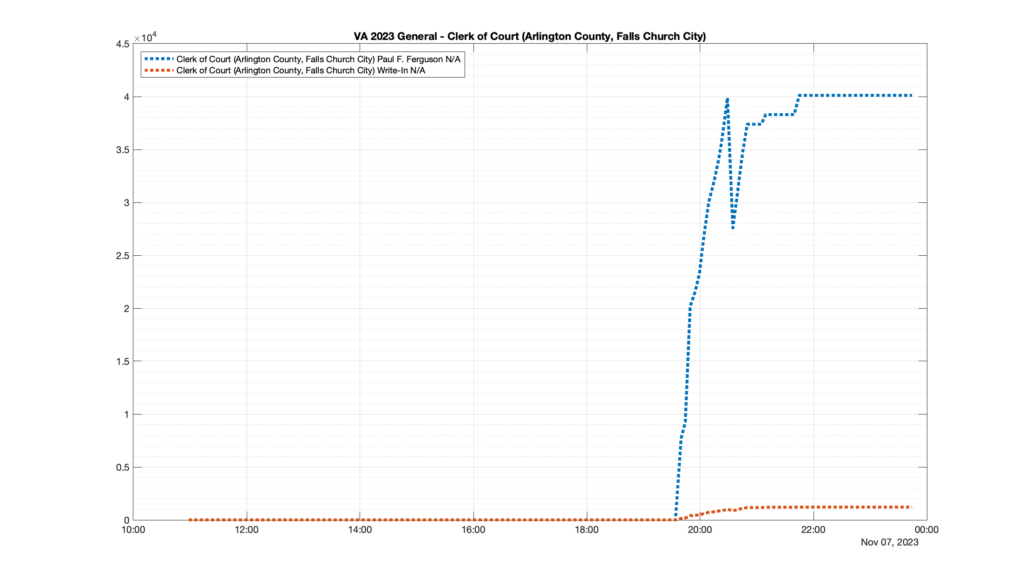
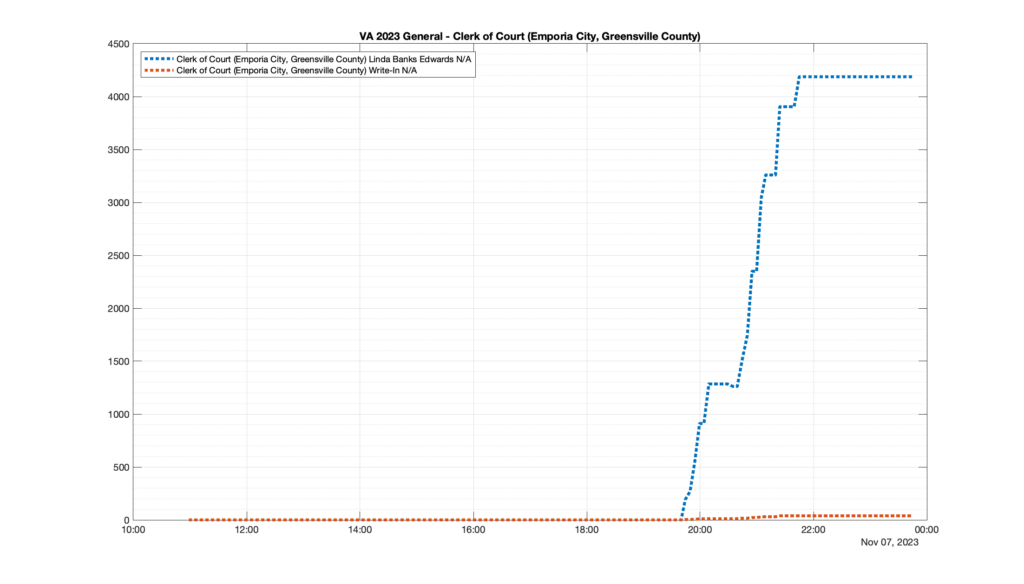
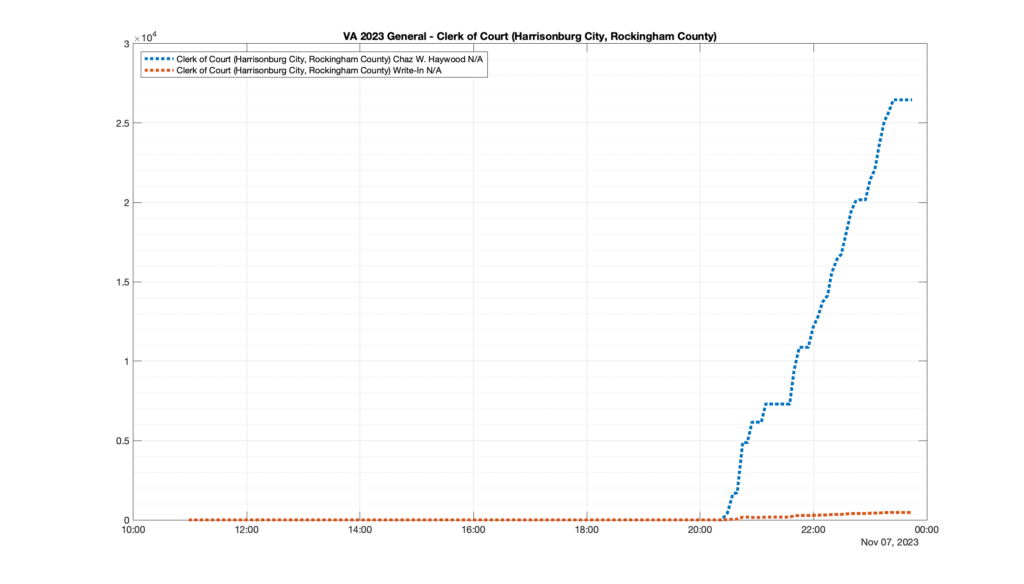
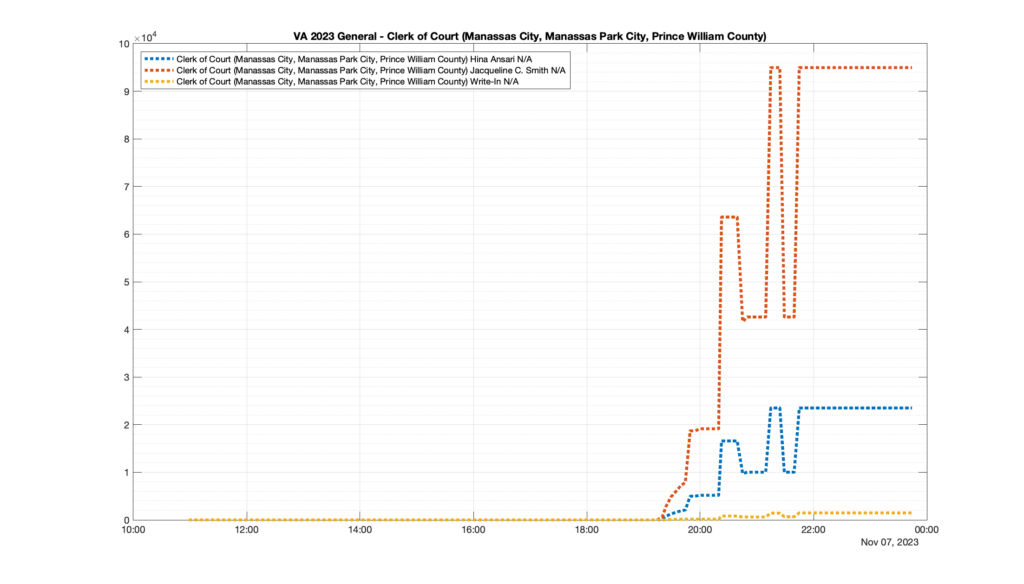
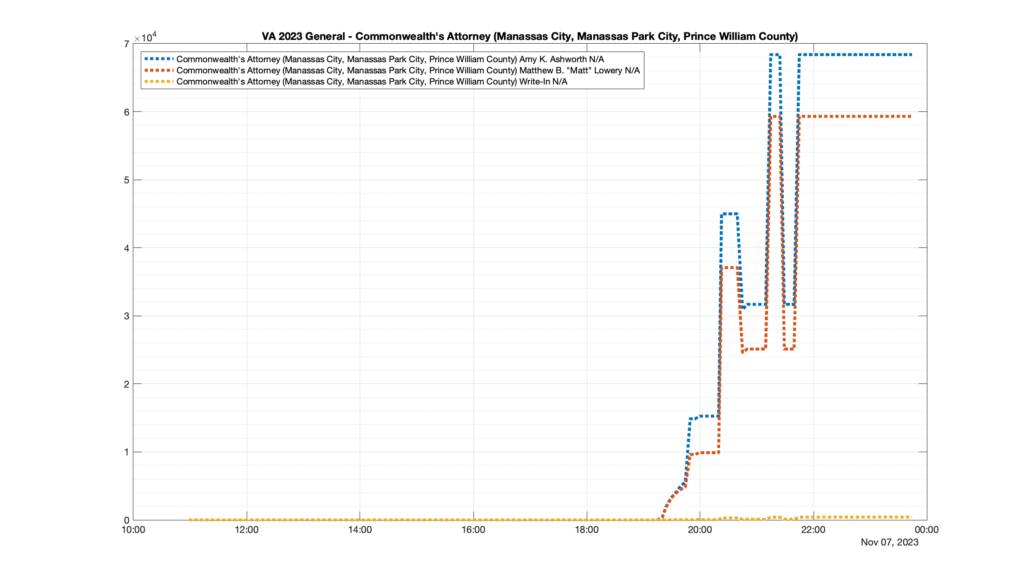
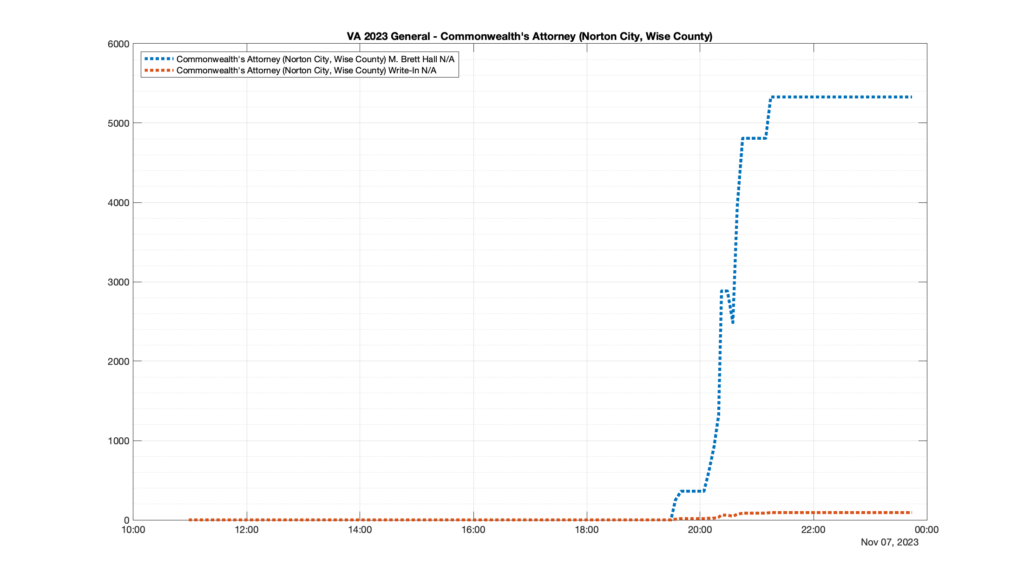
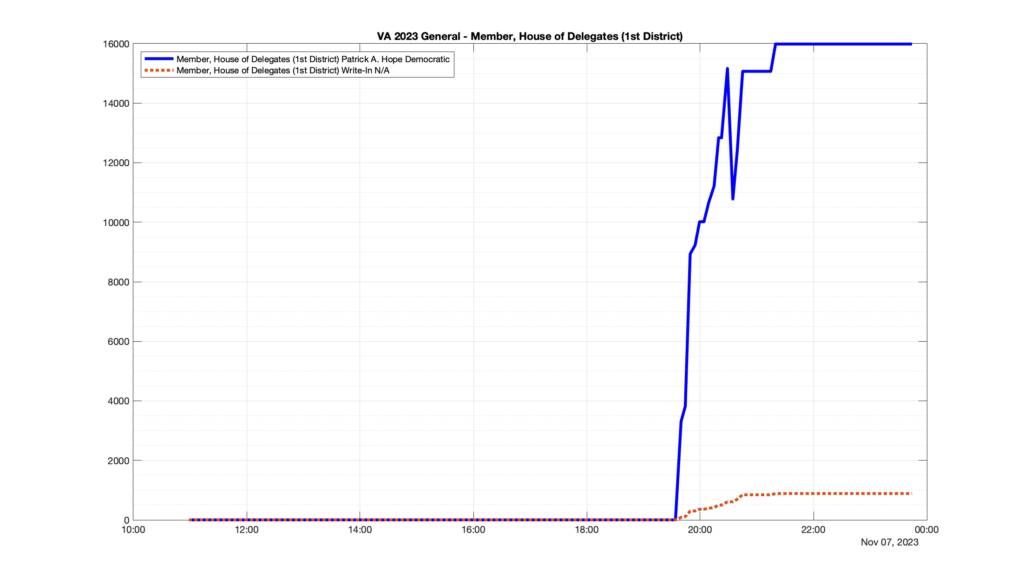
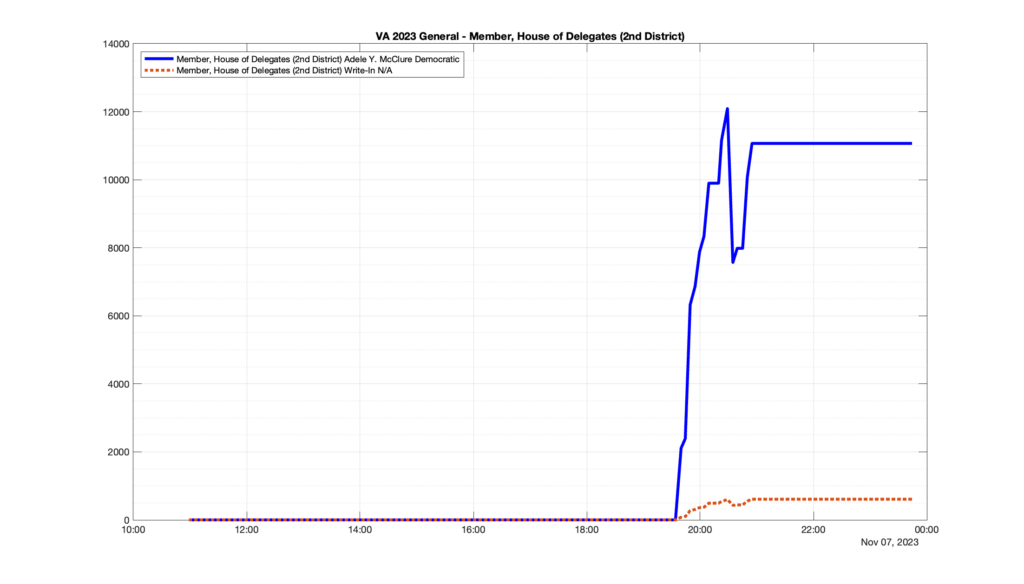
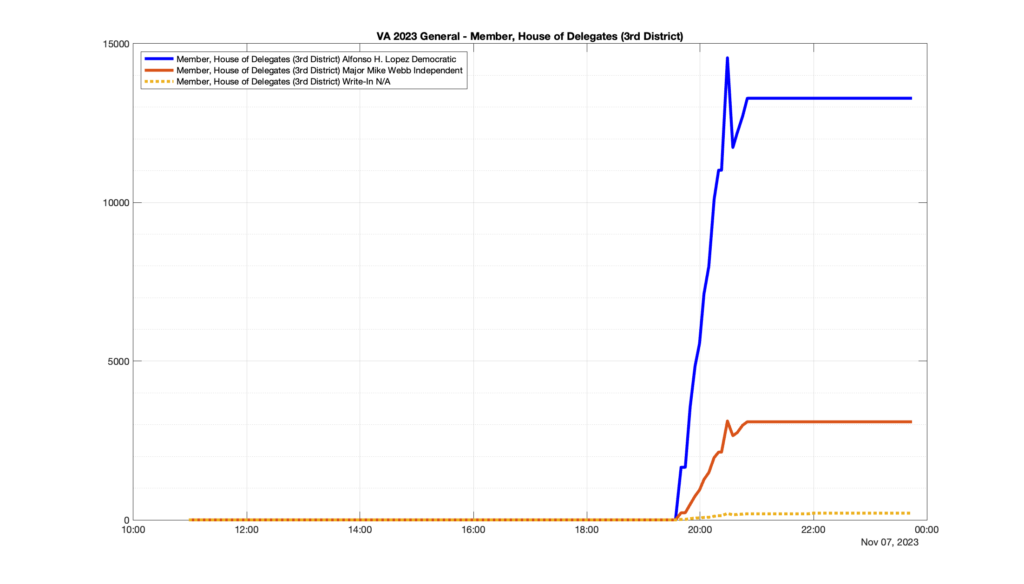
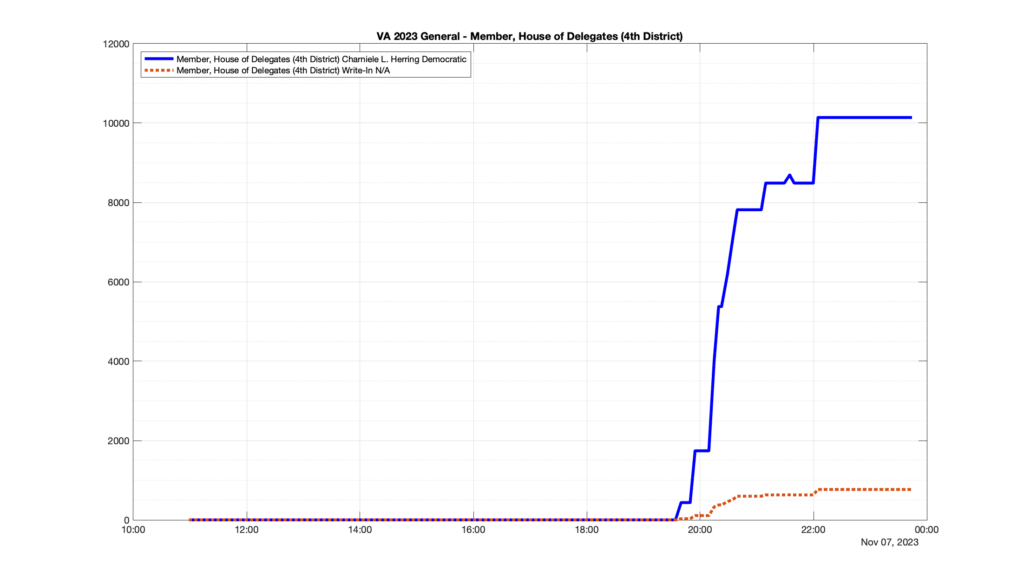
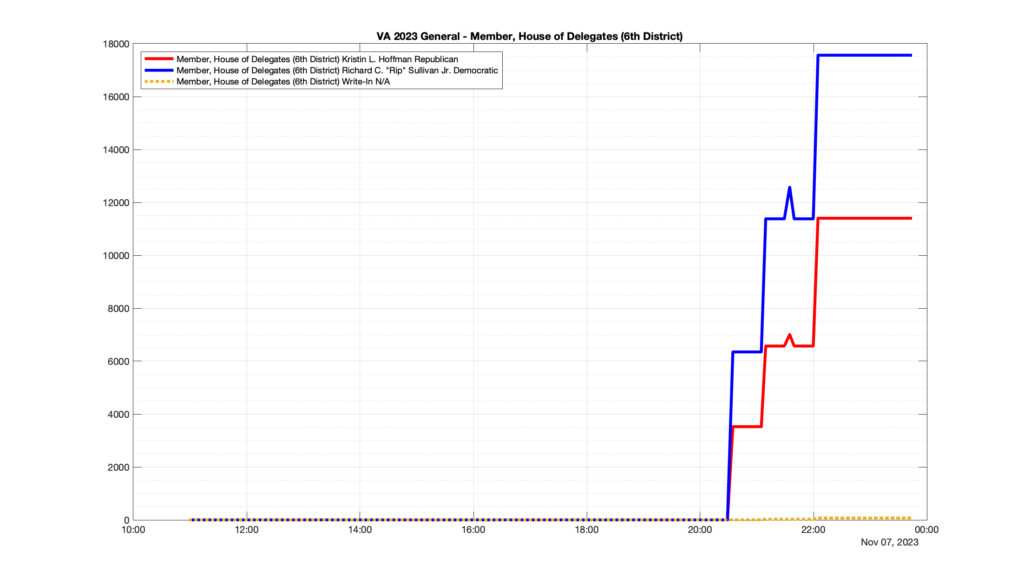
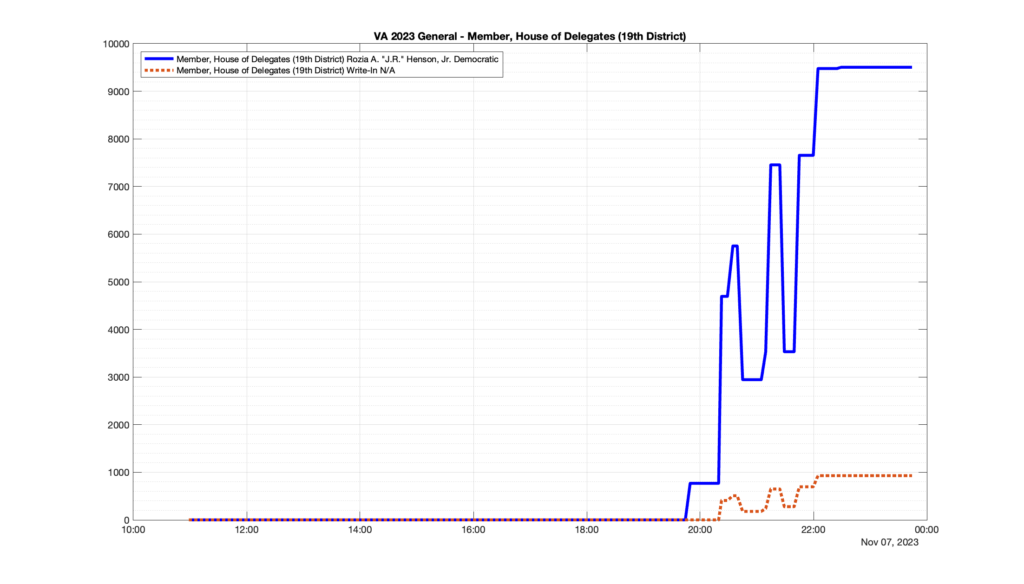
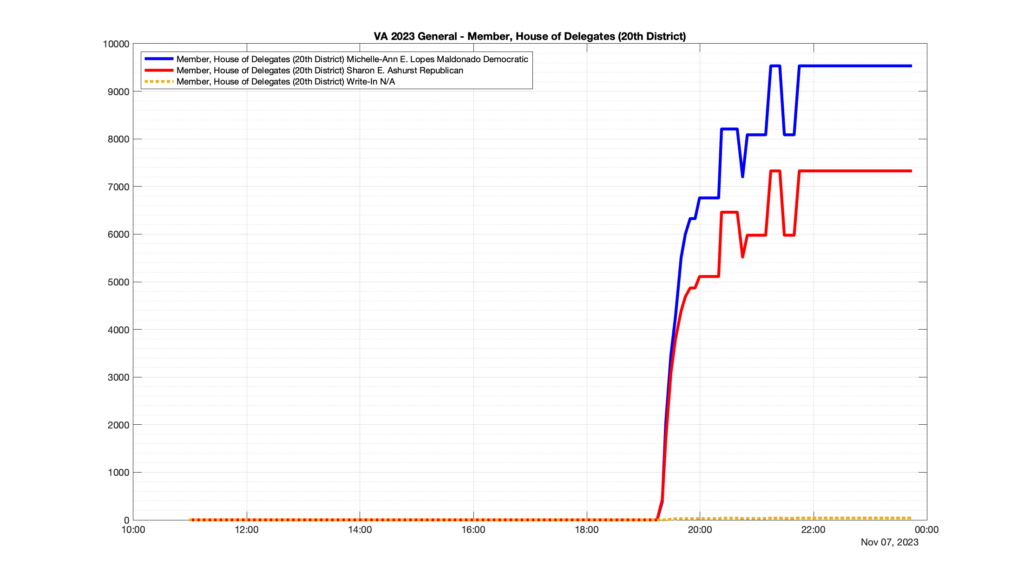
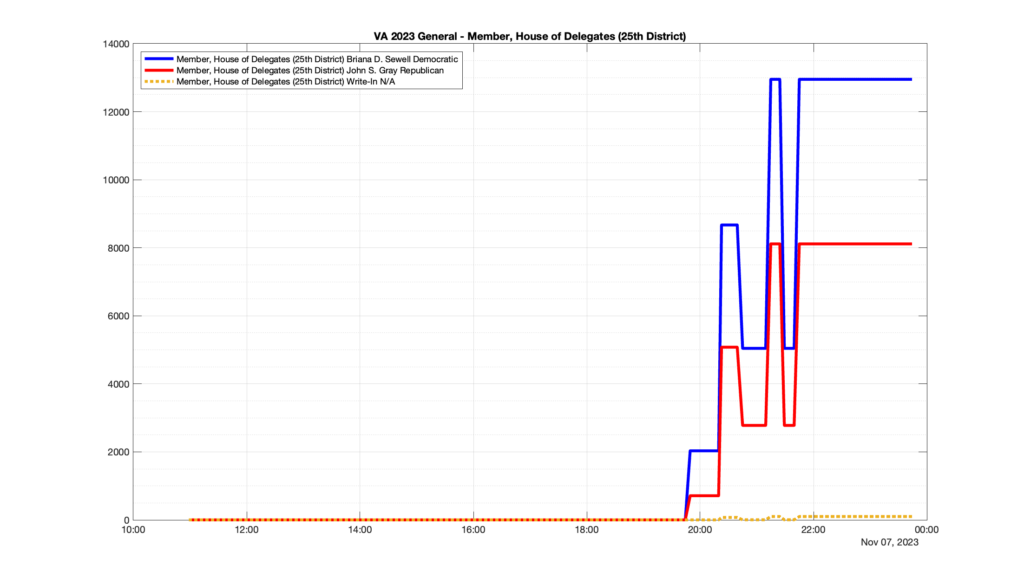
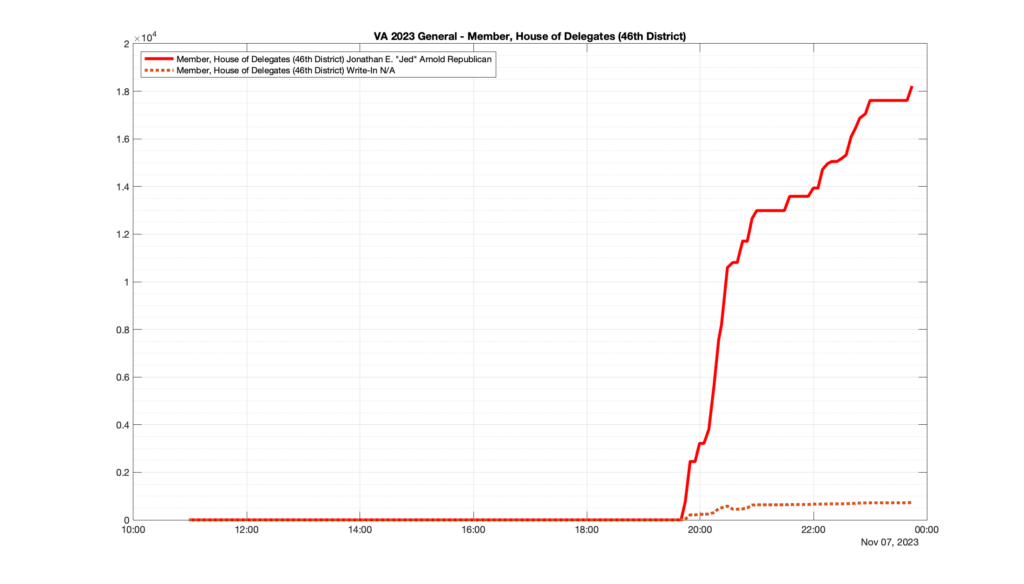
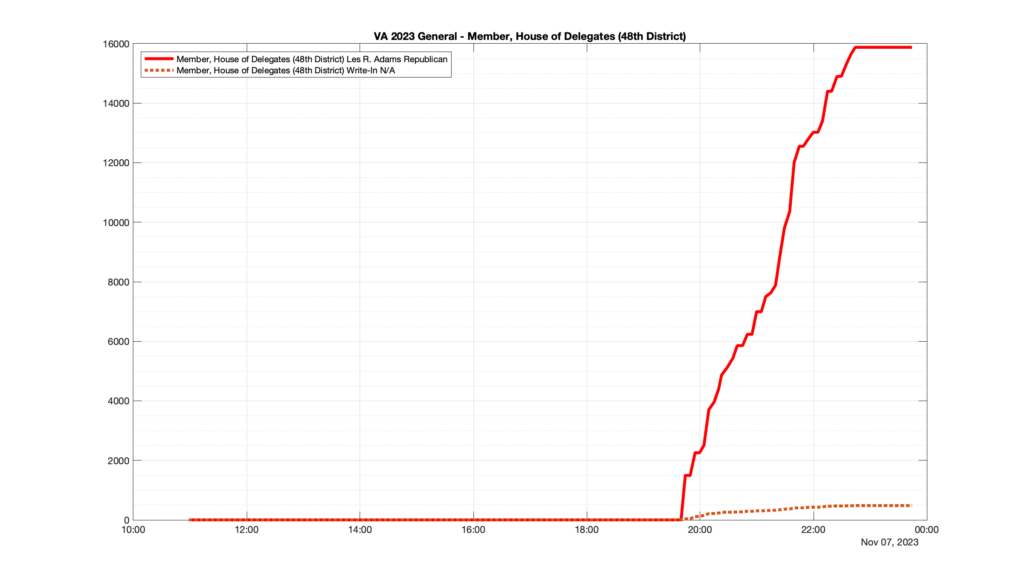
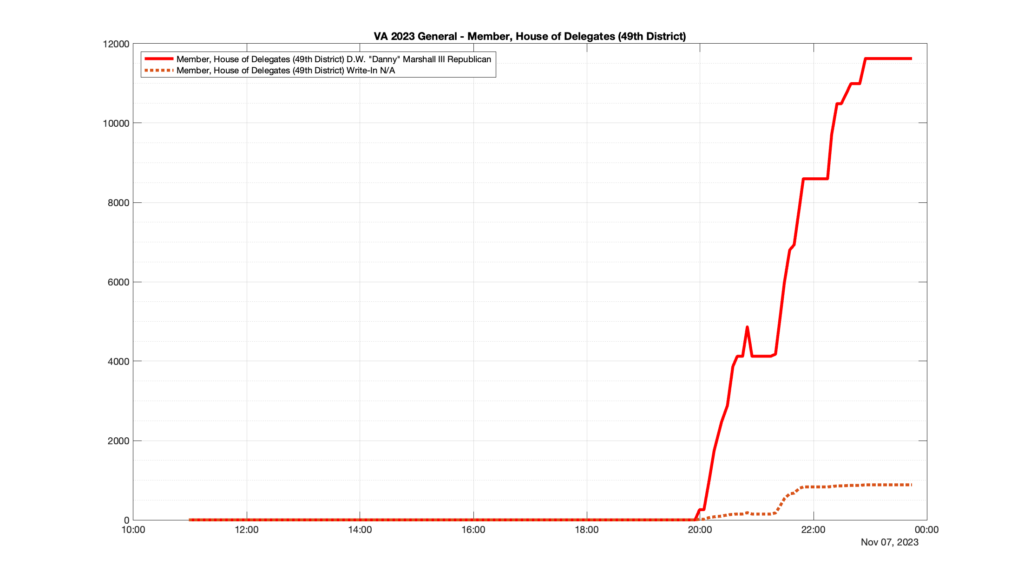
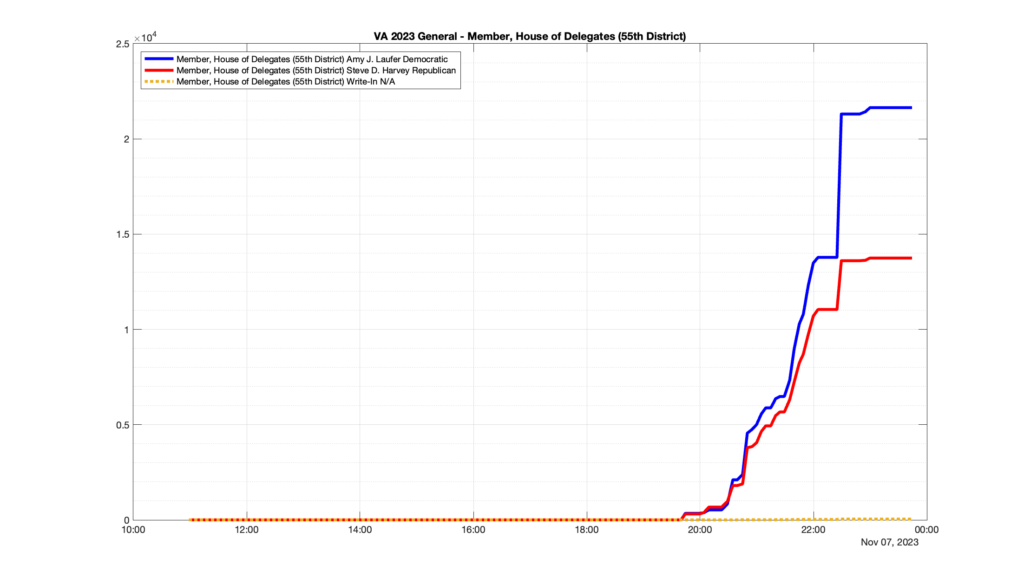
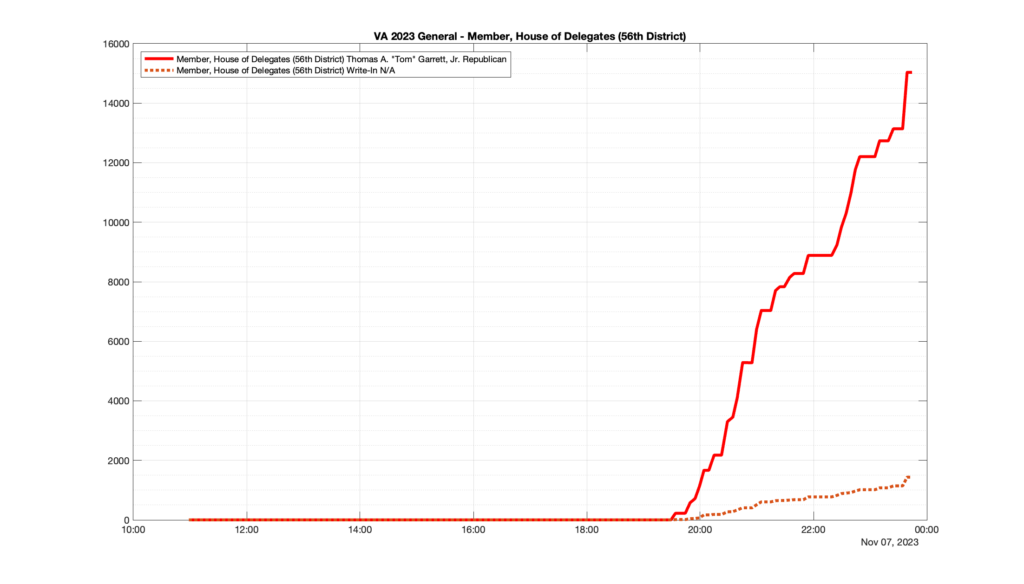
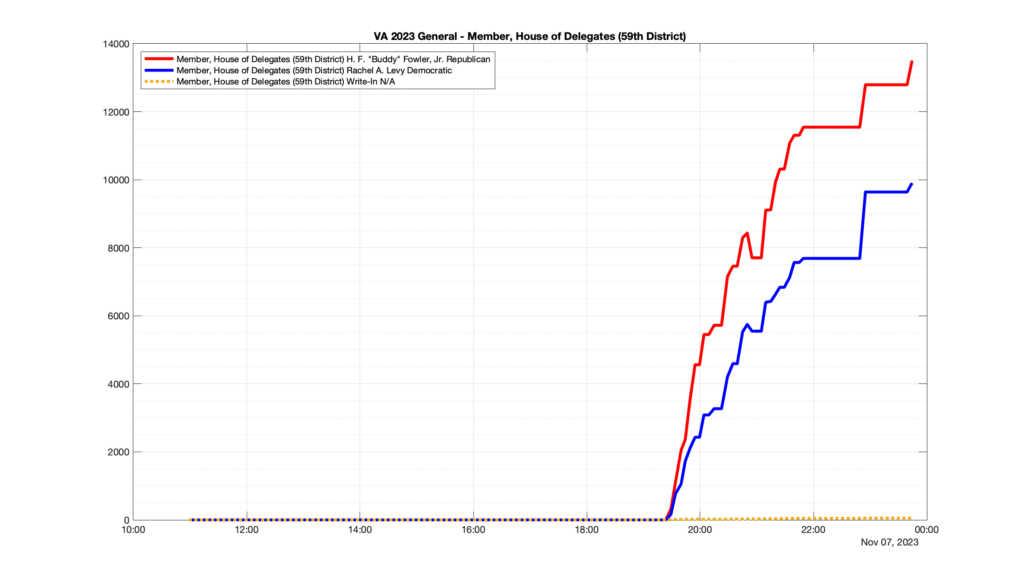
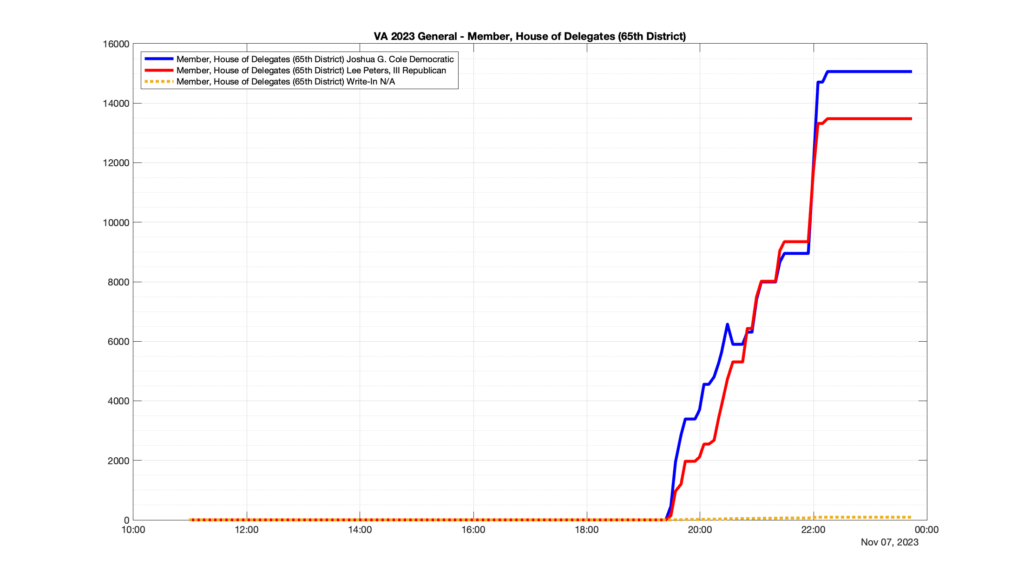
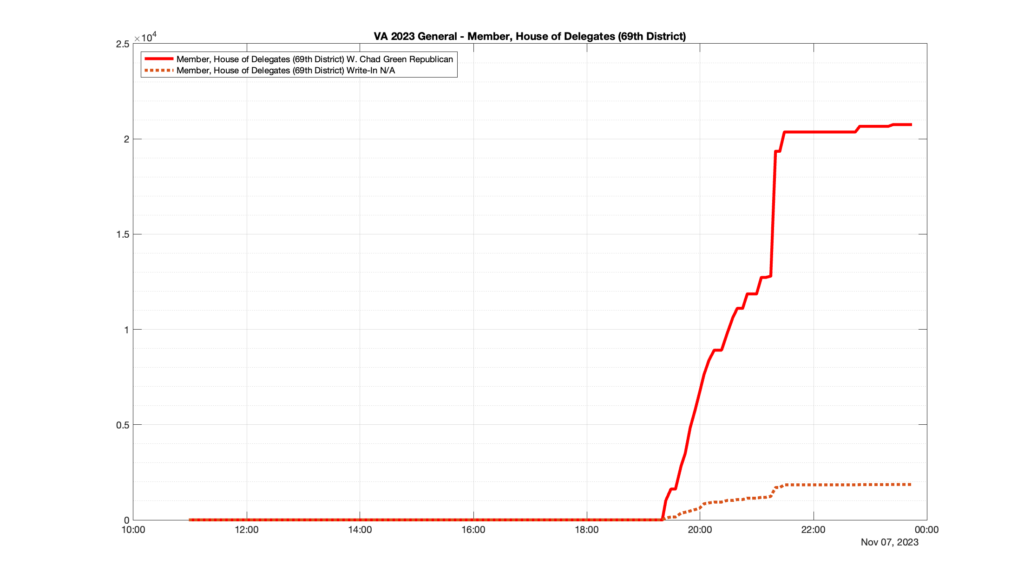
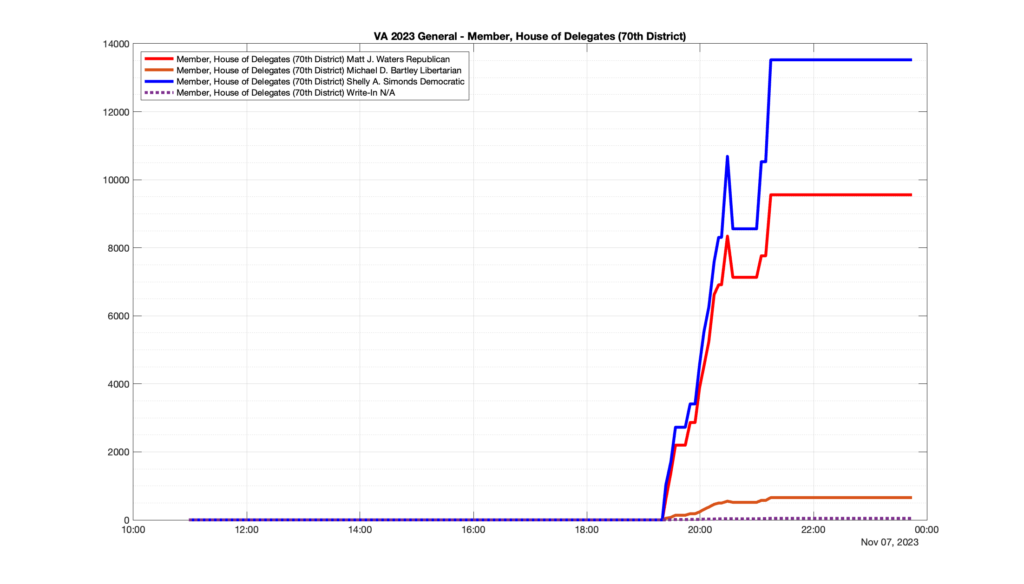
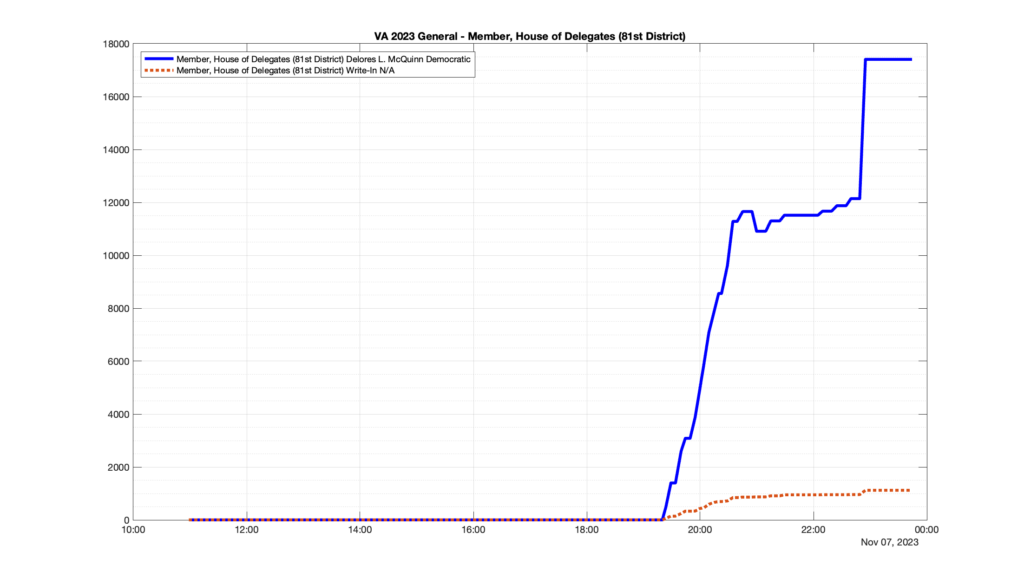
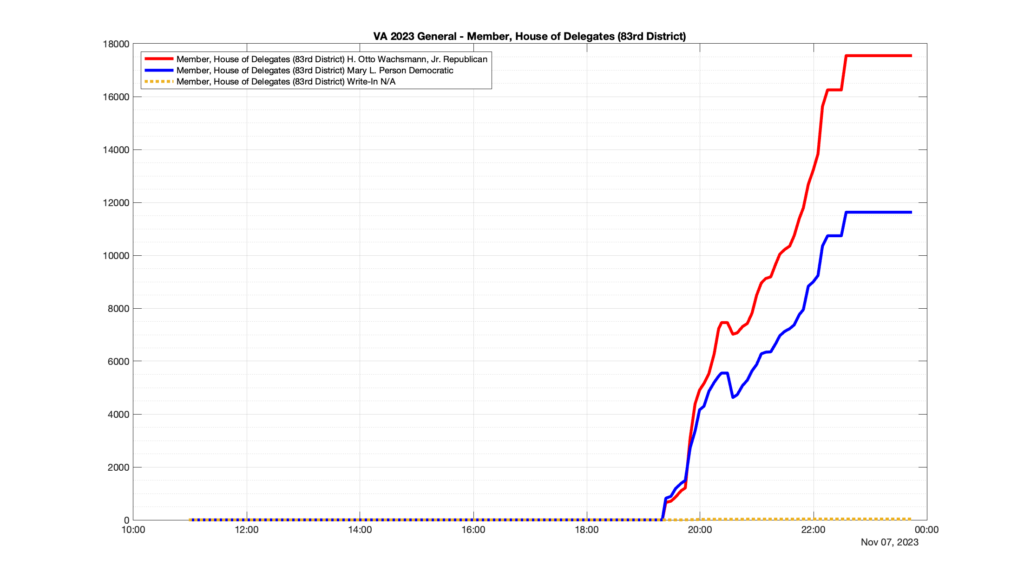
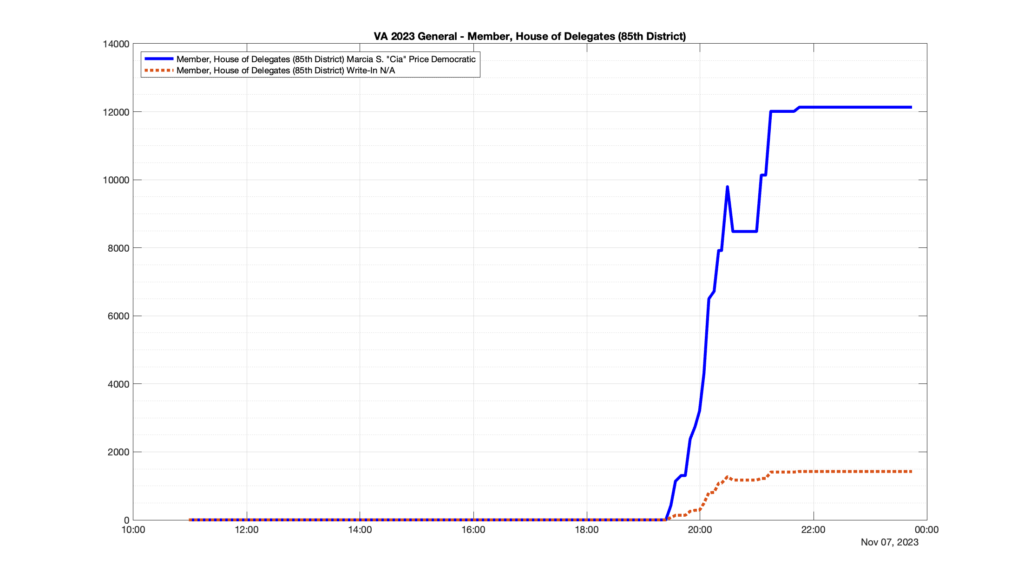
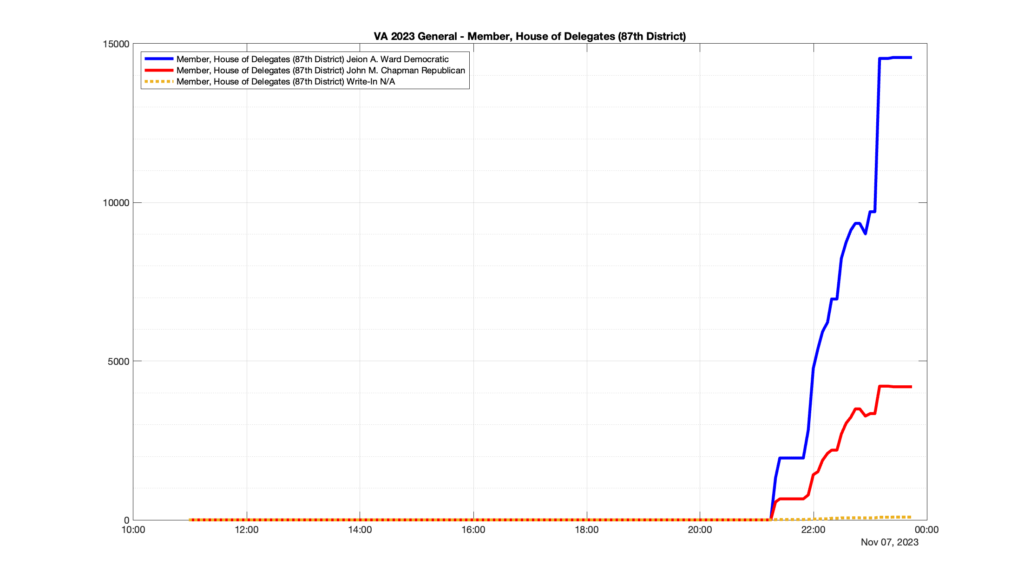
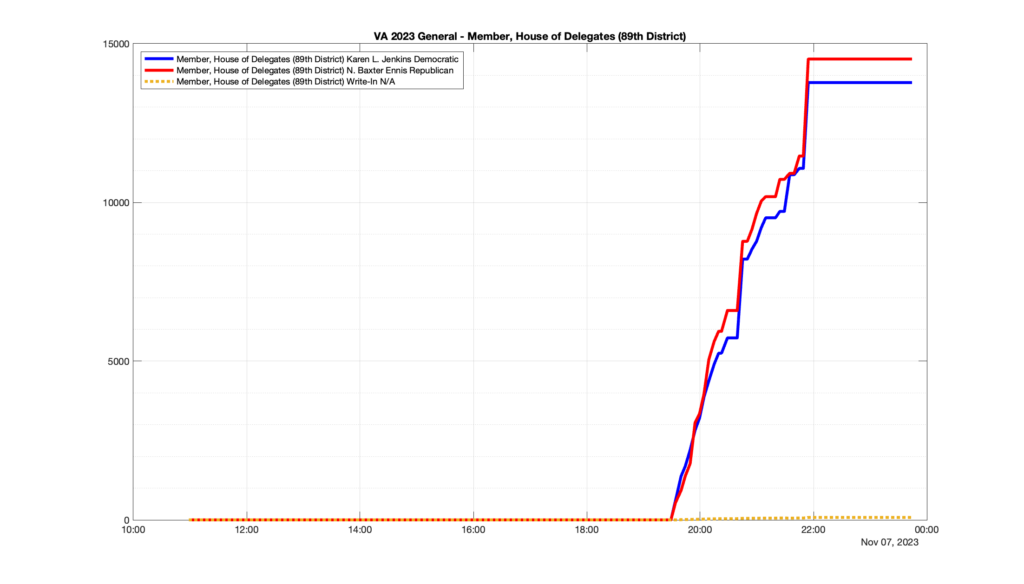
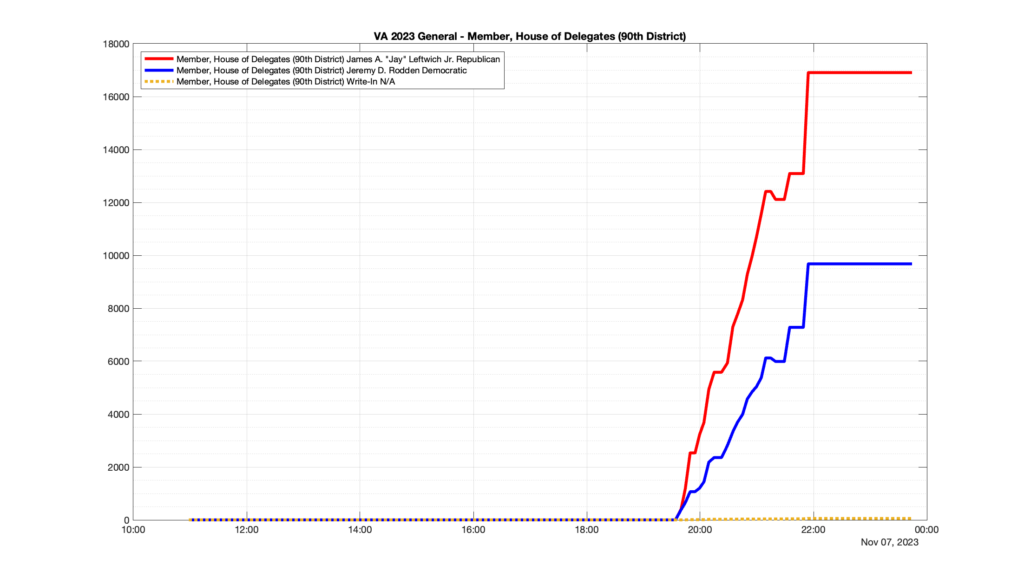
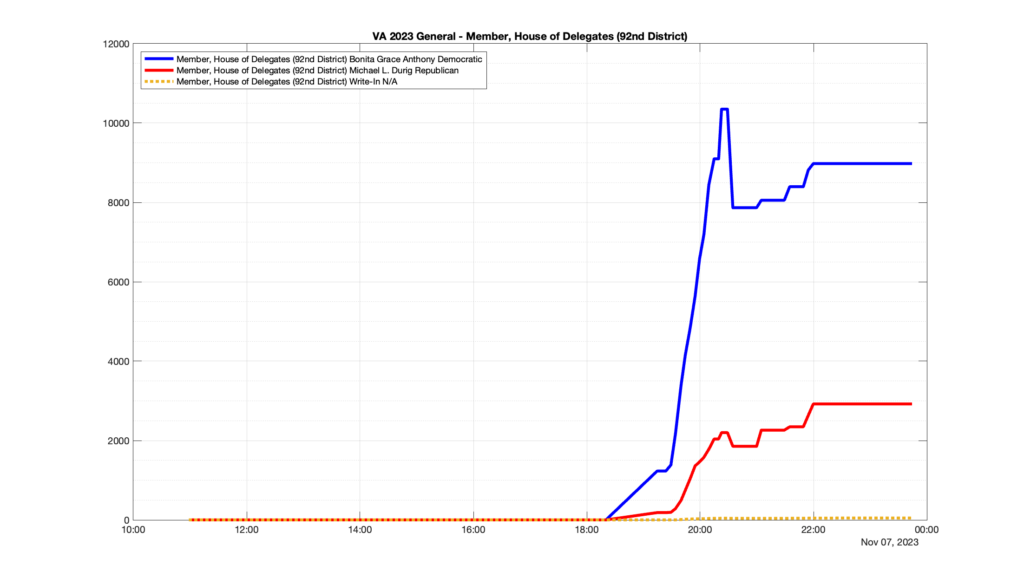
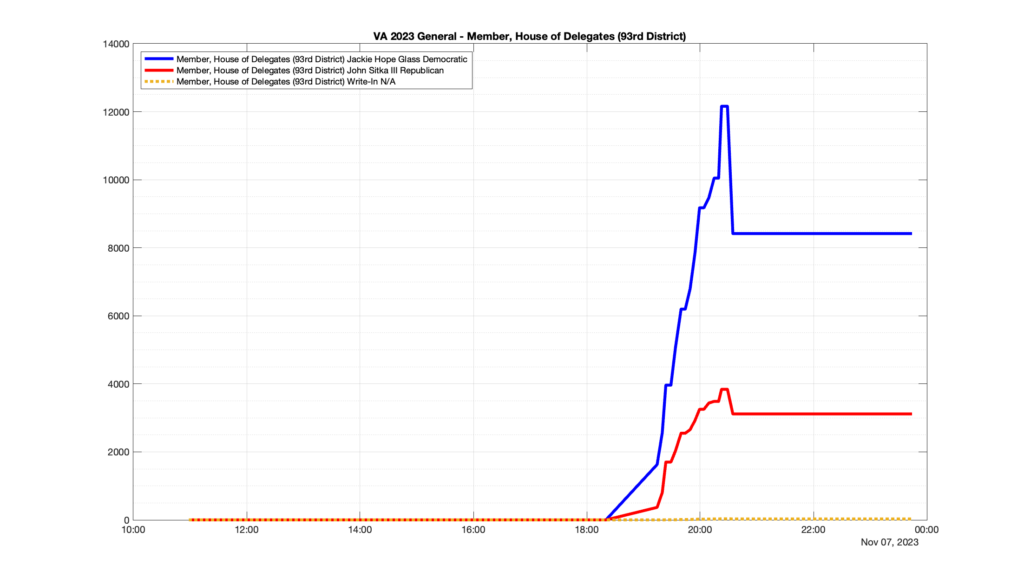
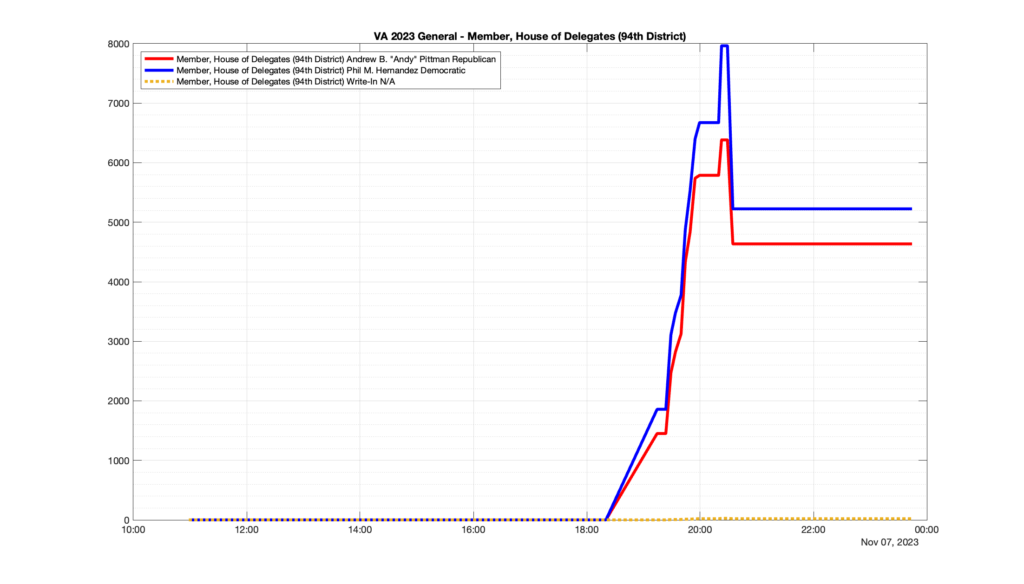
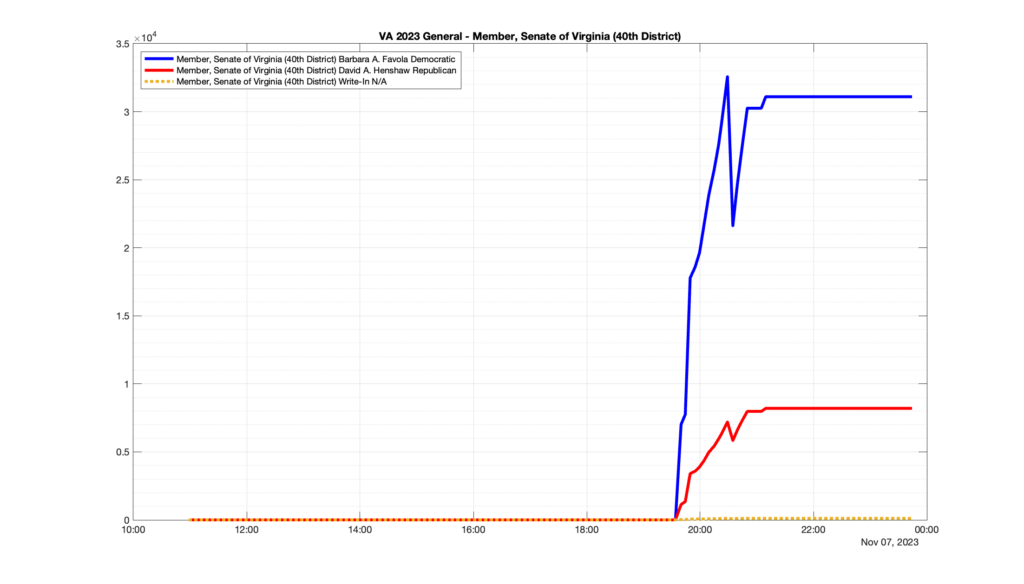
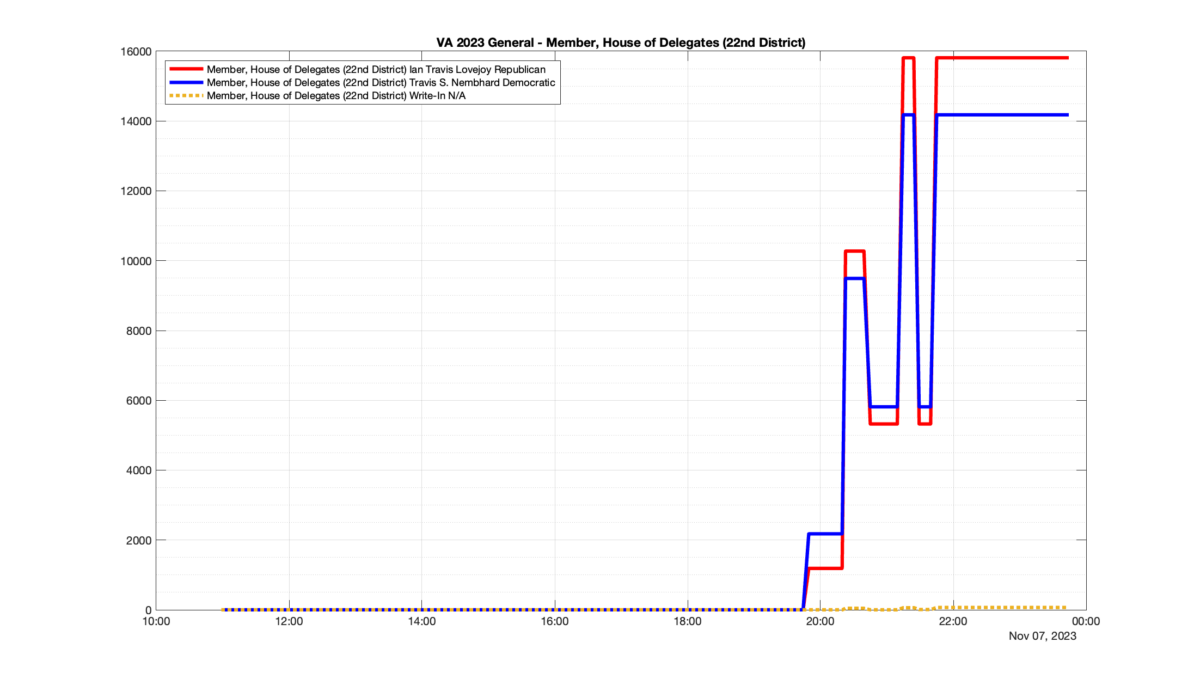
However, when I went to plot the results, I found some data curves that I can’t quite explain. Take, for example, the VA House of Delegates race in the 22nd District:
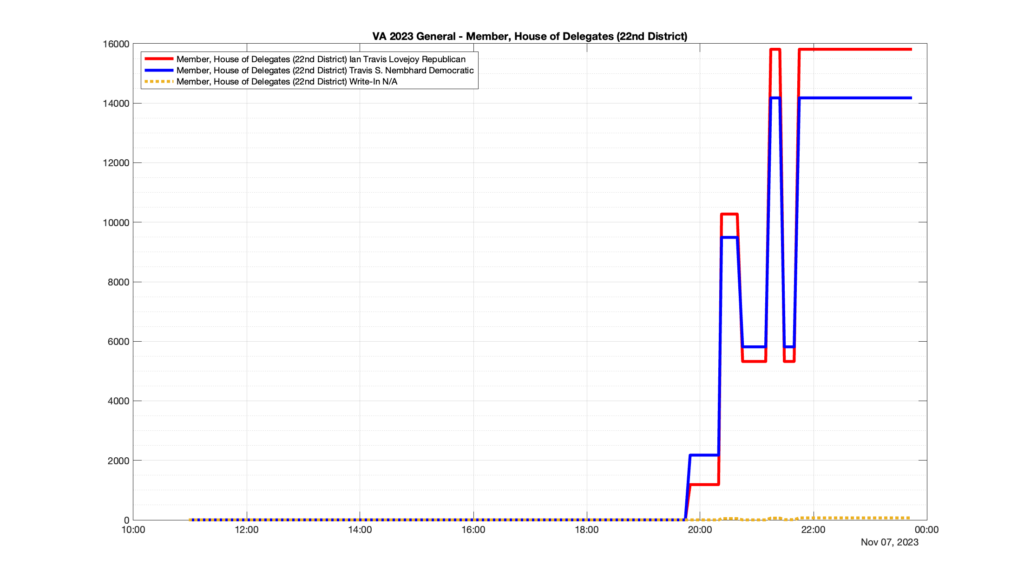
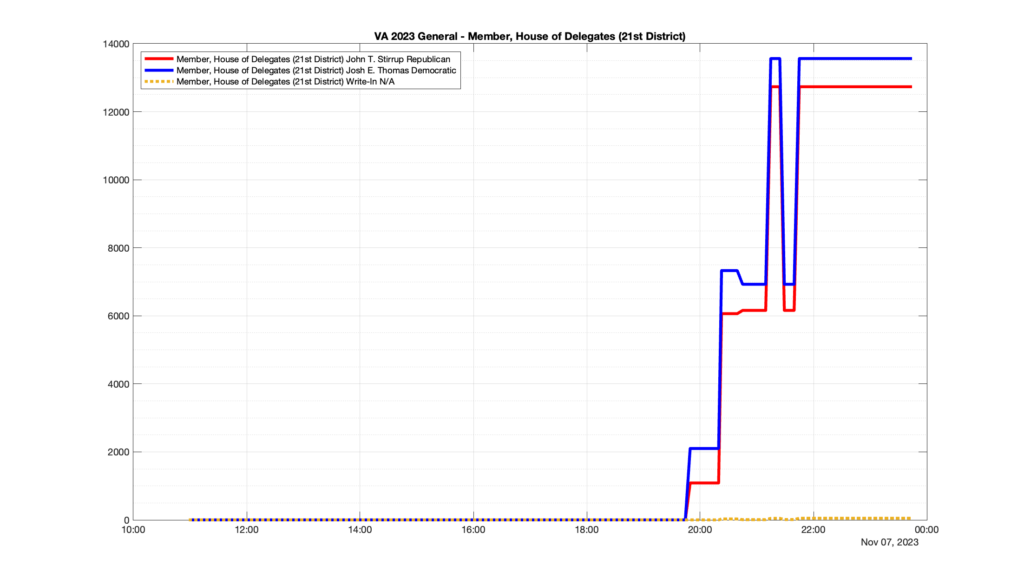
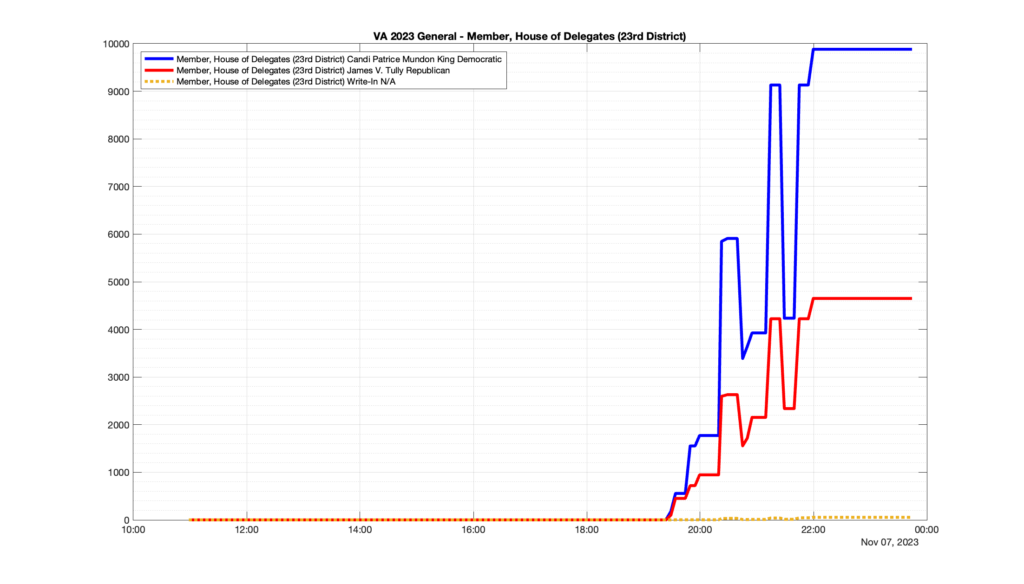
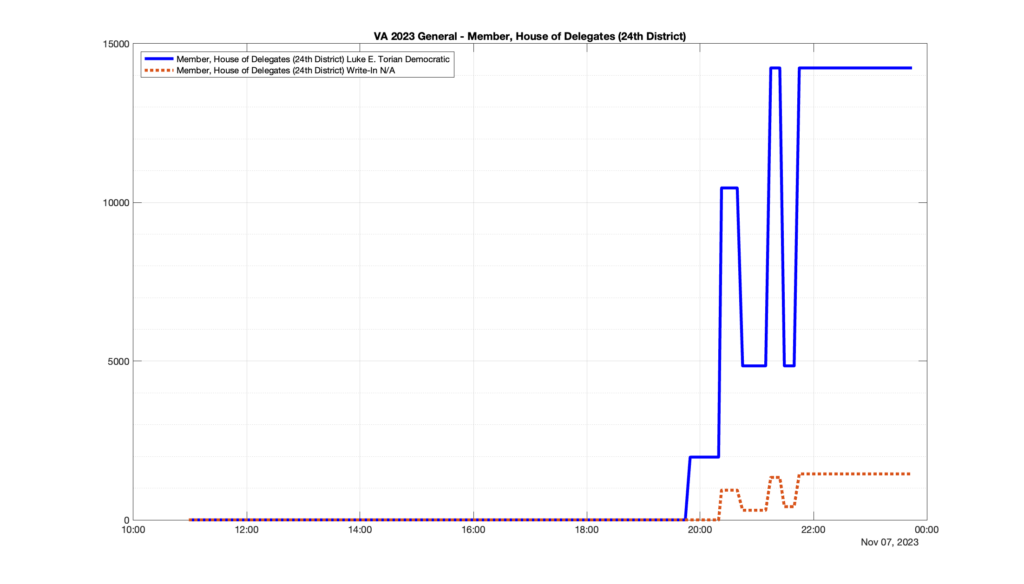
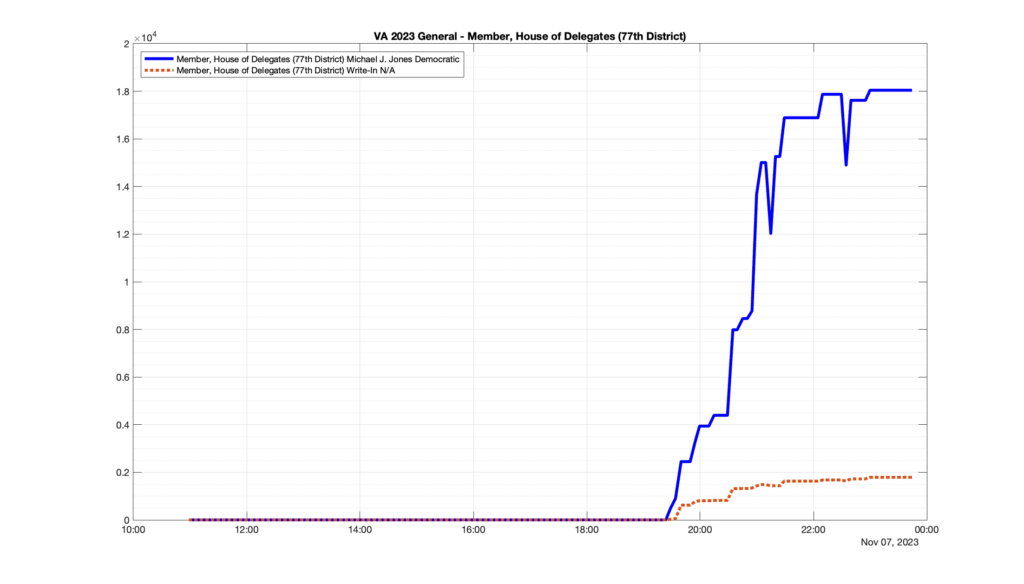
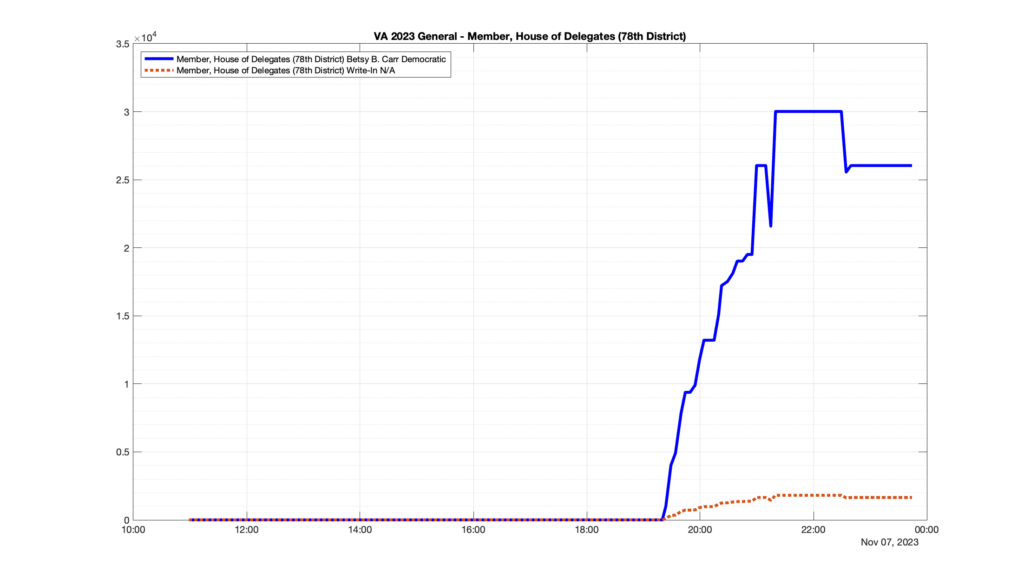
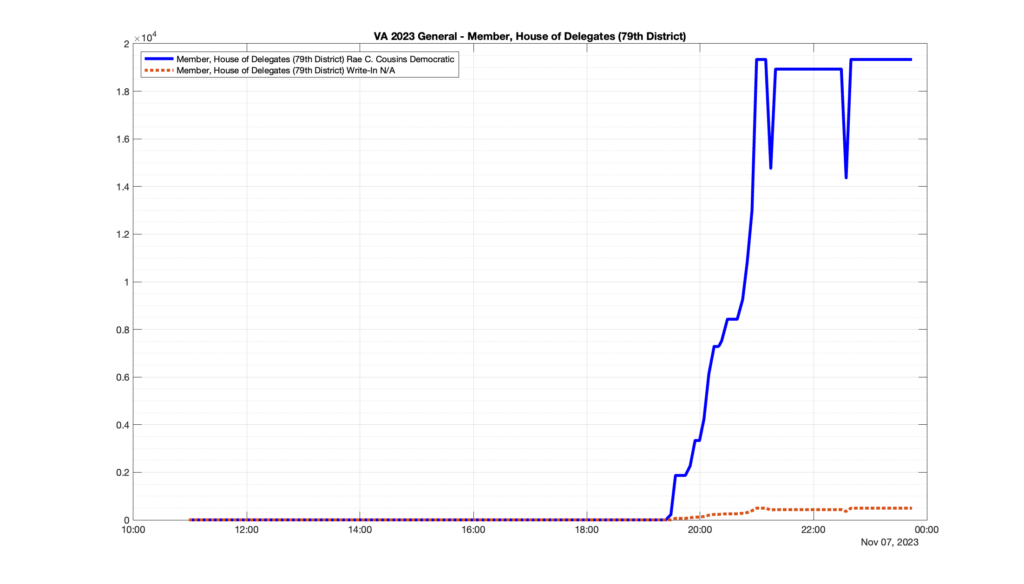
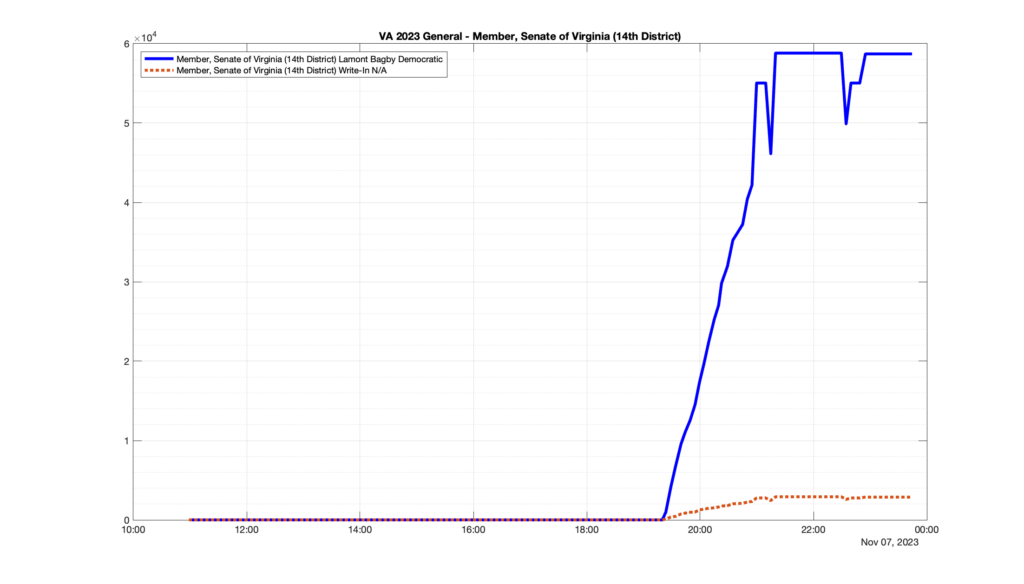
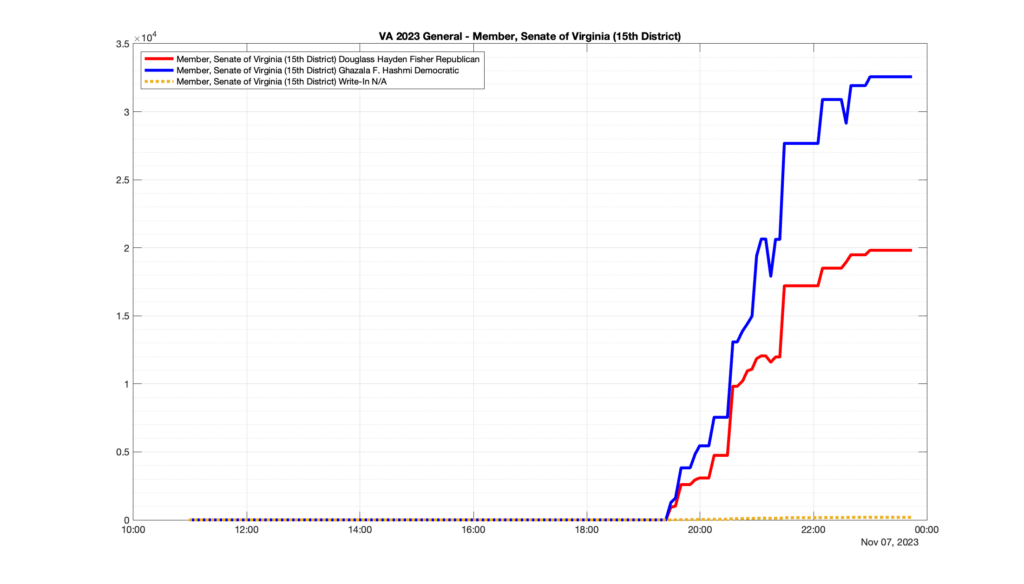
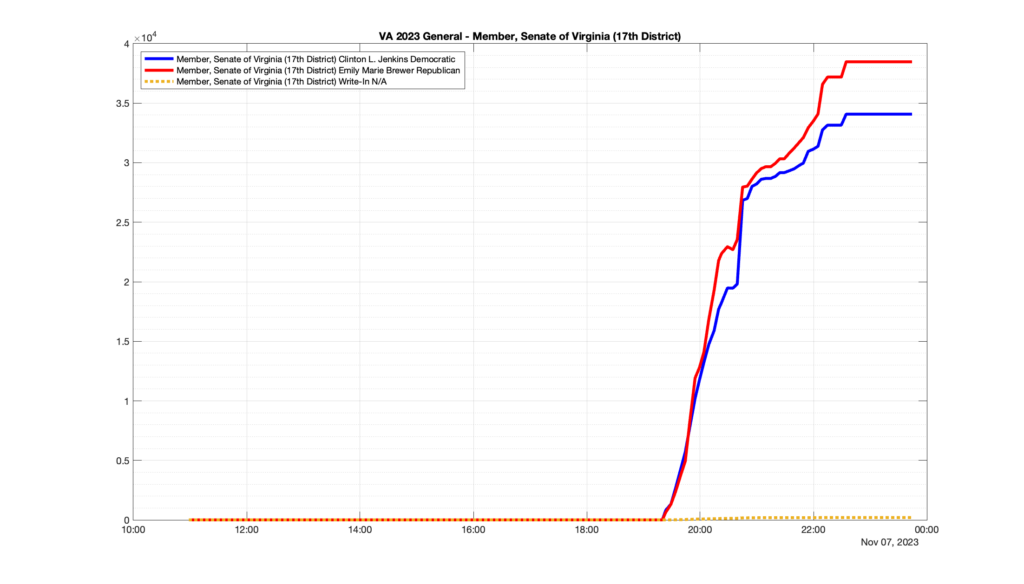
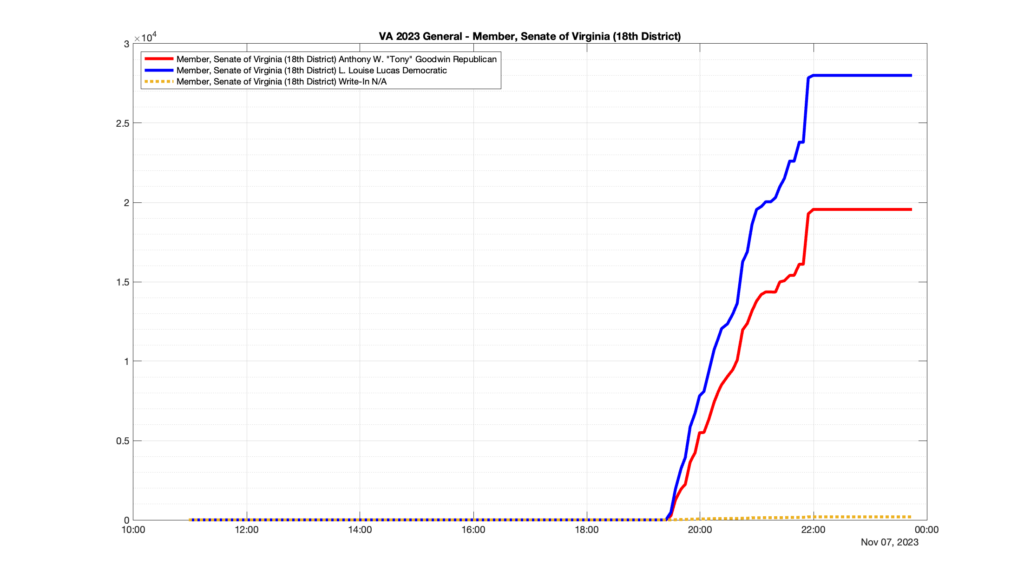
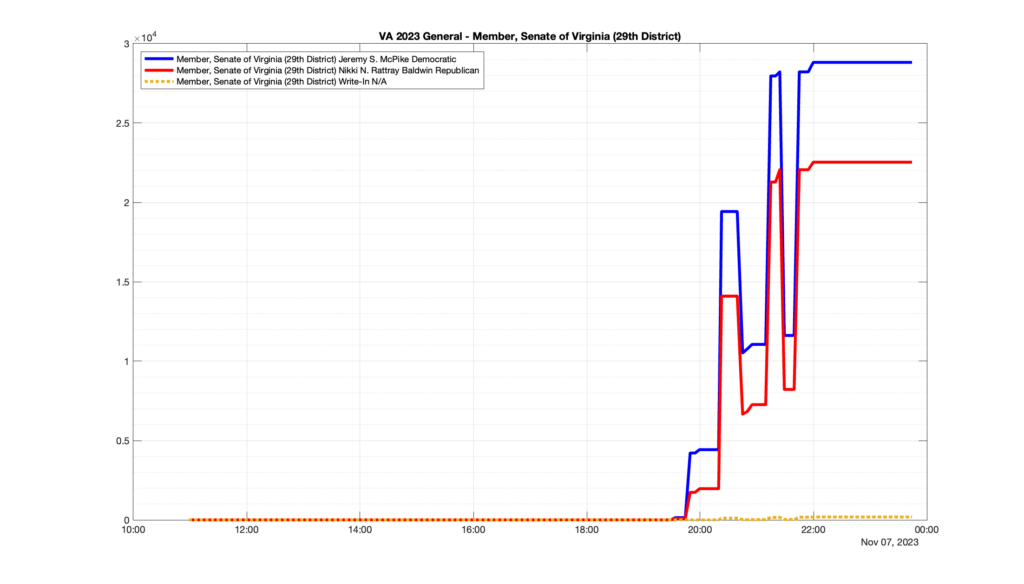
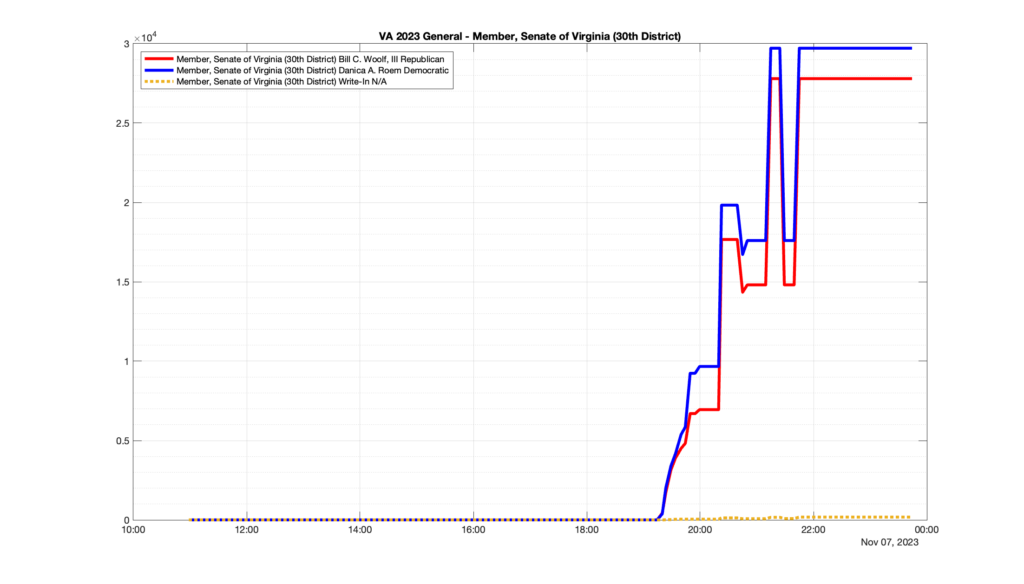
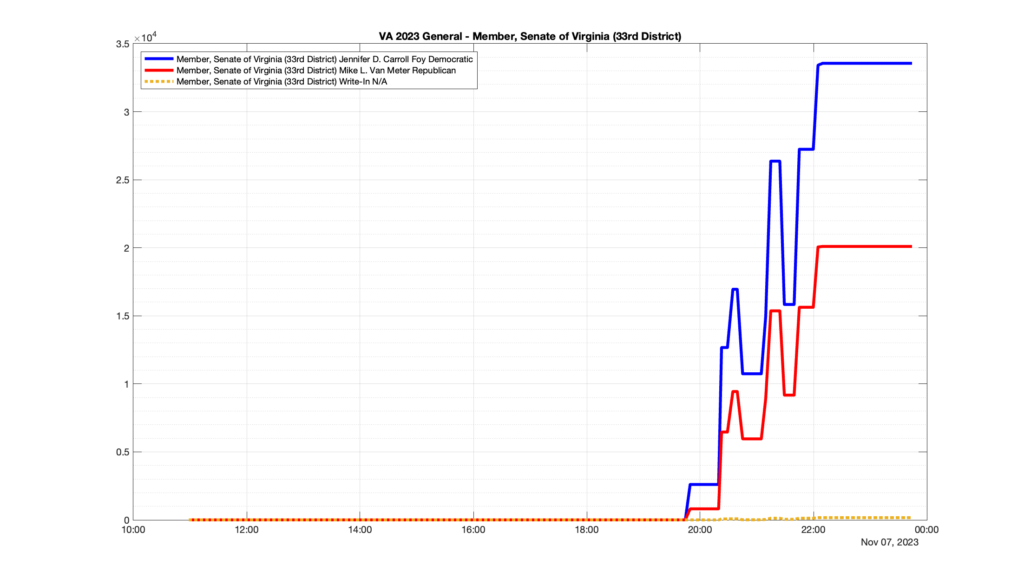
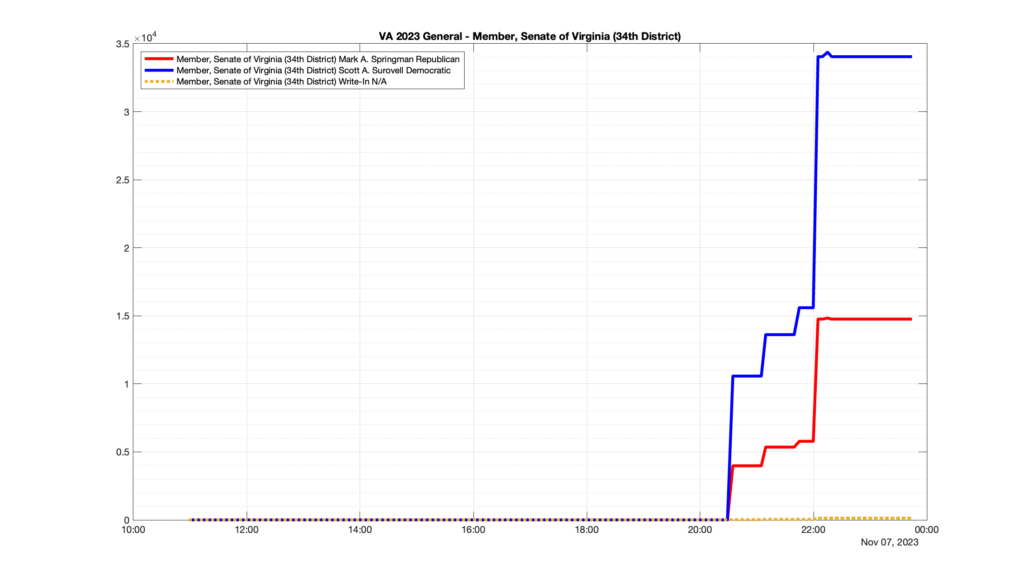
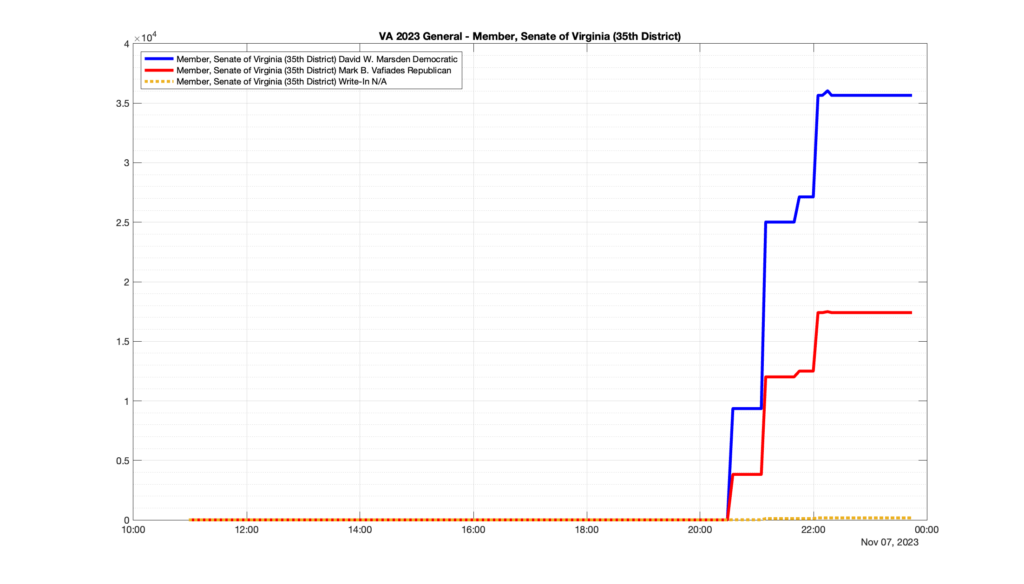
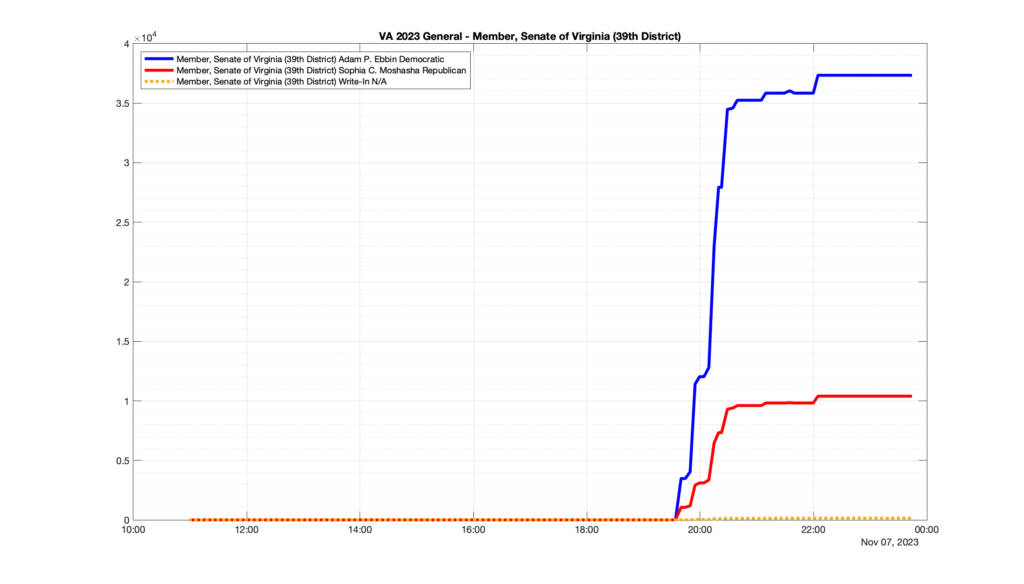
Now … last I checked, when accumulating counts of ballots … you wouldn’t expect the totals to go down, let alone oscillate back and forth.
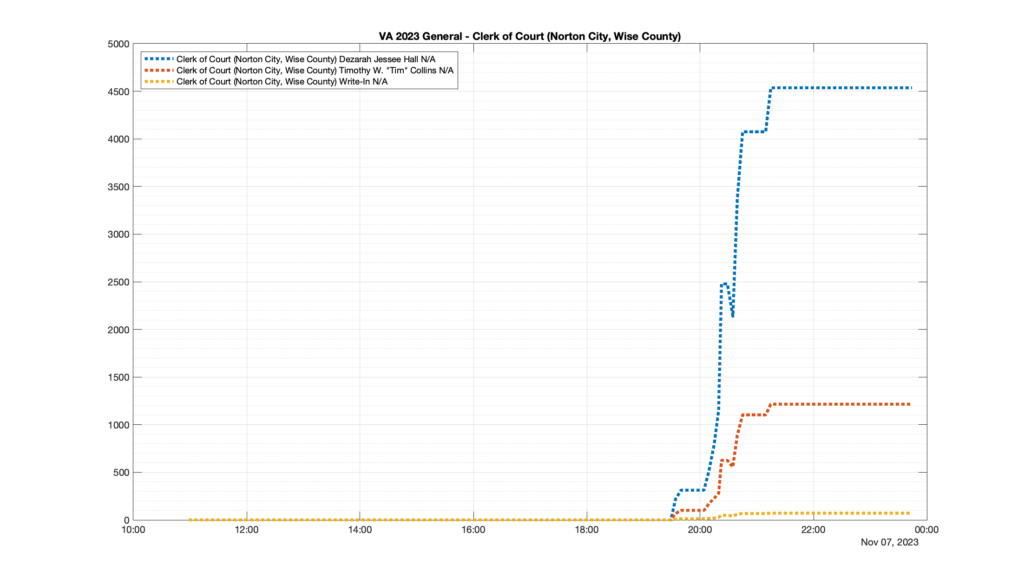
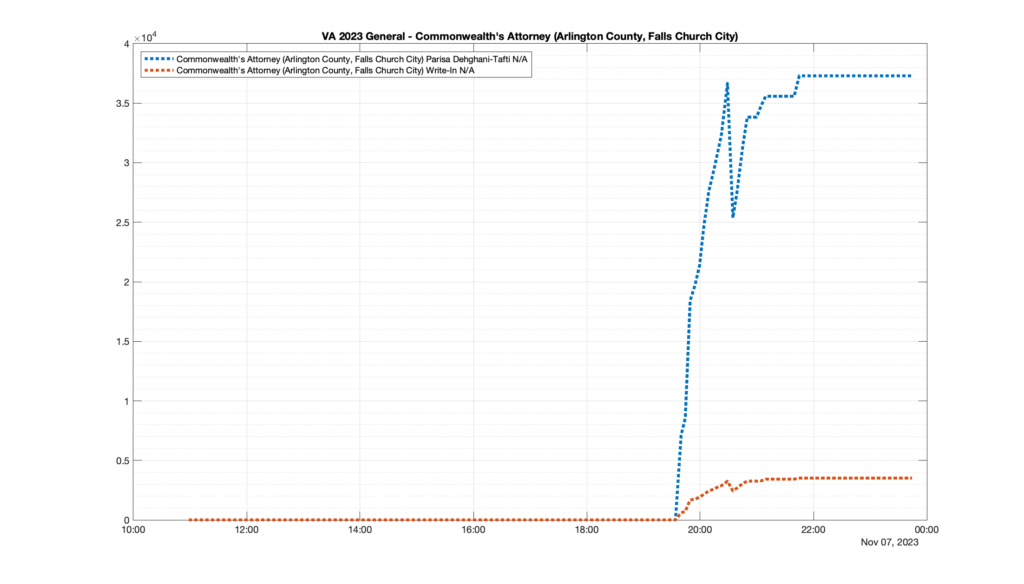
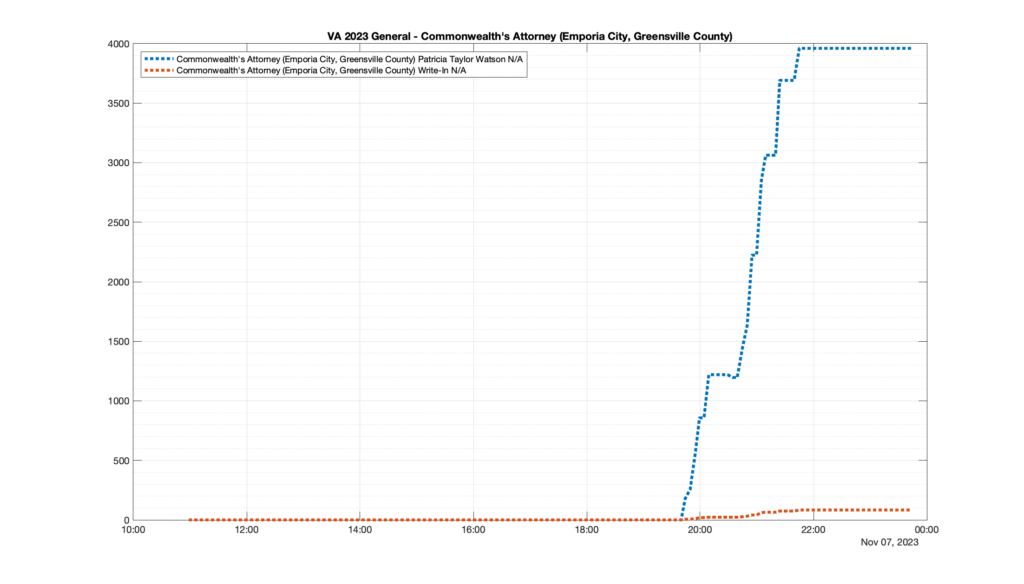
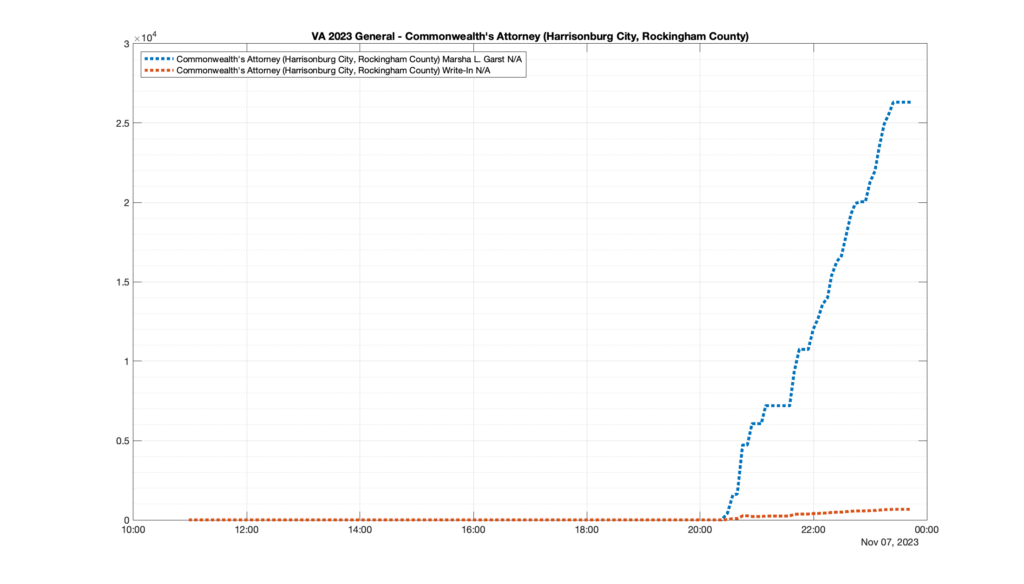
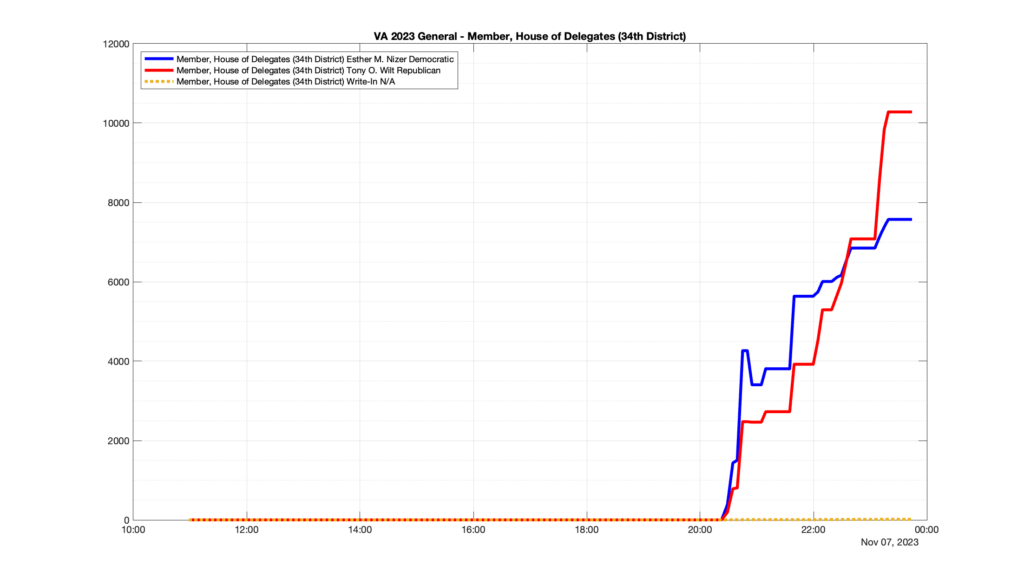
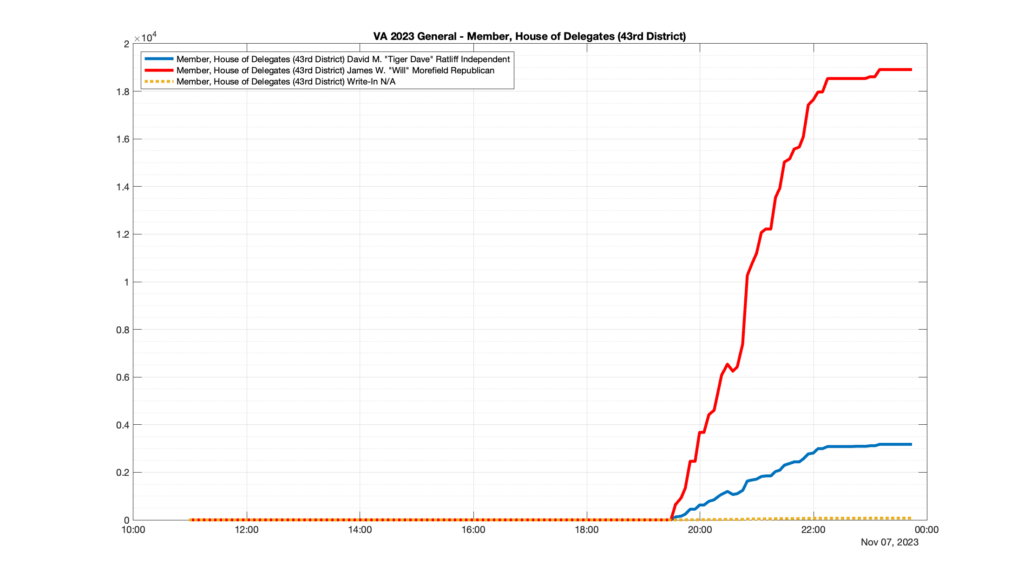
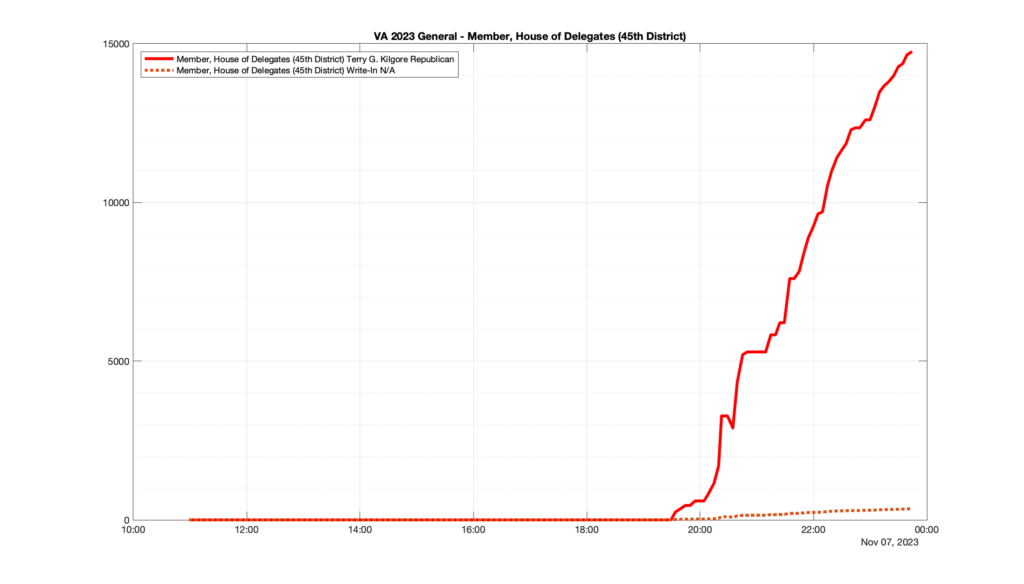
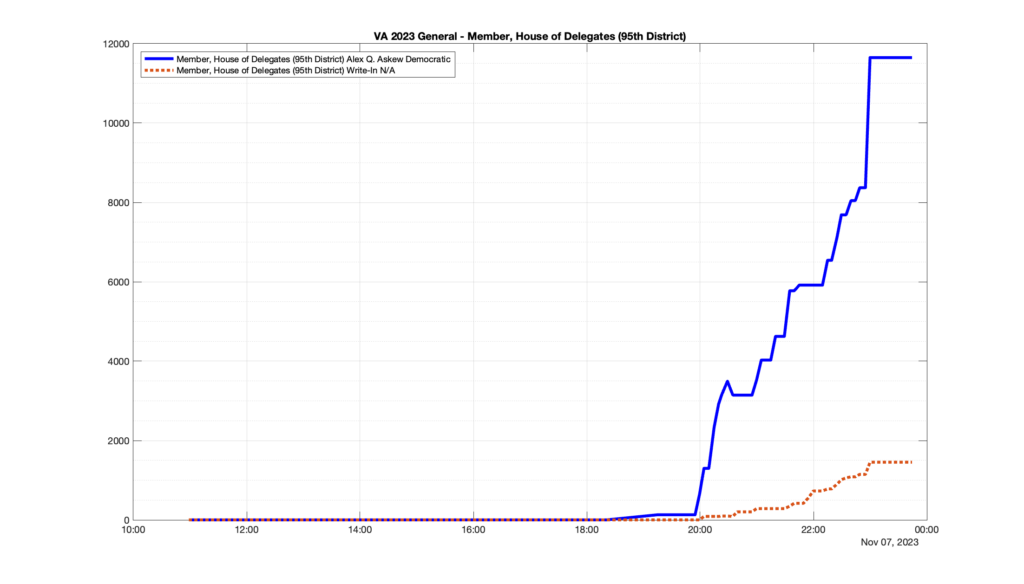
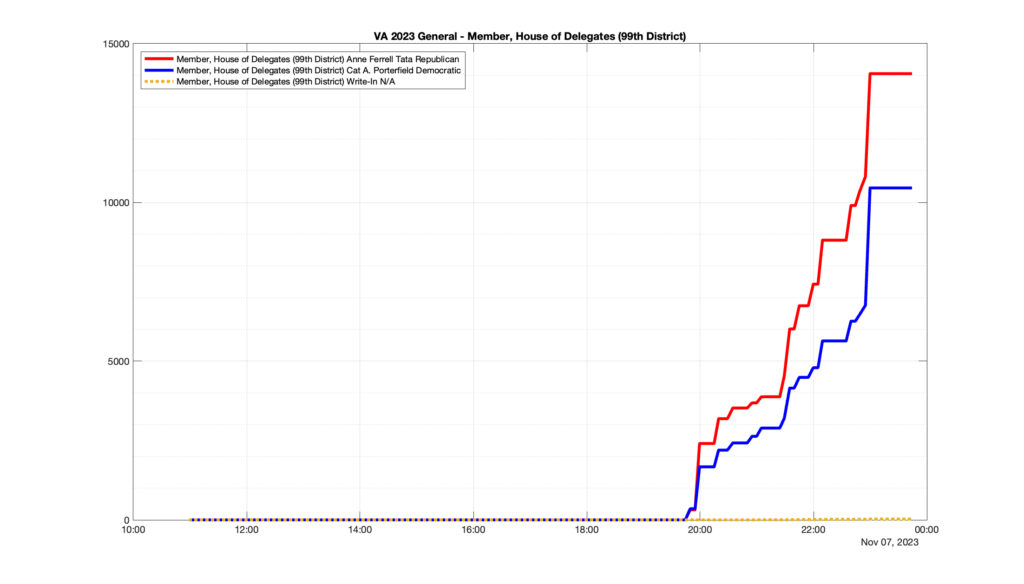
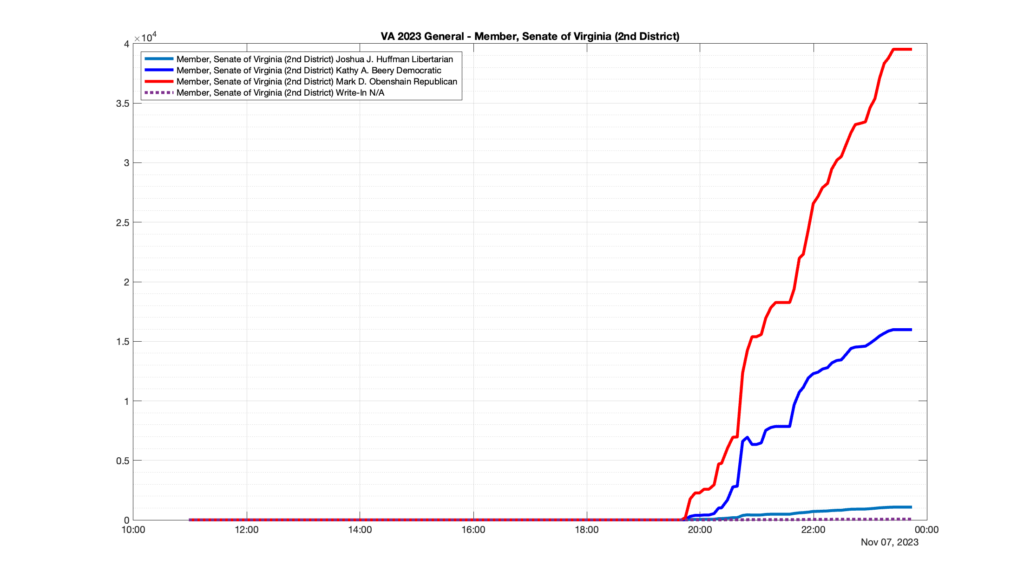
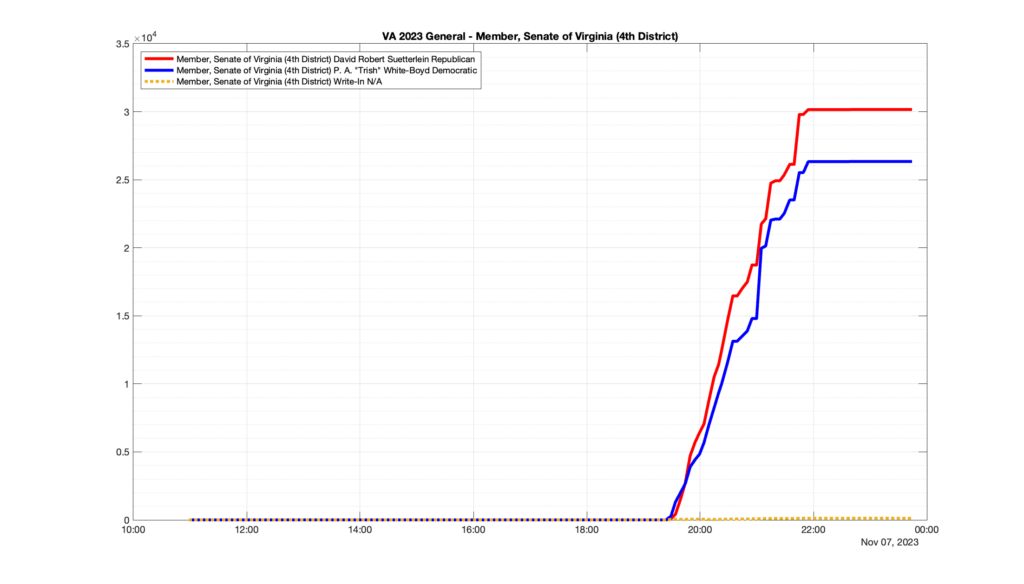
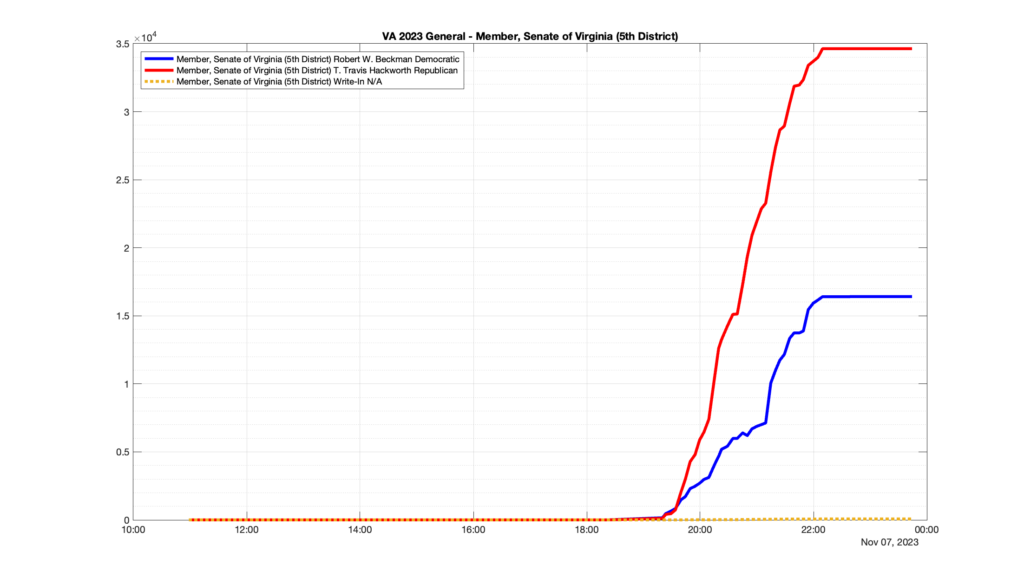
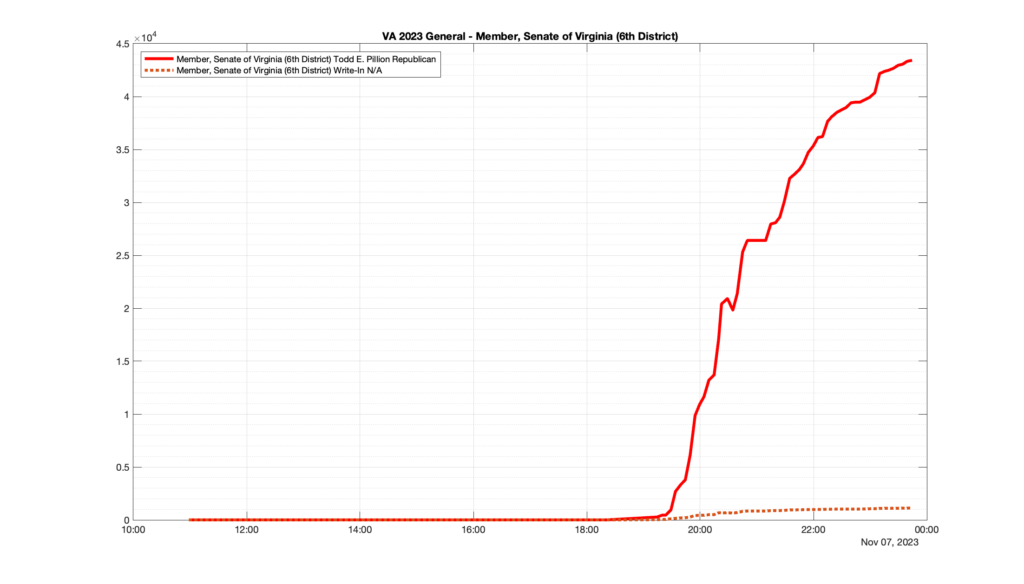
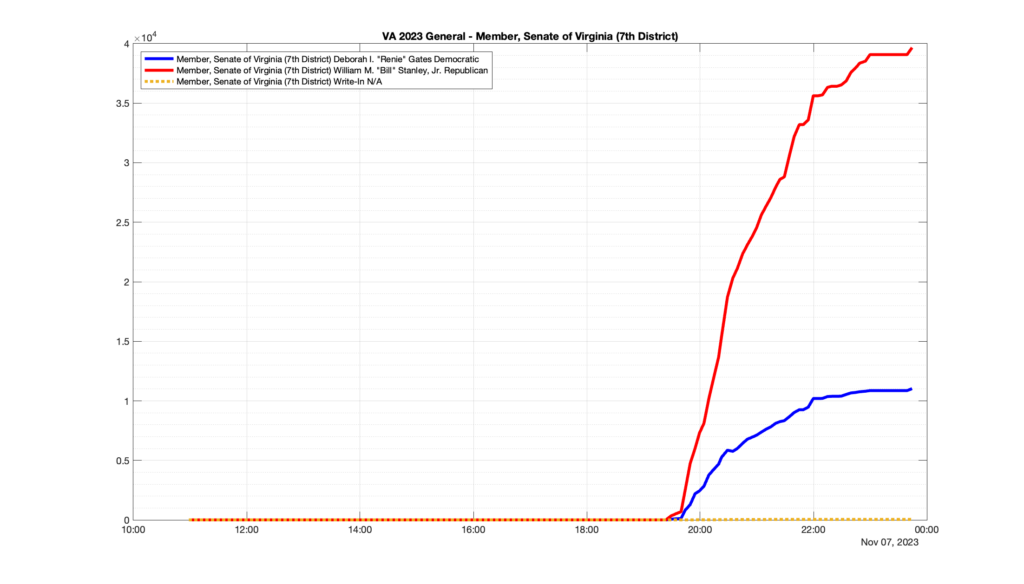
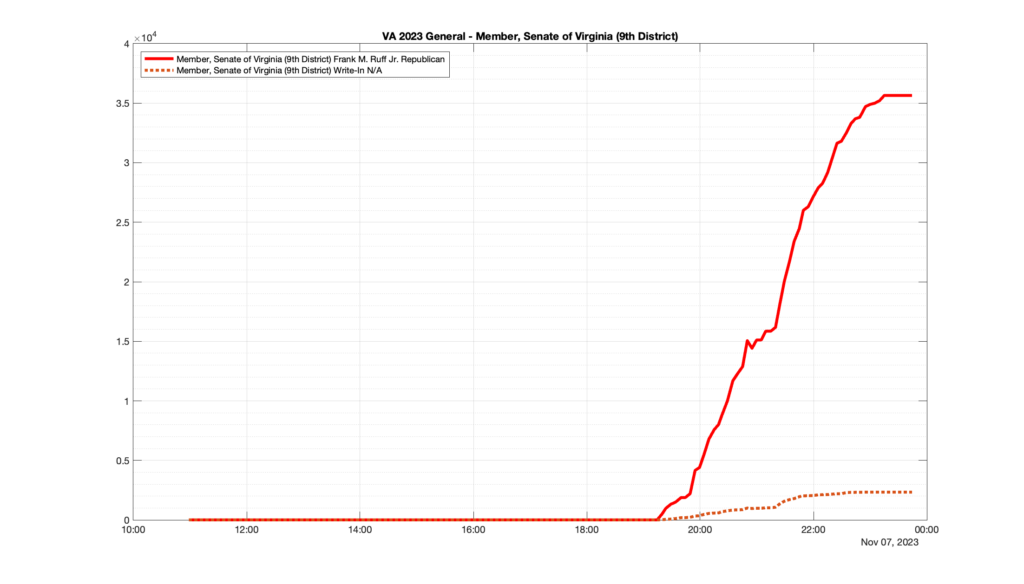
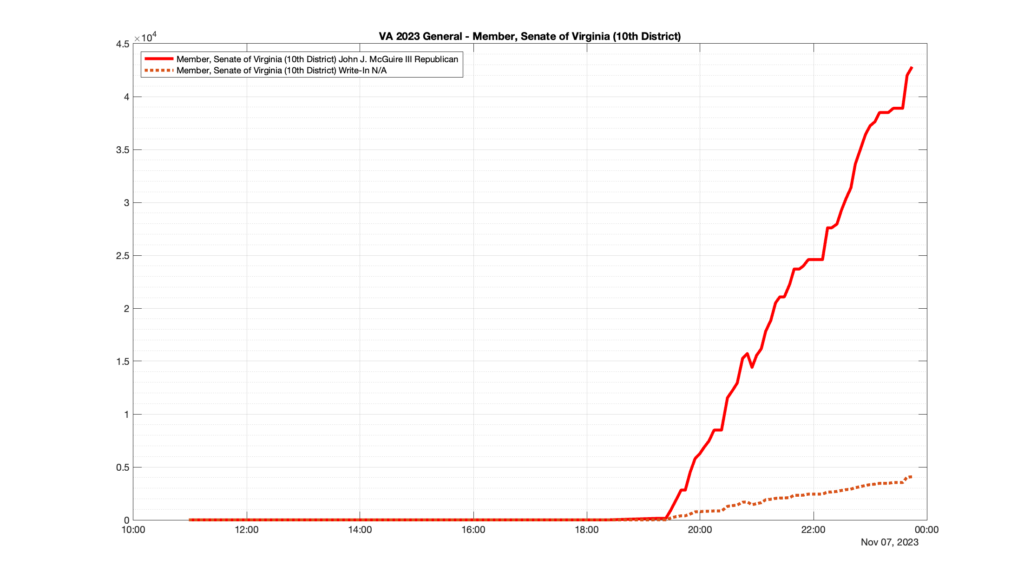
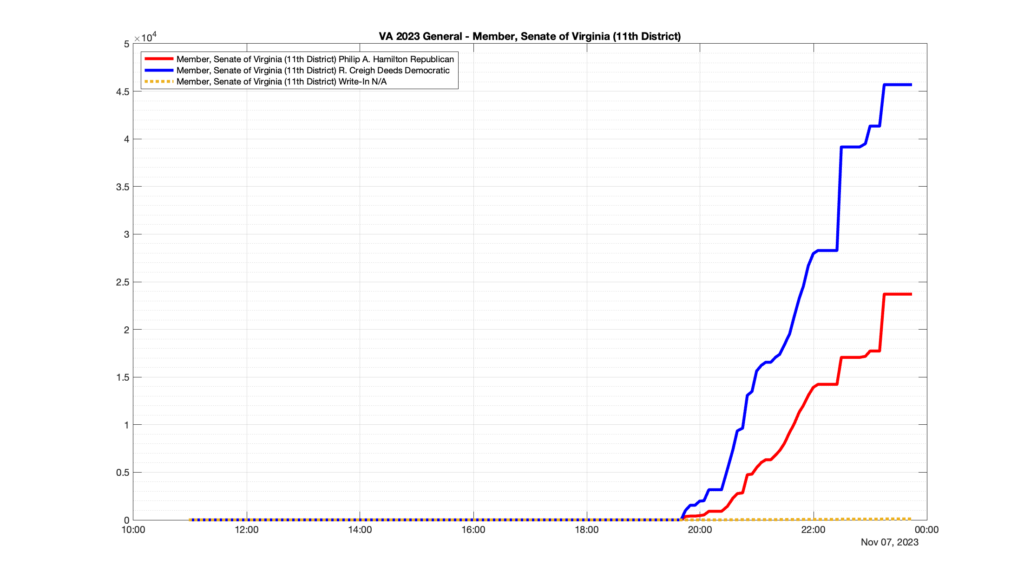
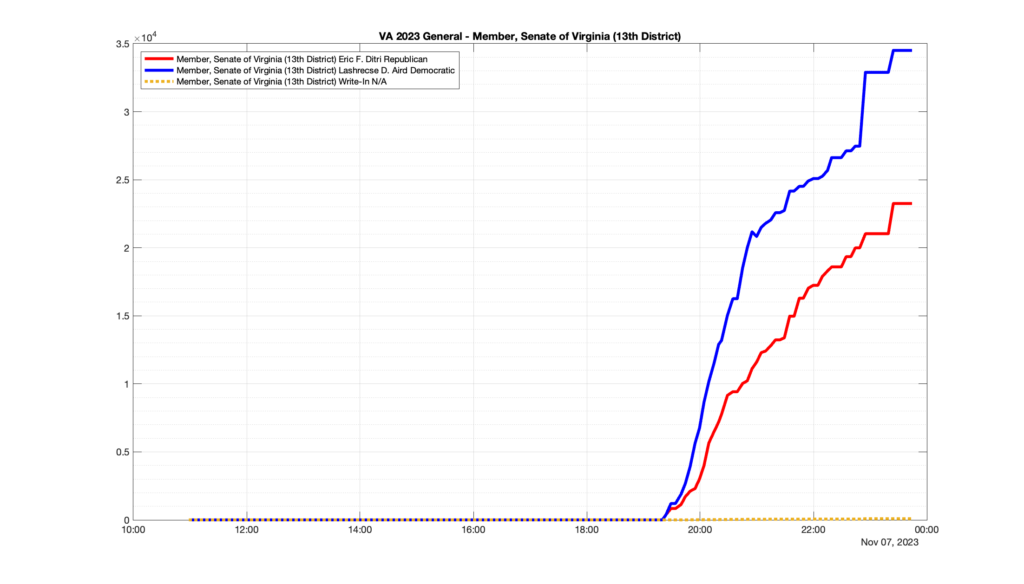
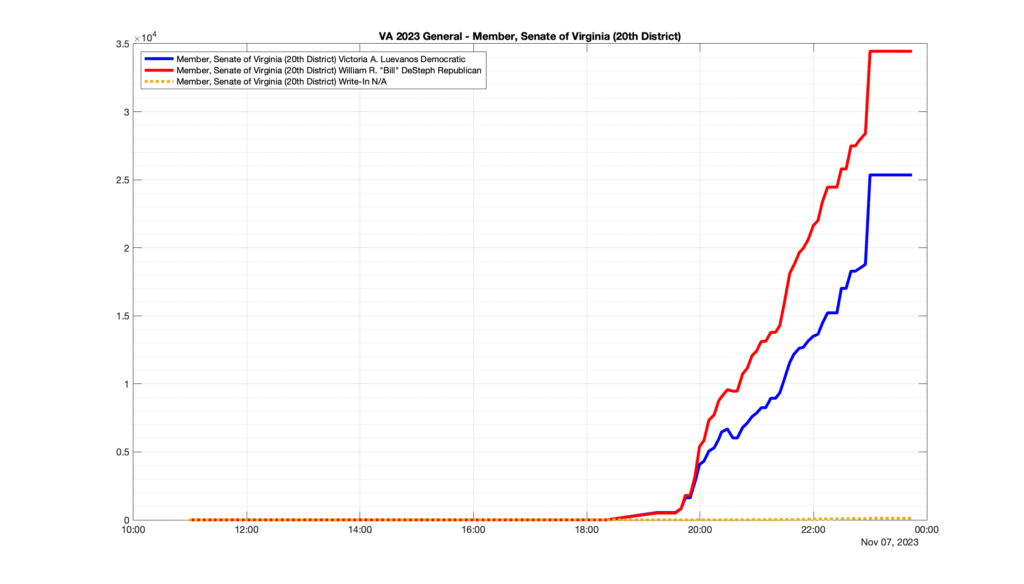
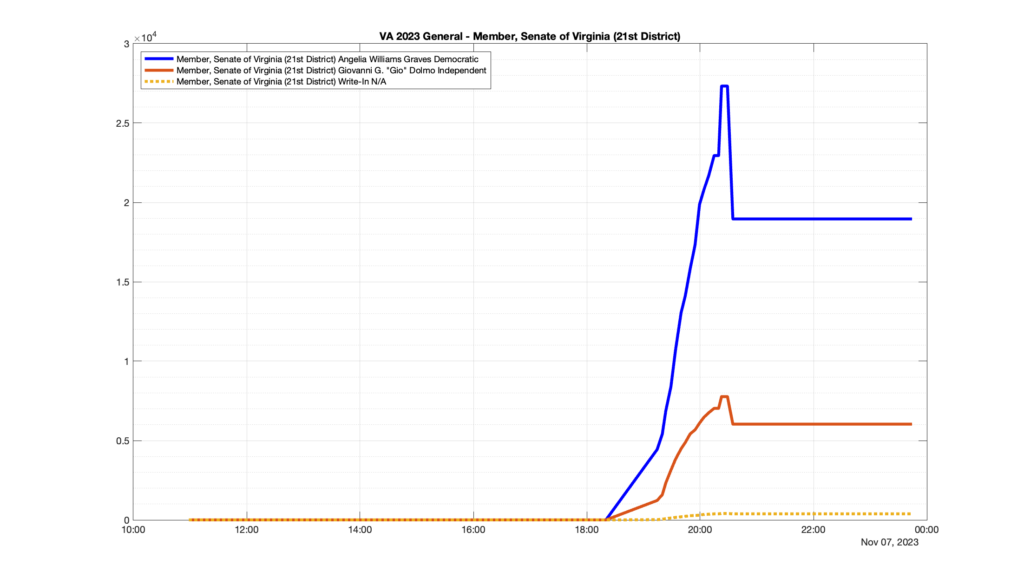
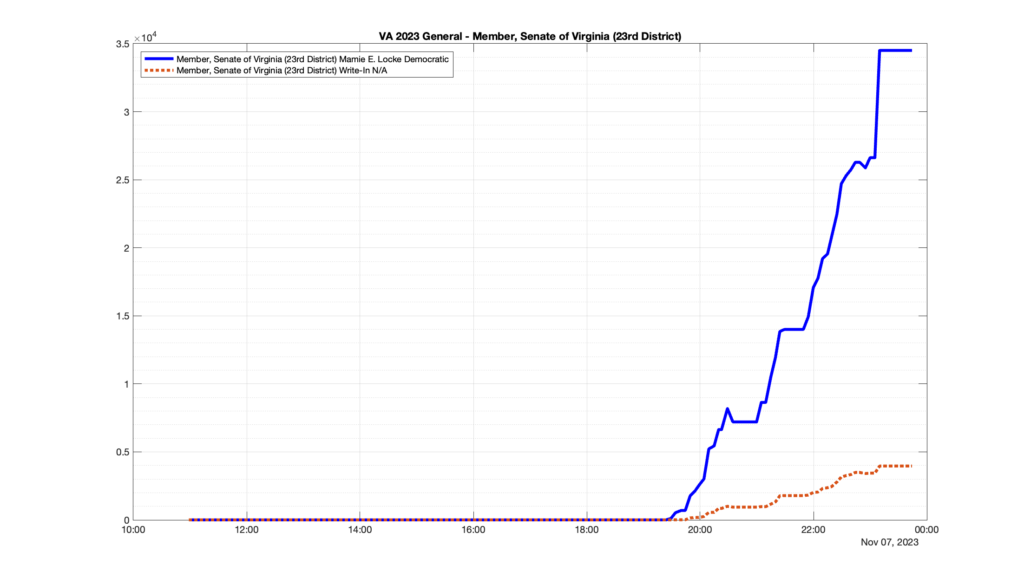
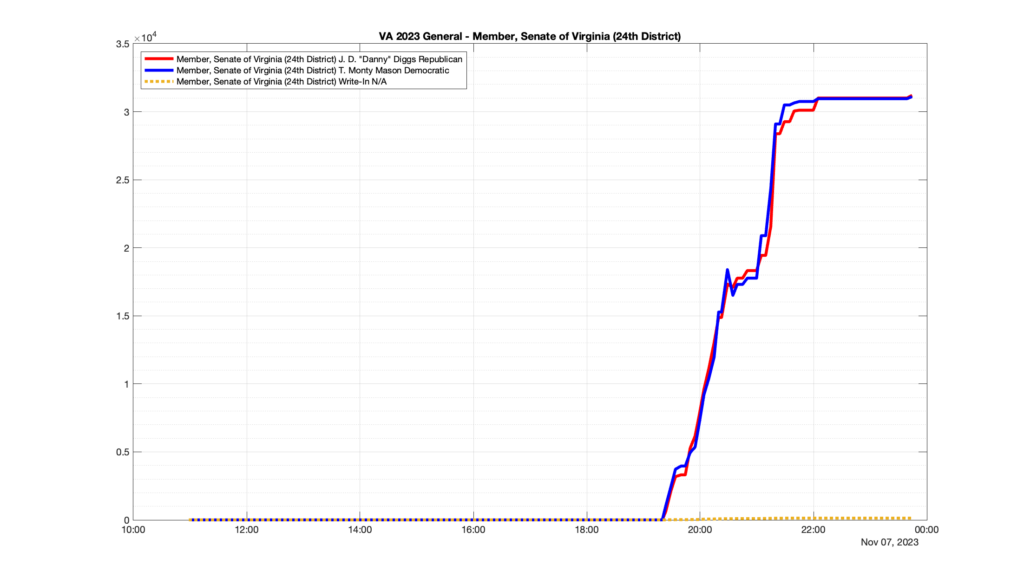
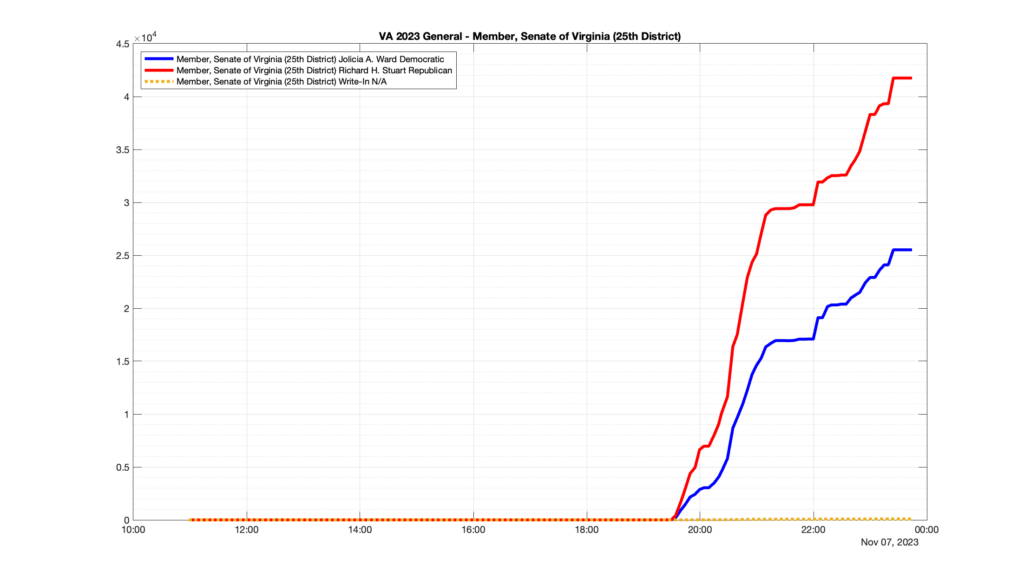
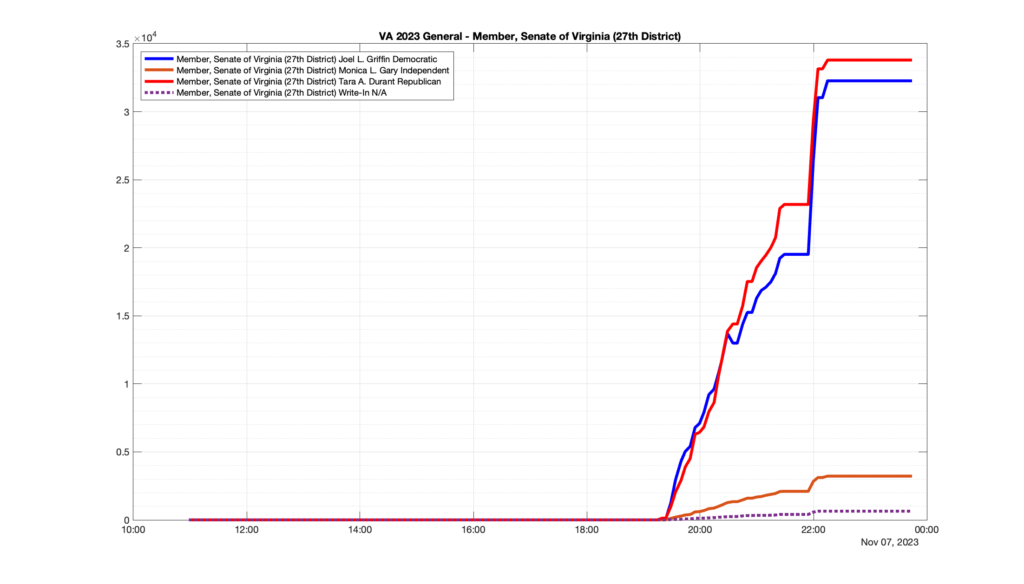
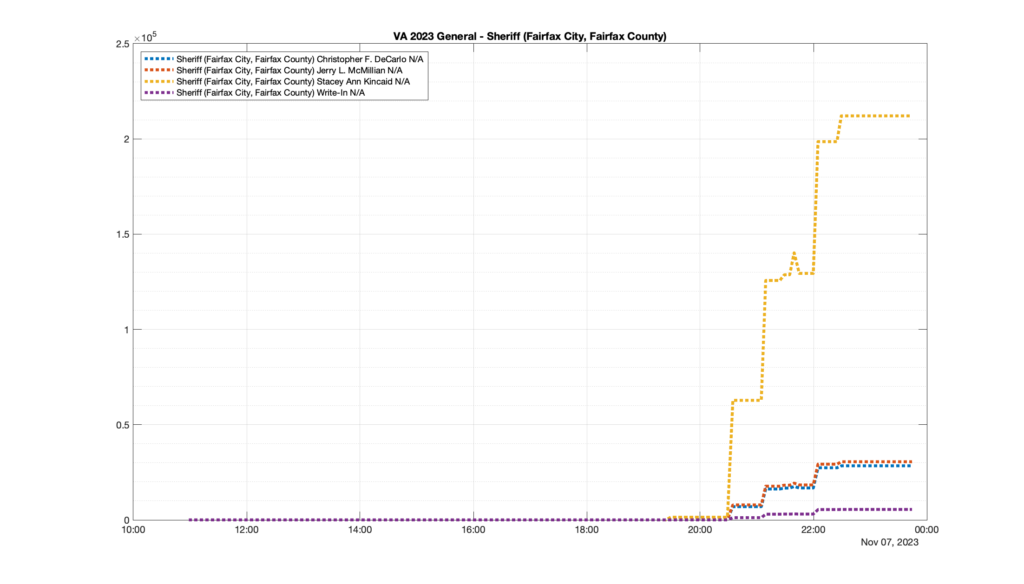
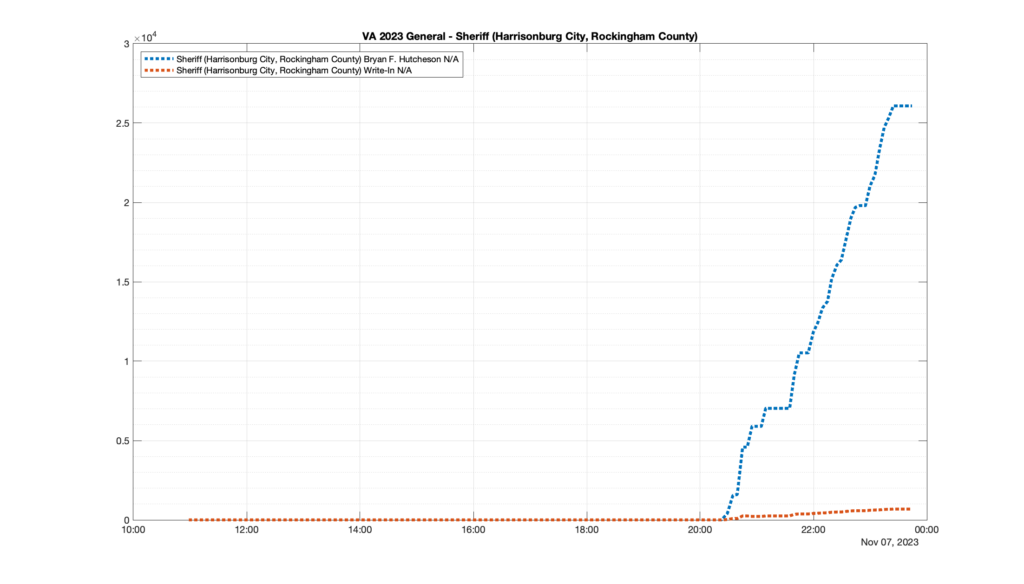
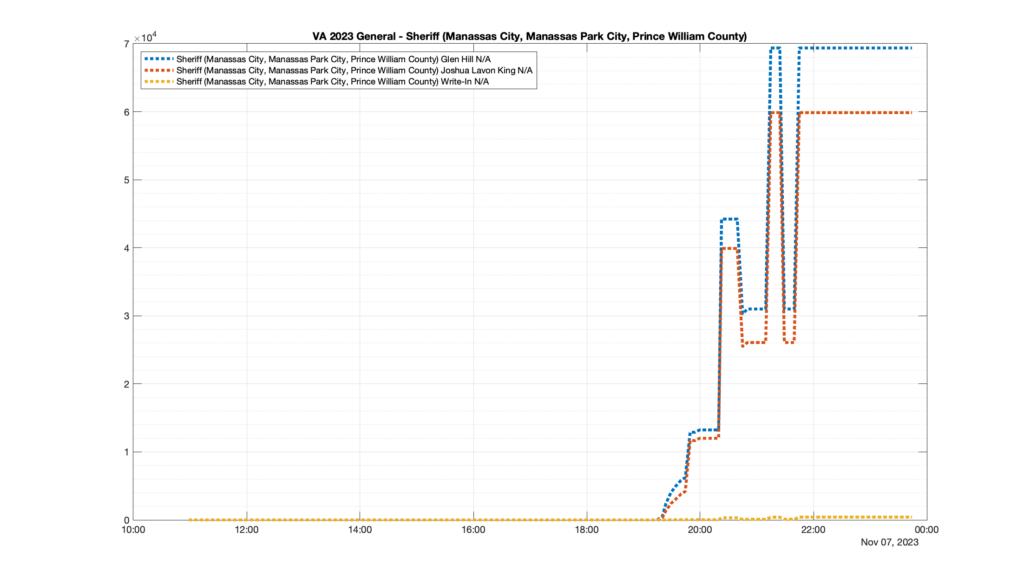
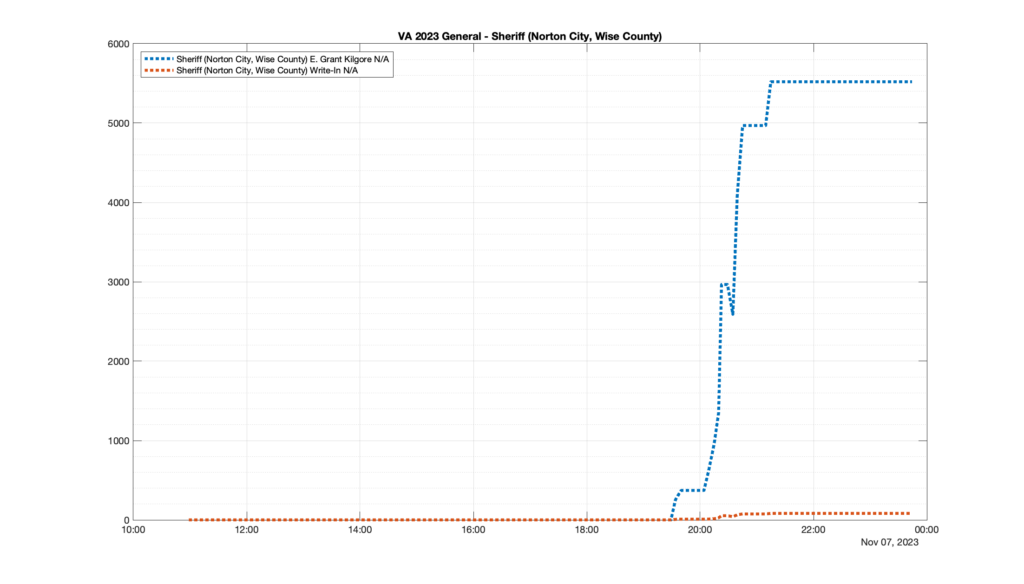
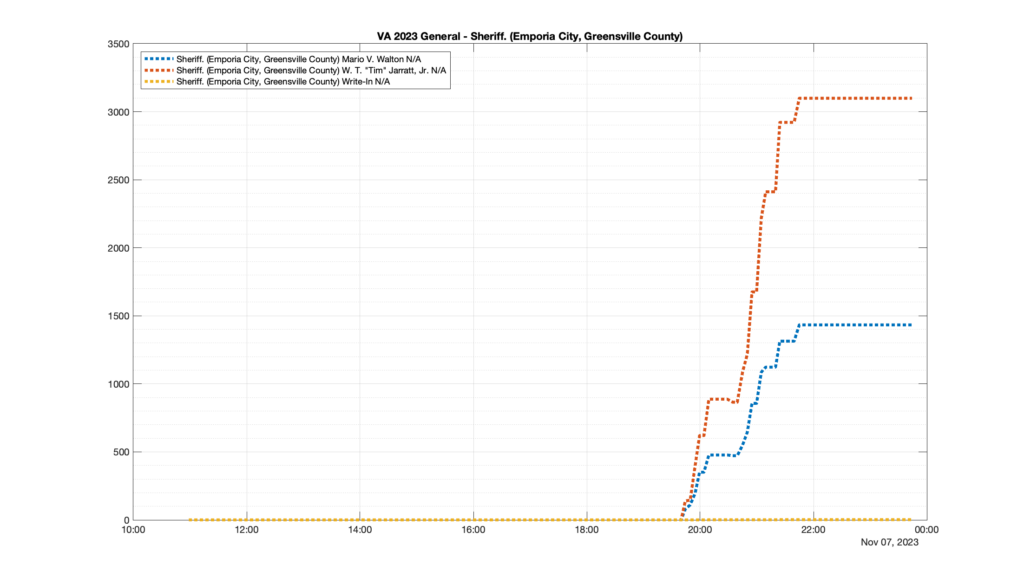
This is not the only race where I found ballot curves that have a decrease in one of the ballot count after a data update. (The gallery is posted below.) Of the 183 races I looked at so far, 79 had a ballot trace that had its count total reduced after a data update. (I haven’t looked at all of the races yet.)
Now, one expects there to be some issues and corrections that have to be made to the election night reporting data. But when 43% of the races sampled have obvious data quality issues like this … I think that deserves some explanation.
So … can ELECT please address this:
- Why do 79 (and counting) races (~43% of races sampled) in the VA election night reporting have obvious issues where the vote totals decreased after a data reporting update?
- What was the cause?
- Why was it not caught by your QA/QC procedures?
- How will you be addressing it going forward?