Below you will find the current summary data and graphics from the 2026 VA June Dem Primary Election Daily Absentee List files. We pull the DAL file everyday and track the count of each specific ballot category in each daily file.
Note: Page may take a moment to load the graphics objects.
Place your cursor over the series name in the legend at right to see the series highlighted in the graphic. Place your cursor over a specific data point to see that data points value.
The logarithmic plot is the same underlying data as the linear scale plot, except with a logarithmic y-scale in order to be able to compress the dynamic range and see the shape of all of the data curves in a single graphic. Place your cursor over the series name in the legend at right to see the series highlighted in the graphic. Place your cursor over a specific data point to see that data points value.
The underlying data for the graphics above is provided in the summary data table.
Additional Data:
Additional CSV datasets stratified by Locality, City, Congressional District, State House District, State Senate District, and Precinct are available here. Please note that you need to give the page time to load before trying to drill down into any of the listed subdirectories, and mobile browsers have shown some issues.
A direct link to a zip file with ALL of the metrics data stratified by Locality, etc is here.
Data column descriptions:
“ISSUED” := Number of DAL file records where BALLOT_STATUS= “ISSUED”
“NOT_ISSUED” := Number of DAL file records where BALLOT_STATUS= “NOT ISSUED”
“PROVISIONAL” := Number of DAL file records where BALLOT_STATUS= “PROVISIONAL” and APP_STATUS=”APPROVED”
“DELETED” := Number of DAL file records where BALLOT_STATUS= “DELETED”
“MARKED” := Number of DAL file records where BALLOT_STATUS= “MARKED” and APP_STATUS=”APPROVED”
“ON_MACHINE” := Number of DAL file records where BALLOT_STATUS= “ON_MACHINE” and APP_STATUS=”APPROVED”
“PRE_PROCESSED” := Number of DAL file records where BALLOT_STATUS= “PRE-PROCESSED” and APP_STATUS=”APPROVED”
“FWAB” := Number of DAL file records where BALLOT_STATUS= “FWAB” and APP_STATUS=”APPROVED”
“MAIL_IN” := The sum of “MARKED” + “PRE_PROCESSED”
“COUNTABLE” := The sum of “PROVISIONAL” + “MARKED” + “PRE_PROCESSED” + “ON_MACHINE” + “FWAB”
“MILITARY” := Number of DAL file records where VOTER_TYPE= “MILITARY”
“OVERSEAS” := Number of DAL file records where VOTER_TYPE= “OVERSEAS”
“TEMPORARY” := Number of DAL file records where VOTER_TYPE= “TEMPORARY”
“MILITARY_COUNTABLE” := Number of DAL file records where VOTER_TYPE= “MILITARY” and where COUNTABLE is True
“OVERSEAS_COUNTABLE” := Number of DAL file records where VOTER_TYPE= “OVERSEAS” and where COUNTABLE is True
“TEMPORARY_COUNTABLE” := Number of DAL file records where VOTER_TYPE= “TEMPORARY” and where COUNTABLE is True
“MILITARY_ISSUED” := Number of DAL file records where APP_STATUS==”Approved”, VOTER_TYPE= “MILITARY” and where BALLOT_STATUS==”ISSUED”
“OVERSEAS_ISSUED” := Number of DAL file records where APP_STATUS==”Approved”, VOTER_TYPE= “OVERSEAS” and where BALLOT_STATUS==”ISSUED”
“TEMPORARY_ISSUED” := Number of DAL file records where APP_STATUS==”Approved”, VOTER_TYPE= “TEMPORARY” and where BALLOT_STATUS==”ISSUED”
“COUNTABLE_HIGH_PROP_NG” := Number of DAL file records where COUNTABLE is True and the registrant has voted in 75% or more of the November General elections on record. (i.e. They have a high November General propensity score)
“COUNTABLE_MED_PROP_NG” := Number of DAL file records where COUNTABLE is True and the registrant has voted in < 75% and > 0% of the November General elections on record.
“COUNTABLE_ZERO_PROP_NG” := Number of DAL file records where COUNTABLE is True and the registrant has never voted in any of the November General elections on record.
All data purchased by Electoral Process Education Corp. (EPEC) from the VA Dept of Elections (ELECT). All processing performed by EPEC.
If you like the work that EPEC is doing, please support us with a donation.
Below you will find the current summary data and graphics from the 2026 VA June Rep Primary Election Daily Absentee List files. We pull the DAL file everyday and track the count of each specific ballot category in each daily file.
Note: Page may take a moment to load the graphics objects.
Place your cursor over the series name in the legend at right to see the series highlighted in the graphic. Place your cursor over a specific data point to see that data points value.
The logarithmic plot is the same underlying data as the linear scale plot, except with a logarithmic y-scale in order to be able to compress the dynamic range and see the shape of all of the data curves in a single graphic. Place your cursor over the series name in the legend at right to see the series highlighted in the graphic. Place your cursor over a specific data point to see that data points value.
The underlying data for the graphics above is provided in the summary data table.
Additional Data:
Additional CSV datasets stratified by Locality, City, Congressional District, State House District, State Senate District, and Precinct are available here. Please note that you need to give the page time to load before trying to drill down into any of the listed subdirectories, and mobile browsers have shown some issues.
A direct link to a zip file with ALL of the metrics data stratified by Locality, etc is here.
Data column descriptions:
“ISSUED” := Number of DAL file records where BALLOT_STATUS= “ISSUED”
“NOT_ISSUED” := Number of DAL file records where BALLOT_STATUS= “NOT ISSUED”
“PROVISIONAL” := Number of DAL file records where BALLOT_STATUS= “PROVISIONAL” and APP_STATUS=”APPROVED”
“DELETED” := Number of DAL file records where BALLOT_STATUS= “DELETED”
“MARKED” := Number of DAL file records where BALLOT_STATUS= “MARKED” and APP_STATUS=”APPROVED”
“ON_MACHINE” := Number of DAL file records where BALLOT_STATUS= “ON_MACHINE” and APP_STATUS=”APPROVED”
“PRE_PROCESSED” := Number of DAL file records where BALLOT_STATUS= “PRE-PROCESSED” and APP_STATUS=”APPROVED”
“FWAB” := Number of DAL file records where BALLOT_STATUS= “FWAB” and APP_STATUS=”APPROVED”
“MAIL_IN” := The sum of “MARKED” + “PRE_PROCESSED”
“COUNTABLE” := The sum of “PROVISIONAL” + “MARKED” + “PRE_PROCESSED” + “ON_MACHINE” + “FWAB”
“MILITARY” := Number of DAL file records where VOTER_TYPE= “MILITARY”
“OVERSEAS” := Number of DAL file records where VOTER_TYPE= “OVERSEAS”
“TEMPORARY” := Number of DAL file records where VOTER_TYPE= “TEMPORARY”
“MILITARY_COUNTABLE” := Number of DAL file records where VOTER_TYPE= “MILITARY” and where COUNTABLE is True
“OVERSEAS_COUNTABLE” := Number of DAL file records where VOTER_TYPE= “OVERSEAS” and where COUNTABLE is True
“TEMPORARY_COUNTABLE” := Number of DAL file records where VOTER_TYPE= “TEMPORARY” and where COUNTABLE is True
“MILITARY_ISSUED” := Number of DAL file records where APP_STATUS==”Approved”, VOTER_TYPE= “MILITARY” and where BALLOT_STATUS==”ISSUED”
“OVERSEAS_ISSUED” := Number of DAL file records where APP_STATUS==”Approved”, VOTER_TYPE= “OVERSEAS” and where BALLOT_STATUS==”ISSUED”
“TEMPORARY_ISSUED” := Number of DAL file records where APP_STATUS==”Approved”, VOTER_TYPE= “TEMPORARY” and where BALLOT_STATUS==”ISSUED”
“COUNTABLE_HIGH_PROP_NG” := Number of DAL file records where COUNTABLE is True and the registrant has voted in 75% or more of the November General elections on record. (i.e. They have a high November General propensity score)
“COUNTABLE_MED_PROP_NG” := Number of DAL file records where COUNTABLE is True and the registrant has voted in < 75% and > 0% of the November General elections on record.
“COUNTABLE_ZERO_PROP_NG” := Number of DAL file records where COUNTABLE is True and the registrant has never voted in any of the November General elections on record.
All data purchased by Electoral Process Education Corp. (EPEC) from the VA Dept of Elections (ELECT). All processing performed by EPEC.
If you like the work that EPEC is doing, please support us with a donation.
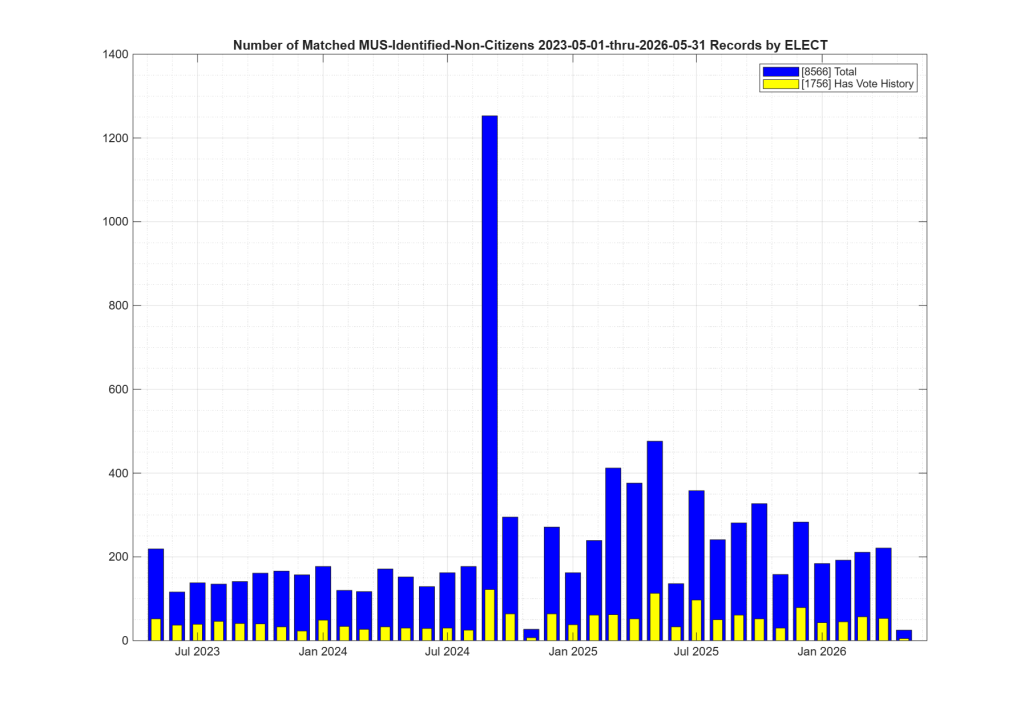
Using data provided by the VA Department of Elections (“ELECT”), we have identified at least 8,566 unique registrations that were self-identified as “Declared NonCitizen” and removed from the voter rolls since May of 2023.
Of those 8,566 removals of self-declared noncitizens — which Virginia’s constitution prohibits from registering and voting, we see 1,756 registrations with a corresponding record of ballots cast, according to the statewide Voter History List (VHL) record.
As of February of 2019, that brings the number of ballots cast by declared noncitizens to 6,111, according to official records. Those are the records we know about.
In addition, the Daily Absentee List (DAL) data of Virginia’s 45-day early voting period shows an additional ten (10) noncitizen registrations and ballots — none of which are found in the Voter History List (VHL), the final tally of who voted.
Therefore, we see 6,121 illegal ballots cast by self-identified noncitizens, from 1,766 registrants who were removed from the voting rolls after self-declaring themselves as ineligible noncitizens. That’s according to the official Voter History List (VHL) and early voting data found in the Daily Absentee List (DAL) reports.
Voting as an ineligible individual is a Class 6 felony voting violation in Virginia.
Background on non-removal policy
After our initial post on this topic in March 2024, we submitted all of the relevant information for investigation to then-Attorney General, Jayson Miyares (R).
We did not hear back, nor did we receive any response or update on the matter. We are not aware of any action by the AG’s office on these apparent violations since 2024.
At the time in 2024, the Arlington County Electoral Board undertook its own investigation and voted 3-0 to send the information to the AG’s office as well. Fairfax County’s Electoral Board also issued a new policy on referring noncitizens with voting records to the Commonwealth Attorney. The policy stated:
“The General Registrar shall refer all individuals who were removed from the voter rolls pursuant to Va. Code § 24.2-427(C), after being identified by ELECT as noncitizens, to the Commonwealth’s Attorney and the Attorney General to determine if they have violated Virginia elections law.”
In October 2024, during early voting for the presidential election, the League of Women Voters along with the Biden Department of Justice sued VA, asking for an injunction to place approximately 1,600 removed noncitizen registrations back on the voter rolls. After two lower courts granted the injunction, the U.S. Supreme Court stayed the case, and the noncitizen removals proceeded as the litigation played out.
It is EPEC’s opinion that the Commonwealth of VA was correctly applying the National Voter Registration Act (NVRA) in this matter under the Youngkin administration and AG Miyares, as I detailed in an X.com post on Oct 12.
In 2025, the incoming Trump DOJ dropped the Biden DOJ’s lawsuit against VA; the League of Women Voters continued the litigation.
In April of 2026, Virginia’s Democrat Attorney General Jay Jones issued an advisory opinion to the Department of Elections that effectively adopts the same position of the challengers in the Biden DOJ / LWV lawsuit.
ELECT followed this advisory opinion with guidance to registrars instructing them not to remove any noncitizen voters within the NVRA’s 90-day “quiet period” around any federal election, including primaries.
As of May 6th 2026, ELECT is no longer populating noncitizen data into “hoppers” that are used to notify Commonwealth registrars of tasks that require their action.
Instead, ELECT has instructed registrars to change the categorization of existing flagged items in the hopper from “notify voter” to “needs research.”
See Jones’ April 16, 2026 letter to VA Commissioner of Elections Steven Koski here.
We believe this interpretation is impacting the number of self-identified noncitizens that are removed and reflected in the Monthly Update Service (MUS). We have already seen an order of magnitude difference in the data since June 1, 2026, which covers the May time-period in the new policy.
Voter-List Maintenance Obligations:
As part of its responsibilities under law, the VA Department of Elections is required to identify and remove invalid or out-of-date registration records from the voter rolls.
One situation for removal is when a registrant has been determined (via self identification) to be a noncitizen. The VA Constitution prohibits noncitizens from voting in VA elections.
“In elections by the people, the qualifications of voters shall be as follows: Each voter shall be a citizen of the United States, shall be eighteen years of age, shall fulfill the residence requirements set forth in this section, and shall be registered to vote pursuant to this article. …” VA Constitution, Article II, Section 1. https://law.lis.virginia.gov/constitution/article2/section1/
Additionally, according to VA Code Section 24.2-1004, the act of knowingly casting a ballot by someone who is not eligible to vote is a Class 6 felony.
EPEC’s Analysis Methodology:
ELECT makes available for purchase by qualifying parties various data sets, including the registered voter list (RVL) and the Voter History List (VHL).
Additionally, ELECT provides a Monthly Update Service (MUS) subscription that contains (almost) all of the Voter List changes and transactions for the previous period.
The MUS datasets carry an “NVRAReasonCode” field that is associated with each transaction that gives the reason for the update or change in the voter record. This is in accordance with disclosure and transparency requirements in the National Voter Registration Act (NVRA).
One of the reason codes for records that are removed is “Declared Non-Citizen.”
EPEC has been purchasing and archiving these official records as part of our nonprofit mission to document and educate the public about elections processes, and drive voter participation.
If you are interested in supporting this work, please head on over to our donation page, or to our give-send-go campaign to make a tax-deductible donation.
EPEC looked at the number of records associated with unique voter identification numbers identified for removal from the voter record due to non-citizenship status, per entries in the monthly updates (MUS).
We correlated those results with our accumulated Voter History List (VHL) information to determine whether noncitizen registrations had corresponding records of ballots cast in previous elections.
We only considered those records that are currently in a non-active state as of the latest MUS transaction log. Some determinations of non-citizenship status in the historical MUS transaction log might have been due to error and subsequently corrected and reinstated to active status.
Important to note: We are not considering those records that had a “Declared Non-Citizen” disqualification, but were subsequently reinstated and reactivated by ELECT.
Other Gaps to Note:
While EPEC has periodically purchased full copies of the Voter History List for our archives, there is a known issue with the way ELECT handles removals from the voter record that can cause sampling issues — depending on the time the VHL file is purchased. The result: Records of some legitimately cast ballots can be missing from the VHL due to this policy.
Namely, when ELECT removes an ineligible voter from the voter list, it also removes all instances of that registration’s voter ID from its voter history information and other data files that it provides to qualified organizations. (In my opinion, that process eliminates important voting information and thus is not a good way to manage the data, but that is the way it is done).
In light of that, EPEC also used its archived versions of the Daily Absentee List (DAL) early voting files to check records of ballots cast that might otherwise be eliminated from the VHL.
Results:
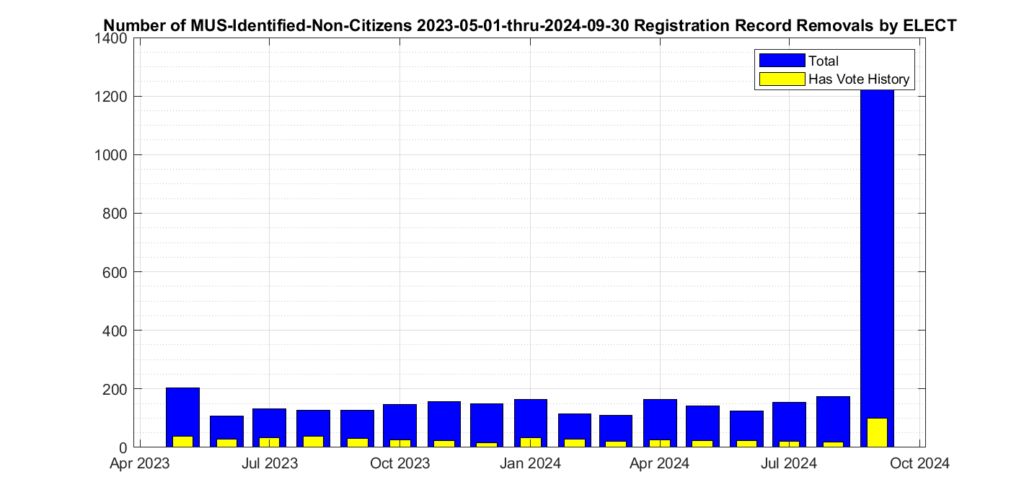
There were 8,566 unique voter records marked for removal with the reason of “Declared Non-Citizen” and not subsequently reinstated in the accumulated MUS record that EPEC began collecting in mid-2023. Of those 8,566 there were 1,756 that also had corresponding records of recent ballots cast at some point in the official Voter History record that we could observe. There were 6,111 associated ballots cast identified since Feb of 2019. Figure 1 below shows the distribution of non-citizen voters in the cumulative MUS file history. The blue trace represent the total identified and CANCELED non-citizen registrations, and the yellow trace represents the number of those records that also had corresponding records (at least 1) in the accumulated voter history data.
Figure 1: Distribution if the number of identified non-citizen records and ballots in the cumulative ELECT MUS file history. The x-axis is the date that a record was marked as CANCELED for the reason of “Declared Non-Citizen”.
Note that the data contained in the MUS updates often covers more than a single month’s period. In other words, the individual MUS files are oversampled. Subsequent MUS files can therefore also have repeated entries from previous versions, as their data may overlap. Our analysis used the first unique entry for a given voter ID marked as “Declared Non-Citizen” in the cumulative MUS record, that had not been subsequently reinstated, in order to build Figure 1. This data oversampling in the MUS may help explain the relative spike in the first (May 2023) bin compared to subsequent months.
As VHL information can be incomplete depending on the time the VHL data was purchased in relation to the time that registrants were removed from voter records, EPEC also checked these non-citizen removals against the archived history of Daily Absentee List (DAL) files that EPEC has accumulated. There were an additional ten non-citizen registrations and ballots as per the Daily Absentee List (DAL) data that were not contained in the Voter History data. The total number of identified non-citizen ballots cast is therefore 6,121 by 1,766 registrants when combining unique VHL and DAL identifications.
These identifications represent only the individuals who declared themselves as non-citizen status through official interactions with ELECT, DMV, or other agencies. Each removed registrant was then contacted by the registrar to confirm their non-citizen status prior to removal, as is the current policy. (Again … we are only considering those records that we’re flagged as “Declared Non-Citizen”, removed and never reinstated.)
The distribution of identified unique voter ID’s for the 1,756 identified non-citizen voters per VA locality is given below in Table 1. It should be noted that each ballot record has a specific locality associated with it stating where the ballot was cast, whereas unique individuals might move between localities over time. The assignment of unique identified individuals to each locality in table 1 is therefore based on the locality listed in the specific MUS “Declared Non-Citizen” record for that individual, while the assignment of ballot cast to Localities is based on the individual VHL/DAL records. A person could have lived and voted multiple times in one county, then moved to another county and voted again before finally being determined as a non-citizen. The same person would have generated multiple VHL/DAL records for each ballot cast, and associated with potentially different localities. This should be kept in mind when attempting to interpret Table 1.
LOCALITY_NAME
REMOVED
VOTED_VHL
VOTES_VHL
VOTED_DAL_NOT_IN_VHL
ACCOMACK COUNTY
20
1
7
0
ALBEMARLE COUNTY
94
31
162
0
ALEXANDRIA CITY
309
58
204
0
ALLEGHANY COUNTY
0
0
0
0
AMELIA COUNTY
5
2
9
0
AMHERST COUNTY
1
0
0
0
APPOMATTOX COUNTY
3
0
0
0
ARLINGTON COUNTY
264
55
185
0
AUGUSTA COUNTY
42
12
37
0
BATH COUNTY
3
1
1
0
BEDFORD COUNTY
31
14
60
0
BLAND COUNTY
1
1
3
0
BOTETOURT COUNTY
6
1
4
0
BRISTOL CITY
3
1
7
0
BRUNSWICK COUNTY
4
3
15
0
BUCHANAN COUNTY
0
0
0
0
BUCKINGHAM COUNTY
6
1
13
0
BUENA VISTA CITY
0
0
0
0
CAMPBELL COUNTY
3
1
10
0
CAROLINE COUNTY
18
4
15
0
CARROLL COUNTY
18
6
26
0
CHARLES CITY COUNTY
8
4
26
0
CHARLOTTE COUNTY
3
1
2
0
CHARLOTTESVILLE CITY
51
16
51
0
CHESAPEAKE CITY
192
67
267
0
CHESTERFIELD COUNTY
501
74
276
0
CLARKE COUNTY
16
7
19
0
COLONIAL HEIGHTS CITY
25
4
10
0
COVINGTON CITY
4
0
1
0
CRAIG COUNTY
3
2
3
0
CULPEPER COUNTY
51
9
32
0
CUMBERLAND COUNTY
1
0
0
0
DANVILLE CITY
43
5
13
0
DICKENSON COUNTY
3
1
1
0
DINWIDDIE COUNTY
18
6
25
0
EMPORIA CITY
5
0
0
0
ESSEX COUNTY
8
2
4
0
FAIRFAX CITY
32
9
26
0
FAIRFAX COUNTY
1428
271
737
2
FALLS CHURCH CITY
8
2
5
0
FAUQUIER COUNTY
45
9
16
0
FLOYD COUNTY
0
0
0
0
FLUVANNA COUNTY
6
3
12
0
FRANKLIN CITY
2
1
2
0
FRANKLIN COUNTY
13
7
36
0
FREDERICK COUNTY
45
8
24
0
FREDERICKSBURG CITY
48
4
12
0
GALAX CITY
5
0
0
0
GILES COUNTY
3
0
0
0
GLOUCESTER COUNTY
9
3
6
1
GOOCHLAND COUNTY
10
1
3
0
GRAYSON COUNTY
6
2
12
1
GREENE COUNTY
16
3
9
0
GREENSVILLE COUNTY
1
0
0
0
HALIFAX COUNTY
10
1
2
0
HAMPTON CITY
147
45
176
0
HANOVER COUNTY
35
6
23
0
HARRISONBURG CITY
161
13
27
0
HENRICO COUNTY
381
40
178
0
HENRY COUNTY
1
0
2
0
HIGHLAND COUNTY
0
0
0
0
HOPEWELL CITY
1
0
0
0
ISLE OF WIGHT COUNTY
5
2
21
0
JAMES CITY COUNTY
65
13
46
0
KING AND QUEEN COUNTY
3
2
7
0
KING GEORGE COUNTY
10
1
4
0
KING WILLIAM COUNTY
5
3
37
0
LANCASTER COUNTY
4
2
1
0
LEE COUNTY
0
0
0
0
LEXINGTON CITY
1
1
3
0
LOUDOUN COUNTY
484
127
414
0
LOUISA COUNTY
19
7
36
0
LUNENBURG COUNTY
2
0
0
0
LYNCHBURG CITY
53
13
51
0
MADISON COUNTY
2
1
5
0
MANASSAS CITY
110
15
43
0
MANASSAS PARK CITY
51
6
22
0
MARTINSVILLE CITY
18
5
5
0
MATHEWS COUNTY
0
0
0
0
MECKLENBURG COUNTY
16
8
19
0
MIDDLESEX COUNTY
3
1
1
0
MONTGOMERY COUNTY
31
5
21
1
NELSON COUNTY
7
4
20
0
NEW KENT COUNTY
14
9
36
0
NEWPORT NEWS CITY
233
55
219
0
NORFOLK CITY
247
55
220
0
NORTHAMPTON COUNTY
7
2
7
0
NORTHUMBERLAND COUNTY
4
3
11
0
NORTON CITY
1
0
0
0
NOTTOWAY COUNTY
12
4
31
0
ORANGE COUNTY
12
7
15
0
PAGE COUNTY
0
0
0
0
PATRICK COUNTY
5
1
2
0
PETERSBURG CITY
59
15
68
0
PITTSYLVANIA COUNTY
25
11
52
0
POQUOSON CITY
1
0
0
0
PORTSMOUTH CITY
121
46
132
0
POWHATAN COUNTY
6
1
8
0
PRINCE EDWARD COUNTY
14
3
11
0
PRINCE GEORGE COUNTY
34
5
9
0
PRINCE WILLIAM COUNTY
915
152
448
1
PULASKI COUNTY
14
4
7
0
RADFORD CITY
1
0
3
0
RAPPAHANNOCK COUNTY
3
0
0
0
RICHMOND CITY
345
65
241
1
RICHMOND COUNTY
2
1
4
0
ROANOKE CITY
193
22
68
0
ROANOKE COUNTY
34
4
5
0
ROCKBRIDGE COUNTY
0
0
1
0
ROCKINGHAM COUNTY
78
16
48
0
RUSSELL COUNTY
9
3
9
0
SALEM CITY
15
4
17
0
SCOTT COUNTY
6
4
17
0
SHENANDOAH COUNTY
42
6
18
0
SMYTH COUNTY
11
5
21
0
SOUTHAMPTON COUNTY
0
0
3
0
SPOTSYLVANIA COUNTY
137
7
18
0
STAFFORD COUNTY
242
45
133
2
STAUNTON CITY
9
2
11
0
SUFFOLK CITY
85
37
169
1
SURRY COUNTY
2
0
0
0
SUSSEX COUNTY
2
1
3
0
TAZEWELL COUNTY
9
3
13
0
VIRGINIA BEACH CITY
380
82
348
0
WARREN COUNTY
30
6
24
0
WASHINGTON COUNTY
21
6
22
0
WAYNESBORO CITY
3
0
4
0
WESTMORELAND COUNTY
8
1
6
0
WILLIAMSBURG CITY
18
4
7
0
WINCHESTER CITY
45
5
6
0
WISE COUNTY
6
5
13
0
WYTHE COUNTY
3
0
0
0
YORK COUNTY
38
15
51
0
8566
1756
6111
10
Discussion
Of particular concern is that we can see that there has been a significant order of magnitude (10 x) drop in the number of reported non-citizen removals in the MUS data starting in the MUS covering May 2026. This coincides with the recent aforementioned opinion letter from AG Jones to the Department of Elections that advised ELECT to NOT remove self-identified non-citizens from the rolls. The previous AG (Miyares) made the case that the fact that all of these removals were initiated by individual actions of self-identification via interactions with DMV or the Courts, etc., made the program appropriately “individualized” in accordance with NVRA. The courts had tentatively sided with Miyares argument and ultimately denied the injunction requested by the DOJ, LWV and fellow litigants. However, the case was withdrawn shortly after the election of AG Jones. AG Jones has now taken the opposite stance of Miyares, and is now effectively granting the relief that the DOJ & LWV were requesting in their suit even though the supreme court did not grant the injunction. Because of this new direction to not remove self identified non-citizens, this explains the order of magnitude decrease in the number of non-citizen removals that we observe in the MUS data.
Another point of concern is that even though we see a decrease in the removal rate per the policy changes above, we see a significant increase in the number of ballots associated with non-citizen records compared to our previous documented trends. The table below summarizes all of our previous posts on the subject, including this post. As can been seen in the table, while the cumulative number of identified non-citizen removals has increased by 1233 since our last report, the number of associated ballots cast has gone up by 2596 (nearly double). This equates to an average number of identified associated ballots cast per removed non-citizen of 0.713, while all other previous analyses had averages between 0.35 and 0.566.
Analysis Date
Removals
With Vote History
Associated Ballots Cast
Ratio of removed Non-Citizens to Ballots Cast
2024-03
1,481
335
838
0.5658
2024-07
1,973
399
938
0.4754
2024-09
2,299
438
1,034
0.4498
2024-10
3,533
537
1,296
0.3668
2024-11
3,761
569
1,333
0.3544
2024-12
3,765
562
1,318
0.3501
2025-03
4,400
683
1,775
0.4034
2025-08
6,086
1,003
2,839
0.4665
2026-01
7,343
1,225
3,515
0.4787
2026-06
8,566
1,756
6,111
0.7134
It is important to note that the records identified in the MUS are only those resulting from individuals who were removed from the voter rolls by ELECT after self-identifying as a non-citizen via interactions with DMV, ELECT, or other official avenues, and that the data presented here specifically excludes those individuals that were subsequently reinstated onto the voter rolls.
The fact that a small number of these identified non-citizen registrations are also associated with (presumably … if the data from ELECT is accurate) illegally cast ballots in previous elections does raise a number of questions that citizens should be (politely) asking and discussing with their legislators, elected and appointed government officials. Each act of non-citizen voting is a de-facto disenfranchisement of legal voters rights, and is a punishable offense under VA law.
Additionally, this evidence which is derived from only official state records, directly contradicts multiple news media reports and attestations that non-citizen voting is a “Myth”, and that non-citizen voting happens “almost never”. If the data from ELECT is accurate, then there are at least6,111 ballots that have been cast by non-citizen voters just since 2019. Now, that is still very infrequent, but it is not “almost never.” It is a legitimate concern … and these discoveries are only the registrations that have been found and removed from the voter roles by ELECT and that we can observe in the data.
It should also be reiterated that these are only the records that we can observe given our data repository, and how often we can realistically purchase and acquire voter history and voter registration information. It is therefore likely that this represents a significant undercount of the occurrences of non-citizen voters and non-citizen voting.
Due to the infrequent nature of these data purchases, it is very likely that some individuals have had their voter history or voter registration information completely removed from the record in between our purchases. Additionally, we know that the MUS data does not entirely encompass all transactions performed on the RVL by the department of elections, so there may be yet other unknown transactions that we are missing.
We do not know how many exist that we do not know about, and with the recent change in guidance from the new AG Jones to ELECT we expect that our ability to observe and report on these issues into the future will be significantly impacted, as ELECT will stop removals of many of these records, and therefore they will not show up in the MUS records, even though they have been correctly flagged via self-identification.
Over the last few weeks I’ve spent the time to go through all of the tabulator machine tapes for Prince William County VA, which are made available by the PWC Registrar and scans of which are posted on the pwcvotes.org website. Our sincere thanks to the PWC Registrar for posting these for public inspection, and we encourage other Registrars to do the same or similar.
The excel file with all of the machine tape results entered, as well as corresponding tabs with the corresponding parsed results from the Dept of Elections JSON and CSV result reports is available below. The first tab of the linked excel file lists all of the machine tapes and notes where discrepancies exist.
Thankfully, there were only a few very small discrepancies noted between the machine tape reports and the results reported by the Virginia department of elections. The maximum discrepancy of 18 ballots was associated with the proposed constitutional amendment contest, and can be attributed to two individuals utilizing the federal only ballot, which I confirmed with via phone conversation with the PWC registrar.
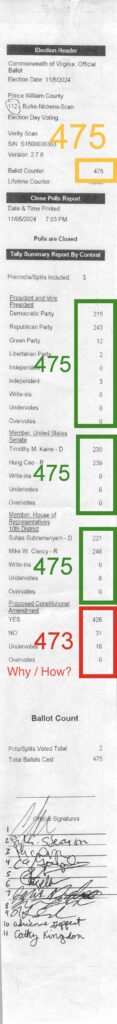
This discrepancy can most clearly be seen in the Burke-Nickens machine tape shown below, where the sum total number of votes in the Constitutional amendment section does not equal the total number of ballots recorded by the tabulator. (This is highlighted in orange in the linked excel file.)
Figure 1: Issue with PWC 112 Burke_Nickens S1500036303 Tabulator Machine shows two ballots missing from the Constitutional Amendment section.
Note that the second line from the bottom shows that the number of “Pcts/Splits Total” is equal to 2. This means that there were two different ballot styles utilized with this tabulator. Two of those ballots were federal only, so they did not have the section for voting on the VA Constitutional amendment. So while the total ballot counter at the top of the tape reads 475, the total number of ballots cast for the constitutional amendment was 473.
We have updated our previous analysis (from March, July, and Sept) with the latest information from the VA Department of Elections data.
Abstract:
Using the data provided by the VA Department of Elections (ELECT), we have identified at least 3,533 unique registrations that were identified as “Declared Non-Citizen” and removed by ELECT from the voter rolls since May of 2023. In the last update period, there was a significant(!) increase of almost 50% of the TOTAL number of non-citizen removals that we’ve seen in our previous reporting (see data below). This increase does not appear to be an artifact of our processing routines, as all of the processing code has remained the same since our last update. We should also note for the record that these are only self-declared removals, and it does not appear from the data available that there was any changes to the standard process used by ELECT.
Of those 3,533 removals there were 537 that also had corresponding records of recent ballots cast at some point in the official Voter History record that we could observe. There were 1,296 associated ballots cast identified since Feb of 2019. There were an additional 2 non-citizen registrations and ballots as per the Daily Absentee List (DAL) data, that were not contained in the Voter History data. The total number of identified non-citizen ballots cast is therefore 1,298 by 539 registrants when combining unique VHL and DAL identifications.
After our March 2024 post on this topic, we submitted all of the relevant information that we had at the time to the VA AG’s office. We have not heard any response or update on the matter since that time, besides this being considered an active investigation. We subsequently sent our July results as well to the same contact at the AG’s office, but have had no response.
The Arlington County VA Electoral Board undertook their own investigation into this matter after our previous results were posted, and they recently (as of Sept 10 2024) voted 3-0 to send the information to the AG’s office as well. The Arlington County Commonwealths Attorney also is reported to have an ongoing investigation into the matter. Similar efforts are underway in multiple other counties, including Loudoun and Fairfax counties, to name a few.
The VA Department of Elections continuously tries to identify and remove invalid or out of date registration records from the voter rolls. One category used for removal is if a registrant has been determined to be a non-citizen. It is required by the VA Constitution that only citizens are allowed to vote in VA elections.
In elections by the people, the qualifications of voters shall be as follows: Each voter shall be a citizen of the United States, shall be eighteen years of age, shall fulfill the residence requirements set forth in this section, and shall be registered to vote pursuant to this article. …
Additionally, according to VA Code Section 24.2-1004, the act of knowingly casting a ballot by someone who is not eligible to vote is a Class 6 felony.
A. Any person who wrongfully deposits a ballot in the ballot container or casts a vote on any voting equipment, is guilty of a Class 1 misdemeanor.
B. Any person who intentionally (i) votes more than once in the same election, whether those votes are cast in Virginia or in Virginia and any other state or territory of the United States, (ii) procures, assists, or induces another to vote more than once in the same election, whether those votes are cast in Virginia or in Virginia and any other state or territory of the United States, (iii) votes knowing that he is not qualified to vote where and when the vote is to be given, or (iv) procures, assists, or induces another to vote knowing that such person is not qualified to vote where and when the vote is to be given is guilty of a Class 6 felony.
ELECT makes available for purchase by qualifying parties various different data sets, including the registered voter list (RVL) and the voter history list information file (VHL). Additionally, ELECT makes available a Monthly Update Service (MUS) subscription that is published at the beginning of each month and contains (almost) all of the Voter List changes and transactions for the previous period.
In the MUS data there is a “NVRAReasonCode” field that is associated with each transaction that gives the reason for the update or change in the voter record. This is in accordance with the disclosure and transparency requirements in the NVRA. One of the possible reason codes given for records that are removed is “Declared Non-Citizen.”
EPEC has been consistently purchasing and archiving all of these official records as part of our ongoing work to document and educate the public as to the ongoing operations of our elections. (If your interested in supporting this work, please head on over to our donation page, or to our give-send-go campaign to make a tax-deductible donation, as these data purchases are not cheap!)
EPEC looked at the number of records associated with unique voter identification numbers that had been identified for removal from the voter record due to non-citizenship status, per the entries in the MUS, and correlated those results with our accumulated voter history list information in order to determine how many non-citizen registrations had corresponding records of ballots cast in previous elections. We only considered those records that are currently in a non-active state as of the latest MUS transaction log, as some determinations of non-citizenship status in the historical MUS transaction log might have been due to error and subsequently corrected and reinstated to active status. That is, we are not considering those records that had a “Declared Non-Citizen” disqualification, but were then subsequently reinstated and reactivated by ELECT.
While EPEC has periodically purchased full copies of the Voter History List for our archive, there is a known issue with the way ELECT handles removals from the voter record that can cause sampling issues depending on the time the VHL file is purchased, and records of legitimately cast ballots to not be present in the VHL: Namely, when ELECT removes a voter from the voter list, they also remove all instances of that voter ID from voter history information and other data files provided to qualified organizations. (IMO … thats a terrible way to manage the data, but that is the way it is done.) In light of that, EPEC also used its archived versions of the Daily Absentee List (DAL) for recent elections in order to attempt to find records of votes cast that might otherwise be missing from the VHL.
Results:
There were 3,533 unique voter records marked for removal with the reason of “Declared Non-Citizen” and not subsequently reinstated in the accumulated MUS record that EPEC began collecting in mid-2023. Of those 3,533 there were 537 that also had corresponding records of recent ballots cast at some point in the official Voter History record that we could observe. There were 1,296 associated ballots cast identified since Feb of 2019. Figure 1 shows the distribution of non-citizen voters in the cumulative MUS file history. The blue trace represent the total identified and CANCELED non-citizen registrations, and the yellow trace represents the number of those records that also had corresponding records in the accumulated voter history data.
Figure 1: Distribution if the number of identified non-citizen records and ballots in the cumulative ELECT MUS file history. The x-axis is the date that a record was marked as CANCELED for the reason of “Declared Non-Citizen”.
Note that the data contained in the MUS updates often covers more than a single month period. In other words, the individual MUS files are oversampled. Subsequent MUS files can therefore also have repeated entries from previous versions, as their data may overlap. Our analysis used the first unique entry for a given voter ID marked as “Declared Non-Citizen” in the cumulative MUS record in order to build Figure 1. This data oversampling in the MUS helps explain the relative increase in the May 2023 bin.
As VHL information can be incomplete depending on the time the VHL data was purchased in relation to the time that registrants were removed from voter records, EPEC also checked these non-citizen removals against the archived history of Daily Absentee List (DAL) files that EPEC has accumulated. There were an additional 2 non-citizen registrations and ballots as per the Daily Absentee List (DAL) data, that were not contained in the Voter History data. The total number of identified non-citizen ballots cast is therefore 1,298 by 539 registrants when combining unique VHL and DAL identifications.
These identifications represent only the individuals who declared themselves as non-citizen status through official interactions with ELECT, DMV, or other agencies. Each removed registrant was then contacted by the registrar to confirm their non-citizen status.
The distribution of identified unique voter ID’s for the 537 identified non-citizen voters per VA locality is given below in Table 1. It should be noted that each ballot record has a specific locality associated with where the ballot was cast, whereas unique individuals might move between localities over time. The assignment of unique identified individuals to each locality in table 1 is therefore based on the locality listed in the specific MUS “Declared Non-Citizen” record for that individual, while the assignment of ballot cast to Localities is based on the individual VHL/DAL records. A person could have lived and voted multiple times in one county, then moved to another county and voted again before finally being determined as a non-citizen. The same person would have generated multiple VHL/DAL records for each ballot cast, and associated with potentially different localities. This should be kept in mind when attempting to interpret Table 1.
MUS Removals
Voted (VHL)
Voted (DAL)
Votes (VHL)
Votes (DAL)
ACCOMACK COUNTY
7
ALBEMARLE COUNTY
33
5
8
ALEXANDRIA CITY
159
24
41
AMELIA COUNTY
2
1
3
APPOMATTOX COUNTY
1
ARLINGTON COUNTY
112
18
49
AUGUSTA COUNTY
13
1
1
BEDFORD COUNTY
9
2
4
BOTETOURT COUNTY
2
BRISTOL CITY
1
BRUNSWICK COUNTY
2
1
2
BUCKINGHAM COUNTY
3
CAROLINE COUNTY
8
2
4
CARROLL COUNTY
7
2
5
CHARLES CITY COUNTY
2
1
3
CHARLOTTESVILLE CITY
24
2
7
CHESAPEAKE CITY
92
22
56
CHESTERFIELD COUNTY
227
24
57
CLARKE COUNTY
8
3
4
COLONIAL HEIGHTS CITY
12
1
3
COVINGTON CITY
1
CRAIG COUNTY
1
CULPEPER COUNTY
25
2
2
DANVILLE CITY
17
2
8
DINWIDDIE COUNTY
9
1
1
EMPORIA CITY
2
ESSEX COUNTY
3
1
3
FAIRFAX CITY
9
3
11
FAIRFAX COUNTY
641
98
1
213
1
FAUQUIER COUNTY
23
3
10
FLUVANNA COUNTY
2
1
1
FRANKLIN COUNTY
3
2
4
FREDERICK COUNTY
28
2
2
FREDERICKSBURG CITY
23
2
4
GALAX CITY
2
GILES COUNTY
2
GLOUCESTER COUNTY
2
1
1
GOOCHLAND COUNTY
5
1
GRAYSON COUNTY
1
GREENE COUNTY
6
1
2
HALIFAX COUNTY
1
HAMPTON CITY
58
13
17
HANOVER COUNTY
13
1
2
HARRISONBURG CITY
69
2
3
HENRICO COUNTY
101
9
45
HENRY COUNTY
2
ISLE OF WIGHT COUNTY
1
2
JAMES CITY COUNTY
31
4
13
KING GEORGE COUNTY
4
KING WILLIAM COUNTY
1
LOUDOUN COUNTY
222
47
110
LOUISA COUNTY
9
LYNCHBURG CITY
22
4
11
MANASSAS CITY
50
4
11
MANASSAS PARK CITY
17
2
MARTINSVILLE CITY
6
1
MECKLENBURG COUNTY
7
3
10
MIDDLESEX COUNTY
2
MONTGOMERY COUNTY
3
NELSON COUNTY
2
NEW KENT COUNTY
3
1
NEWPORT NEWS CITY
103
22
49
NORFOLK CITY
89
13
33
NORTHAMPTON COUNTY
1
NORTHUMBERLAND COUNTY
3
2
5
NORTON CITY
1
NOTTOWAY COUNTY
4
ORANGE COUNTY
3
1
3
PATRICK COUNTY
1
PETERSBURG CITY
25
3
5
PITTSYLVANIA COUNTY
7
2
4
PORTSMOUTH CITY
38
13
37
POWHATAN COUNTY
4
1
PRINCE EDWARD COUNTY
10
3
11
PRINCE GEORGE COUNTY
12
1
1
PRINCE WILLIAM COUNTY
398
60
136
PULASKI COUNTY
6
1
2
RAPPAHANNOCK COUNTY
2
RICHMOND CITY
161
24
1
67
1
ROANOKE CITY
45
2
3
ROANOKE COUNTY
19
2
ROCKINGHAM COUNTY
22
5
13
RUSSELL COUNTY
3
1
1
SALEM CITY
3
SCOTT COUNTY
1
1
4
SHENANDOAH COUNTY
17
1
1
SMYTH COUNTY
2
SPOTSYLVANIA COUNTY
61
4
10
STAFFORD COUNTY
75
10
28
STAUNTON CITY
5
SUFFOLK CITY
28
11
20
SURRY COUNTY
1
SUSSEX COUNTY
2
1
3
TAZEWELL COUNTY
4
1
1
VIRGINIA BEACH CITY
149
19
66
WARREN COUNTY
14
2
5
WASHINGTON COUNTY
5
2
6
WAYNESBORO CITY
3
WESTMORELAND COUNTY
1
WILLIAMSBURG CITY
10
1
WINCHESTER CITY
22
2
2
WISE COUNTY
1
WYTHE COUNTY
3
YORK COUNTY
21
10
38
Totals
3533
537
2
1296
2
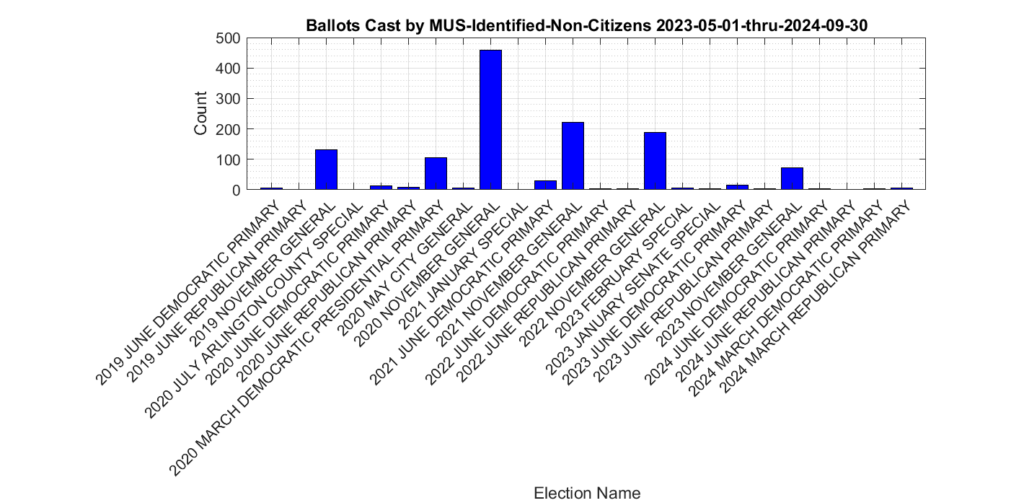
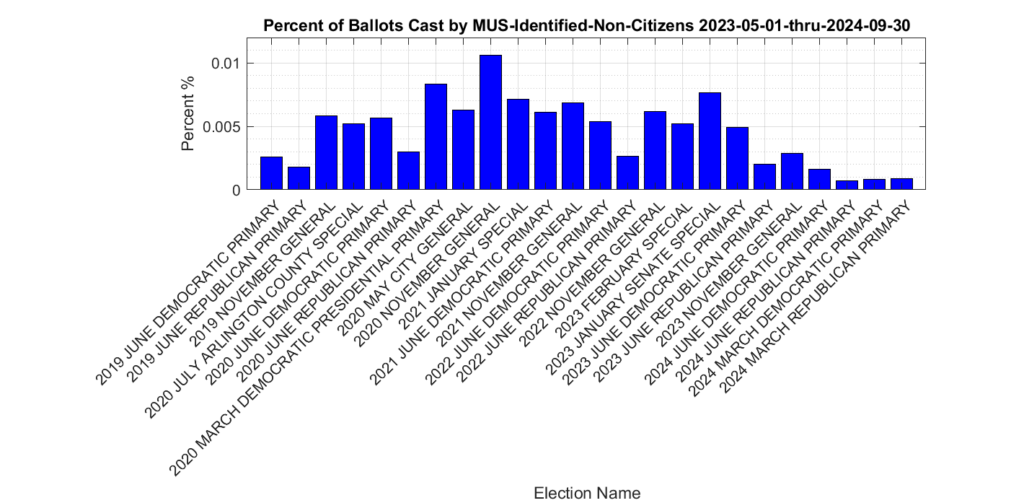
The distribution of the 1,296 ballots that were identified as being cast by non-citizen voters (the yellow trace in Figure 1) in previous elections is shown in Figure 2. The most significant spikes are in the 2019, 2020, 2021 and 2022 November General elections, as well as the 2020 March Democratic presidential primary. Figure 3, which shows this distribution as a percentage of votes cast. Please note the scale of the Y-axis on the percent plot in Figure 3 is in percent of total ballots cast in each election. These graphs were only produced for the VHL data, and do not include the DAL identified records.
Figure 2: Distribution of identified non-citizen ballots cast in previous elections.
Figure 3: Distribution of identified non-citizen ballots cast in previous elections as percent of total ballots cast, according to entries in the VHL/DAL data files.
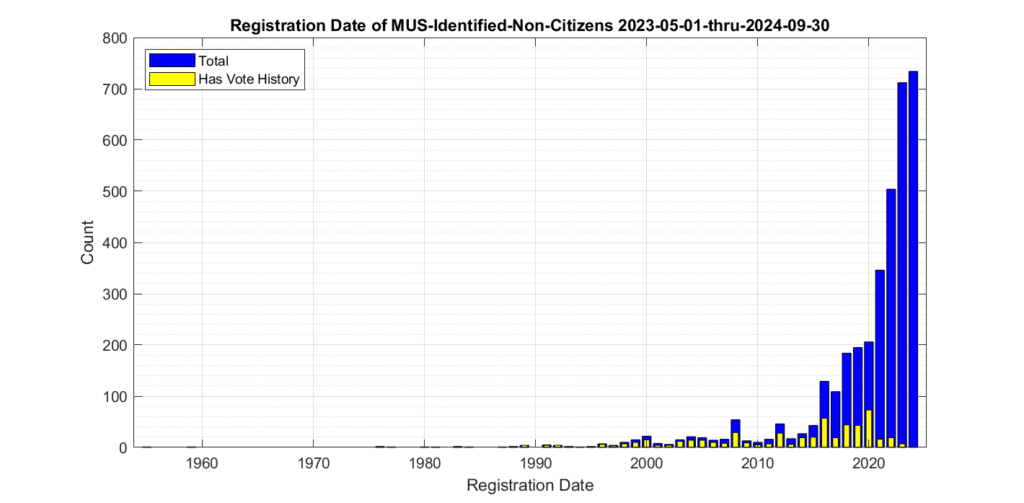
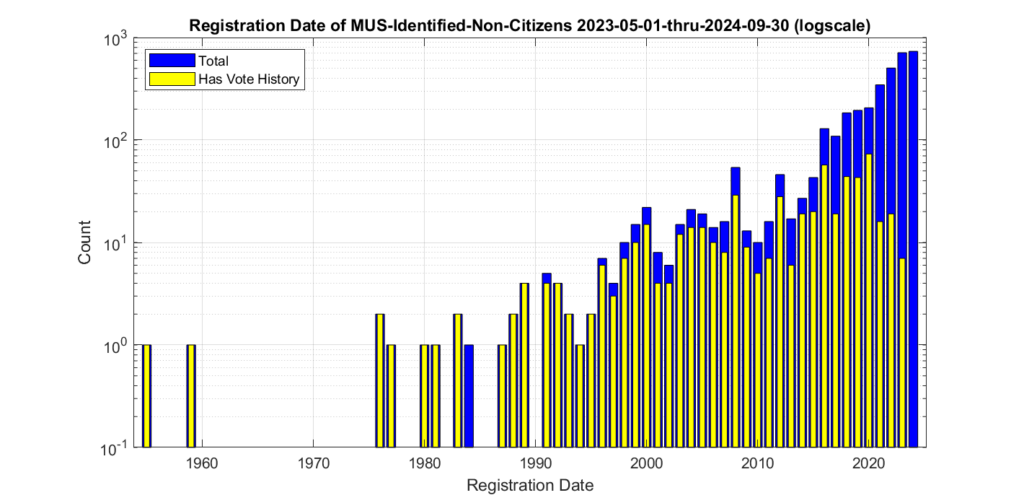
Figures 4 and 5 show the distribution of the registration dates of the identified non-citizen records. The same data is plotted in figure 4 and 5, with the only difference being the scale of the Y-axis in order to better observe the dynamic range of the values. When we look at the registration date of these identified records, we see that there is a distinct relative increase starting around 1996, and then again around 2012.
Figure 4: Registration dates of the identified non-citizen records. Absolute count on y-axis.
Figure 5: Registration dates of the identified non-citizen records. Logarithmic Y-axis scale.
EPEC made a FOIA request to the VA Attorney General’s office on March 11, 2024 inquiring for any records regarding how many prosecutions for non-citizen voting had occurred since June of 2023. We received a response that the AG had no such relevant records.
EPEC subsequently submitted our March analysis dataset to the VA AG’s office upon their request. We have heard no updates or status as to any action taken by the AG’s office since that time, except that it is being considered an ongoing investigation.
Discussion
It appears from the MUS data, that the VA Department of Elections (ELECT) is doing routine identification, cleanup and removal of non-citizen registrations, which is a good thing and we commend them for their continued efforts to maintain clean voter registration lists.
However, the fact that a small number of these identified non-citizen registrations are also associated with (presumably … if the data from ELECT is accurate) illegally cast ballots in previous elections does raise a number of questions that citizens should be (politely) asking and discussing with their legislators, elected and appointed government officials. Each act of non-citizen voting is a de-facto disenfranchisement of legal voters rights, and is a punishable offense under VA law.
Q: How did these registrants get placed onto the voter rolls in the first place?
Q: What method and/or data sources are used by the state to identify non-citizen registrations for removal? If that process is exhaustive, and covers all registrations, then these numbers might be considered to represent a statistical complete picture of the problem. If that process is not exhaustive, in that it only uses serendipitous corroborating data sources, then these results likely under-represent the scale of the issues.
Q: As noted above, we are only considering here those individuals who have not had their records re-instated or reactivated after a determination of non-citizen status. We do not have enough information to determine how or why some records were first determined to be non-citizen, canceled and then subsequently re-instated. One potential area of concern is determining whether or not registrants might be falsely or errantly claiming to not be a citizen on official documents in order to be excused from jury duty, for example, and then work to re-instate their voting status once those documents percolate through the system to ELECT and are flagged for removal. This is a wholly separate but serious issue, as making false claims on official documents is itself a punishable offense.
Q: What procedures, processes and technical solutions are in place to prevent current or future registration and casting of ballots by non-citizens? This is especially pertinent given the current state of the flow of illegal immigrants crossing our national borders. According to a recent report by Yahoo Finance, VA is one of the top 30 destinations for illegal migrants, with both Loudoun County and Fairfax making the list.
Q: Why have none of the identified non-citizens who also cast ballots been investigated or prosecuted under VA Code 24.2-1004? As the identification of these ballots comes directly from looking at the official records produced by ELECT, it seems prudent for these to be forwarded by ELECT to the AG’s office with a recommendation to investigate and prosecute. Yet our FOIA request to the VA AG’s office inquiring as to any records associated with these types of investigations or prosecutions produced a “no relevant records exist” response. And since we submitted this information to the AG’s office, there has been no follow up.
Additionally, this evidence which is derived from only official state records, directly contradicts multiple news media reports and attestations that non-citizen voting is a “Myth”, and that non-citizen voting happens “almost never”. If the data from ELECT is accurate, then there are at least 1,298 ballots that have been cast by non-citizen voters just since 2019. Now, that is still very infrequent, but it is not “almost never.” It is a legitimate concern … and these discoveries are only the registrations that have been found and removed from the voter roles by ELECT and that we can observe in the data. We do not know how many exist that we do not know about.
It should be reiterated that these are only the records that we can observe given our data repository, and how often we can realistically purchase and acquire voter history and voter registration information. It is therefore likely that this represents a significant undercount of the occurrences of non-citizen voters and non-citizen voting.
It costs us (EPEC) approximately ~$5K for each purchase of the statewide voter history list, and approximately $15K/year to maintain RVL records using a single baseline full purchase + 2 purchases of the 6mo MUS subscription. Due to the infrequent nature of these data purchases, it is very likely that some individuals have had their voter history or voter registration information completely removed from the record in between our purchases. Additionally, we know that the MUS data does not entirely encompass all transactions performed on the RVL by the department of elections, so there may be yet other unknown transactions that we are missing.
For information that is supposed to be publicly available (according to federal NVRA laws), the state has put up significant hurdles in order for citizens and organizations to acquire it for use it for ensuring transparency and integrity of our electoral process. If we are to have elections that are transparent and accountable to the public, then we must insist that the data be made available and accessible.
Since VA Gov Youngkin issued Executive Order 35, it has been getting quite a bit of press … I wanted to make a few comments on it after having a chance to digest it.
Overall, I think it’s a net positive for Election Integrity efforts in VA, but not because there is any new or groundbreaking policy by the governor or his administration. Most of the items in his EO are already existing policy, and the EO language is worded such that the current actions of the Department of Elections (ELECT) can be arguably said to comply with those policies. There are a couple of small improvements, such as the fact that this EO codifies into transparent public policy the specific requirements that the commissioner must certify in writing. Even though there isn’t any drastically new policies, this does improve on overall public transparency, confidence and accountability, and I think thats a good thing.
What will be interesting in my opinion, is that now that this EO has been issued, will our team at EPEC notice any demonstrable difference in the quality of voter registration data that we track from ELECT going forward?
More specifically, I’m going to be tracking a few very specific records to see if they get addressed or not.
There are a few egregious records in the VA voter registration file that are obviously problematic that should be removed or at least updated/corrected by ELECT. I, and the team at EPEC, have been tracking these specific records for years but have not published or discussed them publicly. A few of them we even directly mentioned to the current Commissioner of Elections during our face-to-face meeting with her last year. These records should be “easy” to find and clean up by ELECT, as they are obviously errant and invalid registrations in their current state.
As of the latest data we have, those records are still in the voter list and listed as ACTIVE registrations, after nearly four years since I first found them. They can easily be identified with very simple logical checks to the registration records … descriptions of which I and the team at EPEC have discussed publicly and provided direct to ELECT and local registrars on multiple occasions.
The reason I bring this up, is that these can be considered and used as “hold out” test cases, in data science parlance. They are “canaries in the coal mine”, if you will. If we at EPEC start observing that these records are being responsibly updated or removed going forward, in accordance with the mandate in the EO to perform daily scrubbing of the voter rolls for ineligible records, then that would give VA citizens some evidence and verification that the Gov and ELECT are serious about their efforts.
That would be excellent if they did, but seeing as how I’ve been observing these records for 4 years while the administration proclaim what an excellent job its doing … I’m not going to hold my breath.
Examining the Election Night Reporting data from the VA 2024 March Democratic and Republican primaries provides supporting evidence that the Republican primary was impacted and skewed by a large number of Democratic “crossover” voters, resulting in an irregular election fingerprint when the data is plotted.
Background
The US National Academy of Sciences (NAS) published a paper in 2012 titled “Statistical detection of systematic election irregularities.” [1] The paper asked the question, “How can it be distinguished whether an election outcome represents the will of the people or the will of the counters?” The study reviewed the results from elections in Russia and other countries, where widespread fraud was suspected. The study was published in the proceedings of the National Academy of Sciences as well as referenced in multiple election guides by USAID [2][3], among other citations.
The study authors’ thesis was that with a large sample sample of the voting data, they would be able to see whether or not voting patterns deviated from the voting patterns of elections where there was no suspected fraud. The results of their study proved that there were indeed significant deviations from the expected, normal voting patterns in the elections where fraud was suspected, as well as provided a number of interesting insights into the associated “signatures” of various electoral mechanism as they present themselves in the data.
Statistical results are often graphed, to provide a visual representation of how normal data should look. A particularly useful visual representation of election data, as utilized in [1], is a two-dimensional histogram of the percent voter turnout vs the percent vote share for the winner, or what I call an “election fingerprint”. Under the assumptions of a truly free and fair election, the expected shape of the fingerprint is of that of a 2D Gaussian (a.k.a. a “Normal”) distribution [4]. The obvious caveat here is that no election is ever perfect, but with a large enough sample size of data points we should be able to identify large scale statistical properties.
In many situations, the results of an experiment follow what is called a ‘normal distribution’. For example, if you flip a coin 100 times and count how many times it comes up heads, the average result will be 50. But if you do this test 100 times, most of the results will be close to 50, but not exactly. You’ll get almost as many cases with 49, or 51. You’ll get quite a few 45s or 55s, but almost no 20s or 80s. If you plot your 100 tests on a graph, you’ll get a well-known shape called a bell curve that’s highest in the middle and tapers off on either side. That is a normal distribution.
In a free and fair election, the plotted graphs of both the Turnout percentage and the percentage of Vote Share for Election Winner should (again … ideally) both resemble Gaussian “Normal” distributions; and their combined distribution should also follow a 2-dimensional Gaussian (or “normal”) distribution. Computing this 2 Dimensional joint distribution of the % Turnout vs. % Vote Share is what I refer to as an “Election Fingerprint”.
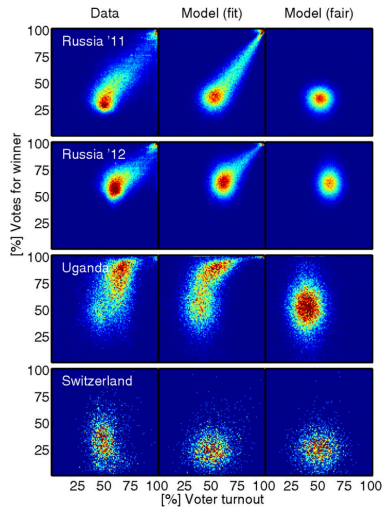
Figure 1 is reprinted examples from the referenced National Academy of Sciences paper. The actual election results in Russia, Uganda and Switzerland appear in the left column, the right column is the modeled expected appearance in a fair election with little fraud, and the middle column is the researchers’ model of the as-collected data, with any possible fraud mechanisms included.
Figure 1: NAS Paper Results (reprinted from [1])
As you can see, the election in Switzerland (assumed fair) shows a range of voter turnout, from approximately 30 – 70% across voting districts, and a similar range of votes for the winner. The Switzerland data is consistent across models, and does not show any significant irregularities.
What do the clusters mean in the Russia 2011 and 2012 elections? Of particular concern are the top right corners, showing nearly 100% turnout of voters, and nearly 100% of them voted for the winner.
Both of those events (more than 90% of registered voters turning out to vote and more than 90% of the voters voting for the winner) are statistically improbable, even for very contested elections. Election results that show a strong linear streak away from the main fingerprint lobe indicates ‘ballot stuffing,’ where ballots are added at a specific rate. Voter turnout over 100% indicates ‘extreme fraud’. [1][5]
Note that election results with ‘outliers’ – results that fall outside of expected normal voting patterns – while evidentiary indicators, are not in and of themselves definitive proof of outright fraud or malfeasance. For example, in rare but extreme cases, where the electorate is very split and the split closely follows the geographic boundaries between voting precincts, we could see multiple overlapping Gaussian lobes in the 2D image. Even in that rare case, there should not be distinct structures visible in the election fingerprint, linear streaks, overly skewed or smeared distributions, or exceedingly high turnout or vote share percentages. Additional reviews of voting patterns and election results should be conducted whenever deviations from normal patterns occur in an election.
Additionally it should be noted that “the absence of evidence is not the evidence of absence”: Election Fingerprints that look otherwise normal might still have underlying issues that are not readily apparent with this view of the data.
Results on 2024 VA March Primaries:
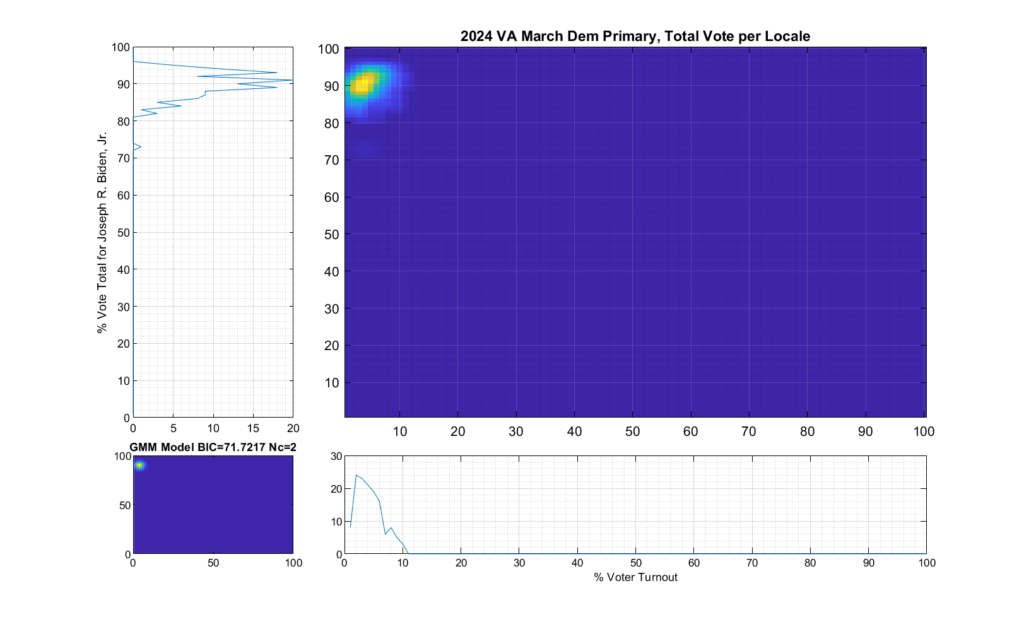
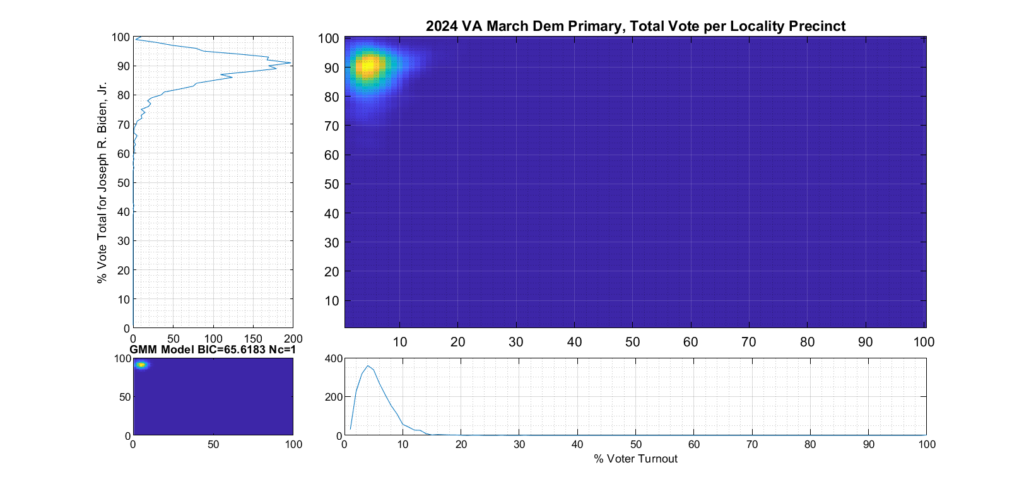
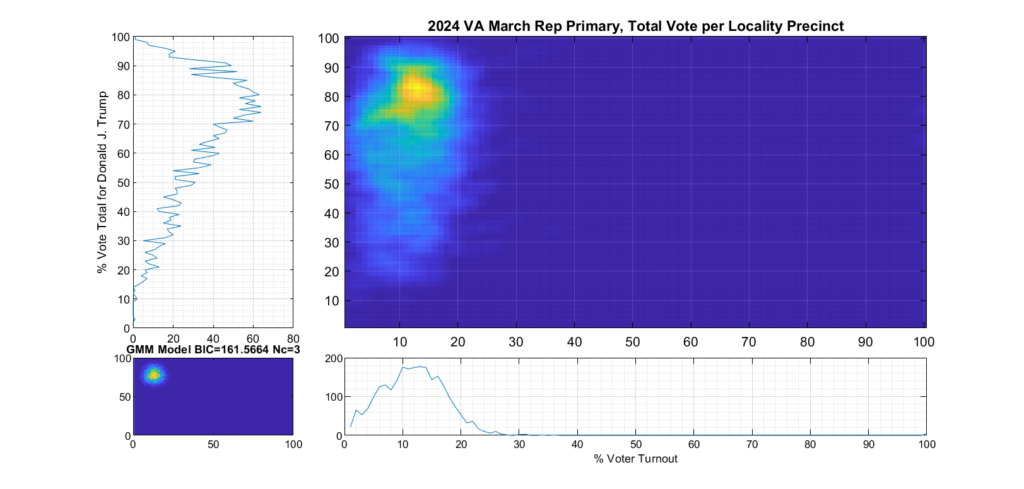
Figure 2 and Figure 3 are the computed election fingerprints for the Democratic and Republican VA 2024 March Primaries, respectively. They were computed according to the NAS paper and using official state reported voter turnout and votes for the statewide winner and reported per voting Locality with combined In-Person Early, Election Day, Absentee and Provisional votes. Figures 4 and 5 perform the same process, except each data point is generated per individual precinct in a locality. The color scale moves from precincts with low counts as deep blue, to precincts with high numbers represented as bright yellow. Note that a small blurring filter was applied to the computed image for ease of viewing small isolated Locality or Precinct results.
The upper right inset in each graphic image was computed per the NAS paper; the bottom left inset shows what an idealized model of the data could or should look like, based on the reported voter turnout and vote share for the winner. This ideal model is allowed to have up to 3 Gaussian lobes based on the peak locations and standard deviations in the reported results. The top-left and bottom-right inset plots show the sum of the rows and columns of the fingerprint image. The top-left graph corresponds to the sum of the rows in the upper right image and is the histogram of the vote share for the winner across precincts. The bottom right graph shows the sum of the columns of the upper right image, and is the histogram of the percentage turnout across voting localities.
Figure 2 Democratic primary, accumulated per Locality:
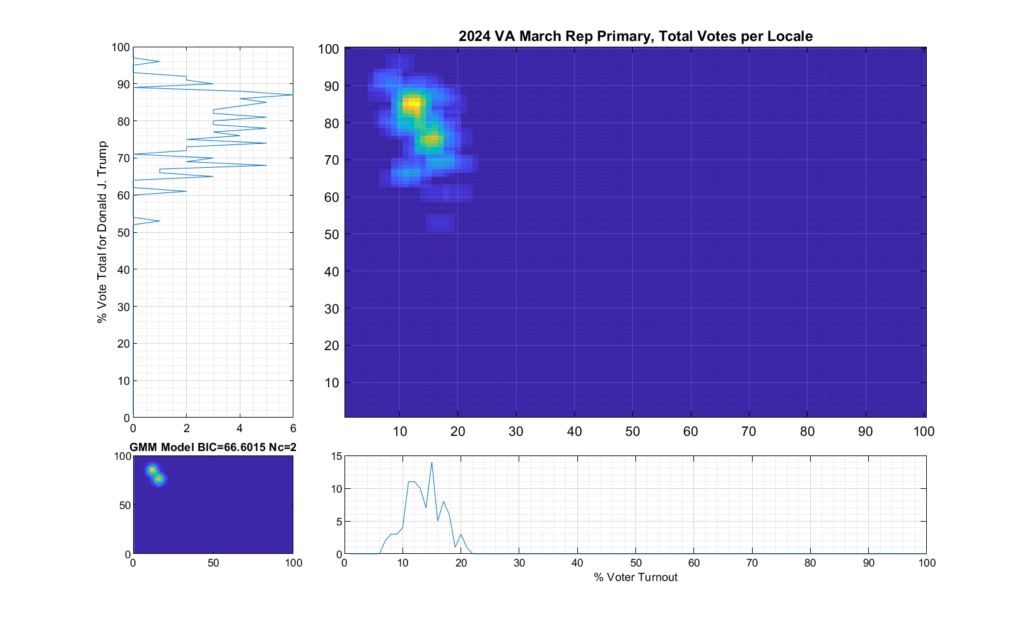
Figure 3 Republican primary, accumulated per Locality:
Figure 4 Democratic primary, accumulated per Precinct:
Figure 5 Republican primary, accumulated per Precinct:
Analysis:
As can be seen in Figure 2 and 4, the Democratic primary fingerprint looks to fall within expected normal distribution. Even though the total vote share for the winner (Biden) is up around 90%, this was not unexpected given the current set of contestants and the fact that Biden is the incumbent.
The Republican primary results, as shown in Figure 3 and 5, show significant “smearing” of the percent of total vote share for the winner. The percent of voter turnout (x-axis) does however show a near Gaussian distribution, which is what one would expect. The republican primary data does not show the linear streaking pattern that the authors in [1] correlate with extreme fraud, but significant smearing of the distribution is observed.
A consideration that might partially explain this smearing of the histogram, is that there was at least 17% of “crossover voters” who historically lean Democrat but voted in the Republican primary (see here for more information). Multiple news reports and exit polling suggest that this was due in part to loosely organized efforts by the opposing party to cast “Protest Votes” and artificially inflate the challenger (Haley) and dilute the expected (Trump) margin of victory for the winner, with no intention of supporting a Republican candidate in the General Election. (This is completely legal in VA, by the way, as VA does not require by-party voter registration.)
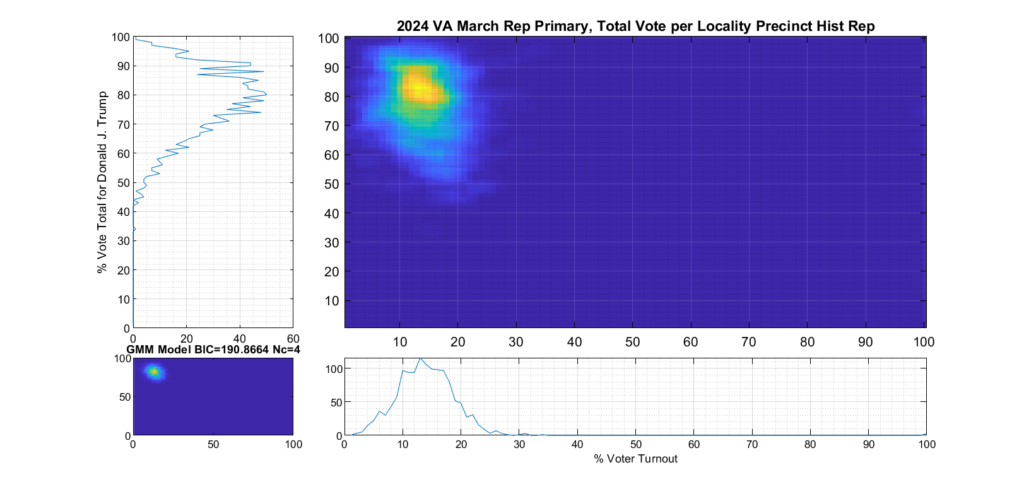
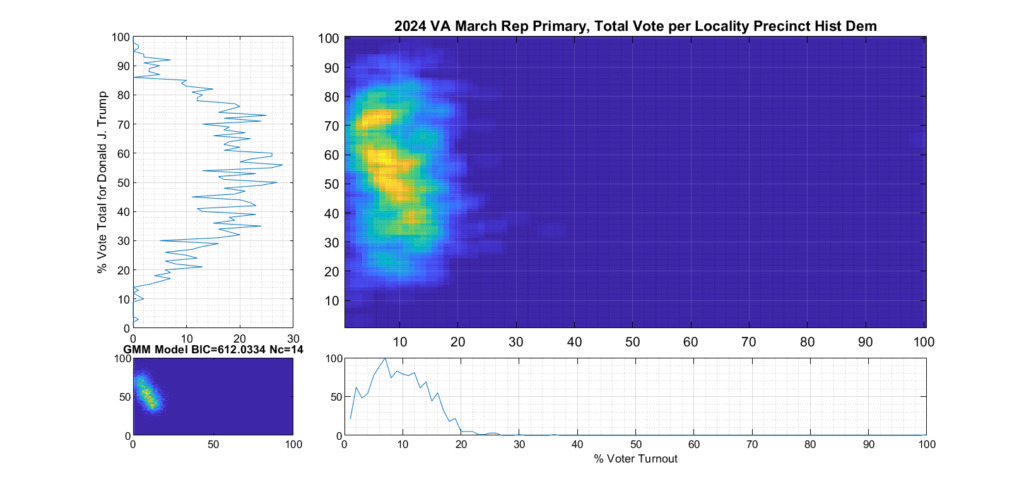
If we categorize each locality as being either Democratic or Republican leaning based on the average results of the last four presidential elections, and then split the computation of the per precinct results into separate parts accordingly, we can see this phenomenon much clearer.
Figure 6 shows the per-precinct results for only those locality precincts that belong to historic Republican leaning localities. It depicts a much tighter distribution and has much less smearing or blurring of the distribution tails. We can see from the data that Republican base in historically Republican leaning localities seems solidly behind candidate Trump.
Figure 7 shows the per-precinct results for only those locality precincts that belong to historic Democratic leaning localities. It can clearly be seen by comparing the two plots that the major contributor to the spread of the total republican primary distribution is the votes from historically Democratic leaning localities.
Figure 6 Republican primary, accumulated per Precinct in Republican leaning localities:
Figure 7 Republican primary, accumulated per Precinct in Democratic leaning localities:
References:
[1] “Statistical detection of election irregularities” Peter Klimek, Yuri Yegorov, Rudolf Hanel, Stefan Thurner Proceedings of the National Academy of Sciences Oct 2012, 109 (41) 16469-16473; DOI: 10.1073/pnas.1210722109 (https://www.pnas.org/content/109/41/16469)
[5] Mebane, Walter R. and Kalinin, Kirill, Comparative Election Fraud Detection (2009). APSA 2009 Toronto Meeting Paper, Available at SSRN: https://ssrn.com/abstract=1450078
As I was going through and processing the (new) VA election night reporting data provided by Enhanced Voting, I noticed a number of technical issues with the data feed. I’ve tried to capture them here in the attempt to help assist the VA Department of Elections in correcting bugs and implementation issues with their new reporting format.
While the new ENR data feed is commendable in that it presents the data for the state in an easily obtainable JSON formatted file, the following issues were observed in my processing of the data. I am happy to provide specific examples of these issues to the Enhanced Voting development team in order to help address them.
Inconsistent JSON formats being returned. Sometimes locality group results information is a cell of structures, sometimes an array.
Occasional mal-formed JSON, missing opening or closing parentheses or brackets causing the file to not be able to be parsed by JSON importing functions in python, MATLAB, etc.
Occasional duplicated locality precinct group result information
The below is based on the discussion of “Single Transferrable Vote” (“STV”) methods in [1], published in 1977. STV has more recently been called “Ranked Choice Voting” (RCV) or “Instant Runoff Voting” (IRF), among other names, by lobbying groups that are currently pushing for its incorporation into our voting systems. Irrespective of the name used, it represents a family of voting methods, with slightly different variants depending on how votes are removed and/or redistributed in each successive round of voting. [2][5]
What does STV/RCV/IRV entail, in general:
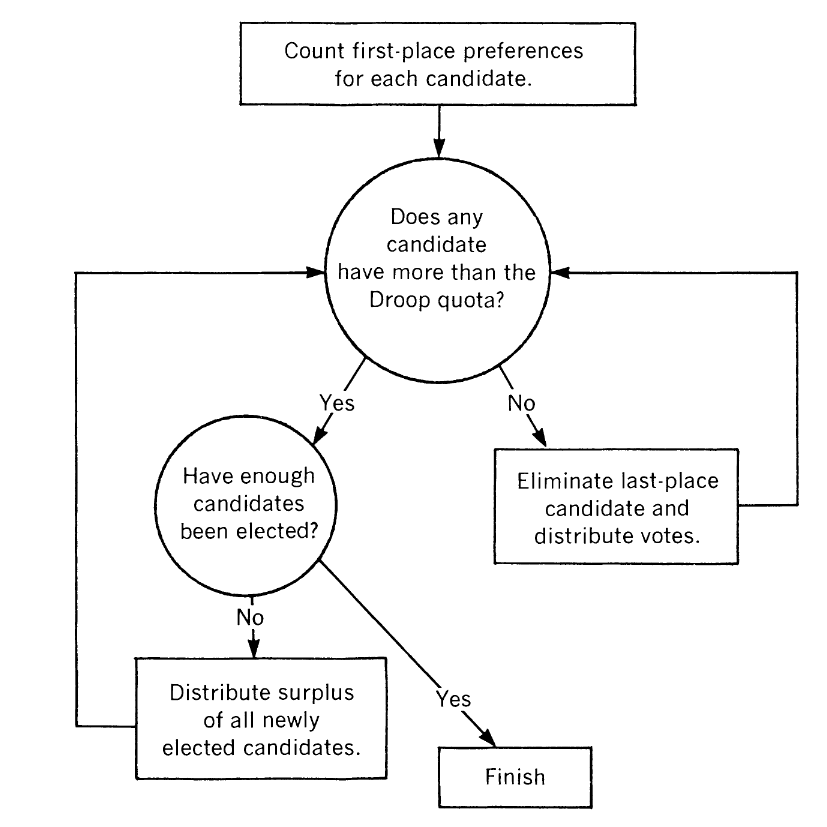
The core system is a proportional voting system, where voters are required to rank order their preferred candidate selections and all ballots are collected and centralized tabulation is performed in multiple rounds until winner(s), or candidates that have support above a specified quota (or “threshold”), are allocated.
A common definition of the quota utilized in STL/RCV/IRV systems is the “Droop quota”, and is defined as:
q = FLOOR( # of Voters / (# of Seats + 1) + 1)
In a given round the candidate with the least support is eliminated from further evaluation. Surplus votes from candidates that go over the droop threshold and votes from eliminated candidates can be distributed amongst remaining candidates for subsequent rounds. Surplus vote distribution is only applicable when multiple winners are allowed in a contest.
Vote allocation procedure for STV/RCV/IRV. Reprinted from [1].
The arguments used to support and push for RCV have not significantly changed since the time that the original paper was published, but the terms and language utilized have been modified. The authors note that much of the rationale in pushing for STV was centered around the ideas of inclusivity and making sure voters are able to cast “effective” ballots.
“Modem proponents emphasize the system’s effective representation of minorities, its sensitivity and accuracy in ‘measuring changes in popular will,’ and its tendency to encourage independent (nonparty line) voting.”
Doron, G., & Kronick, R. (1977) [1]
The same arguments have been recently repeated and pushed to legislators and the media. The name has changed from “Single Transferrable Vote” to “Ranked Choice Voting” or “Instant Runoff Voting”, but the argument remains largely the same, as can be seen by simply visiting the websites and promotional material for any of the current groups that are lobbying for RCV to be incorporated [3][4].
The issue pointed out by Doron & Kronick:
The authors in [1] note that the STV/RCV/IRV system allows for a “perversion” (their words, not mine) whereby a candidates chances to be selected as a winner can potentially be negatively impacted even when receiving increased support.
“… a function that permitted an increased vote for a candidate to cause a decline in that candidate’s rank in the social ordering-would probably strike most of us as a rather absurd, even perverse, method of arriving at a social choice. Consequently, some writers refer to this condition as the ‘Non-Perversity’ condition. All of the democratic social choice functions that have been considered in the literature were assumed to guarantee this condition, but the Single Transferrable Vote system does not.”
Doron, G., & Kronick, R. (1977) [1]
The authors present a hypothetical example to demonstrate the issue. Suppose we have 3 candidates (Candidate X, Candidate Y, Candidate Z) and two different voting groups, which we will refer to as group D and D’. Both D and D’ are fairly similar and only disagree on the relative ranking of two specific candidates.
In the tables below, recreated from [1], the only difference in the two voting group selections is that candidate X receives more support than candidate Y in group D’. However, if using the voting rules as described above candidate X wins in D, and loses in D’ even though X has increased support in D’.
# of Voters
First Choice
Second Choice
Third Choice
6
X
Y
Z
2
Y
X
Z
4
Y
Z
X
5
Z
X
Y
Voting group D selections. Reprinted from [1].
# of Voters
First Choice
Second Choice
Third Choice
6
X
Y
Z
2
X
Y
Z
4
Y
Z
X
5
Z
X
Y
Voting group D’ selections. Reprinted from [1].
There are 17 voters in each case, and only 1 seat available. Therefore, the Droop quota/threshold is 9 votes required in order to declare a winner.
In group D it is candidate Z that has the least amount of votes in the first round and is eliminated, therefore advancing 5 second-choice votes for X into the next round. Candidate X passes the threshold and wins in the second round.
In group D’, where candidate X received more support than candidate Y, it is candidate Y that has the least amount of votes in the first round and is eliminated, therefore advancing 4 second-choice votes for Z into the next round. Candidate Z then passes the threshold and wins in the second round.
Bibliography:
Doron, G., & Kronick, R. (1977). Single Transferrable Vote: An Example of a Perverse Social Choice Function. American Journal of Political Science, 21(2), 303–311. https://doi.org/10.2307/2110496
Brandt F, Conitzer V, Endriss U, Lang J, Procaccia AD, eds. Handbook of Computational Social Choice. Cambridge: Cambridge University Press; 2016. https://doi.org/10.1017/CBO9781107446984
Update (2023-12-14 12:00:00 EST) : Special thank you to Rick Michael of the Chesterfield Electoral board for checking their records on issues #1 and #2 below. There were 3 x Issue #1 records and 9 x Issue #2 records identified in Chesterfield County.
According to Rick, the records in question were populated and visible when looking via the electronic VERIS (the states election database) login available to the Registrar. The 3 x Issue #1 records can be found and are Active records in the electronic system, and the 9 x Issue #2 records had an update that moved the records from Inactive to Active that were not reflected in the data supplied to us.
That implies that the data that we purchased (for approximately $12,000) directly from the department of elections is inaccurate and incomplete. Our initial purchase and download of the June 30 Registered Voter List (RVL) database does not show the registrants identified in Issue #1, even though the Registrar can see them in their electronic terminal. And our Monthly Update Subscription (MUS) we receive is missing the updates showing the registrant records identified in Issue #2 being moved from Inactive to Active status.
The department of elections is required by federal law (NVRA, HAVA) to keep and maintain accurate election records AND to make those records accessible for inspection and verification, and for use by candidates and political parties. Additionally, we have paid (twice!) for this data; once as taxpayers, and once again as a 501c3 entity. If the data we, and other campaigns and candidates are receiving is not representative of the actual records in the database, incomplete and inaccurate … that needs to be addressed and fixed.
Summary:
Issue #1: There are 99 records of ballots cast, according to the VA Department of Elections (ELECT) Daily Absentee List (DAL) data file that do not have corresponding voter ID listed in Registered Voter List (RVL) data.
Issue #2: There are 380 records of ballots cast in the DAL where the corresponding RVL record has been listed as “Inactive” since June-30-2023 and no modification to the RVL record has taken place.
Issue #3: There are 18 records of ballots cast in the DAL where the corresponding RVL record is listed as “Inactive” as of Dec-01-2023, but there has been previous modifications to the RVL record since June-30-2023.
We are currently reaching out in attempts to contact the VA AG’s office and to provide them the details of this analysis in order to have these anomalies further investigated.
Data files utilized for this analysis:
Our 501c3 EPEC purchased and downloaded the full statewide VA RVL on June-30-2023 from ELECT. We additionally purchased the Monthly Update Service (MUS) package from ELECT, where on the 1st of each month we are provided a list of all of the changes that have occurred to the RVL in the previous month. By applying these changes to our baseline data file, we are able to update our copy of the RVL to reflect the latest state as per ELECT. We can also create a cumulative record of all entries associated with a particular voter ID by simply concatenating all of these datafiles.
Additionally, during the VA 2023 General Election, we purchased access to the Daily Absentee List (DAL) file generated by ELECT that documents all of the transactions associated with early mail-in or in-person voting during the 45 day early voting period. The DAL file we utilized for this analysis was downloaded from ELECT on Nov-13-2023 at 6am EST.
Identification of ballots cast via the DAL file can be performed by checking for rows of the DAL data table that have the APP_STATUS field set to “Approved” and have the BALLOT_STATUS field set to any of the following: “Marked” | “Pre-Processed” | “On Machine” | “FWAB” | “Provisional”.
Once cast ballots are identified in the DAL, the Voter Identification Number can be used to lookup all of the corresponding records in our cumulative RVL data. The data issues summarized above can be directly observed using this process. Due to VA law, we cannot publish the full specific records here in this blog but have summarized, captured and described our process and results.
For Issue #1: If there does not exist a corresponding registration record for cast ballots, then the voter should not have been able to have their mail-in ballot approved or issued, or been able to check-in to an early voting precinct to vote on-machine. If the voter record actually does exists, then why is it not reflected in the data that we purchased from ELECT. Note that all provisional and Same Day Registration (SDR) ballots were required to be entered into the states database (“VERIS”) by the Friday after the election (Fri Nov-10-2023). We specifically waited until we received the Dec-01-2023 MUS data update from ELECT to attempt to perform this or similar analysis in order to ensure that we would not be missing any last minute registrations or RVL updates.
For Issue #2: There are 380 records of ballots being cast in the DAL where the baseline June-30-2023 RVL data file shows the registrant as inactive, and there has been no modifications or adjustments to the record presented in the MUS data files. Therefore these registrants should still have been listed as “Inactive” during the early voting period which started in September through Election Day (Nov 7).
For issue #3: There are 18 records that show the cast ballot is from a registrant that is currently listed as “Inactive” but there has been adjustments to the registration record over the last 6 months. An example of such is below. Note that I have captured the MUS data file generation dates in the 5th column to note when the file was generated and received by us.
In the example given below, the first invalidation operation on the registration record appears in the MUS file dated Sep-01, with the earliest transaction date listed as Aug-29-2023. The ballot application was not received until Sept 26 according to the DAL, so the application should never have been approved or the ballot issued as the registrant status should have been “Invalid” according to the states own data.
(Also … yes … I know there is a typo in the spelling of “APP_RECIEPT_DATE” in the tables below … but this is the data as it comes from ELECT).
APP_RECIEPT_DATE
APP_STATUS
BALLOT_RECEIPT_DATE
BALLOT_STATUS
“2023-09-26 00:00:00”
Approved
“2023-10-19 00:00:00”
Pre-Processed
Example Extract of a DAL data record for a mail-in ballot cast during early voting.
TRANSACTIONDATE
TRANSACTIONTIME
Trans_Type
NVRAReasonCode
File Source
30-June-2023
12:12:00
BASELINE
BASELINE
Baseline RVL
28-Jul-2023
09:34:03
MODIFY
Change Out
MUS 08/01/2023
28-Jul-2023
09:34:04
MODIFY
Address Change
MUS 08/01/2023
28-Jul-2023
09:34:04
MODIFY
Change In
MUS 09/01/2023
28-Jul-2023
09:34:03
MODIFY
Change Out
MUS 09/01/2023
28-Jul-2023
09:34:04
MODIFY
Address Change
MUS 09/01/2023
28-Jul-2023
09:34:04
MODIFY
Change In
MUS 09/01/2023
29-Aug-2023
11:55:49
MODIFY
Inactivate
MUS 09/01/2023
29-Aug-2023
11:55:49
MODIFY
Inactivate
MUS 10/01/2023
Extract of RVL Cumulative Data Records for Voter ID in above DAL entry