Categories
Election Data Analysis Election Forensics Election Integrity Interesting programming technical

Potential duplicate registrants in VA voter list via Hamming Distance

Using the 2022-11-23 Registered Voter List (RVL) and the 2023-01-26 Voter History List (VHL) purchased from the VA Department of Elections (ELECT) I wrote up an analysis script to check for potentially duplicated registrant records in the RVL and cross reference duplicate pairings with the VHL to identify potential duplicate votes. The details are summarized below.

Please note that I will not publish voter Personally Identifiable Information (PII) on this blog. I have substituted fictitious PII information for all examples given below, and cryptographically hashed all voter information in the downloadable results file. I will make available the detailed information to those that have the authorization to receive and process voter data upon request (contact us).

Summary of Results:

We should mathematically expect approximately 11 exact string collisions in the full RVL dataset when comparing (First Name + Middle Name + Last Name + Suffix + Full DOB), but instead we see 1982 such collisions, which is over an order of magnitude increase from the expected value. While its possible that some of these collisions are false positives, there are quite a number of them that are deserving of further scrutiny.

Method:

For every entry in the latest RVL, I performed a string distance comparison, based on Hamming distance, between every possible pair of strings of (FIRST NAME + MIDDLE NAME + LAST NAME + SUFFIX + FULL DOB).  So for the ~6M different RVL entries, we need to compute ~3.6 x 10^13 different string comparisons. A hamming distance of 0 indicates the strings being compared are identical, a hamming distance of 1 indicates that there is a single character different between the two strings, a hamming distance of 2 indicates 2 characters are different, etc.  This obviously is a very computationally intensive process and it took over two days to complete the processing, once I got the bugs worked out.  (I’ve been quietly working on this one for a while now … )

Note that the Hamming distance only compares each respective position in a string and does not account for adding or removing a character completely from a string. A metric that does include addition and subtraction is the Levenshtein Edit Distance, which is much more computationally expensive (but more rigorous) metric. The Hamming distance is related to the Levenshtein distance in that it is mathematically the upper bound on the Levenshtein distance for arbitrary strings. I haven’t yet finished making an optimized GPU accelerated version of the Levenshtein edit distance metric, but it is in the works and I will redo this analysis with the new metric once that is completed.

I aggregated all of the Hamming distance pairings that were less than or equal to 3 characters different in order to identify potential (key word) duplicated registrants, and additionally for each pairing looked at the voter history information for each registrant in the pair to determine if there was a potential (again … key word) for multiple ballots to be cast by the same person in any given election.  As we allow for more characters to be different, we potentially are including many more likely false positive matches, even if we are catching more true positives.

For example: At a Hamming distance of 4 the strings of “Dave Joseph Smith M 10/01/1981” and “Tony Joseph Smith M 10/01/1981” at the same address would produce a potential match, but so would “Davey Joseph Smith M 10/01/1981” and “David Josiph Smith M 10/02/1981”. The first pair is more likely to be a false positive due to twins, while the second is more likely to be due to typo’s, mistakes, or use of nicknames and might warrant further investigation. A much stronger potential match would be something like “David Josiph Smith M 10/01/1981” and “David Joseph Smith M 10/01/1981”, with a Hamming distance of 1 at the same address. In an attempt to limit false positives, I have clamped the Hamming distance checks to <= 3 in this analysis.

One of the drawbacks of using Hamming distance over a more complete metric such as Levenshtein, is that the Hamming distance would give a very high score, and would therefore filter out of our results, an example pairing such as: “David Joseph Smith M 10/01/1981” and “Dave Joseph Smith M 10/01/1981”. The change from “id” to “e” adds/subtracts a character making the rest of the characters in the remainder of the string shift position and also not match. A Levenshtein metric would correctly return a small distance of 2, whereas the hamming distance returns 27. (As mentioned earlier, I am working on a Levenshtein implementation, but it is not yet complete.)

Note that with the official records obtained from ELECT, and in accordance with the laws of VA, I do not have access to the social security number or drivers license numbers for each registration record, which would help in identifying and discriminating potential duplicate errors vs things like twins, etc. I only have the first name, middle name, last name, suffix, month of birth, day of birth, year of birth, gender, and address information that I can work with.  I can therefore only take things so far before someone else (with investigative authority and ability to access those other fields) would need to step in and confirm and validate these findings.

Results:

The summary totals are as follows, with detailed examples.

Hamming Distance0123
Number of Potential Duplicate Registrant Pairs1982327621864120642
Number of Potential Duplicate Ballots110324831210175872
Number of Potential Duplicate Voters5613261325274918

According to my derivations and simulations that are described in detail at the end of this article, we should only expect to see an average of 11 (+/- 3) potential duplicate pairs (a.k.a. “collisions”) at a Hamming distance of 0. This is over two orders of magnitude different than what we observe in the compiled results table above. Such a discrepancy deserves further investigation and verification.

Examples of Types of Issues Observed:

NOTE THE BELOW INFORMATION HAS HAD THE VOTER PERSONALLY IDENTIFIABLE INFORMATION (“PII”) FICTIONALIZED. WHILE THESE ARE BASED ON REAL DATA TO ILLUSTRATE THE DIFFERENT TYPES OF OBSERVATIONS, THEY DO NOT REPRESENT REAL VOTER INFORMATION.

Example #1: The following set of records has the exact match (Hamming Distance = 0) of full name and full birthdate (including year), but different address and different voter ID numbers AND there was a vote cast from each of those unique voter ID’s in the 2020 General Election.  While it’s remotely possible that two individuals share the exact same name, month, day and year of birth … it is probabilistically unlikely (see section below on mathematical derivation of probabilities if interested), and should warrant further scrutiny.

Voter Record A:

AMY BETH McVOTER 12/05/1970 F 12345 CITIZEN CT

Voter Record B:

AMY BETH McVOTER 12/05/1970 F 5678 McPUBLIC DR

Example #2: This set of records has a single character different (Hamming distance of 1) in their first name, but middle name, last name, birthdate and address are identical AND both records are associated with votes that were cast in the 2020, 2021, and 2022 November General Elections.  While it is possible that this is a pair of 23 year old twins (with same middle names) that live together, it at least bears looking into.

Voter Record A:

TAYLOR DAVID VOTER 02/16/2000 M 6543 OVERLOOK AVE NW

Voter Record B:

DAYLOR DAVID VOTER 02/16/2000 M 6543 OVERLOOK AVE NW

Example #3: This set of records has two characters different (Hamming distance of 2) in their birthdate, but name and address are identical AND the birth years are too close together for a child/parent relationship, AND both records are associated with votes that were cast in the 2020 and 2022 November General Elections. 

Voter Record A:

REGINA DESEREE MACGUFFIN 02/05/1973 F 123 POPE AVE

Voter Record B:

REGINA DESEREE MACGUFFIN 03/07/1973 F 123 POPE AVE

Example #4: This set of records has again a single character different (Hamming distance of 1) in the first name (but not the first letter this time) and the last name, birthdate and address are identical.  There were also multiple votes cast in the 2019 and 2022 November General from these registrants.

Voter Record A:

EDGARD JOHNSON 10/19/1981 M 5498 PAGELAND BLVD

Voter Record B:

EDUARD JOHNSON 10/19/1981 M 5498 PAGELAND BLVD

Example #5: This set of records has two characters different (Hamming distance of 2) in the first and middle names and the last name, birthdate, gender and address are identical.  There were also multiple votes cast in the 2021 and 2022 November General from these registrants. Again it is possible that these records represent a set of twins given the information that ELECT provides.

Voter Record A:

ALANA JAVETTE THOMPSON 01/01/2003 F 123 CHARITY LN

Voter Record B:

ALAYA YAVETTE THOMPSON 01/01/2003 F 123 CHARITY LN

Example #6: The following set of records has the exact match (Hamming Distance = 0) of full name and full birthdate (including year), and same address but different voter ID numbers.  There was no duplicated votes in the same election detected between the two ID numbers.

Voter Record A:

JAMES TIBERIUS KIRK 03/22/2223 M 1701 Enterprise Bridge

Voter Record B:

JAMES TIBERIUS KIRK 03/22/2223 M 1701 Enterprise Bridge

Example #7: The following set of records has the exact match (Hamming Distance = 0) of full name and full birthdate (including year), same address but different gender and voter ID numbers.  There was no duplicated votes in the same election detected between the two ID numbers.

Voter Record A:

MAXWELL QUAID CLINGER 11/03/2004 M 4077 MASH DR

Voter Record B:

MAXWELL QUAID CLINGER 11/03/2004 U 4077 MASH DR

Results Dataset:

A full version of the aggregated excel data is provided below, however all voter information (ID, first name, middle name, last name, dob, gender, address) have been removed and replaced by a one-way hash number, with randomized salt, based on the voter ID. The full file with specific voter information can be provided to parties authorized by ELECT to recieve and process voter information, Election Officials, or Law Enforcement upon request.

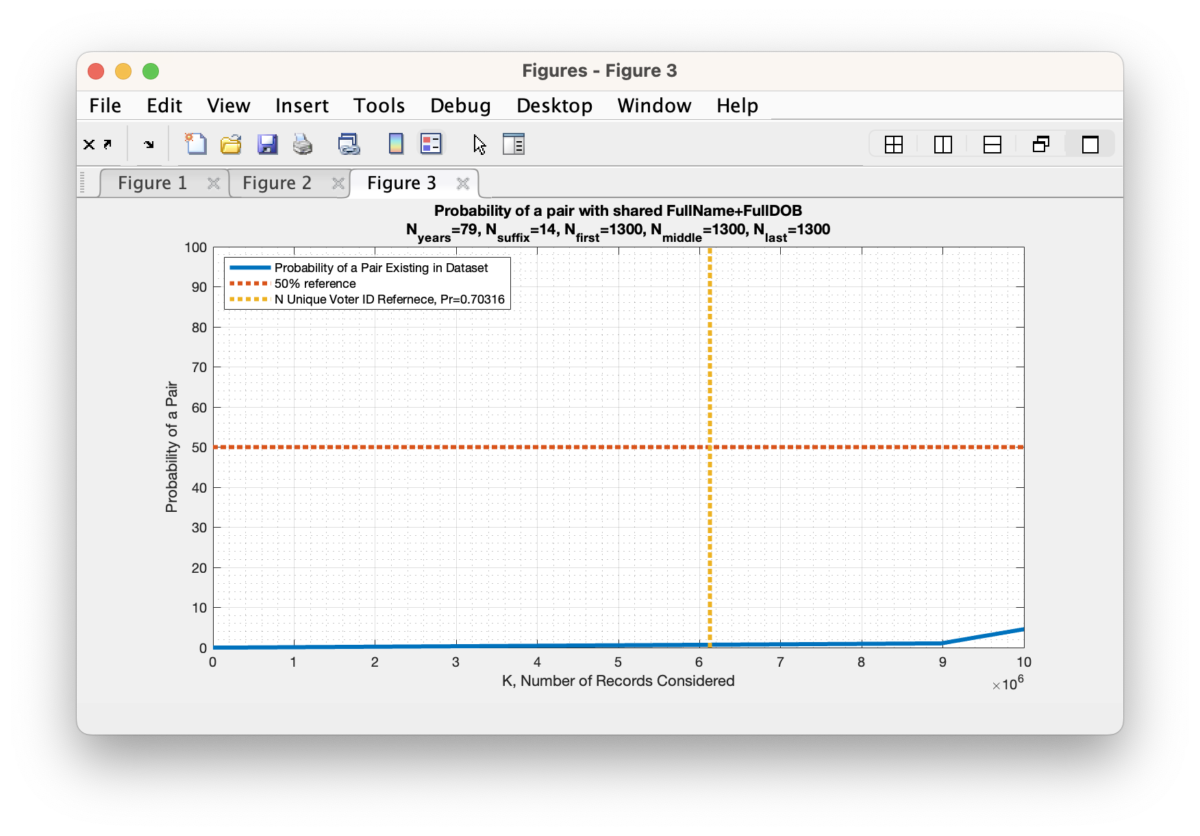
On the mathematical probability of matches:

Below I present the theory and derivation as to how I arrived at the expected value of 11 collisions (+/- 3) as mentioned above. I’ve tried to make the derivation below as digestible as possible, with accessible references, but it is admittedly still a very technical read. I think its important to “show my work” on the subject, though, and I present it here and am happy to take comments and criticism (contact).

Q: How much of a chance do we actually have of getting an exact (Hamming distance of 0) collision in the full name and full date of birth? Well, there is a similar and well known probability puzzle that asks how many random people do you need to approximately have a 50% chance of 2 of them sharing the same birthday (not including the year of birth). This is known as the “Birthday Problem” in probability theory, and rather surprisingly, the answer is that you only need about 23 people in your population sample to have a 50% probability that 2 of those people will share a day-of-year of birth. To quote the wikipedia article on the matter “… While it may seem surprising that only 23 individuals are required to reach a 50% probability of a shared birthday, this result is made more intuitive by considering that the birthday comparisons will be made between every possible pair of individuals. With 23 individuals, there are 23 × 22/2 = 253 pairs to consider, far more than half the number of days in a year.” The same mathematics of the birthday problem is the basis of the Birthday Attack cryptographic exploit, and it is therefore a well-studied problem in cryptography and cyber security.

Figure 1: The computed probability of at least two people sharing a birthday versus the number of people. A recreation of the classic “Birthday Problem”.

Now, as interesting as the toy birthday problem is as described above, it is over simplified for the problem we are looking at here. Firstly, the problem setup assumes independent and identically distributed random variable (e.g. an “IID” set of variables). While this is not exactly the case, the IID assumption provides for a computable first order estimate, and in the case of the classical birthday problem the estimate has been shown to be fairly accurate under experimental conditions.

Secondly, when we start additionally considering the year of birth, or sharing of first names, middle names and last names, things get much more complicated to compute, but the method is the same. We want to determine the probability of 2 people sharing the same First Name, Middle Name, Last Name, Suffix, Month-of-Birth, Day-of-Birth and Year-of-Birth in the population of unique registrants in the Registered Voter List. This means that in addition to the 365 day-of-birth possibilities, we need to estimate the number of possible years to cover, the number of possible first names, the number of possible middle names, the number of possible last names, the number of possible suffix strings and then include these possibilities into the same formulation as the birthday problem setup.

For determining how many years we should cover, I will simply use the average life expectancy of approximately 79 years. We can therefore update our N value of the birthday problem from 365 to 365 * 79 = 28835. When we perform the same analysis as the standard birthday problem with just this new parameter included, we end up needing 200 people in our sample population to have a 50% probability of of 2 people having a match.

Figure 2: The computed probability of at least two people sharing a birthday versus the number of people in the sample population. A recreation of the classic “Birthday Problem”, but we’ve updated the analysis to include the year of birth, and assumed the average life expectancy of 79 years. This moves the 50% crossover point to a population size of 200 from 23 for the standard Birthday Problem setup.

A similar analysis can be done with the number of names being considered, etc. For each (assumed independent and uniform) variable we add to the setup, we multiply the number of possible states (N) by the number of unique variable settings.

We can estimate the universe of possible names using the frequentist method from the RVL data itself: We know that we have 6,127,859 unique voter ID’s in the RVL, and there are 14 unique SUFFIX entries, 291,368 unique FIRST names, 405,591 unique MIDDLE names, and 465,185 unique LAST names. So multiplying out 365 x 79 x 14 x 291368 x 405591 x 465185 = 2.22 x 10^22 potential states to consider.

Now unfortunately, as we start dealing with bigger and bigger N values the ability of computers to maintain the necessary precision to carry out the mathematics for direct computation becomes harder and harder, eventually resulting in Infinite or divide-by-zero answers as the probabilities get smaller and smaller. So lets begin by first determining if we can find the 50% crossover point for the unique voter ID population size. We find that we only need 410 unique First, Middle, and Last names (each) to break the 50% probability limit.

Figure 3: The computed probability of at least two people sharing a first name, middle name, last name, suffix, month-of-birth, day-of-birth, year-of-birth versus the number of people in the sample population. This assumes the Nyears = 79, Nsuffix = 14, Nfirst = 410, Nmiddle = 410, Nlast = 410.

As we increase the number of unique (first, middle, last) names under consideration, we find that we very quickly reduce the probability to near zero (again … this is assuming an IID set of variables … more on that later). In fact we only need to assume that there are 1300 unique first names, middle names and last names before the probability drops to under 1%. This is two full orders of magnitude below the actual number of unique first names, middle names and last names (each) that we find by simple examination of the RVL file, so the actual probability of a collision under these conditions should be much, much, much lower. While not exactly zero, it is computationally indistinguishable from zero given machine precision. Note (again) that this formulation is still simplified in that it assumes a uniform distribution within the N possible states, but it still serves to give a first order approximation and sanity check.

Figure 4: The computed probability of at least two people sharing a first name, middle name, last name, suffix, month-of-birth, day-of-birth, year-of-birth versus the number of people in the sample population. This assumes the Nyears = 79, Nsuffix = 14, Nfirst = 1300, Nmiddle = 1300, Nlast = 1300.

As we start approaching the limit of computational precision we have to resort to approximation methods for computing the very small, but non-zero probability of collision given the actual number of unique first, middle and last names observed in the RVL dataset. We can use the Taylor series expansion for small powers in order to do this, and our equation for computing the probability becomes: Pb = 1 – exp(-k*(k-1) / (2 *N)).

Replicating our earlier example in Figure 4 above with Nfirst == Nmiddle == Nlast == 1300 to show the comparison of the Taylor expansion to the explicit computation produces the graphic in Figure 5 below. We see that the small value approximation is close, but slightly over-estimates the directly computed probability for IID variables.

Figure 5: The computed probability of at least two people sharing a first name, middle name, last name, suffix, month-of-birth, day-of-birth, year-of-birth versus the number of people in the sample population. This assumes the Nyears = 79, Nsuffix = 14, Nfirst = 1300, Nmiddle = 1300, Nlast = 1300.

When we perform this Taylor series approximation and look to find the number of records required in order to obtain a 50% probability that any 2 records would match given our updated universe of possible matches, we end up with requiring K = 176,000,000,000, or 176 Billion records. When we again try to evaluate the Taylor series for the explicit number of unique Voter ID’s present in the RVL file, which is just over 6M, we again obtain a number that is computationally indistinguishable from 0. (To be absolutely meticulous … its a bigger number that is indistinguishable from 0 than we previously computed, but it is still indistinguishable from zero.)

Figure 5: The computed probability of at least two people sharing a first name, middle name, last name, suffix, month-of-birth, day-of-birth, year-of-birth versus the number of people in the sample population. This assumes the Nyears = 79, Nsuffix = 14, Nfirst = 291368, Nmiddle = 405591, Nlast = 465185, and the computed 50% crossover point occurs at approximately 176 Billion samples required.

Another Implementation note: In order to explicitly code the above direct computations we also need to do some clever tricks with logarithms in order to avoid numerical overflow / underflow issues as much as possible. The formula for computing the permutations, which is N! / (N-K)! = N x (N-1) x … x (N-K+1) can have numerical issues when N becomes large. However if we take the base-10 logarithm of the equation, we can use the product and quotient rules of logarithms to compute the result and avoid numerical overflow: log10( N! / (N-K)! ) = log10(N!) – log((N-K)!) = log10(N) + log10(N-1) + … + … log10(N-K+1), which is a much more stable computation.

We can perform a similar trick in order to compute the denominator of N^k by using the power property of logarithms such that log10( N^k ) = k x log10(N).

You must of course remember to reverse the logarithm once you’ve computed the log-sums. So the final computation of Pb becomes the following:

Vnr = log10(N) + log10(N-1) + … + … log10(N-K+1), where N is the number of possible states N = 365 x Nyears x Nfirst x Nmiddle x Nlast x Nsuffix.

Vt = k x log10(N)

Pa_log10 = Vnr – Vt = log10(Pa) = log10(Vnr/Vt)

Pb = 1 – 10^(Pa)

Updating from uniform distributions to non-uniform distributions

So what happens when we take into account the fact that names and birthdays are not uniformly distributed? (e.g. the last name of “Smith” is more frequent than “Sandeval”) This fact increases the probability of a collision occurring in the dataset. This increase also makes intuitive sense as we can anecdotally observe that coincident names and birthdates, while still rare … do actually happen in real life with common names.

However, in the non-uniform case we don’t have as nearly of a nice closed set of formulas for computing the probability. What we can do instead to estimate the probability is perform a number of Monte Carlo simulations of selecting K values from the weighted possibilities, and determine how many collisions occurred in each simulation trial. By setting K equal to the number of unique Voter ID values in the RVL dataset, we can directly answer the question via simulation of “how many collisions of First+Middle+Last+Suffix+DOB should we expect when looking at the VA Registered Voter List file“?

We can determine the weightings for each variable easily enough from the distributions of unique values in the data itself.

The below MATLAB weightedCollisionSim(…) function is a program that can be used to perform this analysis. It assumes that the RVL table object is a global variable to setup the trials, and uses the MATLAB built-in randsample(…) function to perform each draw.

After 100 simulation runs, the results are that for the K=6,127,859 unique voter ID’s in the RVL, we should expect to have an average of about 11 collisions at Hamming distance of 0, with a standard deviation of roughly 3.

I will note that as a validation and verification step, the MATLAB simulation code below, when used with uniform sampling, produces similar results to what we analytically derived above.

function [p,m,s] = weightedCollisionSim(k,ntrials,varargin)
% To compute the probability the ntrials must be >> 1:
% [p,m,s] = weightedCollisionSim(k,ntrials,values1,weights1,...,values2,weights2)
% [p,m,s] = weightedCollisionSim(k,ntrials,Nvalues1,weights1,...,Nvalues2,weights2)
%
% OUTPUTS:
% p = Probability of a collision
% m = mean number of collisions
% s = standard deviation of collisions

if nargin == 0
    global rvl; % Assume the RVL is an available global var

    ntrials = 100; % Number of trials
   
    % Population size set as num of unique voter IDs in RVL
    npop = numel(unique(rvl.IDENTIFICATION_NUMBER));

    % Convert the DOB strings to datetime objects
    dob = datetime(rvl.DOB);

    % How many unique days of the year are there?
    [ud,uda,udb] = unique(day(dob,'dayofyear'));
    % How often do they occur?
    nud = accumarray(udb,1,[numel(ud),1]);
    Ndays = numel(ud);

    % How many unique years of birth are there?
    [uy,uya,uyb] = unique(year(dob));
    % How often do they occur?
    nuy = accumarray(uyb,1,[numel(uy),1]);
    Nyears = numel(uy);

    % How many unique suffix strings are there?
    [us,usa,usb] = unique(rvl.SUFFIX);
    % How often do they occur?
    nus = accumarray(usb,1,[numel(us),1]);
    Nsuffix = numel(us);

    % How many unique first names are there?
    [uf,ufa,ufb] = unique(rvl.FIRST_NAME);
    % How often do they occur?
    nuf = accumarray(ufb,1,[numel(uf),1]);
    Nfirst = numel(uf);

    % How many unique middle names are there?
    [um,uma,umb] = unique(rvl.MIDDLE_NAME);
    % How often do they occur?
    num = accumarray(umb,1,[numel(um),1])
    Nmiddle = numel(um);

    % How many unique last names are there?
    [ul,ula,ulb] = unique(rvl.LAST_NAME);
    % How often do they occur?
    nul = accumarray(ulb,1,[numel(ul),1]);
    Nlast = numel(ul);
        
    % Initializing the weighting vectors
    w0 = nus;
    w1 = nud;
    w2 = nuy;
    w3 = nuf;
    w4 = num;
    w5 = nul;

    % Recursively compute results and return
    [p,m,s] = weightedCollisionSim(npop,ntrials,1:Nsuffix,w0,1:Ndays,w1,1:Nyears,w2,...
        1:Nfirst,w3,1:Nmiddle,w4,1:Nlast,w5);
    return
end

if nargin < 2 || isempty(ntrials)
    ntrials = 1;
end

nc = zeros(ntrials,1);
for j = 1:ntrials
    fprintf('Trial %d\n',j);
    y = zeros(k,numel(varargin)/2);
    m = 1;
    for i = 1:2:numel(varargin)
        w = varargin{i+1};
        v = varargin{i};
        if ~isempty(w) && isvector(w)
            % Non-uniform weightings
            y(:,m) = randsample(v,k,true,w);
        else
            % Uniform sampling
            y(:,m) = randsample(v,k,true);
        end
        m = m+1;
    end
    [u,~,ib] = unique(y,'rows');
    nu = accumarray(ib,1,[size(u,1),1]);
    nc(j) = sum(nu > 1);
end
p = mean(nc>0);
m = mean(nc);
s = std(nc);
Categories
Election Data Analysis Election Forensics Election Integrity technical

Discrepancies between official VA turnout report and Voter History information

Now that the Voter History List and corresponding list of those who voted in the 11-08-2022 November General election has been released by the VA dept. of elections (“ELECT”), we have compiled and compared the results from the official turnout statistics on the ELECT website (here) to the information contained in both the Daily Absentee List (“DAL”) and Voter History List (“VHL”) information.

These are all “official” datasets provided by ELECT, and they should theoretically all match. However, there are a number of discrepancies in the official records that need to be explained. Performing simple differences between the accumulated totals for each locality exposes these issues. For example:

  • Why does the official results on the ELECT website show the total number of ballots cast for Albemarle County to be 11,105 less than the number of ballots recorded in the VHL? Why do the DAL file records show 11,429 more cast absentee (Early or Mail) ballots than the ELECT official results in Albemarle County? A: The Albemarle electoral board looked into this matter when we brought it to their attention and they reported that the registrar had made a transcription error and submitted the wrong line when submitting the election results to ELECT. While mistakes do happen, this explanation still begs the question as to why did ELECT not catch or flag these discrepancies, and what procedures are in place to prevent, catch or rectify these issues.
  • Why does Richmond City show 25,500 more ballots cast in the official turnout results on the ELECT website than are present in the VHL? Why are there 325 more absentee (Early or Mail) ballots in the ELECT website data than the DAL file?
  • Why is the sum of the absolute value of discrepancies between the VHL and the official results on the ELECT website 69,381?
  • Why is the sum of the absolute value of discrepancies in absentee ballots (Early or Mail) between the DAL and the official results on the ELECT website 28,515?
  • Why does the VHL data records contain zero “Election Day” records for Covington City?
  • … etc

We have notified a number of local electoral board members, registrars and election integrity groups, and postponed publishing this data until after they were able to validate the existence of these discrepancies, in the hopes that they can discover the source of the discrepancies and rectify the issues.

As a further dive into the data, we also computed and noted the following additional issues. Documentation on these specific discrepancies are available upon request by entities that are able to receive and process election data according to VA law and ELECT requirements. We will not publish the details publicly on this blog as they reveal personal voter information, but will give the summary results below. Please contact us for further information.

  • There were 3,354 records of valid absentee ballots cast recorded in the VHL that did not have corresponding entries (matched by voter ID) in the DAL record.
  • There were also 19,723 records of valid absentee ballots cast recorded in the DAL that did not have corresponding entries (matched by voter ID) in the VHL record.
  • The VHL contained 6 records of ballots cast in the VA Nov 2022 election that do not have a corresponding registration record in the Registered Voter List (RVL) dated 11/23/2022.
  • The VHL contained 93 records of ballots cast in any election that do not have a corresponding registration record in the Registered Voter List (RVL) dated 11/23/2022.
  • The 11/23/2022 statewide RVL contained 1,197 records that had duplicate records with different voter IDs, based on performing an exact match to first name, middle name, last name, suffix, full date-of-birth, and gender.

Background and Methodology:

The DAL file is supposed to track all of the transactions for the non-election day ballots for a specific election. This includes any Mail-In or Early In-Person ballots. (Any non-election day ballot is considered to be an “absentee” ballot in VA.) It is updated daily throughout the course of the election and is finalized once the election is certified. The VA 2022 election was certified by all of the localities by 11-18-2022. The last version of the DAL file we purchased and obtained from ELECT and used for this analysis was dated 12/13/2022, and it had been unchanged for a number of weeks by that point. We downloaded and archived copies of the DAL file multiple times per day in order to track the changes near-real-time over the course of the election cycle. (The day-to-day changes to the DAL records over time are documented in other blog entries.)

The VHL is updated by election officials after the election has concluded by adding the “voter credit” into VERIS (the state election database) for all registered voters that cast a ballot in the election (either absentee or on election day). The VHL contains information covering the last 4 years of election history for each currently registered voter. As of mid-January we were informed that all of the voter credit updates had been completed in the VERIS database for the 2022 General Election. (Why this isn’t done automatically similar to the DAL file entries and made available before election certification?) The version of the VHL that we purchased and obtained from ELECT and used for this analysis is from 1/26/2023. We specifically tried to time our purchase of the VHL to occur after the voter credit updates had been completed but before the scheduled maintenance process of removing longstanding “inactive” voters had taken place. We note that even if some “Inactive” voters had been removed from the VHL by the time we purchased the VHL, that should not impact this analysis, as the act of voting in the 2022 election would require the voters status to be listed as “Active”.

The “official” turnout report page on the ELECT website (here, again) was downloaded and converted to an excel spreadsheet on 2/4/2023. The notes on the website page is that the information content was last updated on 12/06/2022. (We have archived a pdf copy of the site as we downloaded it for reference attached to the bottom of this post.) All of the local electoral boards had completed their canvass by 11/18/2022 and submitted their information to ELECT, so there is no reason that this information should be missing any data.

The official turnout results from ELECT tabulate the Early Voting, Election Day, By Mail, and Provisional ballots cast and accounted for during the 2022 General Election. The DAL file includes information as to the Mail-In, Early Voting, and Absentee Provisional ballots cast. The VHL contains information as to all voters who cast a ballot in the election, and broken down by Election Day, Absentee (either Early or Mail-In), and Provisionals for each sub-group. Theoretically all of these data files should match exactly.

We note that there is a known issue that could potentially, but rarely, cause the number of ballots reported in the VHL to be strictly less than the number of ballots in the official results reported on the ELECT webpage. Due to the time delay between the close of the election and the update and publication of the VHL, there can be registrants that have been legitimately removed due to death, etc during that interval and their corresponding voting record is also removed when that happens. In the data presented below, this would manifest as a positive (+) discrepancy, but even so, these numbers should be relatively small.

We also again note that we made every effort to purchase the VHL dataset after all of the voter credit information was updated but before the department of elections performed their annual removal of records that had been inactive for more than 2 federal elections. Even so, if the voter was “inactive” and slated for removal, they wouldn’t be showing up in the count of ballots cast anyway. The act of casting a ballot immediately moves a voter into the “active” category.

The official turnout results are collated by locality, so we took the DAL and VHL information and accumulated their tallies to match the official turnout report breakdown. We then subtracted the DAL +/or VHL results from the official results to determine how much of a discrepancy exists between each of the datasets.

Terminology:

  • delta EV (DAL): This is the change in the Early Vote ballot numbers as calculated by subtracting the DAL “On Machine” ballots from the official turnout report “Early Vote” tally.
  • delta ByMail (DAL): This is the change in the Mail In ballot numbers as calculated by subtracting the DAL (“Pre-Processed” + “Marked”) ballots from the official turnout report “Mail In” tally.
  • Net DAL: The net sum of the DAL differences in each locality
  • Sum Abs Value DAL: The sum of the absolute values of the DAL differences in each locality.
  • delta ED (VHL): This is the change in Election Day ballot numbers as calculated by subtracting the VHL (“Election Day” AND NOT “Provisional”) ballots from the official turnout report “Election Day” tally.
  • delta Provisional (VHL): This is the change in Provisional ballot numbers as calculated by subtracting the VHL “Provisional” ballot total from the official turnout report “Provisional” tally.
  • delta Early or Mail (VHL):  This is the change in Early OR Mail-In ballot numbers as calculated by subtracting the VHL (“Absentee” AND NOT “Provisional”) ballots from the official turnout report (“Early Voting” + “Mail In”) tally.
  • delta Provisional (VHL): This is the change in Provisional ballot numbers as calculated by subtracting the VHL “Provisional” ballots from the official turnout report “Provisional” tally.
  • Net VHL: The net sum of the VHL differences for each locality   
  • Sum Abs Value VHL: The sum of the absolute values of the VHL differences for each locality

Data Results:

We present the data and results in the following EXCEL spreadsheet. Tab 1 is the ELECT website data with differences between the DAL and VHL data on the right hand side. Tab 2 is the accumulated DAL data by locality. Tab 3 is the accumulated VHL data by locality.

The screen capture of the ELECT website data from 2/4/2023 is also here:

https://digitalpollwatchers.org/wp-content/uploads/2023/02/ELECT-Turnout-Results-Screenshot-2023-02-04-1.pdf