Categories
Election Data Analysis Election Forensics Election Integrity programming technical

Nationwide Nursing Home, Hospice Care and Assisted Living Facilities listing

Many election integrity investigators are looking through registration records and trying to find suspicious registrations based on the number of records attributed to a specific address as an initial way of identifying records of interest and of need of further scrutiny. This can often produce false positives for things like nursing homes, college dormitories, etc. Additionally, one of the concerns that has been raised is the risk of potential elder abuse, ID theft, manipulation or improper use of ballots for occupants of nursing home, hospice care or assisted living facilities.

According to https://npino.com : “The National Provider Identifier (NPI) is a unique identification number for covered health care providers (doctors, dentists, chiropractors, nurses and other medical staff). The NPI is a 10-digit, intelligence-free numeric identifier. This means that the numbers do not carry other information about healthcare providers, such as the state in which they live or their medical specialty. The NPI must be used in lieu of legacy provider identifiers in the HIPAA standards transactions. Covered health care providers and all health plans and health care clearing houses must use the NPIs in the administrative and financial transactions adopted under HIPAA (Health Insurance Portability and Accountability Act).”

I’ve compiled a list of every nursing home, hospice care, or assisted living facility in the country based on their current NPI code. I have mirrored and scraped the entire https://npino.com site as of 5-23-2022 and compiled the list of nationwide Nursing homes, Assisted Living and Hospice Care facilities into the below CSV file and am presenting it here in the hopes that it is useful for other researchers. I did do a small amount of regular expression based cleanup to the entries (e.x. // replacing “Ste.” with “Suite”, fixing whitespace issues, etc.) as well as manually addressing a handful of obviously incorrect addresses (e.x. // repeated/spliced street addresses, etc.).

Categories
Election Data Analysis Election Forensics Election Integrity Interesting programming technical

2021 VA Election Fingerprints

I finally had some time to put this together.

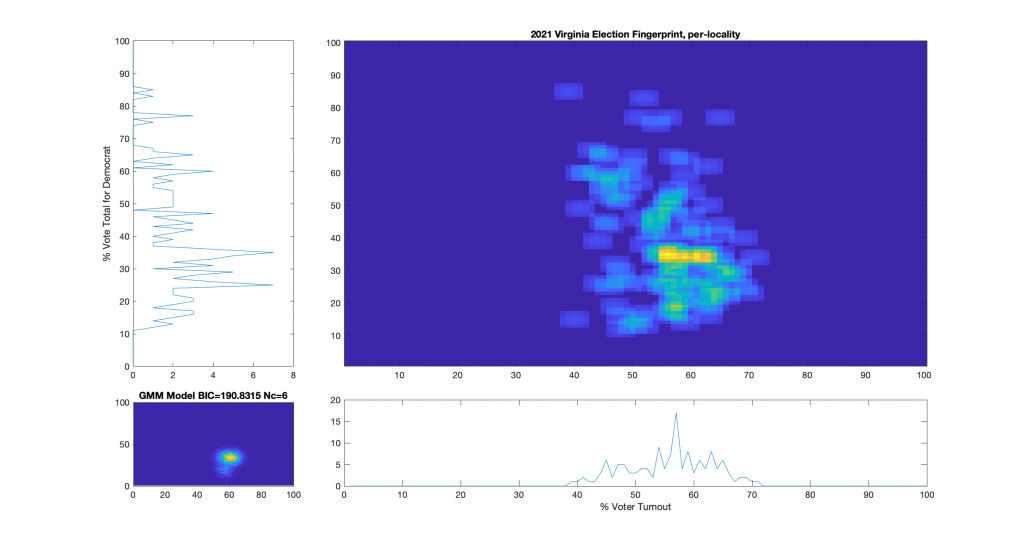
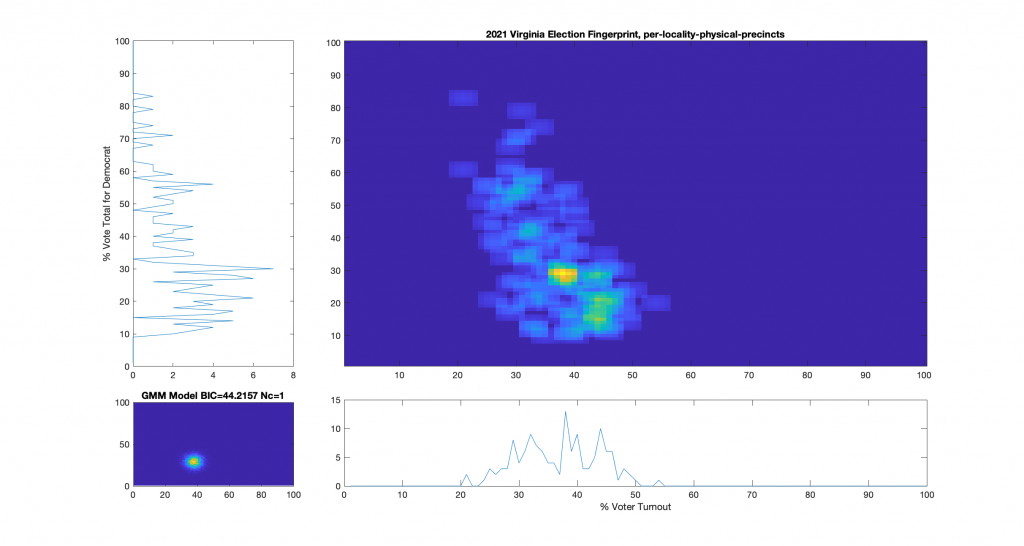
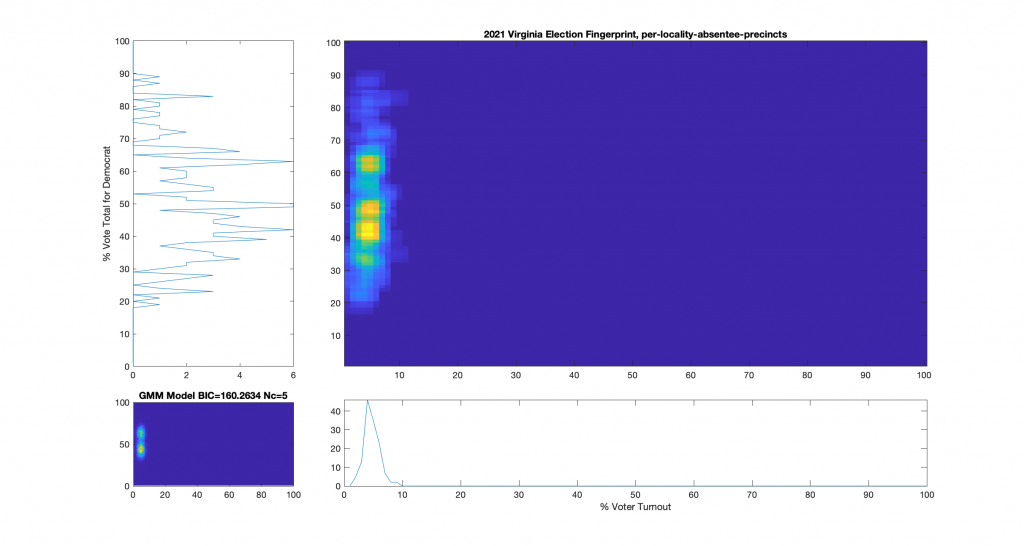
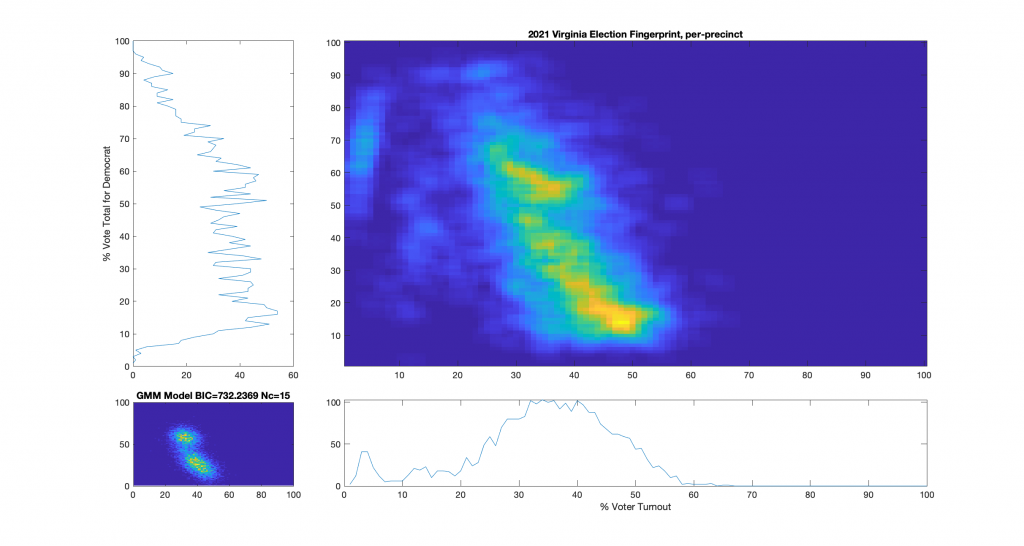
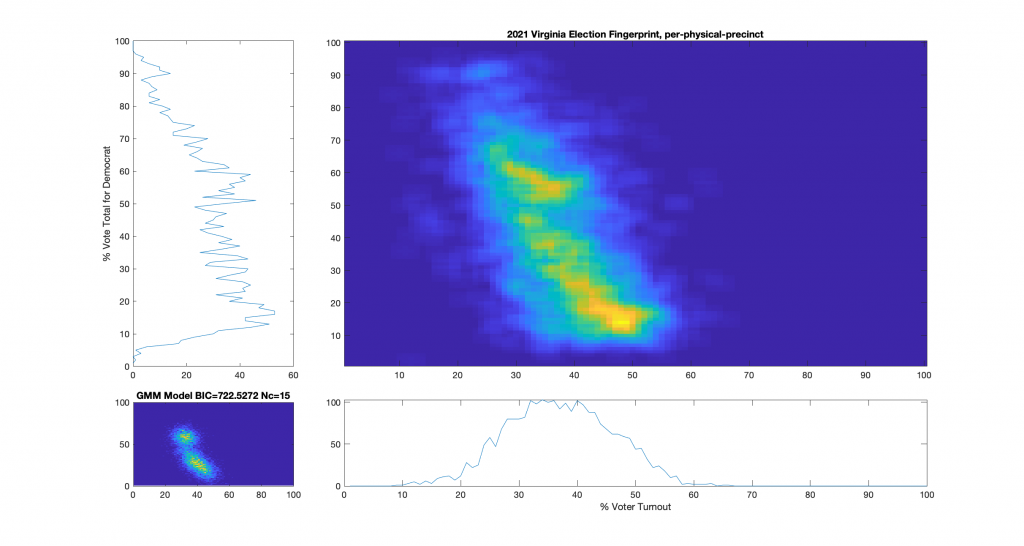
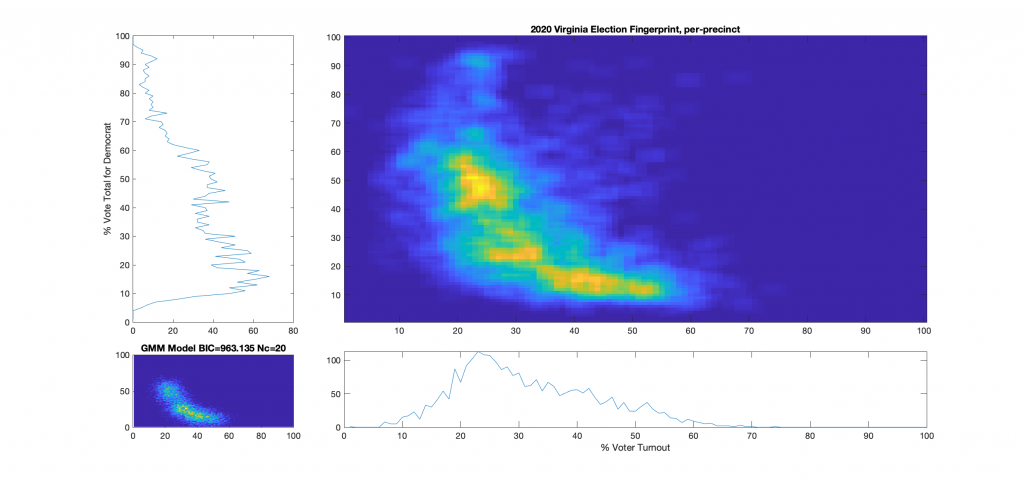
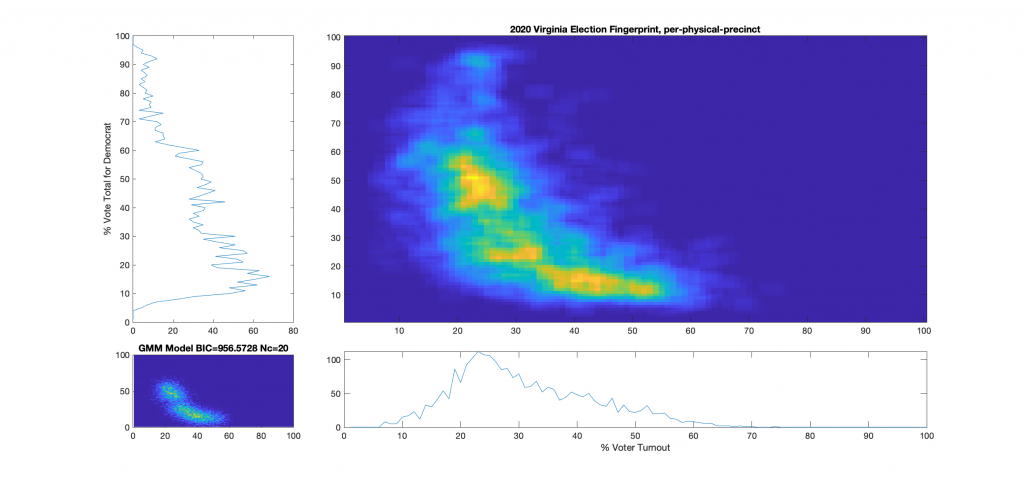
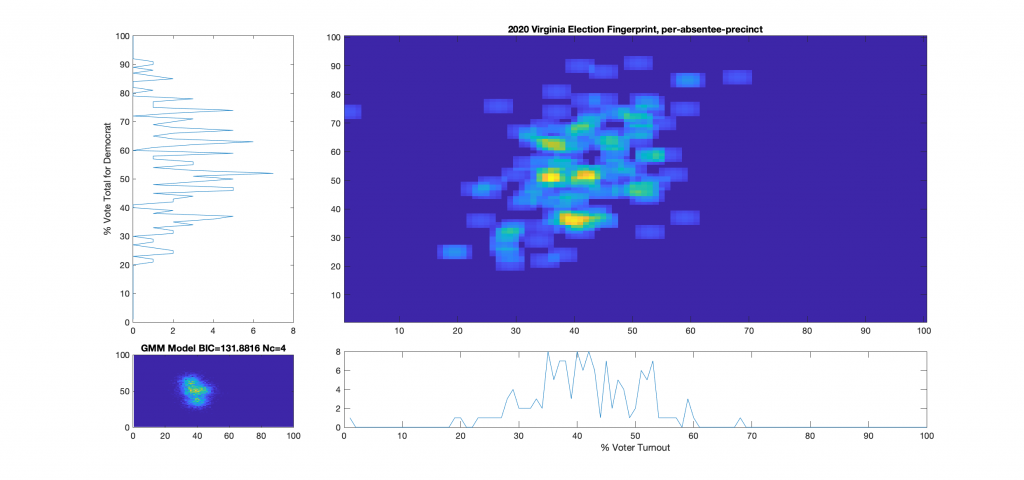
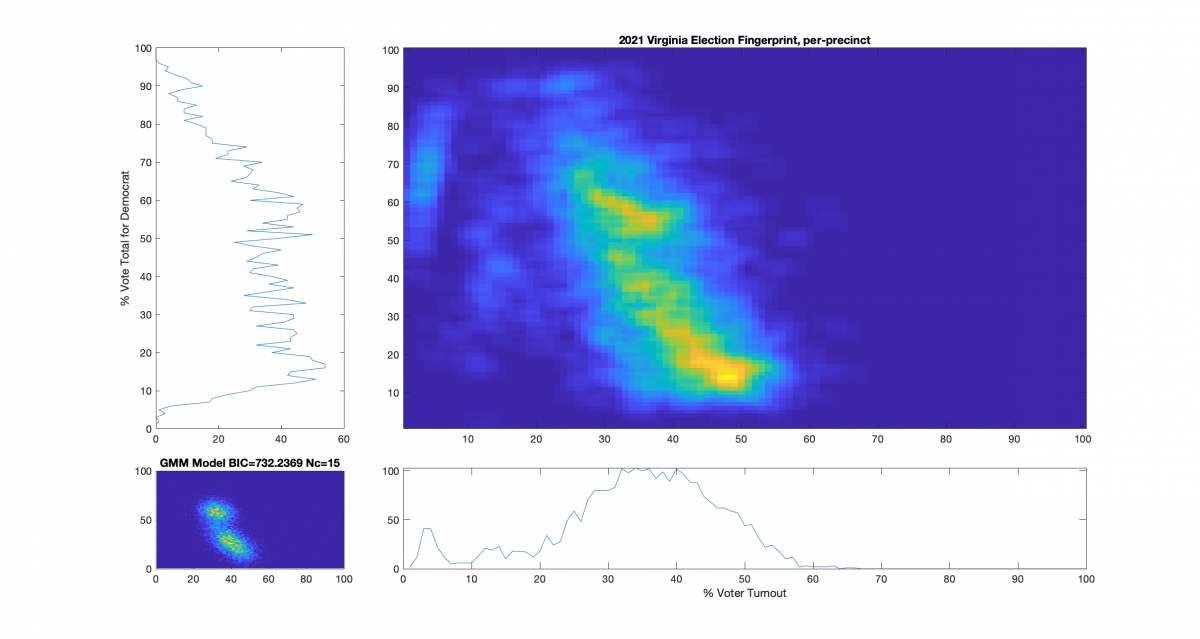
For additional background information, see here, here and here. As a reminder and summary, according to the published methods in the USAID funded National Academy of Sciences paper (here) that I based this work off of, an ideal “fair” election should look like one or two (depending on how split the electorate is) clean, compact Gaussian distributions (or “bulls-eye’s”). Other structural artifacts, while not conclusive, can be evidence and indicators of election irregularities. One such indicator with an attributed cause is that of a highly directional linear streaking, which implies an incremental fraud and linear correlation. Another known and attributed indicator is that of large distinct and extreme peaks near 100% or 0% votes for the candidate (the vertical axis) that are disconnected from the main Gaussian lobe which the authors label a sign of “extreme fraud”. In general, for free and fair elections, we expect these 2D histograms to show a predominantly uncorrelated relationship between the variables of “% Voter Turnout” (x-axis) and “% Vote Share” (y-axis).

The source data for this analysis comes directly from the VA Department of Elections servers, and was downloaded shortly after the conclusion and certification of the 2021 election results on 12/11/2021 (results file) and 12/12/2021 (turnout file). A link to the current version of these files, hosted by ELECT is here: https://apps.elections.virginia.gov/SBE_CSV/ELECTIONS/ELECTIONRESULTS/2021/2021%20November%20General%20.csv and https://apps.elections.virginia.gov/SBE_CSV/ELECTIONS/ELECTIONTURNOUT/Turnout-2021%20November%20General%20.csv. The files actually used for this analysis, as downloaded from the ELECT servers on the dates mentioned are posted at the end of this article.

Note that even though the republican (Youngkin) won in VA, the y-axis of these plots presented here was computed as the % vote share for the democratic candidate (McCauliffe) in order to more easily compare with the 2020 results. I can produce Yougkin vote share % versions as well if people are interested, and am happy to do so.

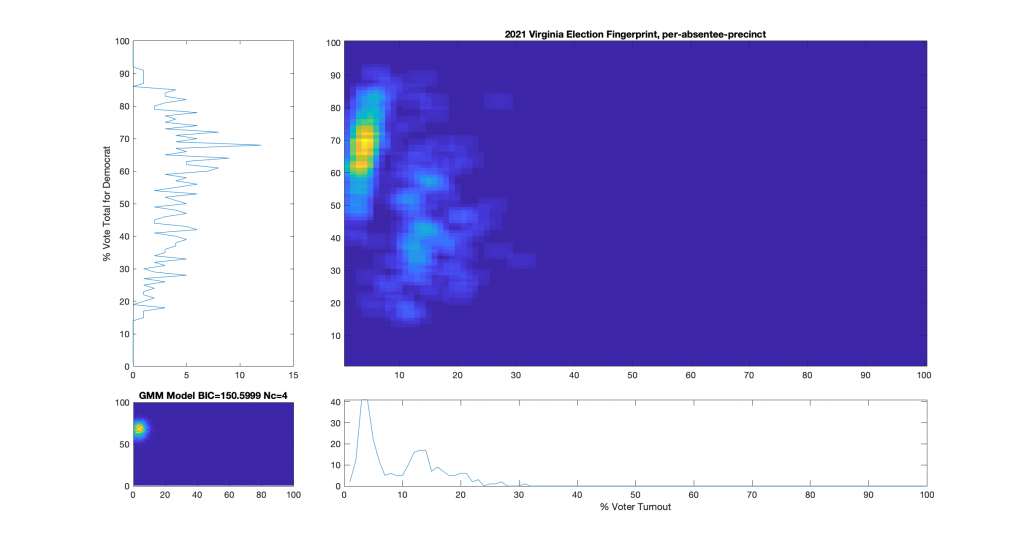
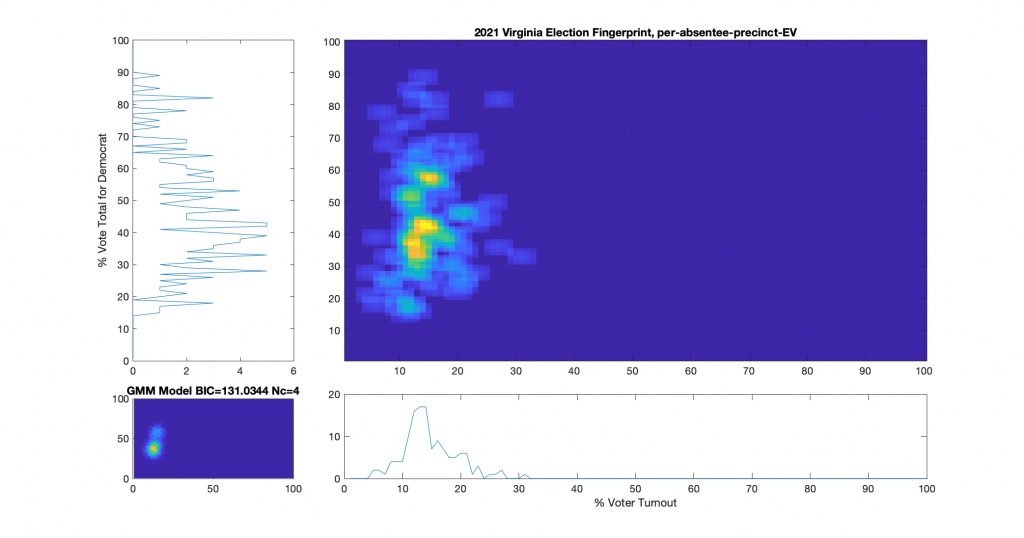
While the 2021 election fingerprints look to have less correlations between the variables as compared to 2020 data, they still look very non-gaussian and concerning. While there is no clearly observable “well-known” artifacts as called out in the NAS paper, there is definitely something irregular about the Virginia 2021 election data. Specifically, I find the per-precinct absentee [mail-in + post-election + early-in-person] plot (Figure 6) interesting as there is a diffuse background as well as a linearly correlated set of virtual precincts that show low turnout but very high vote share for the democratic candidate.

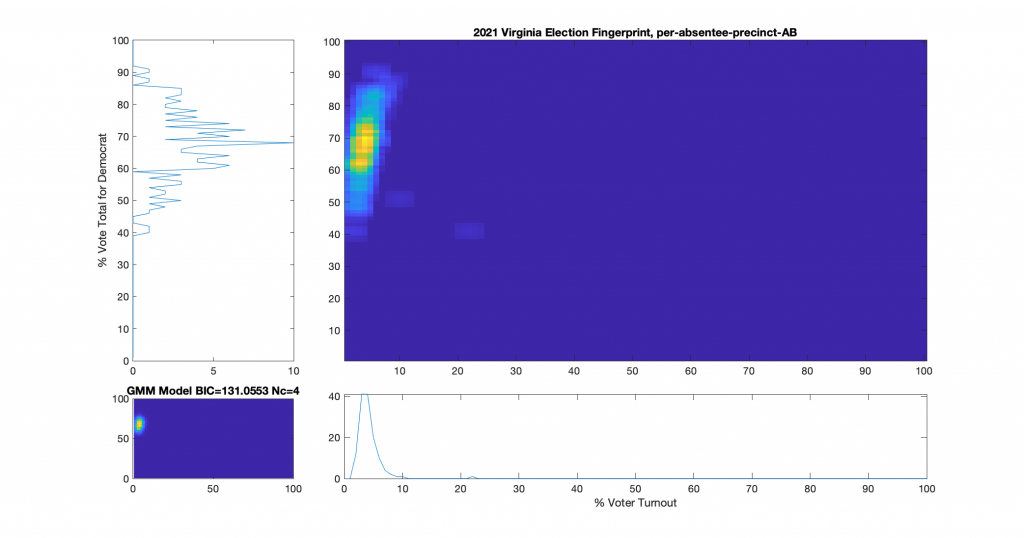
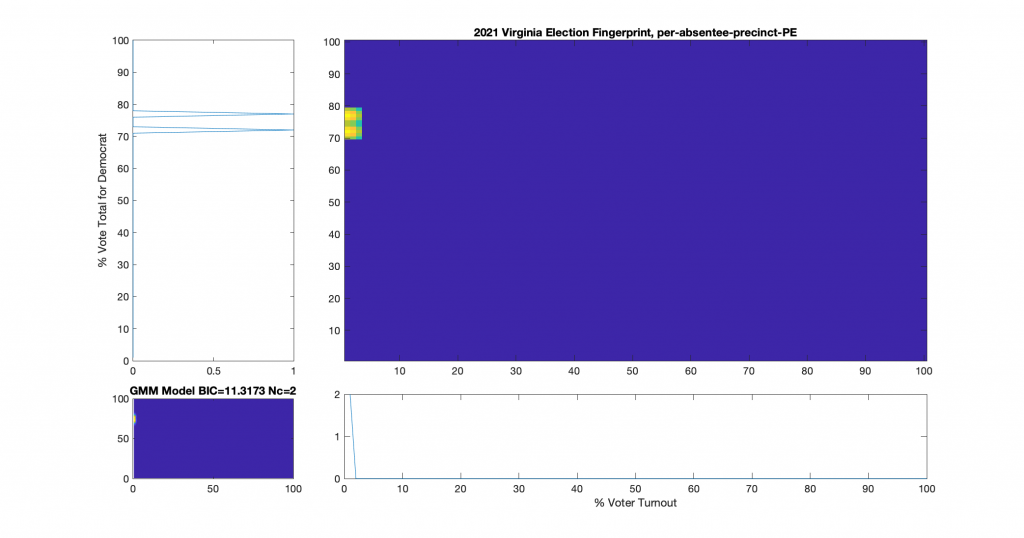
One of the nice differences about 2021 VA data is that they actually identified the distinctions between mail-in, early-in-person, and post-election vote tallies in the CAP’s this year. I have broken out the individual sub-groups as well and we can see that the absentee early-in-person (Figure 9) has a fairly diffuse distribution, while the absentee mail-in (Figure 7) and absentee post-election (Figure 8) ballots show a very high McAuliffe Vote %, and what looks to be a linear correlation.

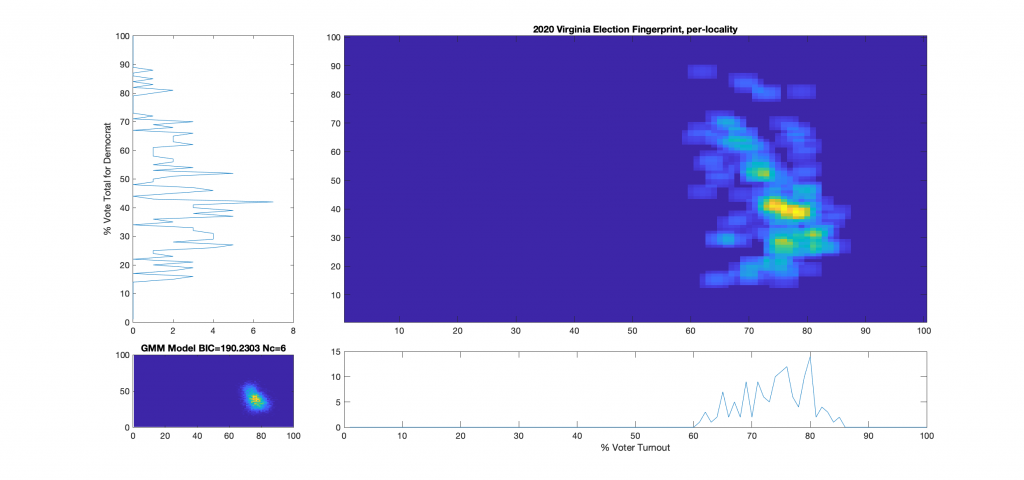
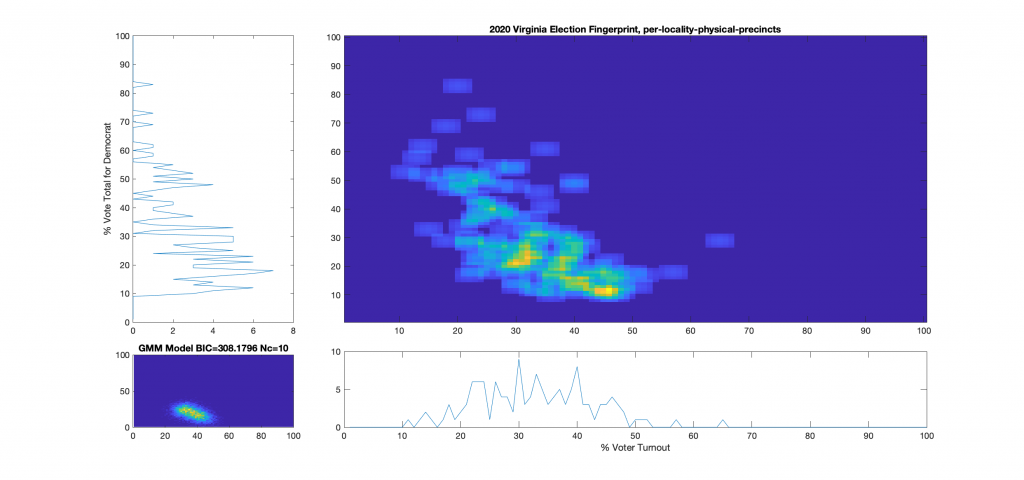
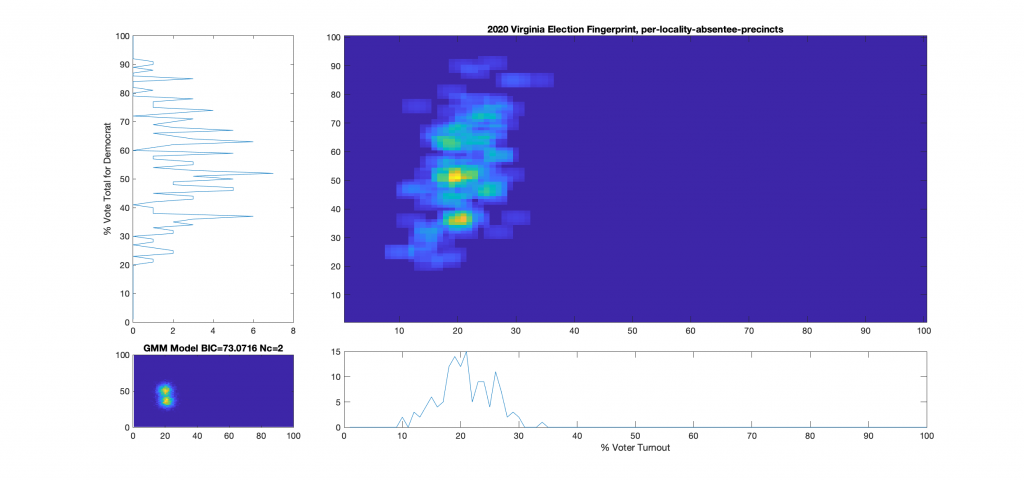
For comparison I’ve also included the 2020 fingerprints. All of the 2020 fingerprints have been recomputed using the exact same MATLAB source code that processed the 2021 data. The archive date of the “2020 November General.csv” and “Turnout 2020 November General.csv” files used was 11/30/2020.

I welcome any and all independent reviews or assistance in making and double checking these results, and will gladly provide all collated source data and MATLAB code to anyone who is interested.

Figure 1 : VA 2021 Per locality, absentee (CAP) + physical precincts

Figure 2 : VA 2021 Per locality, physical precincts only:

Figure 3 : VA 2021 Per locality, absentee precincts only:

Figure 4 : VA 2021 Per precinct, absentee (CAP) + physical precincts:

Figure 5 : VA 2021 Per precinct, physical precincts only:

Figure 6 : VA 2021 Per precinct, absentee (CAP) precincts only:

Figure 7 : VA 2021 Per precinct, CAP precincts, mail-in ballots only:

Figure 8 : VA 2021 Per precinct, CAP precincts, post-election ballots only:

Figure 9 : VA 2021 Per precinct, CAP precincts, early-in-person ballots only:

Comparison to VA 2020 Fingerprints

Figure 10 : VA 2020 Per locality, absentee (CAP) + physical precincts:

Figure 11 : VA 2020 Per locality, physical precincts only:

Figure 12 : VA 2020 Per locality, absentee precincts only:

Figure 13 : VA 2020 Per precinct, absentee (CAP) + physical precincts:

Figure 14 : VA 2020 Per precinct, physical precincts only:

Figure 15 : VA 2020 Per precinct, absentee (CAP) precincts only:

Source Data Files:

Categories
Election Data Analysis Election Forensics Election Integrity Interesting programming technical Uncategorized

Vanishing Voter ID’s in sequential 2021 DAL files

During the 2021 election I archived multiple versions of the Statewide Daily Absentee List (DAL) files as produced by the VA Department of Elections (ELECT). As the name implies, the DAL files are a daily produced official product from ELECT that accumulates data representing the state of absentee votes over the course of the election. i.e. The data that exists in a DAL file produced on Tuesday morning should be contained in the DAL file produced on the following Wednesday along with any new entries from the events of Tuesday, etc.

Therefore, it is expected that once a Voter ID number is listed in the DAL file during an election period, subsequent DAL files *should* include a record associated with that voter ID. The status of that voter and the absentee ballot might change, but the records of the transactions during the election should still be present. I have confirmed that this is the expected behavior via discussions with multiple former and previous VA election officials.

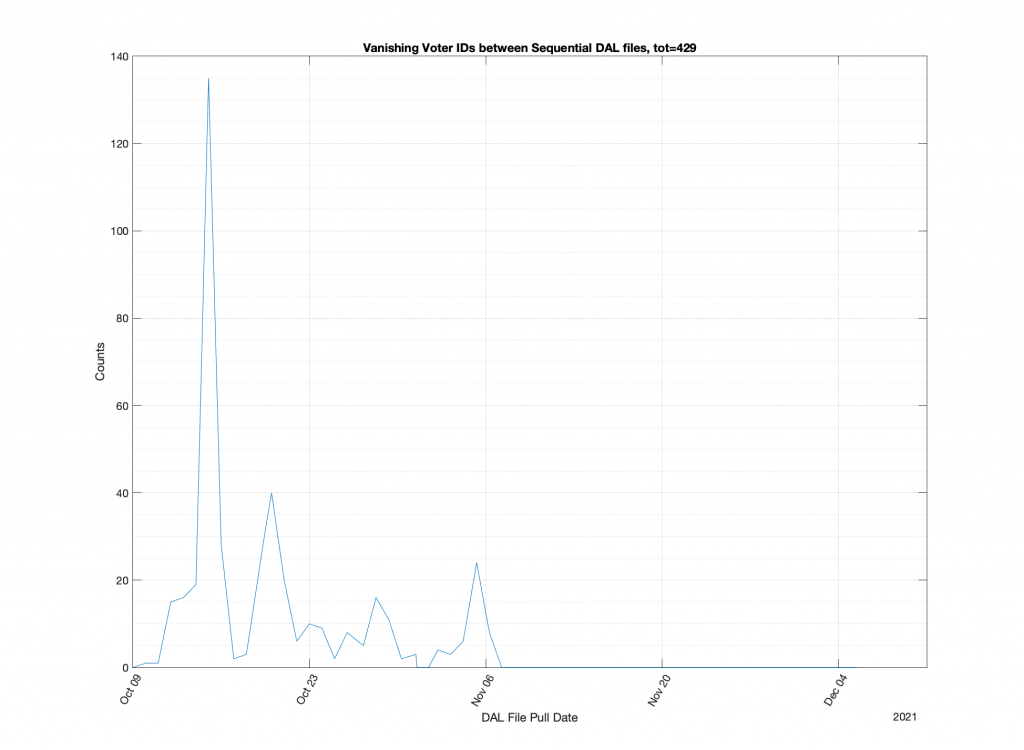
Stepping through the snapshots of collected 2021 DAL files in chronological order, we can observe Voter IDs that mysteriously “vanish” from the DAL record. We can do this by simply mapping the existence/non-existence of unique Voter ID numbers in each file. The plot below in Figure 1 is the counts of the number of observed “vanishing” ID numbers as we move from file to file. The total number of vanishing ID numbers is 429 over the course of the 2021 election. Not a large number. But it’s 429 too many. I can think of no legitimate reason that this should occur.

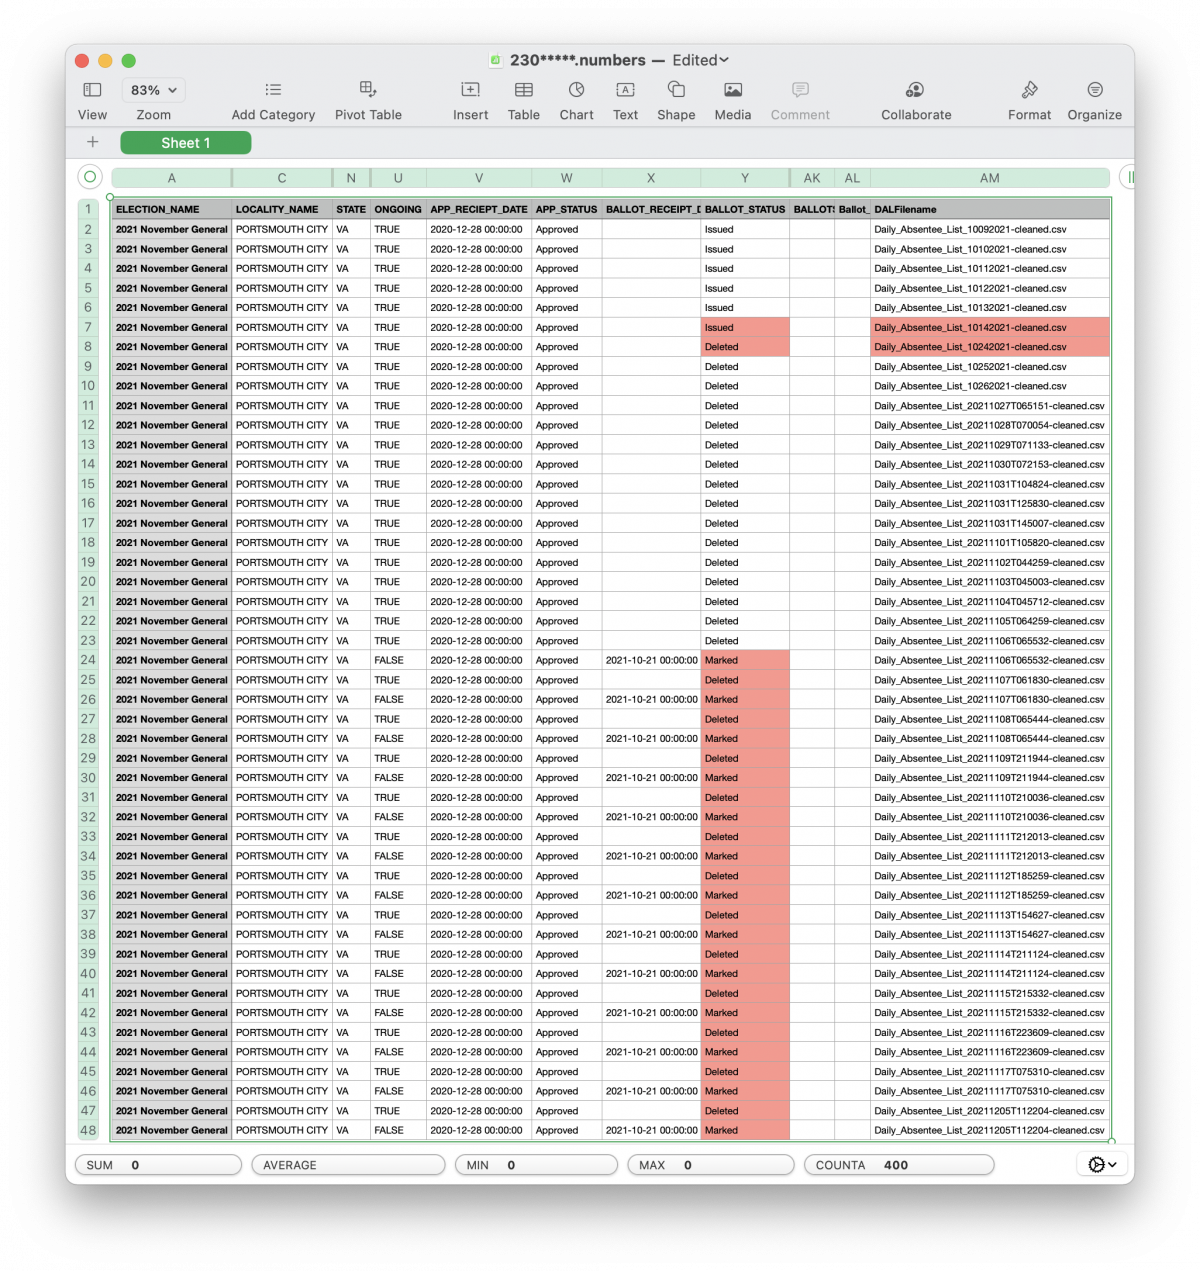
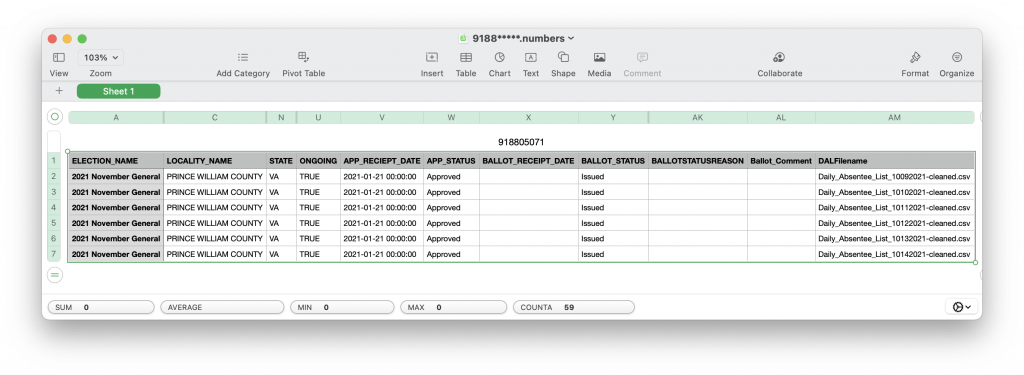
Now an interesting thing to do, is to look at a few examples of how these issues manifest themselves in the data. Note that I’m hiding the personally identifiable information from the DAL file records in the screenshots below, BTW.

The first example in the screenshot below is an issue where the voter in question has a ballot that is in the “APPROVED” and “ISSUED” state, meaning that they have submitted a request for a ballot and that the ballot has been sent out. The record for this voter ID is present in the DAL file up until Oct 14th 2021, after which it completely vanishes from the DAL records. This voter ID is also not present in the RVL or VHL downloaded from the state on 11/06/2021.

This voter was apparently issued a real, live, ballot for 2021 and then was subsequently removed from the DAL and (presumably) the voter rolls + VERIS on or around the 14th Oct according to the DAL snapshots.  What happened to that ballot? What happened to the record of that ballot? The only public record of that ballot even existing, let alone the fact that it was physically issued and mailed out, was erased when the Voter ID was removed from DAL/RVL/VHL records.  Again, this removal happened in the middle of an election where that particular voter had already been issued a live ballot!

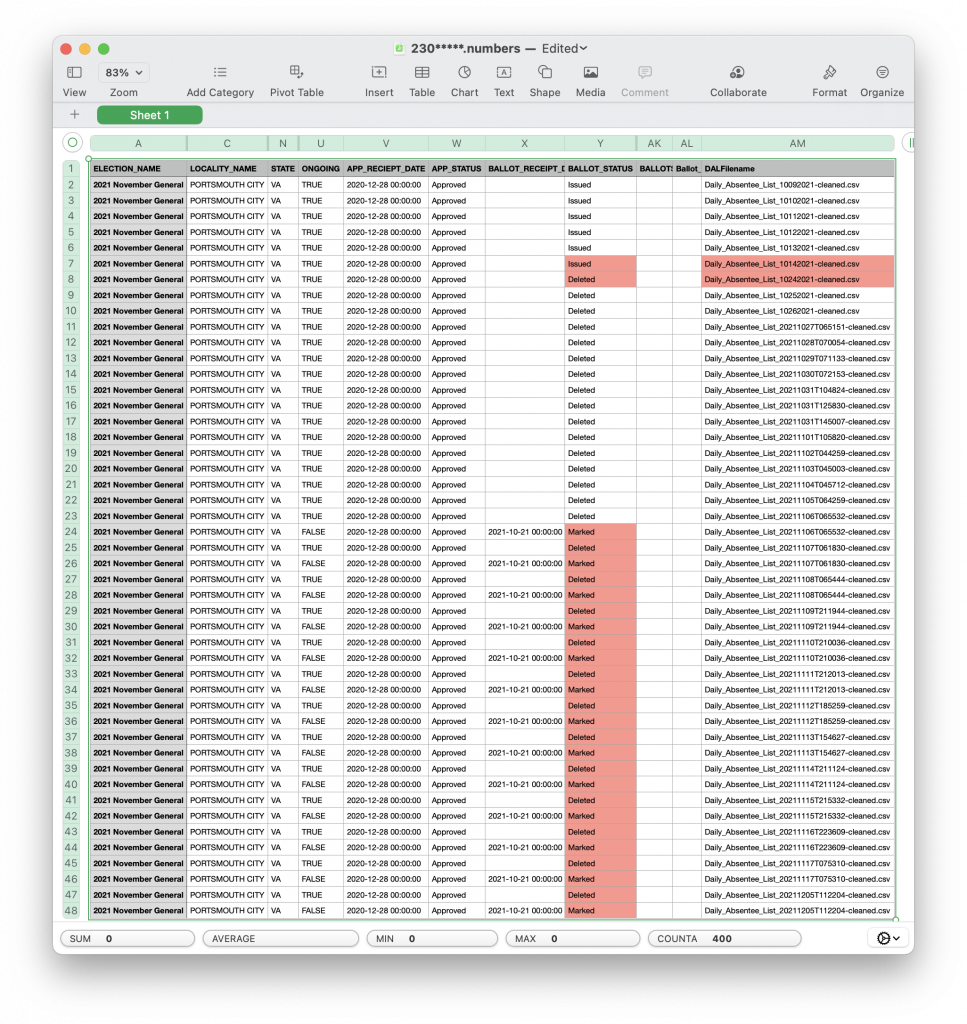
A few of these IDs actually “reappear” in the DAL records.  ID “230*****” is one example, and a screenshot of its chronological record is below.  The ballot shows as being ISSUED until Oct 14th 2021.  It then disappears from the DAL record completely until the data pull on Oct 24th, where it shows up again as DELETED.  This status is maintained until Nov 6th 2021 when it starts oscillating between “Marked” and “deleted” until it finally lands on “Marked” in the Dec 5 DAL file pull.  The entire time the Application status is in the “Approved” state for this voter ID.  From my discussions with registrars and election officials the “Marked” designation signifies that a ballot has been received by the registrar for that voter and is slated to be tabulated.

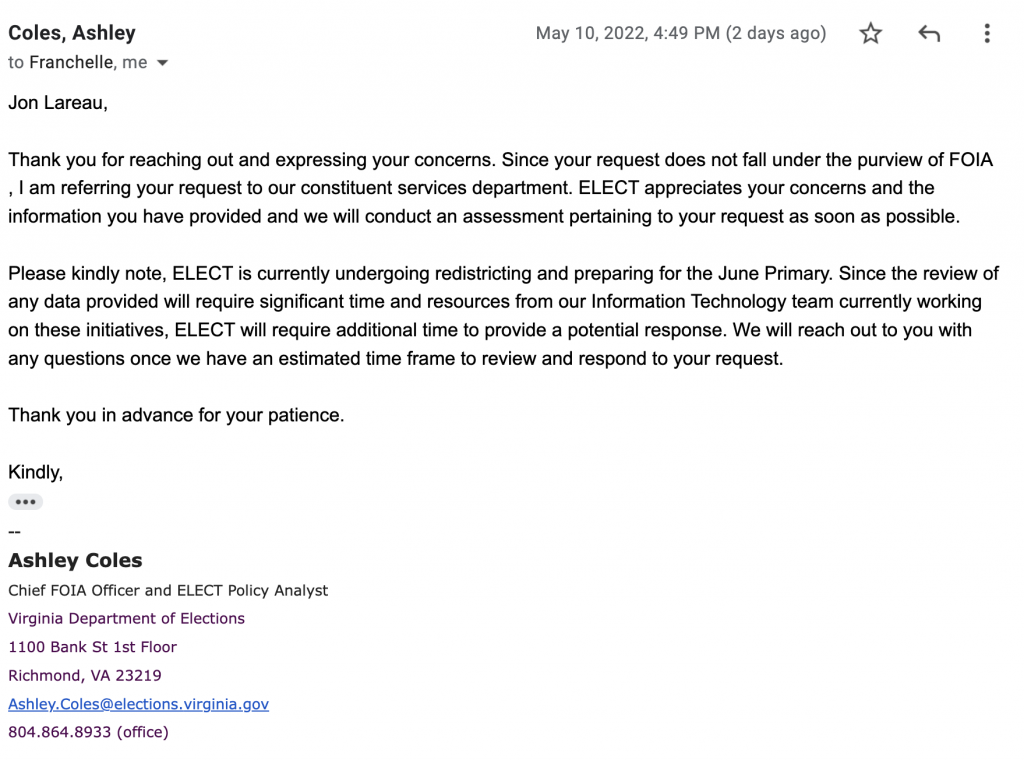
I have poked ELECT on twitter (@wwrkds) on this matter to try and get an official response, and submitted questions on this matter to Ashley Coles at ELECT, per the advice of my local board of elections chair. Her response to me is below:

I will update this post as information changes.