There are currently two completely separate but simultaneous primary elections being held in VA, with actual Election Day coming up fast on March 5th. As part of EPEC’s data analysis on the ongoing Democrat and Republican primaries, I took some time to look at the distribution of voter participation. VA does not have voter registration by party, but participation in primary elections is often used as a surrogate method to try and estimate a voter leaning.
I was specifically interested as to how many “cross-over” voters were participating in each parties primary. There have been multiple news articles (here, for example) discussing the potential for democrats to cross-vote in the 2024 Primaries, and I wanted to see if I could observe evidence of that behavior in the data.
Results:
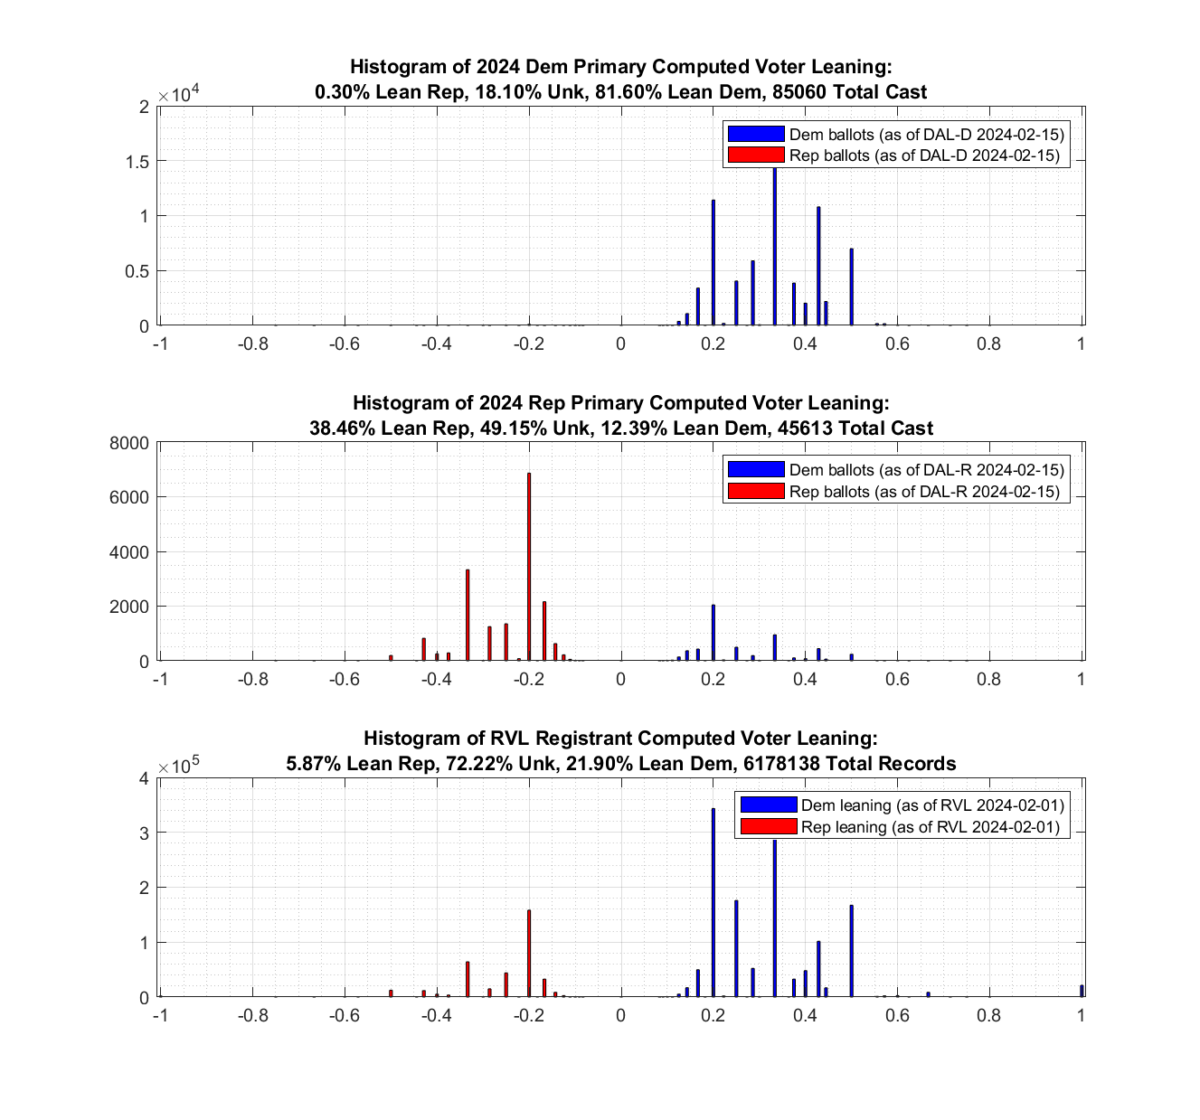
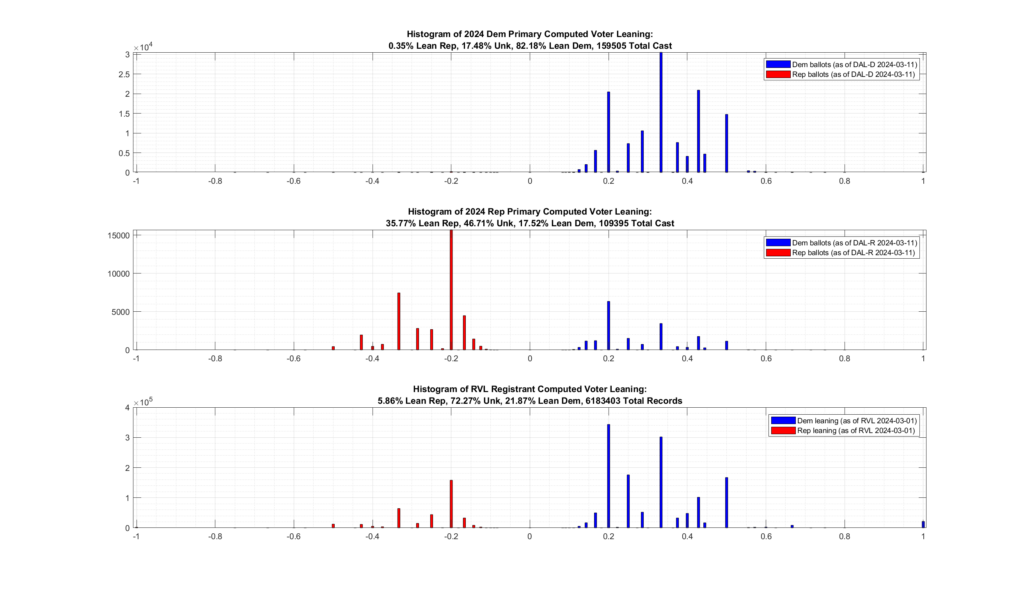
As can be seen from the image below, there is definitely evidence of crossover voting occurring, with historically democratic primary voters crossing over and voting in this years (2024) Republican primary.
Approximately 17.5% of the 109,395 ballots cast in the 2024 VA Republican primary are associated with historically Democrat leaning registrants. Only 0.35% of the 159,505 ballots cast in the 2024 VA Democratic primary are associated with historically Republican leaning registrants. [Note this plot was updated on 2024-03-11 to reflect the latest values. The previous results from mid-February had the number of crossover D->R voters at ~12%]
Method:
Step 1: Compute an estimate of voter leaning.
The data utilized in this analysis all comes directly from the VA Dept of Elections (“ELECT”) and includes the statewide Registered Voter List (“RVL”) and Voter History List (“VHL”) files dated 03/11/2024, as well as the Daily Absentee List (“DAL”) files corresponding to each of the ongoing Democrat and Republican primaries.
An estimation of each party leaning is first computed by going through the VHL and for each unique voter in the VHL summing the number of Democrat or Republican primaries that voter has participated in historically. We then take the difference of these two fields and divide by the total number of election contests the voter has participated in. This gives us a resultant estimate of the “leaning” for each unique voter.
leaning = (# Dem Primaries – # Rep Primaries) / (# of Total Contests)
A leaning < 0 indicates a Republican lean, and > 0 indicates a Democratic lean. A voter might have a lean == 0 if they had a balanced participation in previous primaries, or if there is no voter history for that particular voter.
Step 2: Plot the histogram of voter leaning for ballots cast so far in both the Democratic and Republican primaries. Additionally plot the Computed voter leaning for the entire RVL as a reference.