As of 03-20-2022, the latest version of my master spreadsheet posted below.
This includes the updates from my discussions with the York County registrar (see here), the comparison to DAL file entries (here), and the latest updates and comparisons to Statement of Results (SOR) / Machine Tape records, including ABLEMARLE, ACCOMACK COUNTY (partial), FAIRFAX COUNTY, FREDERICK COUNTY, GOOCHLAND COUNTY, HENRICO COUNTY (partial), ISLE OF WIGHT, LOUDOUN COUNTY (partial), LOUISA COUNTY, NORFOLK CITY, ORANGE COUNTY, POWHATAN COUNTY (partial), PRINCE WILLIAM COUNTY, STAFFORD COUNTY, SPOTSYLVANIA COUNTY, SUFFOLK COUNTY and YORK COUNTY. There’s more to process, but I wanted to put out a status update.
The previous result between the “official” CSV results and the “official” DAL file results has not changed at 5,766 Net discrepancies and 17,194 absolute. Latest update includes some cleaning up of the spreadsheet formulas and making sure that I am only accounting for discrepancies for those rows where we actually have verified transcriptions and/or tape images. The current discrepancies in the records between the CSV and the SOR / Machine Tapes is 4,549 Net discrepancies and 27,905 Absolute discrepancies. “Net” discrepancies are summed such that +/- deltas per candidate can cancel out, whereas “Absolute” discrepancies are summed using the absolute value. I have only been focusing on the Governors race at the moment and not any of the down-ballot races. Again many many “thank you’s” to the volunteers at VFA who have been helping to put all of this together.
Walt Lantham, the registrar of York county (yes … it’s York County … don’t worry … I asked Walt if he was ok with me identifying him and the locality publicly before making this update) generously reached out and contacted me to try and clear up some of the original numbers I posted below. We had a long and detailed couple of phone calls (over two hours in total) and went over all over these results in detail. It turns out that I was missing the hand counted ballot tally sheets from the data that I had received. This cleared up most of the technical issues with the 2021 data and all but 1 issue with the data below for 2020. The remaining issue is the discrepancy with the official State CSV files, which is outside of Walt’s ability to diagnose. Our discussion also brought up some of the interesting procedural issues and challenges related to data reporting, retention, maintenance and general practices as well. I’ll touch on that in a bit. It was a great conversation and a big thank you to Walt and his staff for taking the time to address these issues in detail.
Special thanks again to the grassroots folks in VFA, and throughout the state, for all their hard work in collecting the machine tape information for various localities. There were a few localities that provided not only the 2021 machine tapes, but the 2020 versions as well! The first one of those that I have compiled all the data for is reported below. As with all of my results, I invite those that wish to replicate, validate or refute to contact me and I will happily provide the necessary details and data files.
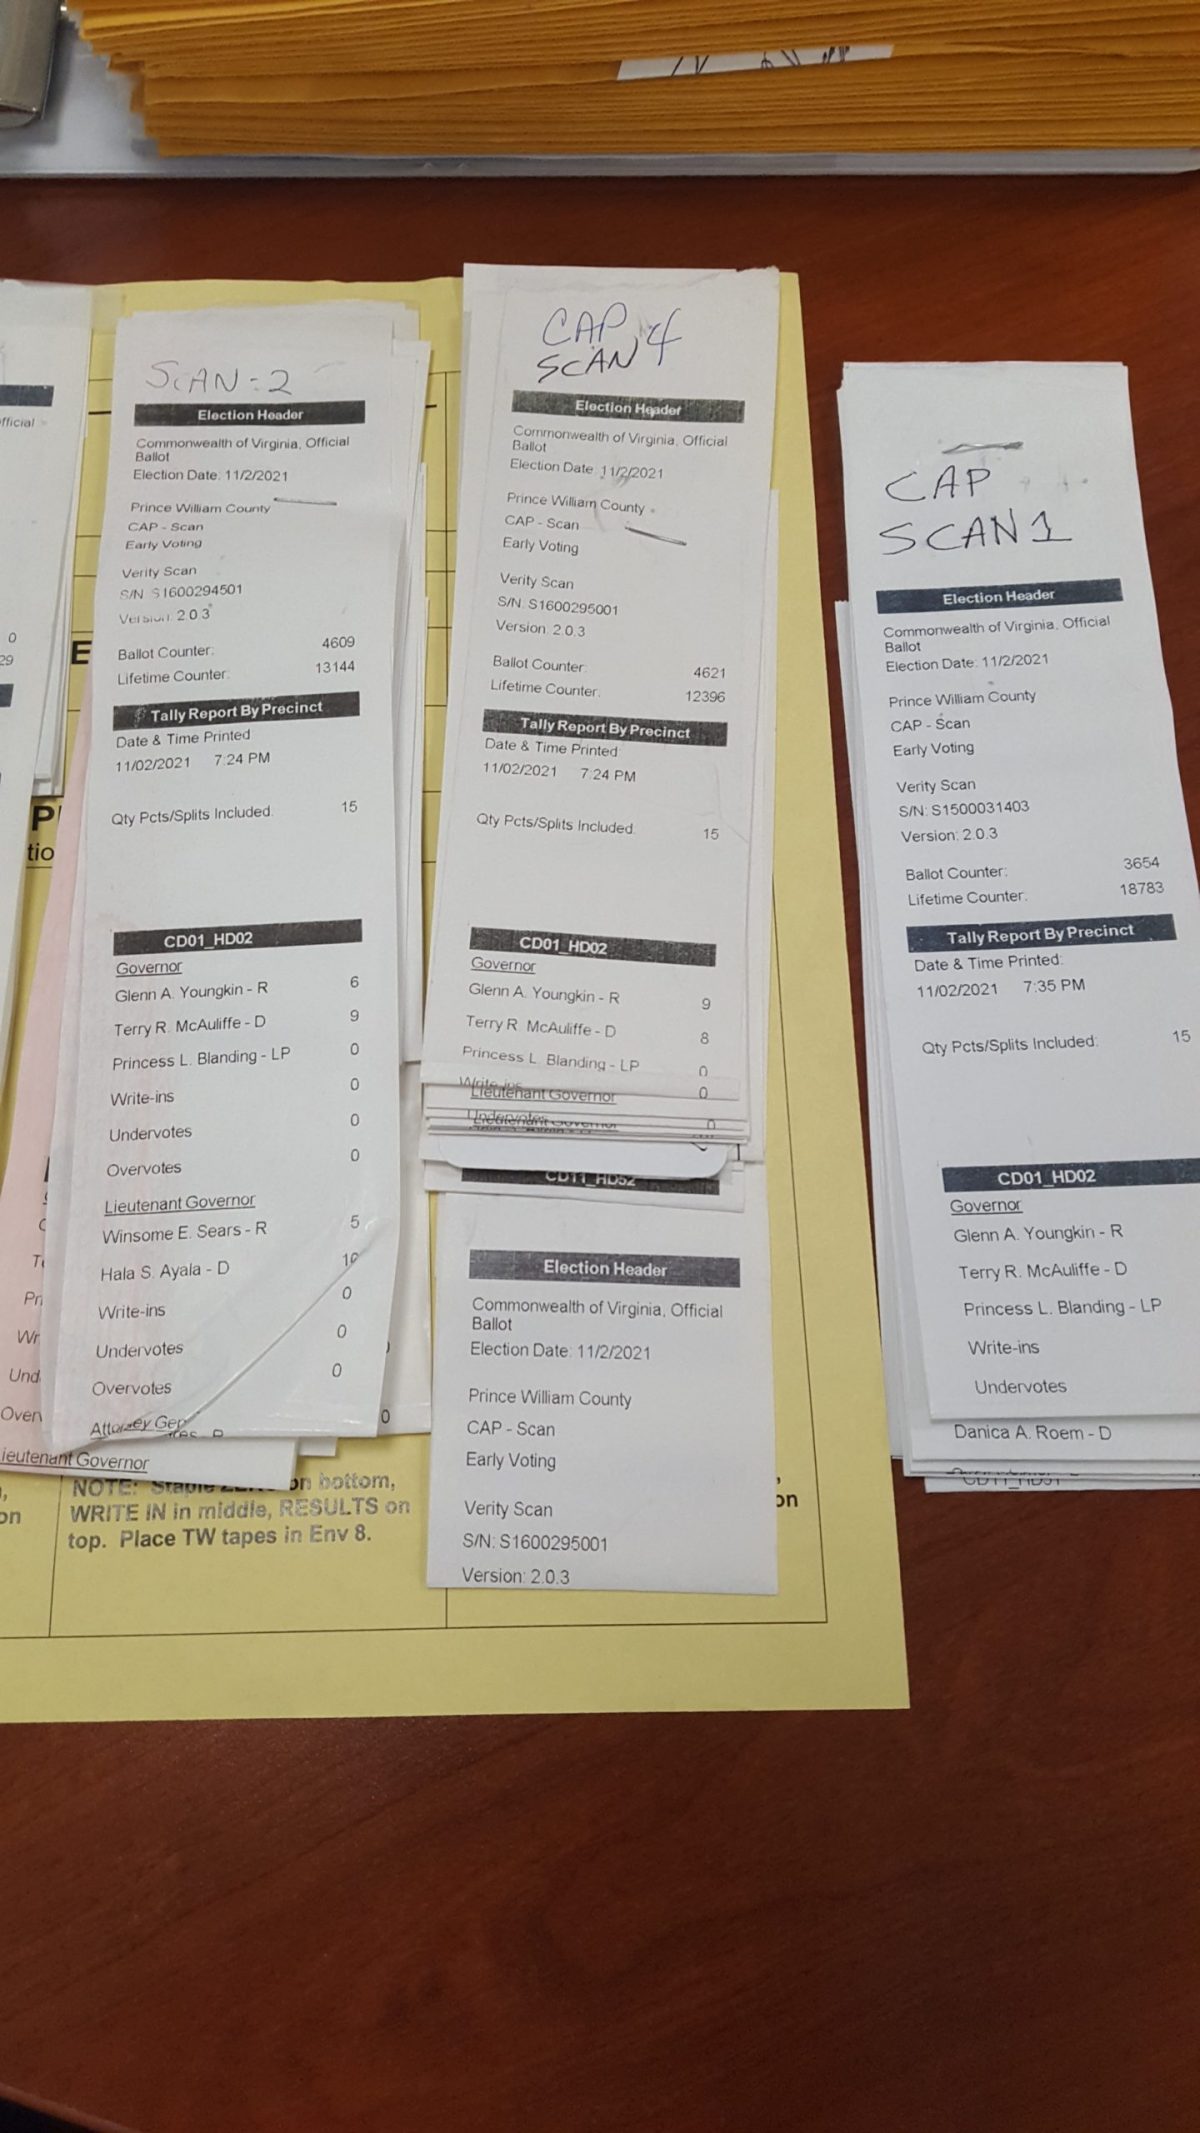
I believe we have some significant issues with our elections in VA. The data below helps clearly make that case, in conjunction with the multiple other data analyses that I’ve done and posted here on my blog. The data below is only from a single locality in the state (I am working on others). I am purposefully summarizing the data and abstracting which locality this represents, as I do not want to jeopardize any potential legal proceedings or official investigations. But I do feel strongly that the “fact of” this information needs to be made public and become part of the discussion on the matter. (And … just to be clear … the background image for this blog post is the tapes from a different locality in 2021 only, which I discussed here)
I’ll note that the machine tapes and Statements of Results (SORs) are the “gold standard” to measure the published election results against in VA. Once a vote is cast on a machine, there is no process for it to be removed from the official vote count. Each ballot category is supposed to be scanned into a set of dedicated machines. Provisional ballots have their own dedicated machines that they get scanned into. Mail-In ballots have their own dedicated machines. Early In-Person ballots get their own machines, as do the In-Person Early and Day-Of ballots.
Ballots that cannot be scanned for some reason must be hand counted. This hand counting and verification is performed at the post-election canvass. In my discussion with Walt, we noted the fact that there is no requirement for the hand-count tally worksheets used during the canvass to be included in the statement of results reports that are available for the public to view. There is also no mechanism for the state to track or delineate the numbers of hand-counted ballots, or way for voters to know the various reasons why ballots needed to be hand counted in the first place. But luckily for me … Walt keeps good notes and records, and e-mailed me a copy of the Tally sheets that he preserved from the canvass for my records and to fill in the data gaps.
There should be zero difference from the sum of these reports (including the hand counts) to the reported official results, save for very very very small and rare documented errors and issues. Maaaaaybe 1 or 2 differences here and there, but nowhere near the results presented below when compared to the State CSV files. I have talked to multiple elections officers, public officials, registrars and lawyers and ALL of them have agreed with this sentiment.
Input Data:
The official results are supplied by the VA Dept. of Elections (ELECT) website in a csv file for 2020 (here) and 2021 (here). Additional versions of the official results are reported through a web portal to the ELECT historical archive for 2020 (here). Turnout numbers are supplied similarly from csv files on the ELECT servers for 2020 (here) and 2021 (here). Note that the official CSV and WEB tally results for 2020 show significant differences, yet both are supposed to reflect the “official” results. That, on its own, is a significant issue that warrants further inspection. I’ve computed the deviations between both data sets for this locality, so it’s dealers choice as to which dataset you want to compare against. For 2021 the CSV results are the only ones available.
SOR and machine tape information was obtained by volunteers across the state going to their local registrar or county clerks office. For some counties complete datasets of both 2021 and 2020 election results were obtained, with hand transcriptions of tape returns as well as photographic copies of the originals. The results reported below are for a moderately sizedYork County and were derived from both hand transcribed results and photographic copy of the machine tapes for both 2020 and 2021. The Statement of Results (SOR) reports and change logs from the county do not document any issues that would account for the discrepancies below. There were no issues presented at the canvass (where the tapes and SOR’s are checked against the state database entries for errors) that would explain the results below that I am aware of.As noted above per my discussions with Walt, and with him providing the copies of the hand-count tally worksheets, we were able to address most of the discrepancies that I came across except for the discrepancy of the 2020 data with the CSV version of the official results posted by VA ELECT. In fact, Walt’s corrections made the discrepancy with the CSV results slightly worse, even though they fixed the discrepancies with the WEB based portal results.
Results:
The tables below show the computed differences of the VA Dept of Elections data minus the collected machine tape results, stratified by major candidate party. The 2020 results are for office of president, the 2021 results for Governors race. The 2021 and 2020 Web results were strictly positive differences, so there is no distinction between the Sum of the differences (the NET change) and the Sum of the Absolute Value of the differences (how many votes were affected). Whereas, the 2020 CSV results had some negative differences, so there are two different ways to compute the effects of these deviations.
The 2021 Governor’s race showed a smaller amount of % deviation from the machine tapes than the 2020 Presidential race for this locality, but still show non-zero differences. (Remember, there should be zero difference.)
It is notable to mention that in 2021 the reporting was changed such that absentee mail-in and early-vote totals are separated in the reported data. The 2021 In-Person Day-Of results were identical to the reported results presented by the VA Department of Elections, with the In-Person Early vote only showing a single vote discrepancy. Almost all of the differences are manifested in the Mail-In or Provisional ballots for the 2021 data.
Likewise for 2020 there is very little difference (a single vote again) in the In-Person Day-Of precinct totals from the reported results. Almost all of the differences can be attributed to Central Absentee Precinct (CAP) data when compared against the state’s official CSV report.
2021 Results
Year
PRECINCT
VDOE-TAPE difference for Democratic candidate
VDOE-TAPE difference for Libertarian candidate
VDOE-TAPE difference for Republican candidate
2021
Total Differences Provisional
22 0
0
18 0
2021
Total Differences AB – Central Absentee Precinct
25 0
0
9 0
2021
Total Differences EV – Central Absentee Precinct
0
0
1
2021
Total Differences PE – Central Absentee Precinct
1 0
0
2 0
2021
Total Differences Day-Of Precincts
0
0
0
Total Differences
480
0
301
Machine Tape Totals
1214212190
150
1745517484
% of Machine Tape Totals
48/12142*100 = 0.40% 0/12190*100 = 0.00%
0/150*100 = 0.00%
30/17455*100 = 0.17% 1/17484*100 = 0.006%
Differences of 2021 Tape Counts from Official Results (CSV)
2020 Results (ELECT Web Portal Archive)
Year
PRECINCT
VDOE-TAPE difference for Democratic candidate
VDOE-TAPE difference for Libertarian candidate
VDOE-TAPE difference for Republican candidate
2020
Total Differences AB – Central Absentee Precinct
234 0
10
112 0
2020
Total Differences Provisional
2 0
0
1 0
2020
Total Differences Day-Of Precincts
0
0
1
Total Differences
2360
100
114 1
Machine Tape Totals
1744717683
670680
2002720240
% of Machine Tape Totals
236/17447*100 = 1.35% 0/17447*100 = 0.00%
10/670*100 = 1.49% 0/670*100 = 0.00%
114/20027*100 = 0.57% 1/20027*100 = 0.005%
Differences of 2020 Tape Counts from Official Results (WEB)
2020 Results (ELECT CSV Report)
Year
PRECINCT
VDOE-TAPE difference for Democratic candidate
VDOE-TAPE difference for Libertarian candidate
VDOE-TAPE difference for Republican candidate
2020
Total Differences AB – Central Absentee Precinct
77 157
-1 11
11 101
2020
Total Differences Provisional
-114 116
-1 1
-52 53
2020
Total Differences Day-Of Precincts
0
0
1
Total Differences
-37 273
–2 12
64 155
Machine Tape Totals
1744717683
670680
2002720240
% of Machine Tape Total
-37/17447*100 = -0.21% 273/17683*100 = 1.54%
-2/670*100 = -0.30% 12/680*100 = 1.80%
64/20027*100 = 0.32% 155/20240*100 = 0.77%
Abs Val Total Differences
191 273
2 12
164 155
Abs Val % of Machine Tape Totals
191/17447*100 = 1.09% 273/17683*100 = 1.54%
2/670*100 = 0.30% 12/680*100 = 1.80%
164/20027*100 = 0.82% 155/20240*100 = 0.77%
Differences of 2020 Tape Counts from Official Results (CSV)
The more I dig, the more I am disturbed by the VA Department of Elections (a.k.a. “ELECT”) lack of data integrity and “data hygiene”. If any private citizen or company was as reckless and error prone with financial or other legal records, they’d be in jail and fined out of existence. And I’m being very very very generous as I am assuming “innocent” incompetence on the part of our elected officials and ELECT. (Although I’m not exactly sure which is worse … discovering that there is a hypothetical cabal of bad actors responsible behind the curtain, or that the vast majority of our elected officials are simply just incompetent, and the system as-is is unreliable.)
Many have been asking me for updates and status as to the various datasets I’ve been working on. Process is slow going, as I do this in my spare time, but progress IS being made. (With specific thanks to all of my peeps over at VFA on telegram who have stepped up to the plate in collecting machine tape transcriptions and images.)
I’ve previously posted on basic stats and other findings (here, here, here, here, here).
I have been working through all of the data and combined inputs from:
the Daily Absentee List (DAL) File, downloaded on 2021-12-05_11:22:04
images of the machine tapes, as available for verification and validation.
There is a whole lot of work left to do to digitize and transcribe the machine tapes and compare them to the results of the data as presented by ELECT. But even ignoring the machine tapes for the moment, we can see from the attached master spreadsheet that there are a NET 5,766 and ABSOLUTE 17,194 ballot accounting discrepancies between the various ELECT provided datasets for the 2021 Election.
Columns L,M,N,O,P are derived from the “2021 November General.csv” file as of 12-11-2020 provided by VA ELECT on their website
Columns S-Y are derived from the “Turnout-2021 November General.csv” file as of 12-12-2021 provided by VA ELECT on their website
Columns Z-AP are derived from the Daily Absentee List (DAL) file provided by VA ELECT, downloaded 2021-12-05T11-22-04
Columns H-K are generated from in person inspection of the machine tapes for each precinct
Columns E-G are the differences between the machine tapes and the sums reported in the (2021 November Genreal.csv” file
Column Q is the difference between the CAP precinct data reported in “2021 November General.csv” and the corresponding “Turnout-2021 November General.csv” or DAL derived data.
For Rows with precinct == “## Provisional” : Q is the difference between column P and the sum of all of the column S for the corresponding precincts.
For Rows with precinct == “## AB – Central Absentee Precinct” : Q is equal to column AM minus column P for both that row and the corresponding row of Post-Election-Day (PE) counts
For Rows with precinct == “## EV – Central Absentee Precinct” : Q is equal to column AN minus column P
Column R is the absolute value of column Q
Summing column Q (the net discrepancy) gives 5,766
Summing column R (the absolute discrepancy) gives 17,194
I stress again that this is based on data directly supplied by the VA Department of Elections. This is not based on estimates or approximations. There should be Zero (as in Zip, Zilch, Nada) discrepancies between their own distinct datasets that are supposed to be representing the same real world event (the election).