Individual voters should NEVER have more than one (1) active ballot. If this occurs, there is a risk that human error by an election official will result in a voter having more than one ballot counted.
Virginia has 226 individuals with two or more active ballots according to the Daily Absentee List file as of 28 October, 6 AM. This is occurring in nearly half of the Localities in Virginia – 59 out of 133.
This is a process issue – either procedural, or ballot tracking. The process should make it impossible for more than one vote to be counted.
It is possible that these will be caught before they get counted … but mistakes are made when people get overloaded or distracted. Process software should prevent the possibility of this “defect” occurring to prevent the perception of malfeasance.
The number of ballots in “Provisional” status is growing. This is to be expected because Virginia began allowing “same day voter registration” on 1 October, and same-day votes are to be labeled Provisional.
A handful of ballots were Provisional status prior to 1 October, and this ought to be explained. The steady increase of Provisional ballots started on 19 October. The count of Provisional ballots is currently growing by approximately 200 ballots each day. This number is expected to grow exponentially as we approach election day.
The root cause of the Provisional ballot increase is most likely “same day registration and voting” but a detailed study has not yet been performed.
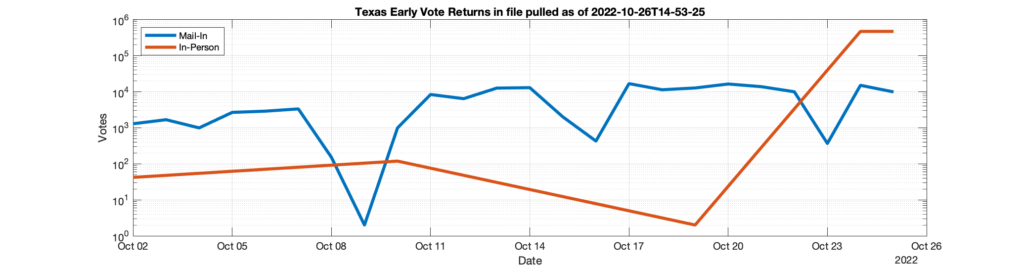
Recently I’ve started downloading all of the data from the TX secretary of state website multiple times per day. Each time I download the data I grab new versions of files representing how many Mail-In or In-Person votes have happened since mail-in votes have started to be accepted, according to the TX SOS. Note that this TX Early Voting return data, which is required by law to be publicly posted daily, is supposed to reflect the number of voted ballots (either In-Person or Mail-In) per the previous days in the ongoing election and serves as the official public record of these ballot transactions.
The TX SOS does site not post the cumulative results, but instead has individual links by day that show the totals of each category of voted ballot. I have downloaded copies all of this data over multiple days.
Now you would think, that if the TX SOS data was trustworthy and accurate, that I shouldn’t see differences in the historical data on the TX SOS site day to day. I should see new data as a newly available download, but the data associated with previous days results should stay the same.
… except it doesn’t.
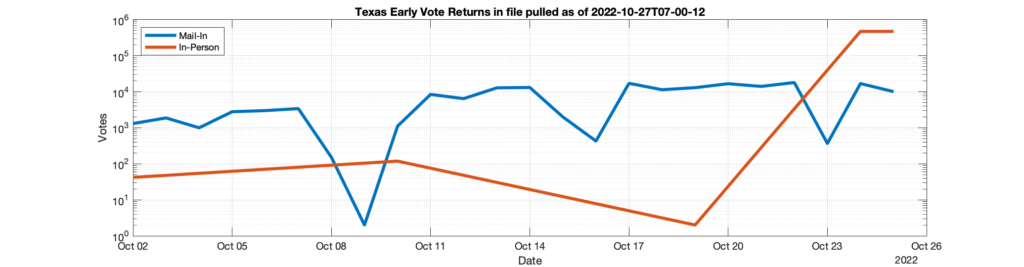
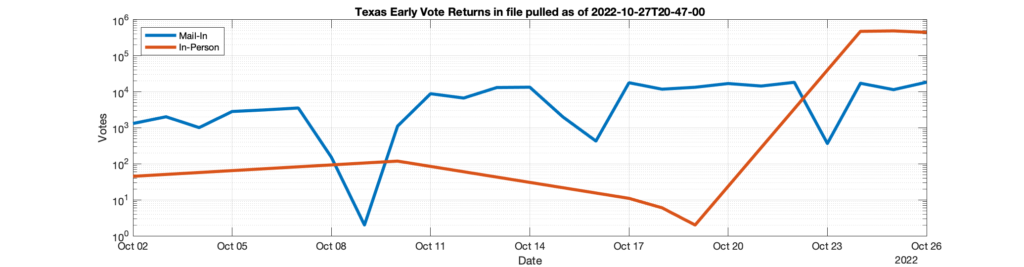
In the gallery below are 3 separate graphs of the data pulled from the TX SOS site. Each pull of the data grabbed the entire history of the data.
If you play the images in sequence you will notice that between the 1st (captured on 10/26 @ ~3pm) and second image (captured 10/27 @ ~7am) there are a few thousand ballots that suddenly appear in the Mail-In ballot trace attributed to 10/22. Between the second and third image (captured 10/27 @ ~9PM) you will see that there are a handful (~10) of ballots that get retrospectively added to the In-Person ballot totals attributed to 10/17 and 10/18.
What is the explanation for these additions?
I’m happy to supply the raw downloaded and timestamped files to anyone who is interested. Feel free to contact me and I will send the latest zip files and source code used to download.
Similar to the statistics that I have been computing for the VA Daily Absentee List (DAL), I have also been collecting the daily early voting reports from the GA secretary of states website. These are also a set of cumulative files that track the status of early and absentee ballots.
I’m using the same set of processing techniques on the GA data as I am doing with the VA datafiles, save for some slight tweaks due to differences in the datasets. (1) GA doesn’t have the ‘Marked’ or ‘Pre-Processed’ distinction in how they track their mail in ballots like VA does, those records are all simply labeled as ‘Mail-In’. (2) GA has an ‘Electronic’ category for ballots, which I’m assuming is the equivalent of the ‘FWAB’ category in VA.
There are two plots below representing the same data, one plot with a linear y-axis and the other with a logarithmic y-axis. The x-axis is the date that each DAL file processed was archived and pulled from the Dept of Elections servers. Solid traces are directly extracted data from the DAL files. Dashed traces are computed metrics such as the number of “vanished” voters detected. Red datapoints are placed on traces that exhibit questionable behavior, for example if the number of “approved” and “countable” ballots ever decreases, etc. Vertical dotted lines indicate important dates.
All of the latest plots for every locality and precinct as well as the corresponding underlying CSV data files will be updated daily, and you can download them here.
The semilog versions of the plots for all localities or precincts that appear in the DAL data per locality are shown in the gallery below. The image carousel below might take a moment to load, btw.
No permissions to browse the folder or the folder does not exist
Here is the changes to the voter registration numbers for each VA locality over the course of the 2022 general election. These files will be updated automatically as the data becomes available. The first graph below is the percent change with the color coding clamped to +/- 3 x the standard deviation, and the second is the absolute percent change.