Recently I’ve started downloading all of the data from the TX secretary of state website multiple times per day. Each time I download the data I grab new versions of files representing how many Mail-In or In-Person votes have happened since mail-in votes have started to be accepted, according to the TX SOS. Note that this TX Early Voting return data, which is required by law to be publicly posted daily, is supposed to reflect the number of voted ballots (either In-Person or Mail-In) per the previous days in the ongoing election and serves as the official public record of these ballot transactions.
The TX SOS does site not post the cumulative results, but instead has individual links by day that show the totals of each category of voted ballot. I have downloaded copies all of this data over multiple days.
Now you would think, that if the TX SOS data was trustworthy and accurate, that I shouldn’t see differences in the historical data on the TX SOS site day to day. I should see new data as a newly available download, but the data associated with previous days results should stay the same.
… except it doesn’t.
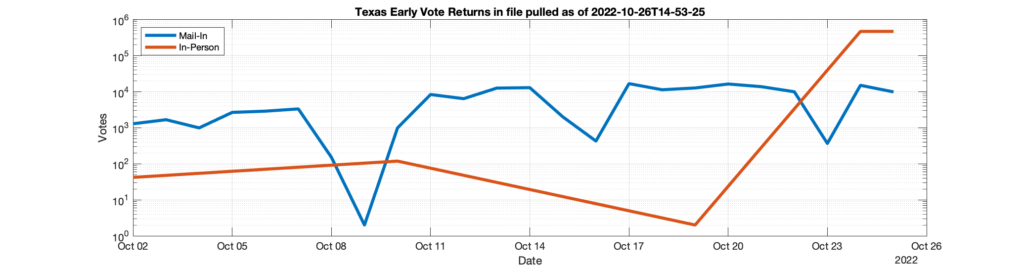
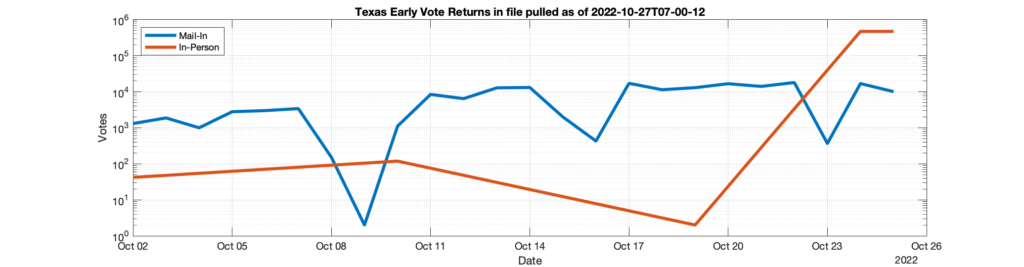
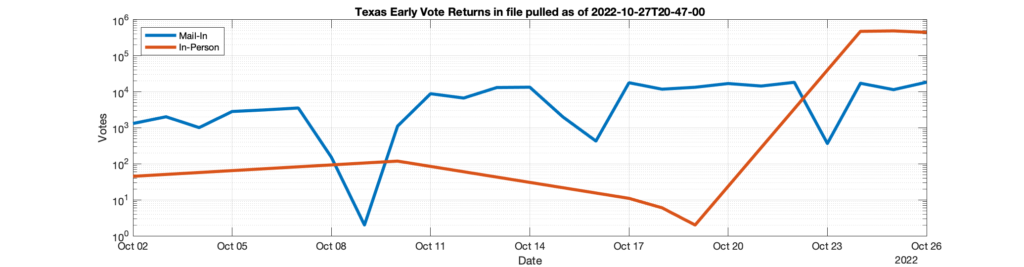
In the gallery below are 3 separate graphs of the data pulled from the TX SOS site. Each pull of the data grabbed the entire history of the data.
If you play the images in sequence you will notice that between the 1st (captured on 10/26 @ ~3pm) and second image (captured 10/27 @ ~7am) there are a few thousand ballots that suddenly appear in the Mail-In ballot trace attributed to 10/22. Between the second and third image (captured 10/27 @ ~9PM) you will see that there are a handful (~10) of ballots that get retrospectively added to the In-Person ballot totals attributed to 10/17 and 10/18.
What is the explanation for these additions?
I’m happy to supply the raw downloaded and timestamped files to anyone who is interested. Feel free to contact me and I will send the latest zip files and source code used to download.