Updated 19:17 2021-08-03
See also my post on “excess” absentee votes in VA here.
I’m going to keep my previous blog page Statistical Detection of Election Irregularities:2020 updated with the Nitty-Gritty details of processing these fingerprints. This page I’m just going to post the latest results that I have for each state, and let the data speak for itself.
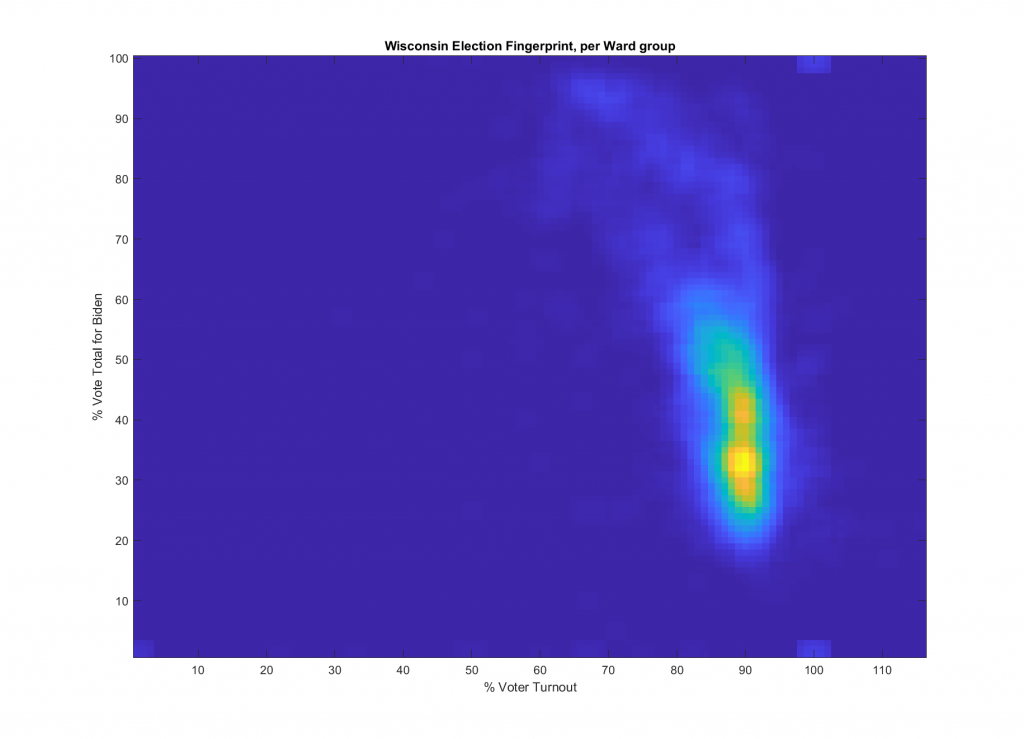
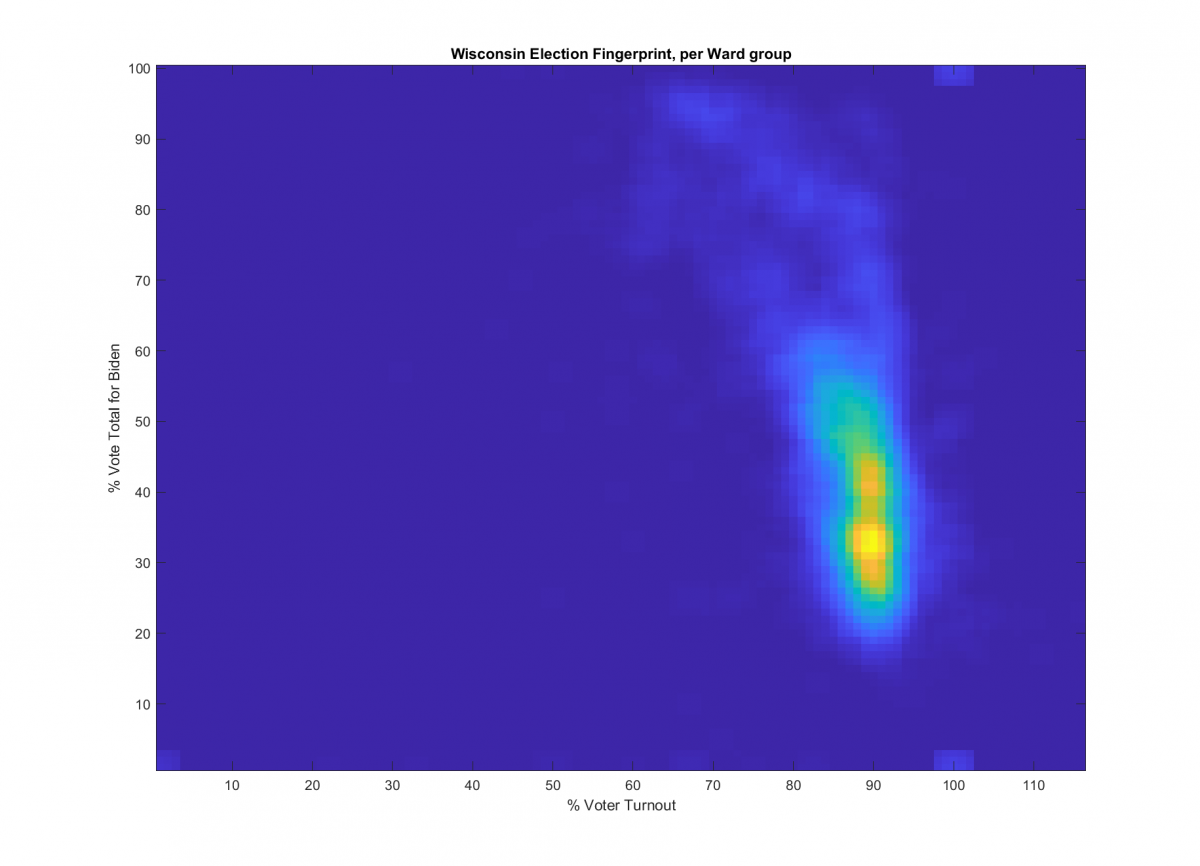
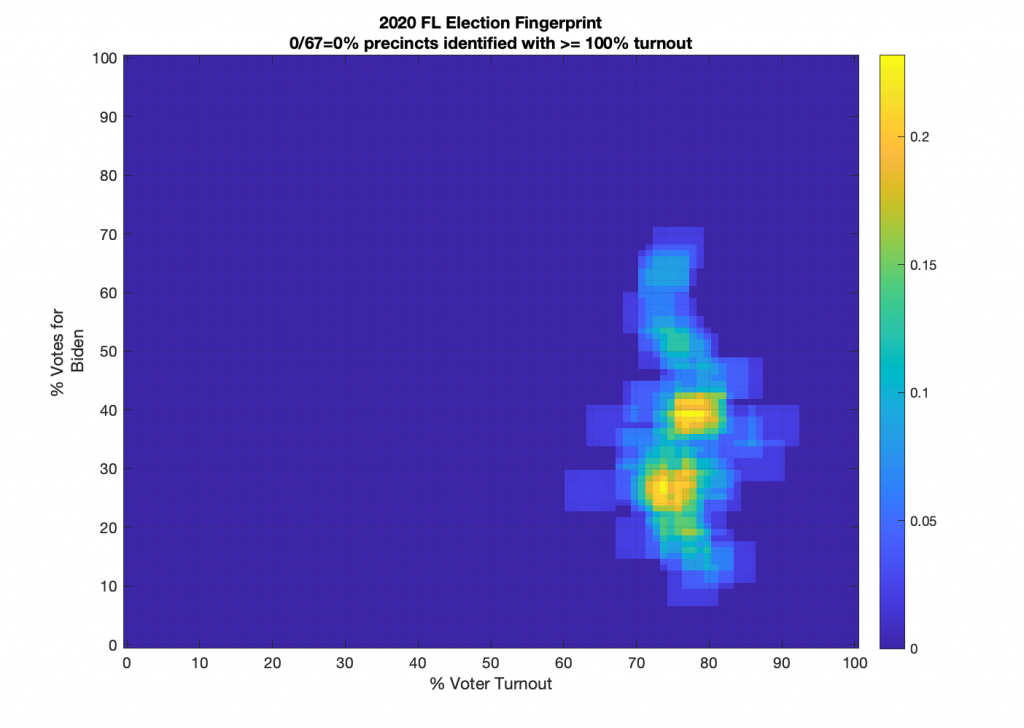
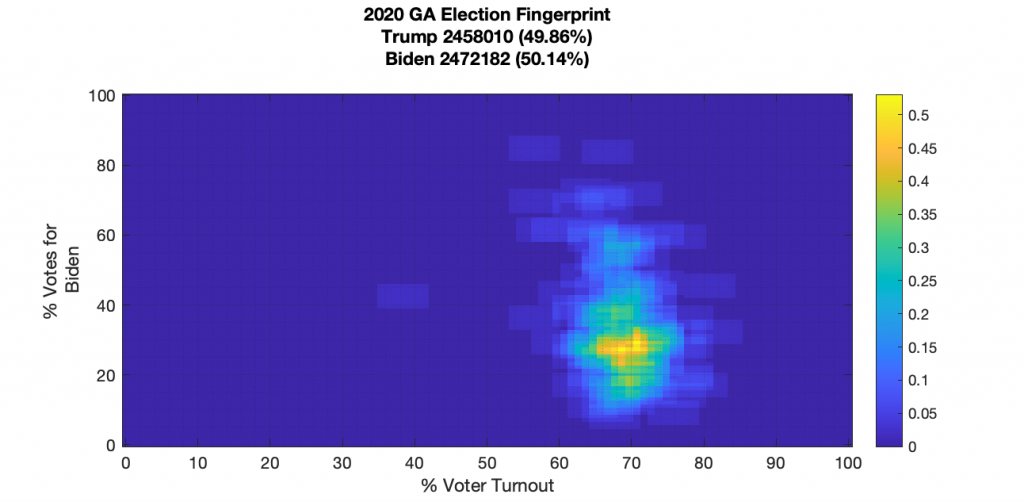
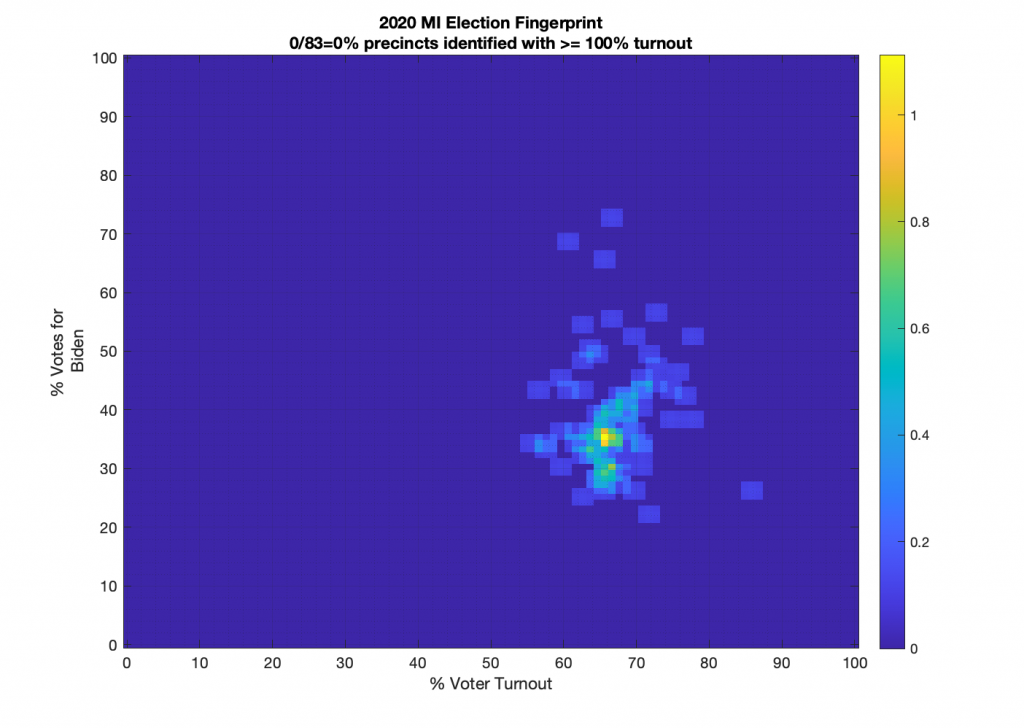
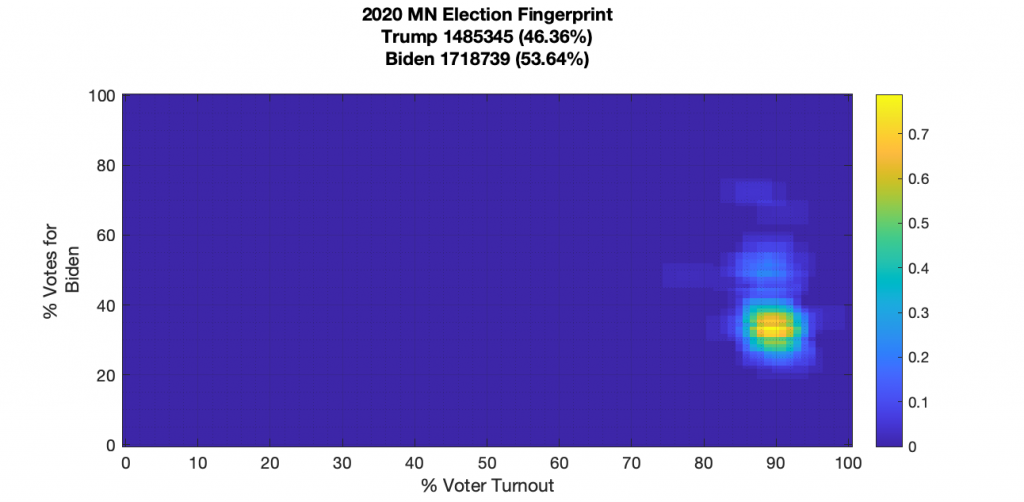
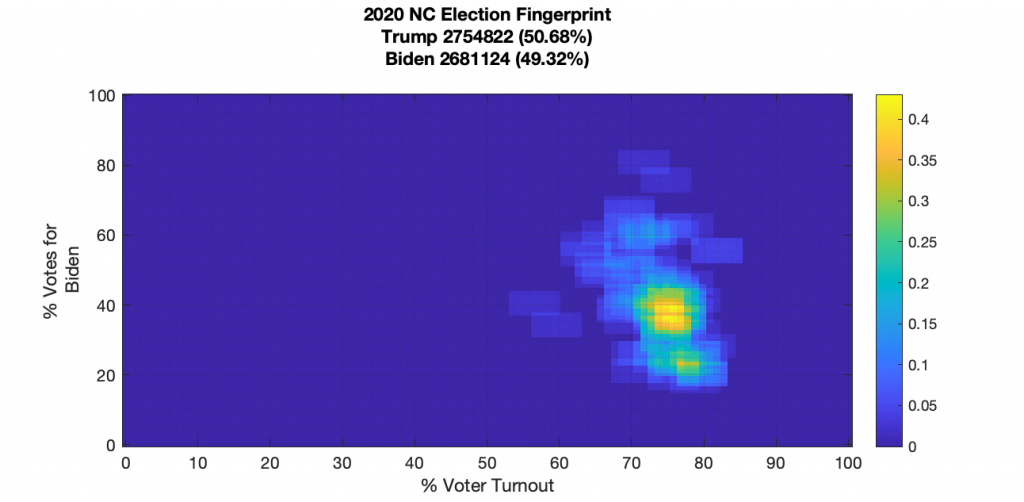
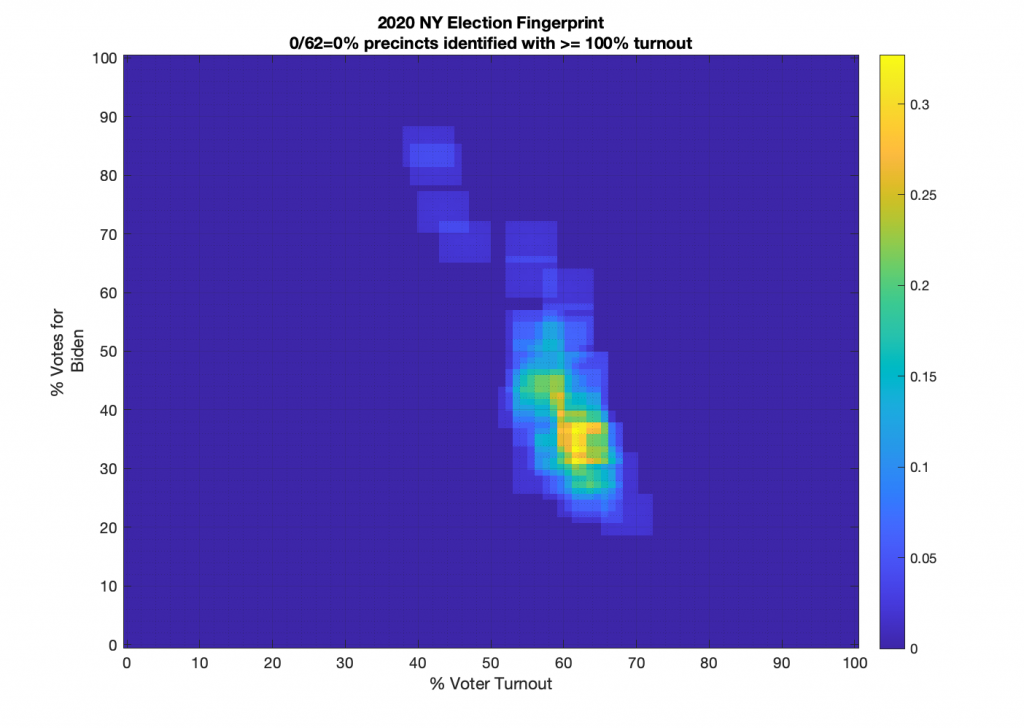
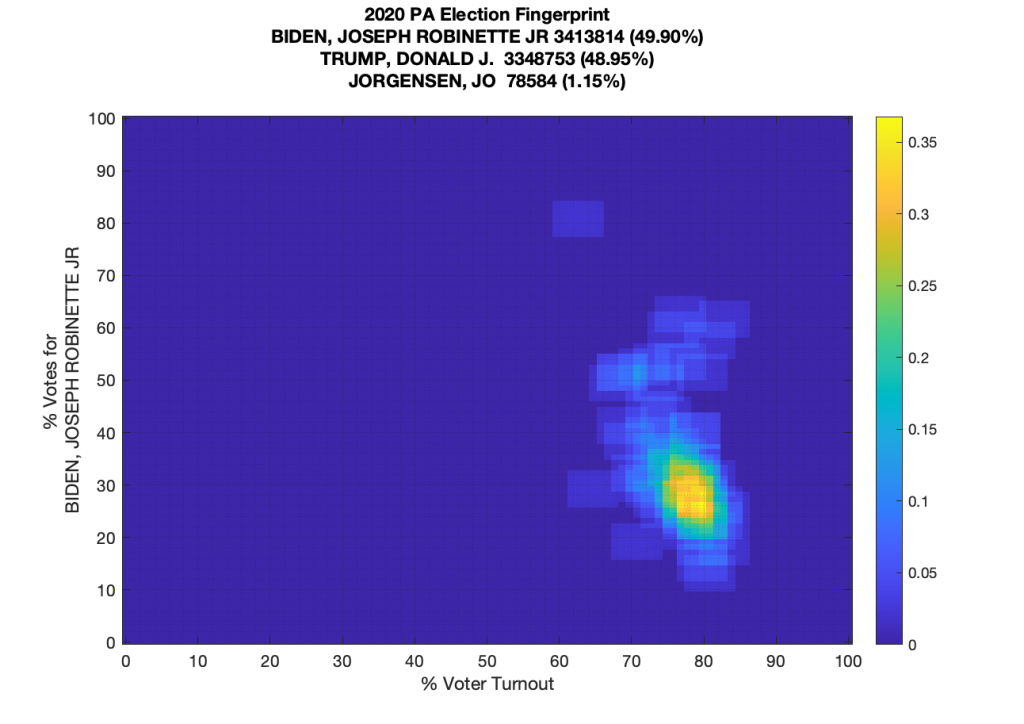
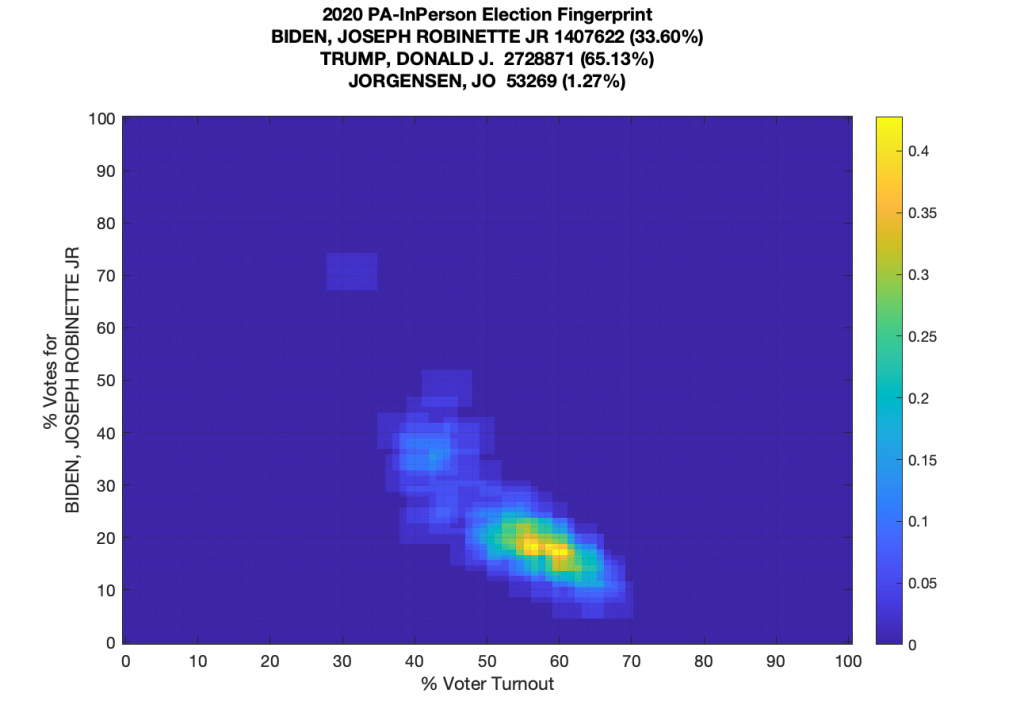
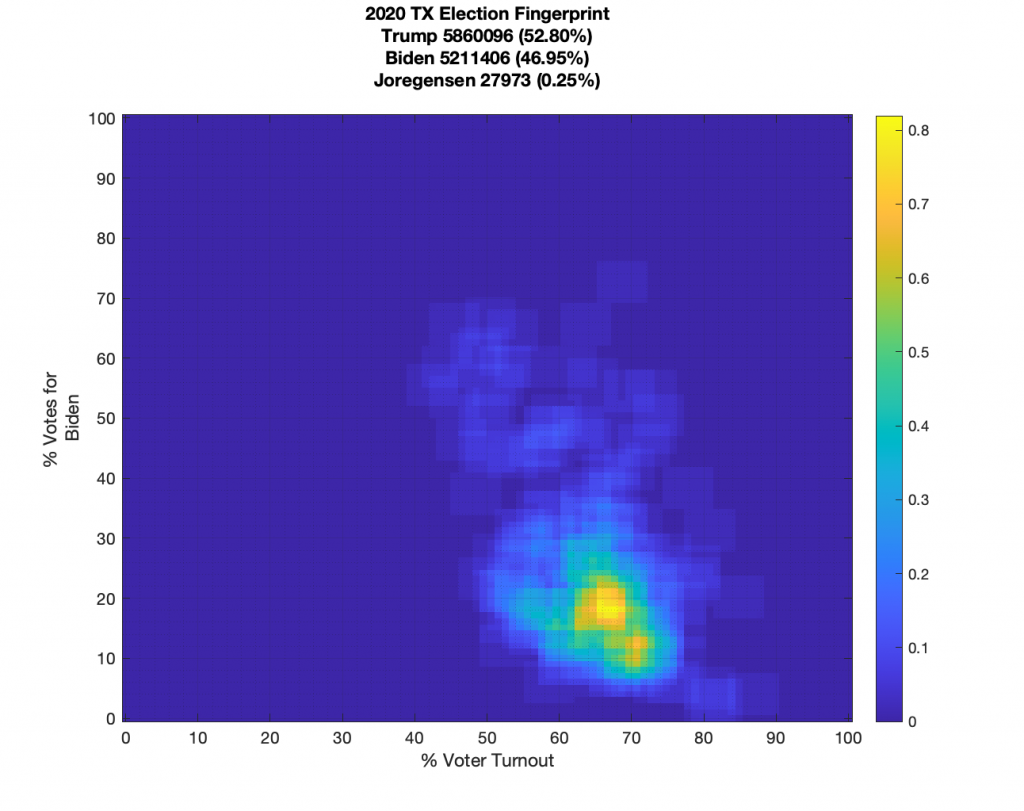
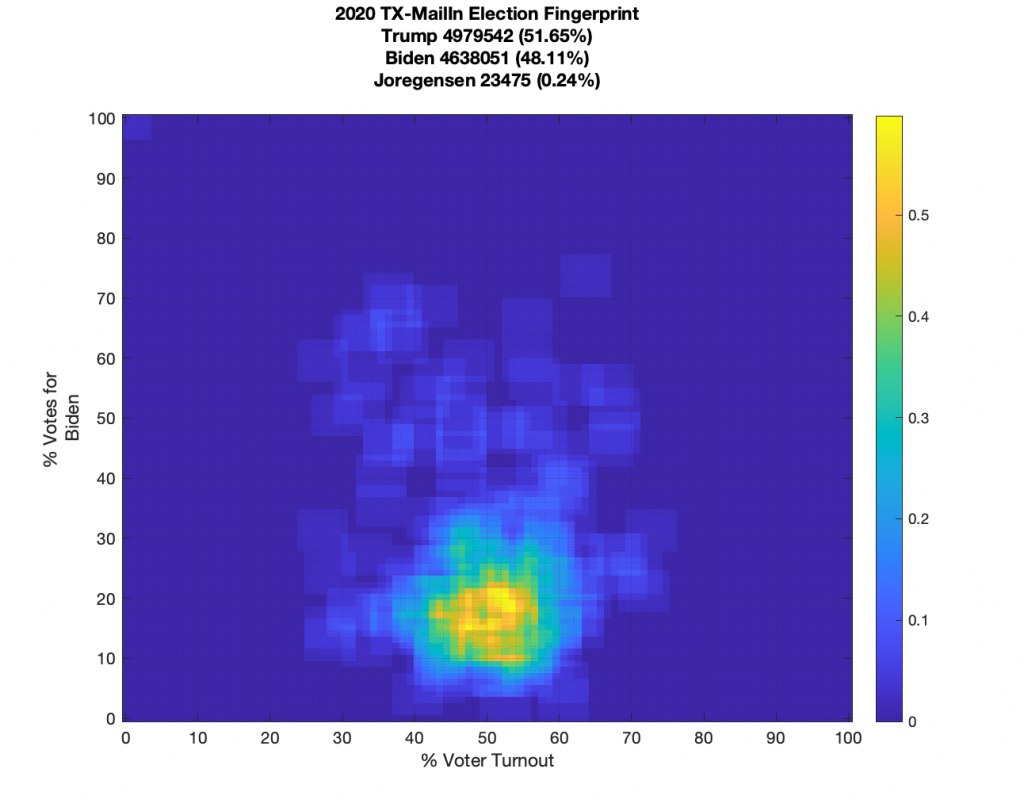
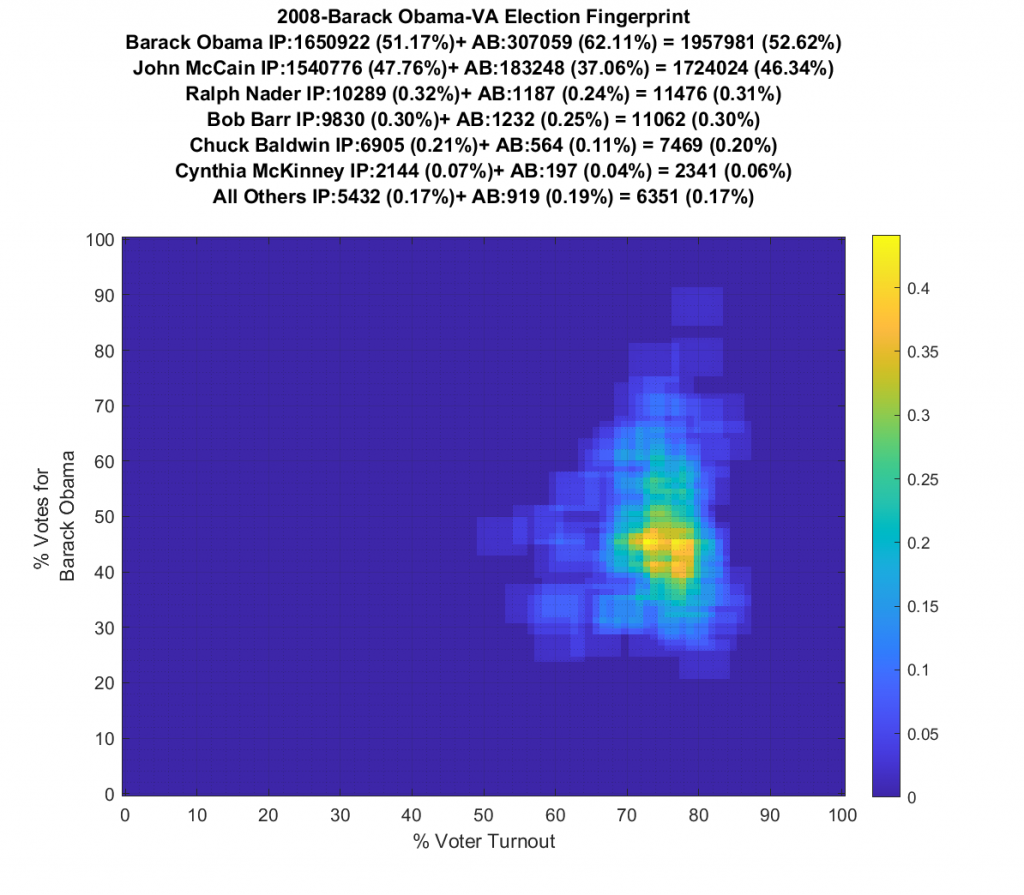
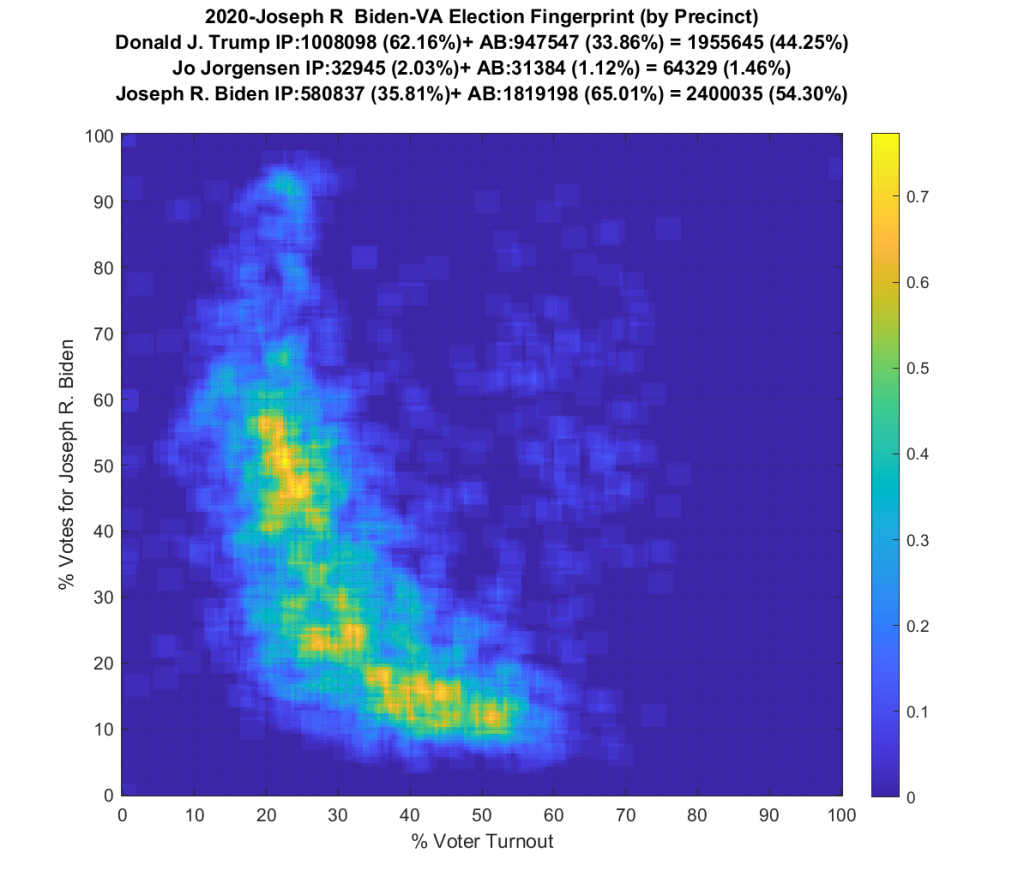
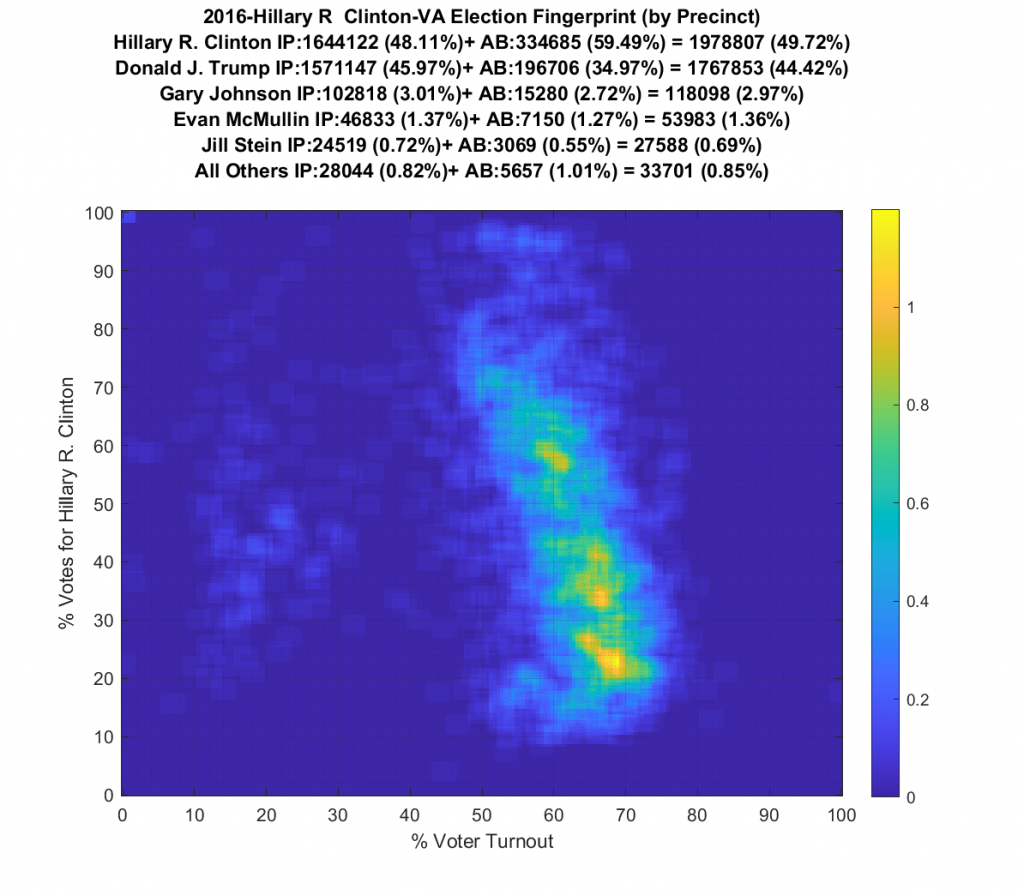
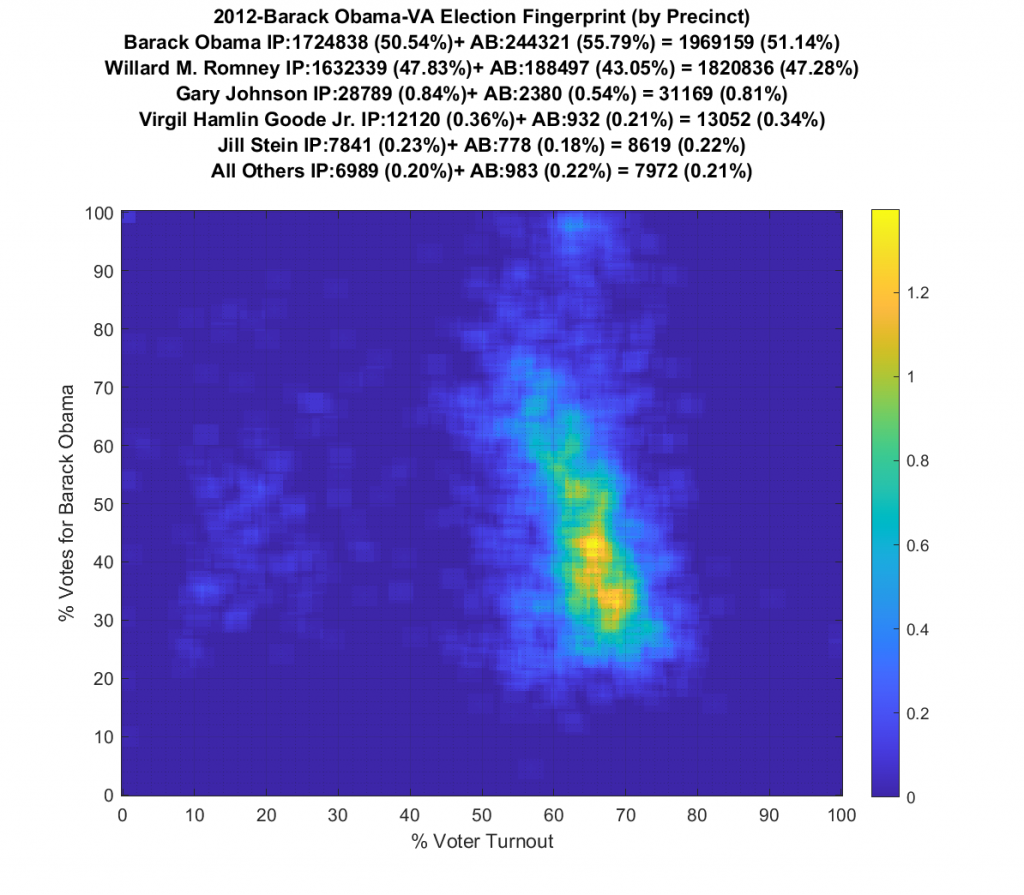
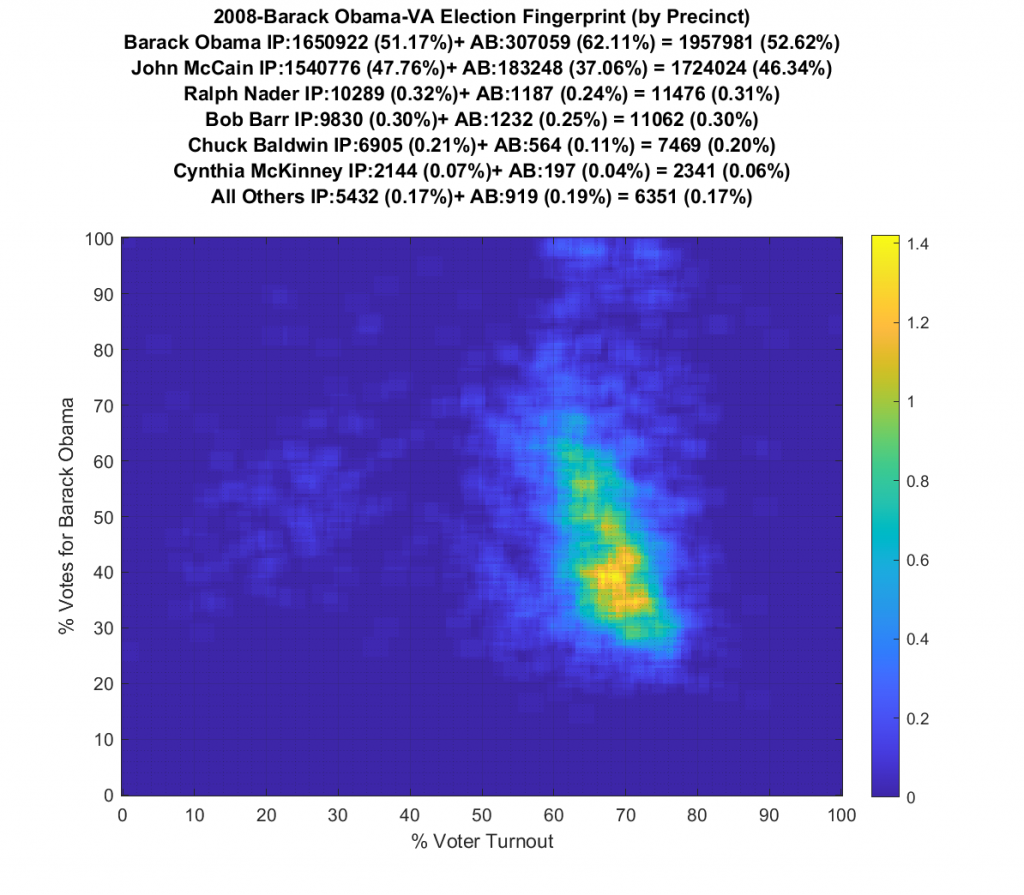
As a reminder and summary, according to the published methods in the National Academy of Sciences paper (here), an ideal “fair” election should look like one or two (depending on how split the electorate is) clean, centered (as in symmetrical) Gaussian distributions (or “bulls-eye’s”). Other structural artifacts, while not conclusive, are evidence and indicators of election irregularities. An election irregularity with a known cause is that of a directional streaking, which implies an incremental fraud. Another known and attributed irregularity is that of large distinct peaks in near 100% votes for the winner (the vertical axis) that are disconnected from the main lobe which the authors label a sign of “extreme fraud”.
I welcome any and all independent reviews or assistance in making and double checking these results, and will gladly provide all collated source data and MATLAB code to anyone who is interested.
Bottom Line Up Front:
None of the states election fingerprints I’ve done are perfect, but PA, WI and VA stand out as having significant irregularities. FL, GA, MI, NY and TX I’d still label as deserving scrutiny as they show significant non-Gaussian structures. MN, and NC all have imperfections, but no major structural irregularities. MN look to be the cleanest distributions of all so far.
One really interesting aspect of the analysis I’ve been doing is to look at the trend over time of VA between 2008, 2012, 2016 and 2020 as the per county fingerprint has shifted from a much more “fair” distribution to one that has distinct structural artifacts indicative of election manipulation. And no, this change isn’t a sign of changing demographics … mathematically that would just move the centroid of the “bulls-eye” and not impose such significant structural irregularities. The VA historical data seems to confirm the hypothesis that these irregularities have been increasing over the years.
FL (by County):
GA (by County):
MI (by County):
MN (by County):
NC (by County):
NY (by County):
PA (by County):
PA (by County, In Person Only):
PA (by County, Mail-In Only):

TX (by County):
TX (by County, Early Vote Only):
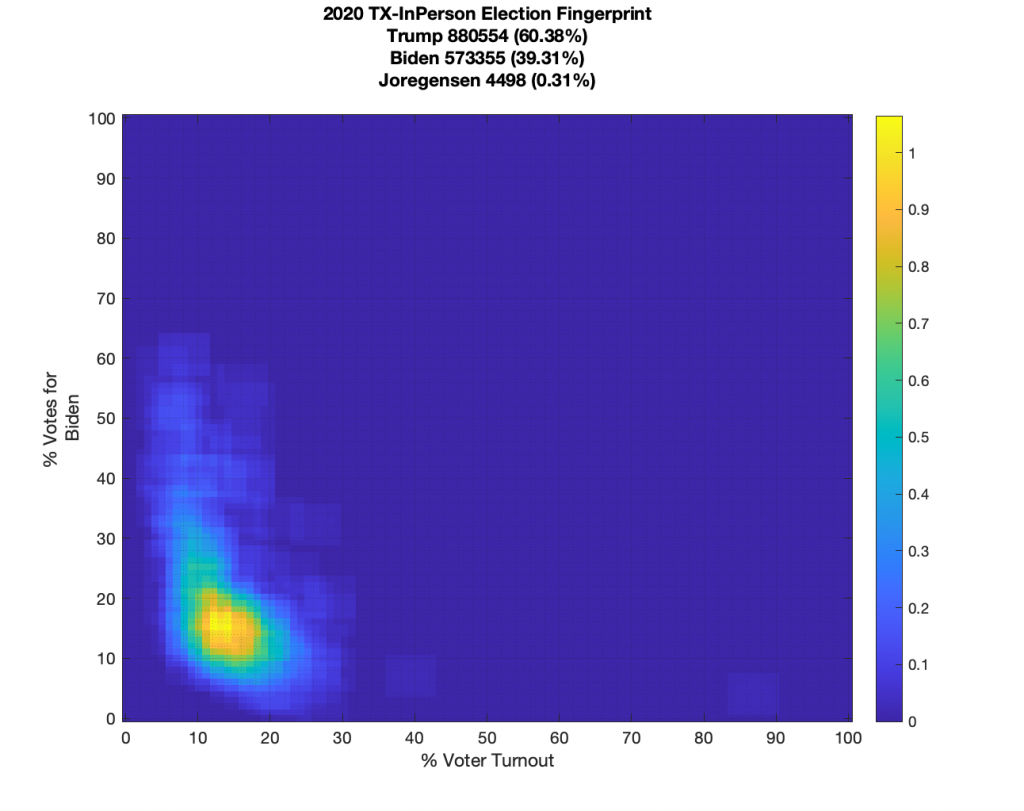
TX (by County, In Person Vote Only);
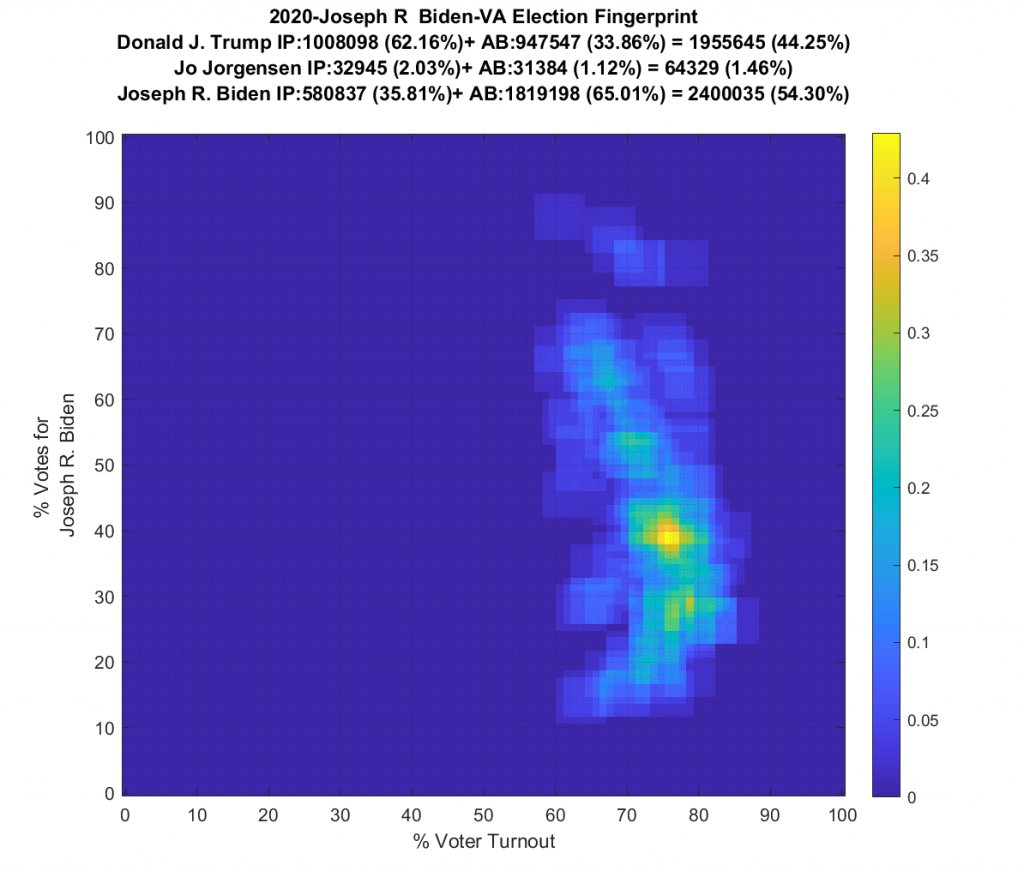
VA (by County):
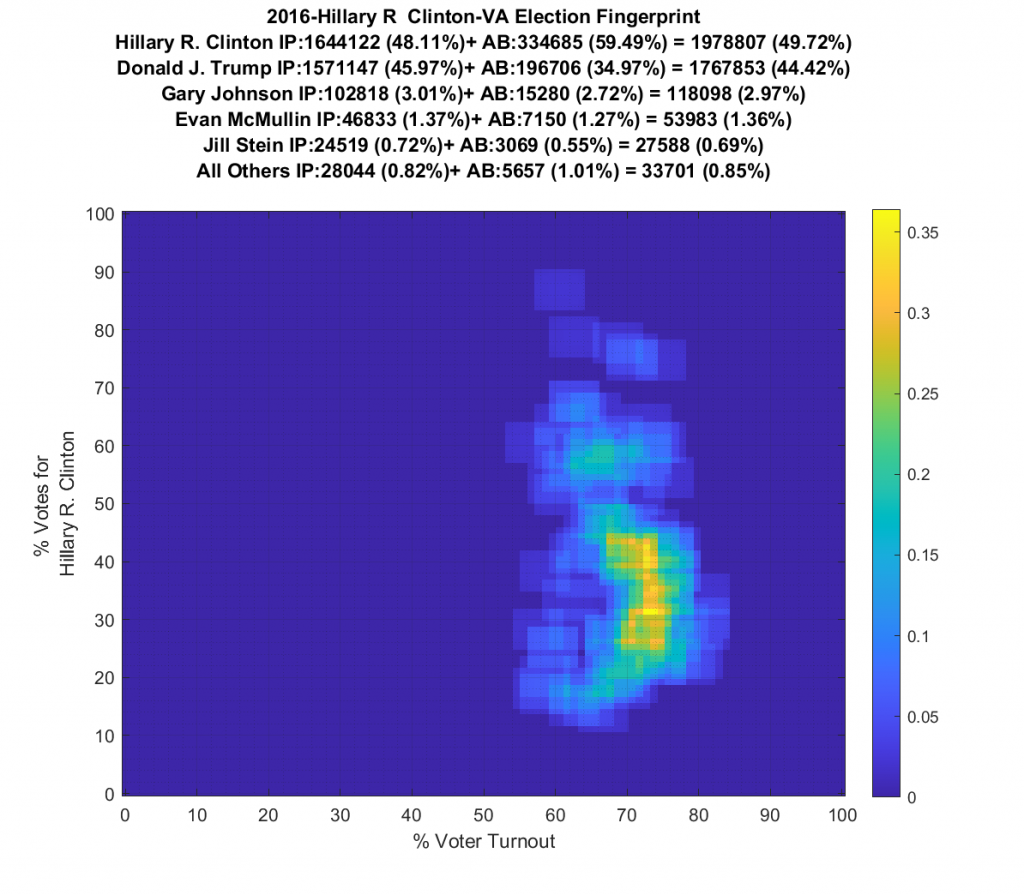
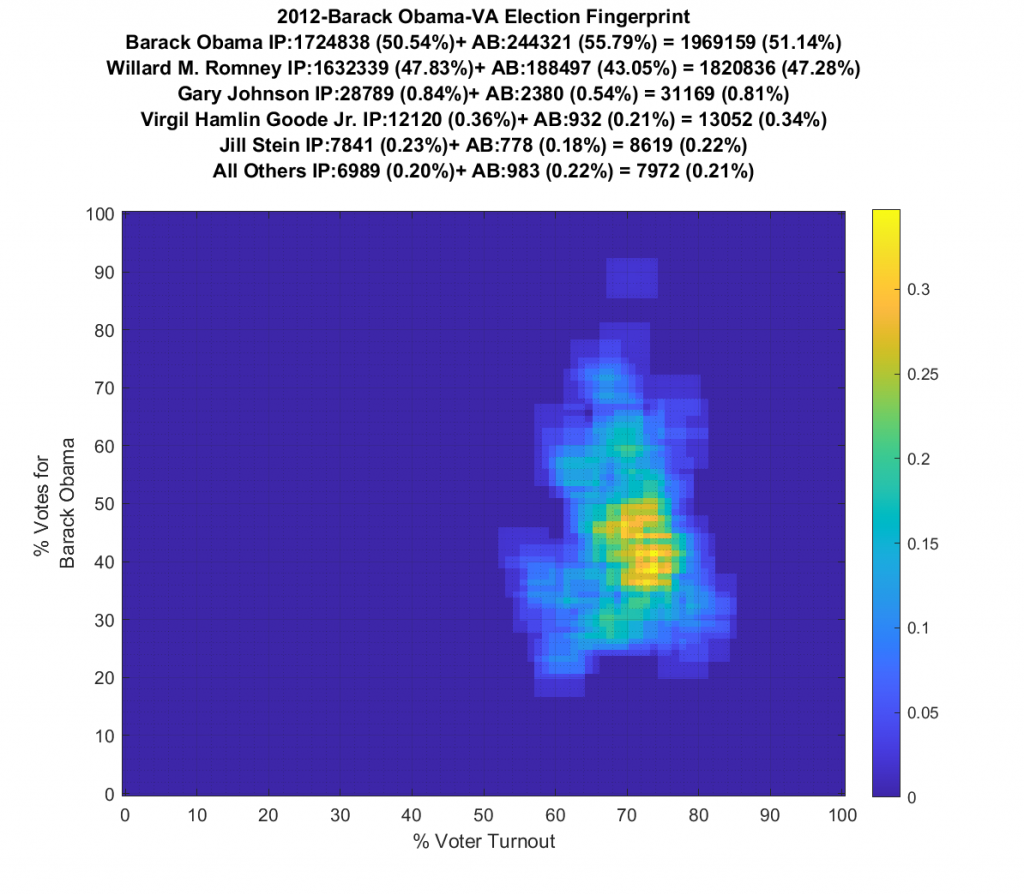
VA 2016, 2012, 2008 (by County) for comparison:
VA (by Precint):
VA 2016, 2012, 2008 (by Precinct) for comparison:
WI (by County):