See also my previous election fingerprint blog posts here, and here. There is another, related, discrepancy in the Daily Absentee List data that I document here.
Originally Posted 2020-12-01 10:58:00 (Multiple Updates)
After computing the VA election fingerprints which clearly indicate that more investigation is required into the 2020 VA vote data, I took a look at the official VA daily absentee ballot count file and compared it with the JSON reports from VA dept of elections. The JSON data provides a summary total of the votes recorded at each virtual absentee precinct, and the daily absentee list (here) gives all of the absentee ballot registrations for each precinct. For each (virtual) absentee precinct in a locality I summed all of the daily absentee numbers from component real precincts in order to compare those numbers with the reported total absentee votes. If everything has been tallied and recorded correctly they should be equal, or at least close.
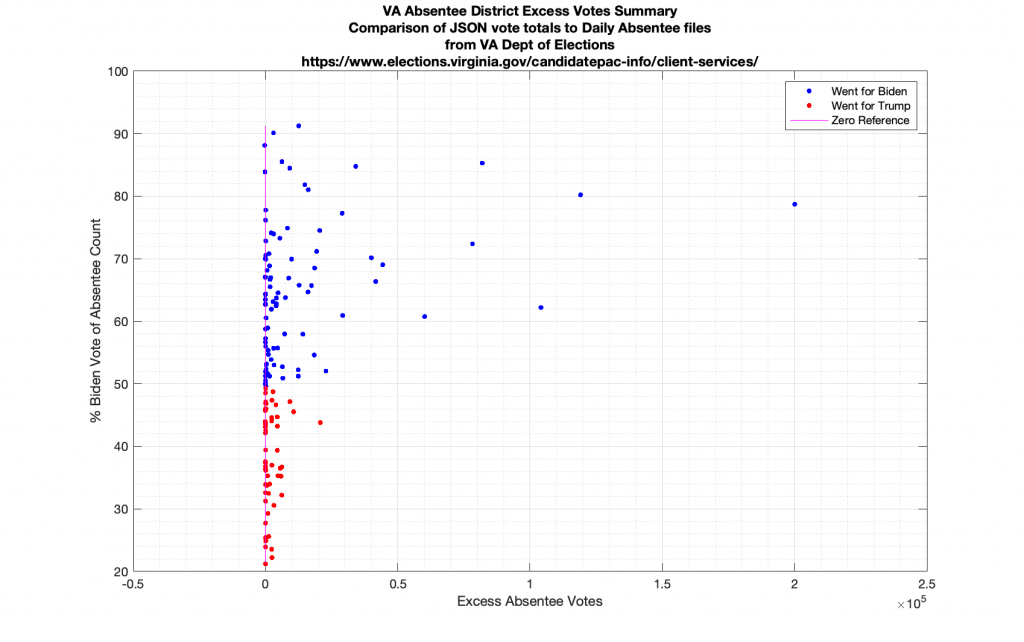
I then compute the “excess absentee vote” by taking the difference of the number of total absentee votes reported in each virtual absentee precinct minus the cumulative (‘Marked’ + ‘Pre-Processed’ + ‘OnMachine’ + ‘FWAB’) numbers for the absentee precinct.
I finally plotted the “excess absentee” vote totals vs the % of the absentee precinct vote that went for Biden. Ideally we would like to see excess absentee vote == 0, meaning that the daily absentee reports and the number of absentee ballots that were counted in each virtual precinct match perfectly. (I’ll give you a hint … they don’t.)
Outstanding Question: Is there a description document someplace where the BALLOT_STATUS (‘Marked’, etc) meanings are described. I’m using my best guess as to which categories map to valid ballots, and I’d like to double check that.
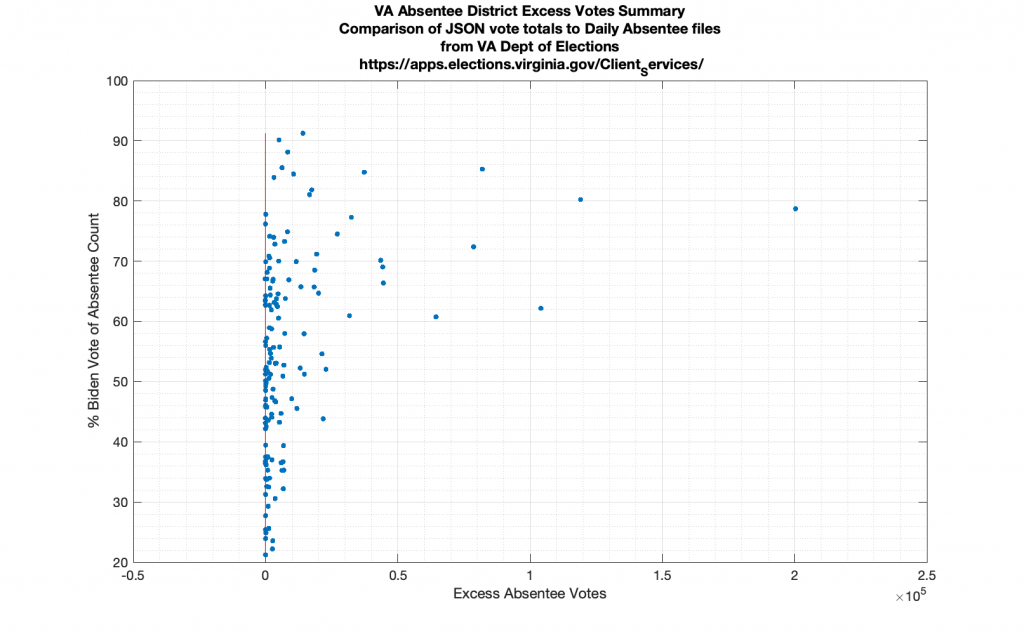
Each dot in the plot above represents one of the virtual absentee precincts across the commonwealth. Unsurprisingly, we can clearly see that as the number of excess absentee votes increases more of the absentee vote totals go to Biden. Summing over all of the excess votes, there were 1,334,968 excess absentee votes across VA in the 2020 election using this method. Where did these 1,334,968 votes come from? (See latest updates below)
All source data comes directly from the VA Dept of Elections. My tabulated results are posted below. I welcome any / all peer review and will gladly make my code and compiled datasets available.
Note: Removed incorrect files ... see updates below
Update 2020-12-01 19:30:00
In discussions with The Virginia Project and others that have been churning and burning through this data, there was a question as to weather or not the Daily Absentee Tally dataset (which is available to campaigns by request from the dept of elections), which is what I used above includes the In-Person early vote. My understanding is that the early vote was treated the same as No Excuse Absentee, so early vote numbers *should* be included in the Daily Absentee Tally dataset. But it looks like that might not be true. The JSON files published by VA dept of elections only give the sum totals per candidate per precinct (including absentee precincts), and I used the Daily Absentee Tally dataset to map how many absentee (and early votes) should correspond to each precinct.
However, there is another dataset that I was pointed to that could be a useful comparison and way to compute the missing numbers: that is the Summary Absentee Dataset located here. This dataset DOES contain the In-Person early vote absentee totals (‘ApplicationType’ == ‘In Person’), but it is only generated per absentee counting precinct and not mapped back to the voters physical precinct. It does however break down the Absentee votes per age group, gender, and type of absentee ballot … which is nice … but not what I’m looking for at the moment.
So, we have two datasets, both summaries of the absentee vote numbers with different breakdowns, that *should* sum to give the same totals. Surprise … they don’t. Why? Unknown. The ‘In Person’ vote not being included in the Daily tally does not reconcile the numbers between the two datasets, though.
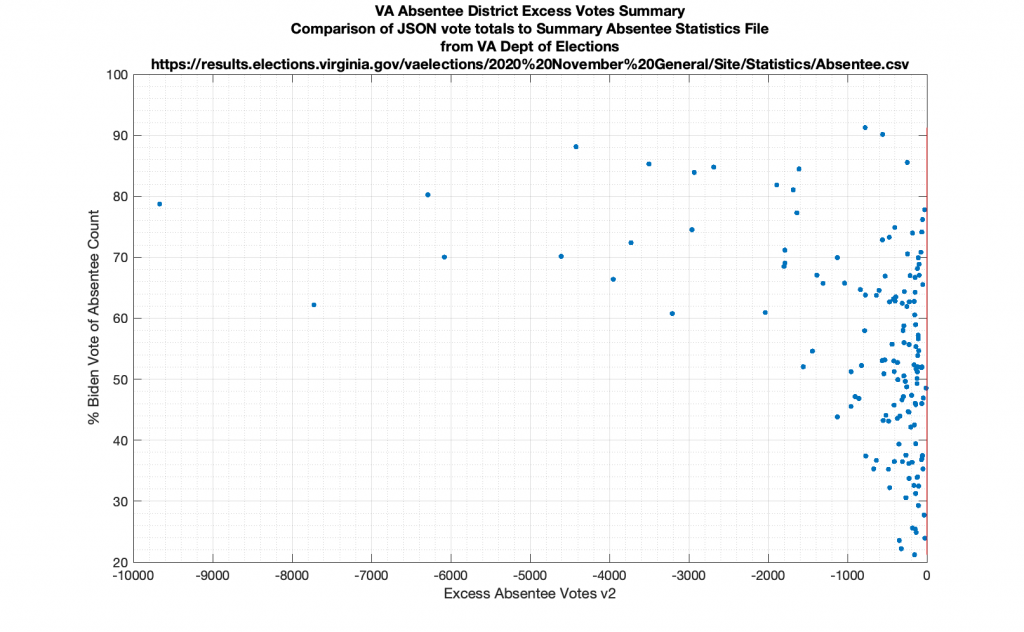
The plot I generated above, redone with this other dataset is shown below. I’ve included new csv files with the additional data (I’ve labeled as “_V2”). The excess votes per absentee district are similarly computed as the totalVote reported by each absentee precinct (from the JSON files) minus the sum count of all of the Absentee/Mail-In numbers from the Summary Absentee Dataset for that absentee precinct. This new plot does not show positive excess votes, but instead shows negative excess votes, with higher negative excess votes also showing higher Biden total vote percentage. I don’t know which one is correct, but both seem to show high positive / negative excess vote numbers that align with higher Biden percent of the vote. Summing over all of the negative excess votes gives -121,049 votes that are unaccounted for.
One additional question I have is how to tease out the rejection rate of Absentee/Mail-In votes, which might be a contributing factor for both plots. Are the numbers in the Daily or Summary absentee stats files before or after rejection? I have so far not been able to find a dataset that captures the rejection rates for Absentee/Main-In ballots.
Note: Removed incorrect files ... see updates below
Update 2020-12-04 02:00:00
So I’ve been able to confirm that the Daily Absentee List DOES, in fact, contain the In-Person “early” votes. I did this by finding my name and address in the list as I voted early on Oct 26th. The early votes are the ones marked as “On Machine”. I will also note that the date reported for my early vote was incorrectly set to Oct 28th (I voted on the 26th), which is why I had difficulty finding it at first.
So this means that:
- My first plot above *should* be correct in its computation of the “excess absentee vote”. Save for a fat finger bug in my code (I’m in the process of double-checking, btw).
- The Summary Absentee count does not match the totals from the Daily Absentee List. Why?
- If the Daily list is correct, and the excess vote is computed correctly above in the first plot, then how to account for the 1,334,968 excess votes?
Update 2020-12-06 00:05:00
I have revised my previously computed excess vote number of 185,713 to 1,334,968 due to finding some “fat finger” errors, and idiosyncrasies with the DAL file.
Yes, I know … thats a really big number! I’m going back over my code again to see where / if I screwed something up. I will continue to update if I find anything else.
I’ve also taken the time to clean up the plots, both with and without annotations as to which precincts were the most egregious offenders.

Update 2020-12-10 23:12:00
Happy to report that I found a logical bug in my code. I was subtracting PreProcessed ballots when I should have been adding when computing the excess vote with the DAL data (D’Oh!). It’s a simple bug, but produces a big difference. Result is a much smaller order of magnitude difference in the excess vote numbers, and a much more believable excess vote tally.
This line of code:
>> abCntVotes(j) = tdata.marked(j) + tdata.onMachine(j) - tdata.preProcessed(j) + tdata.fwab(j) ;
Should have read:
>> abCntVotes(j) = tdata.marked(j) + tdata.onMachine(j) + tdata.preProcessed(j) + tdata.fwab(j) ;
That’s the good news.
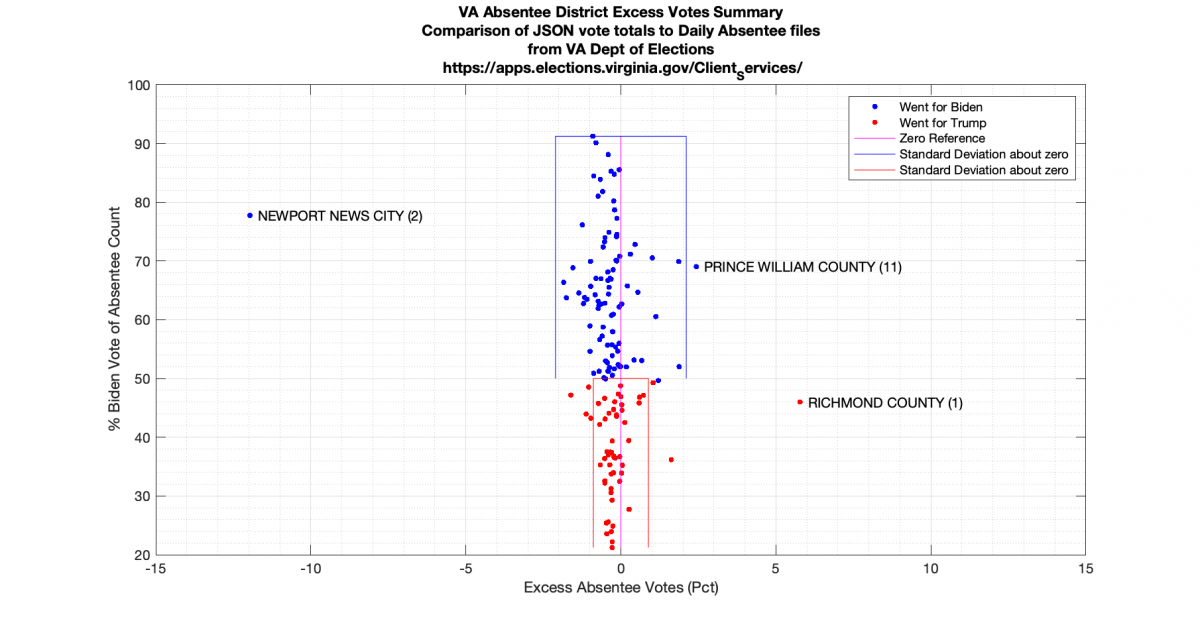
The first bit of bad news is that the Summary Absentee List (SAL) still doesn’t make much sense, as discussed in my 2020-12-01 update above. The other bad news is there are two absentee precincts that still stick out like a sore thumb from the DAL derived excess vote numbers. Guess which ones they are … PRINCE WILLIAM COUNTY (11) and PRINCE WILLIAM COUNTY (1)! PWC district 1 and 11 are both waaay outside the standard deviation on the plot below. Another curious fact is that we see the deviation on the Biden precincts (blue) looks markedly higher than the deviation in the Trump precincts (red)
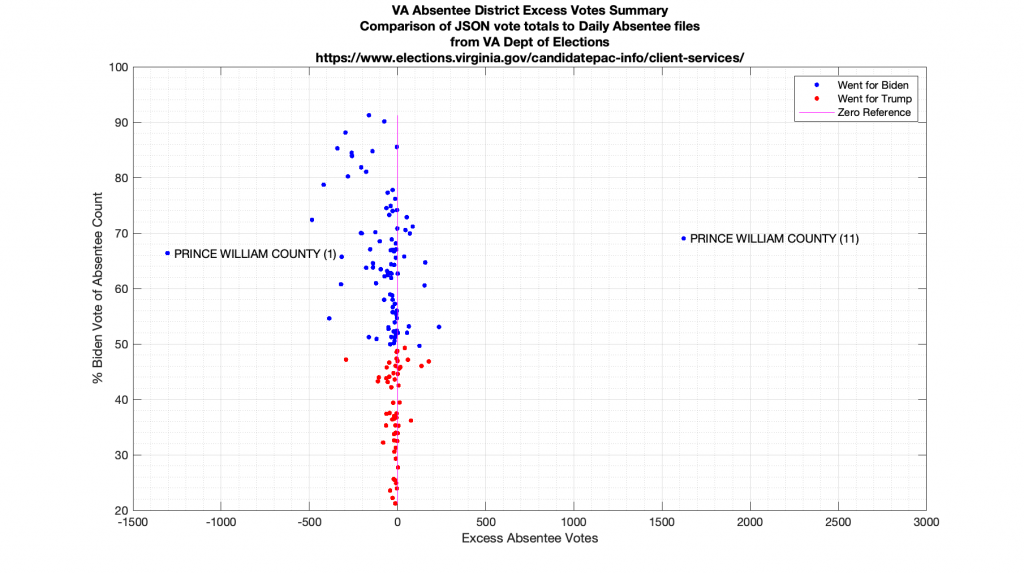
Now if we look at the summary totals of the PWC absentee precincts we see that the sum of the negative excess absentee counts of district 1 and 10, are almost a perfect complement of the district 11 excess count (far right column). That’s also curious. By itself I’d call that just a coincidence, but combined with the fact that PWC 11 and 01 are also so outside the general trends of all other precincts in the plot above that gets my worry beads out.
Per discussion with PWC staff, there was apparently an error in reporting election data that got caught and corrected where all absentee votes were being sent to the district 01 absentee precinct, so this might be an artifact of that issue.
Additionally, and this is something we see in all of the precinct data and in the JSON data itself. The JSON data files directly report the Trump, Jorgensen and Biden vote totals, as well as the ‘totalVotes’ numbers. The ‘sumVotes’ column below is the sum of the Trump, Jorgensen and Biden votes which should equal the ‘totalVotes’ column, but it doesn’t. It’s not usually a dramatic difference, but its a difference all the same.
Again, per discussion with PWC staff, the ‘totalVotes’ numbers reported by the Dept. of Elections JSON data feed includes items such as overvotes / undervotes / unmarked ballots, which count for turnout reasons, but don’t get attributed to a specific candidate.
| localityStr | precinctStr | Nreg | Donald J. Trump | Jo Jorgensen | Joseph R. Biden | sumVotes | totalVotes | issued | marked | onMachine | cancelled | deleted | fwab | late | notIssued | preProcessed | provisional | unmarked | absenteeVotesSum | excessAbsenteeVotes |
| PRINCE WILLIAM COUNTY | # AB – Central Absentee Precinct (01) | 115475 | 22720 | 781 | 46939 | 70440 | 70721 | 2590 | 3371 | 47143 | 0 | 6106 | 62 | 0 | 3 | 21449 | 0 | 91 | 72025 | -1304 |
| PRINCE WILLIAM COUNTY | # AB – Central Absentee Precinct (10) | 45383 | 10588 | 443 | 21371 | 32402 | 32525 | 968 | 1443 | 22543 | 0 | 2954 | 14 | 0 | 0 | 8842 | 1 | 42 | 32842 | -317 |
| PRINCE WILLIAM COUNTY | # AB – Central Absentee Precinct (11) | 106455 | 19579 | 782 | 46040 | 66401 | 66683 | 3303 | 3228 | 40443 | 0 | 5626 | 52 | 0 | 0 | 21338 | 0 | 111 | 65061 | 1622 |
So taking all of the above into account, and assuming that PWC 11 and 01 are artifacts of a data entry error, using the DAL and the JSON vote tallies we see that there is a good bit, but not extreme amounts, of variation in the “excess vote” and that the deviations in excess vote seems greater in blue precincts than in red precincts.
The SAL data still does not agree with the JSON or the DAL data files, and I’m still working to figure out why.
My tabulated results are posted below. Note that I do not include the raw DAL data in my results below, only my summarized results, as the raw data contains personal address information. I welcome any / all peer review and will gladly make my code and compiled datasets available.
Update 2020-12-13 17:44:00
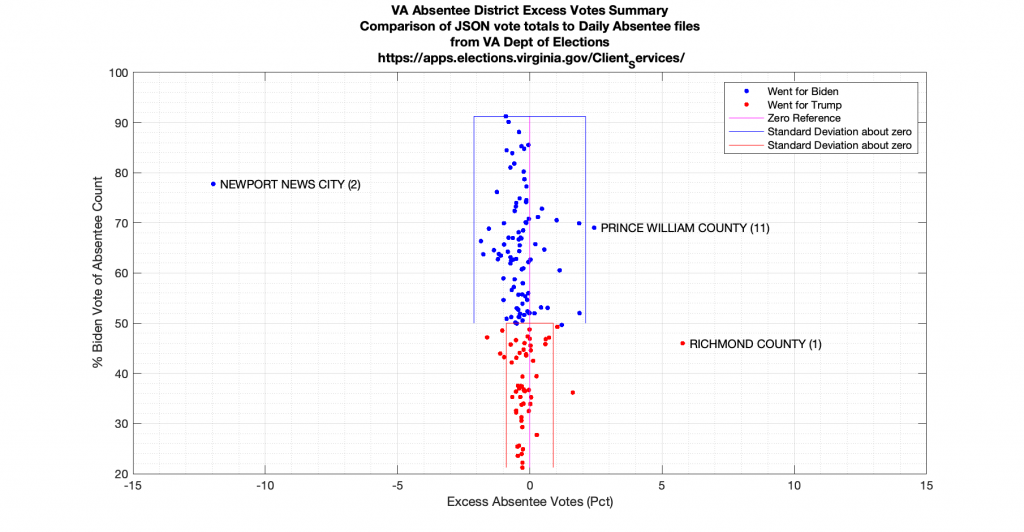
Per twitter comment, looking at the data with normalized x-axis (as percent of absentee vote total) in order to compensate for different precinct sizes produces the plot below. Newport News City and Richmond County now also stand out, and we still see a difference in deviation of excess votes between Biden precincts and Trump precincts.