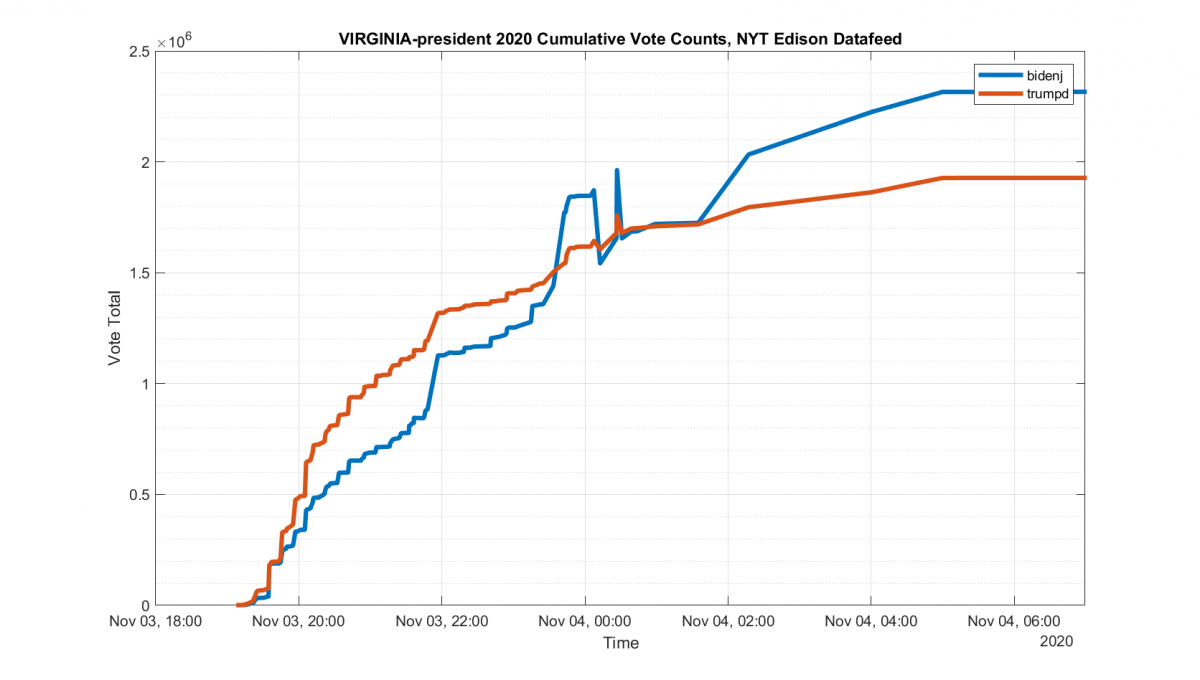
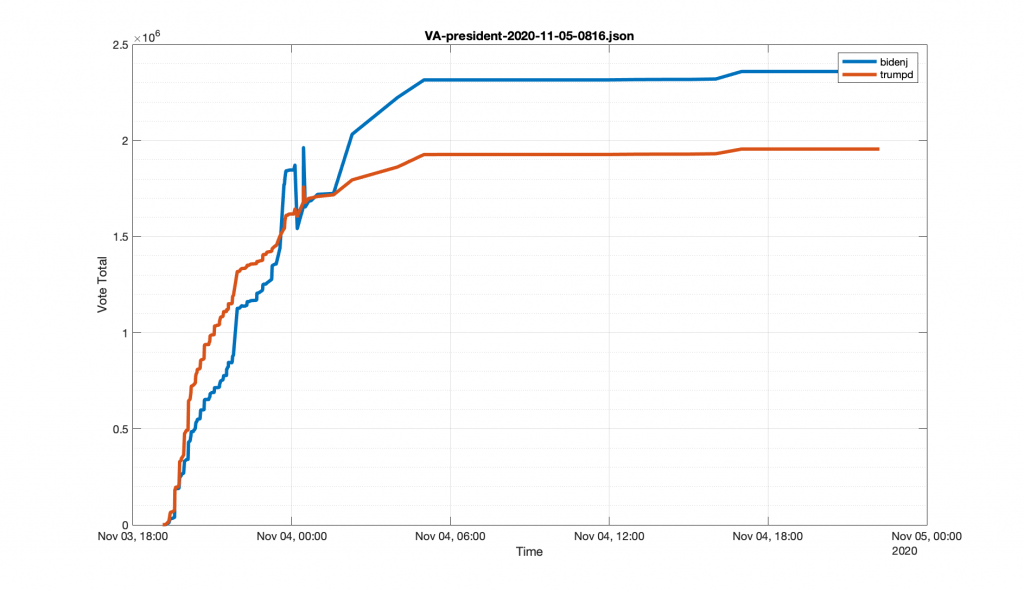
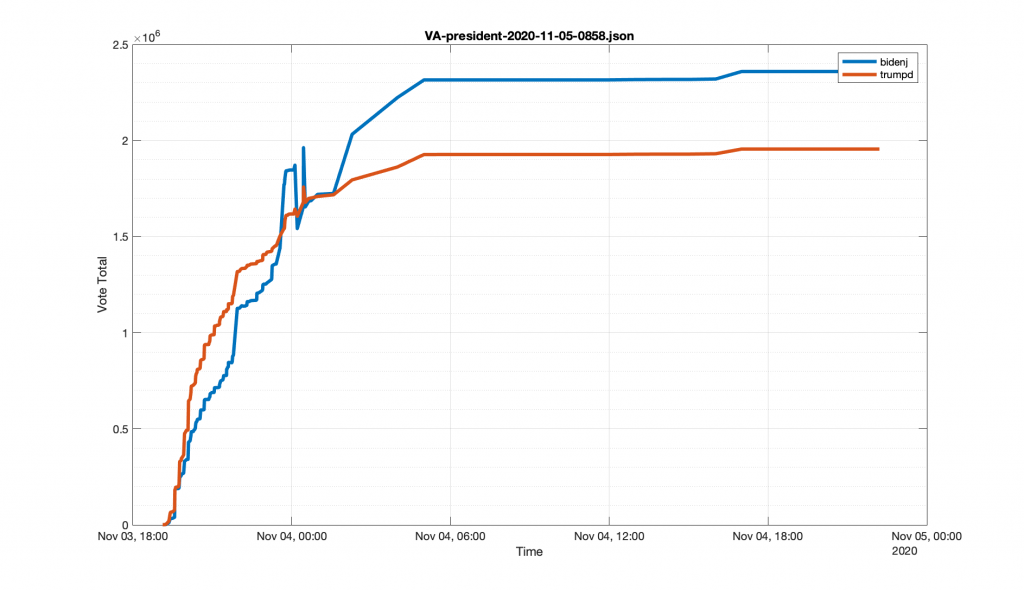
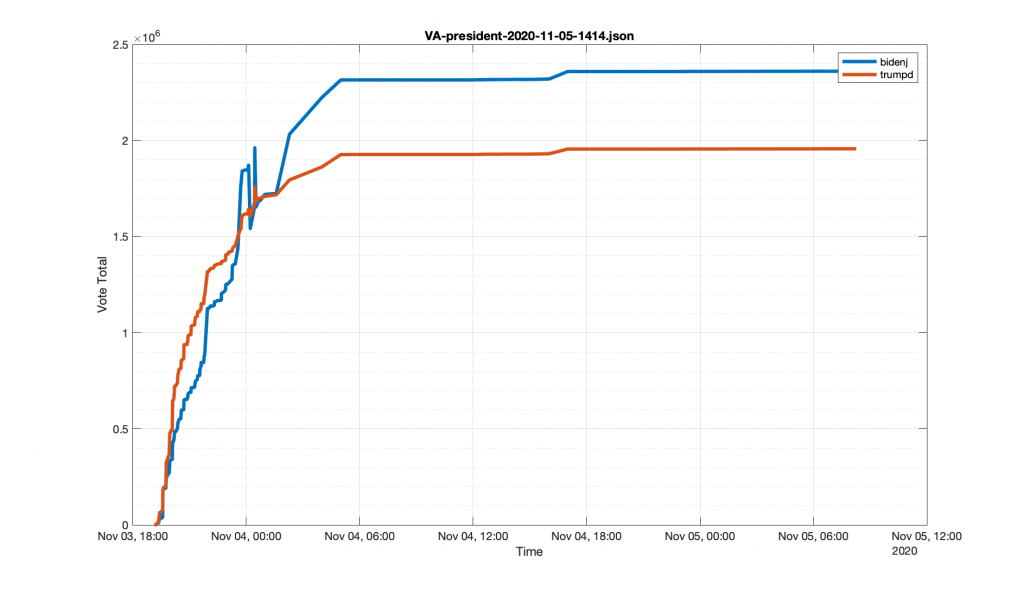
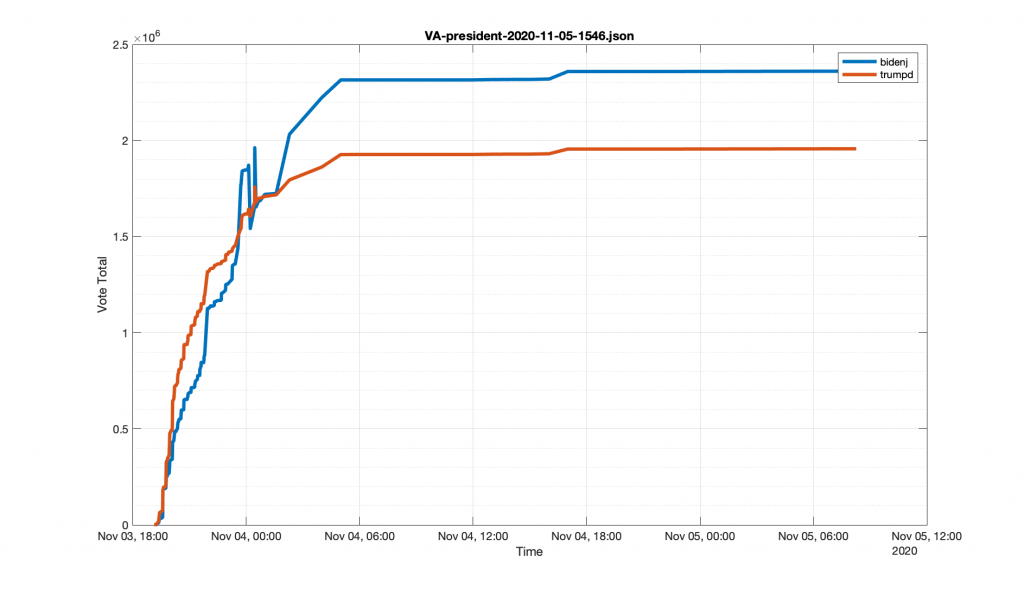
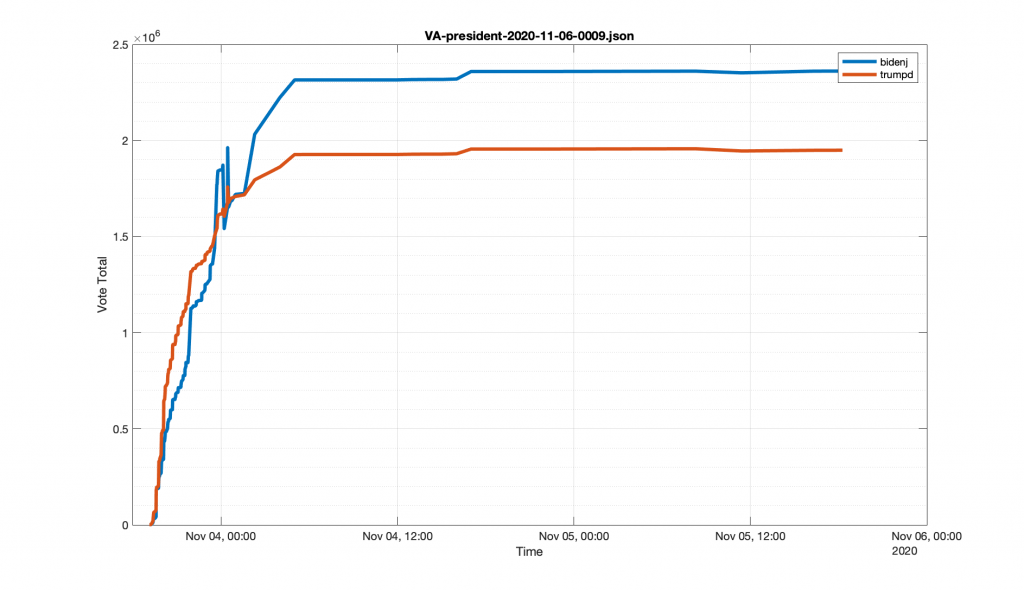
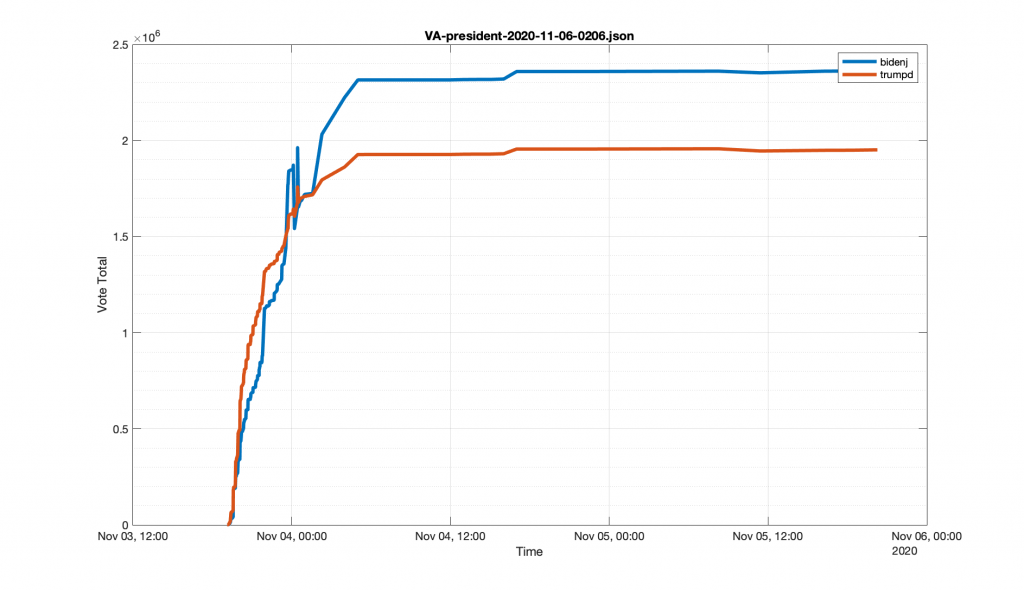
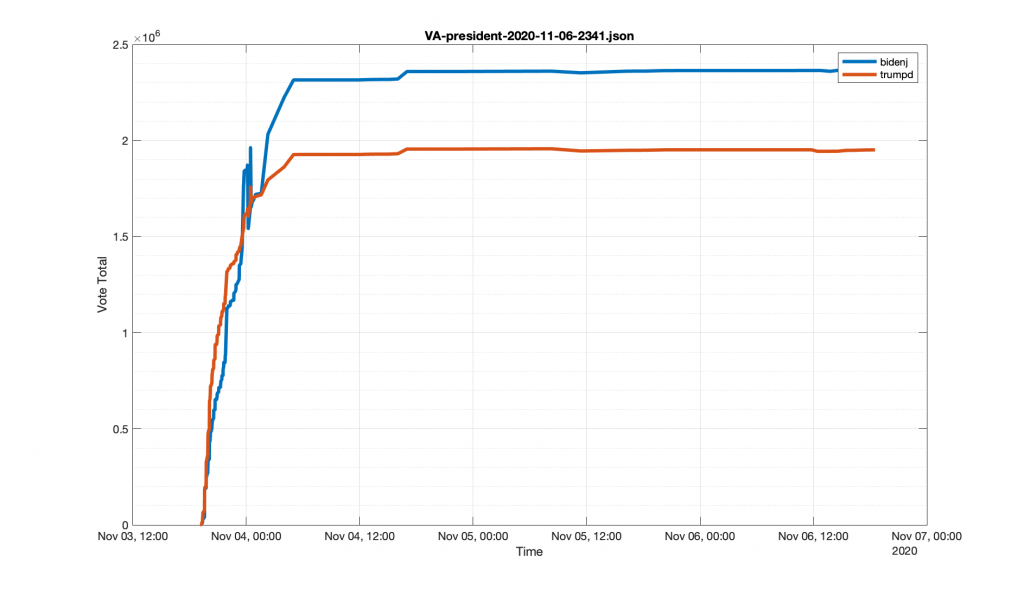
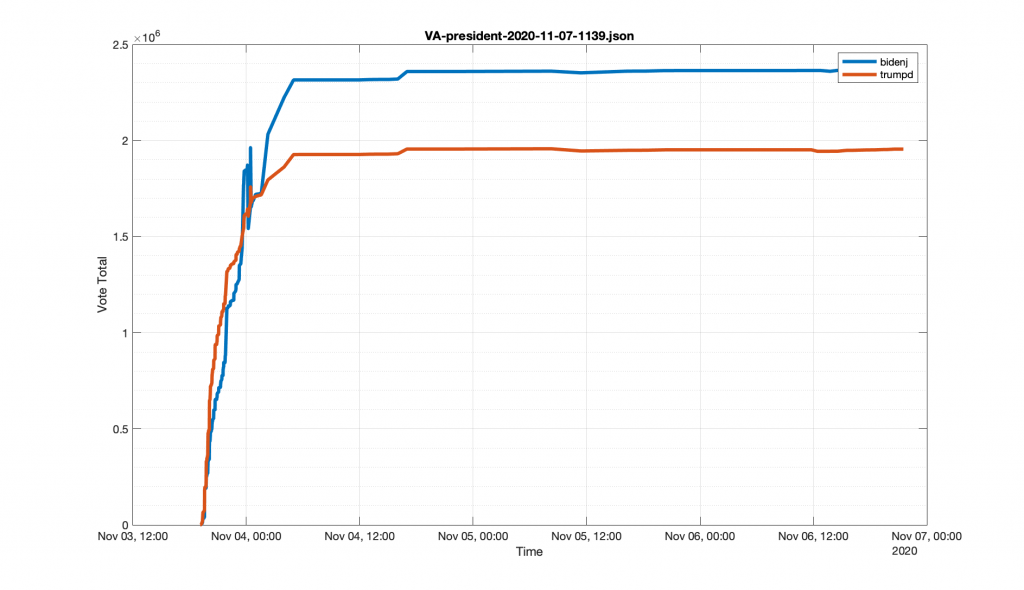
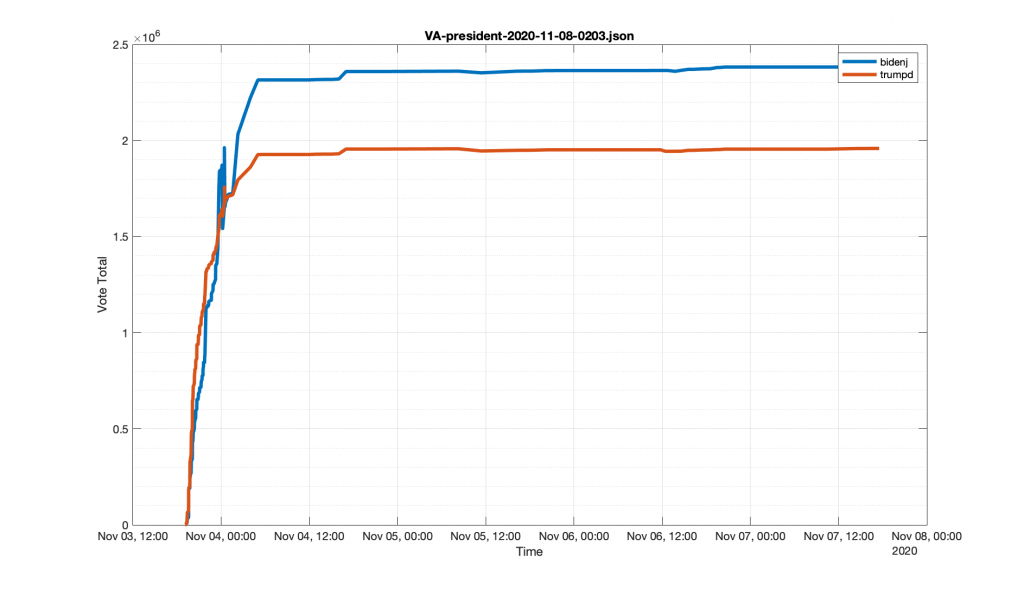
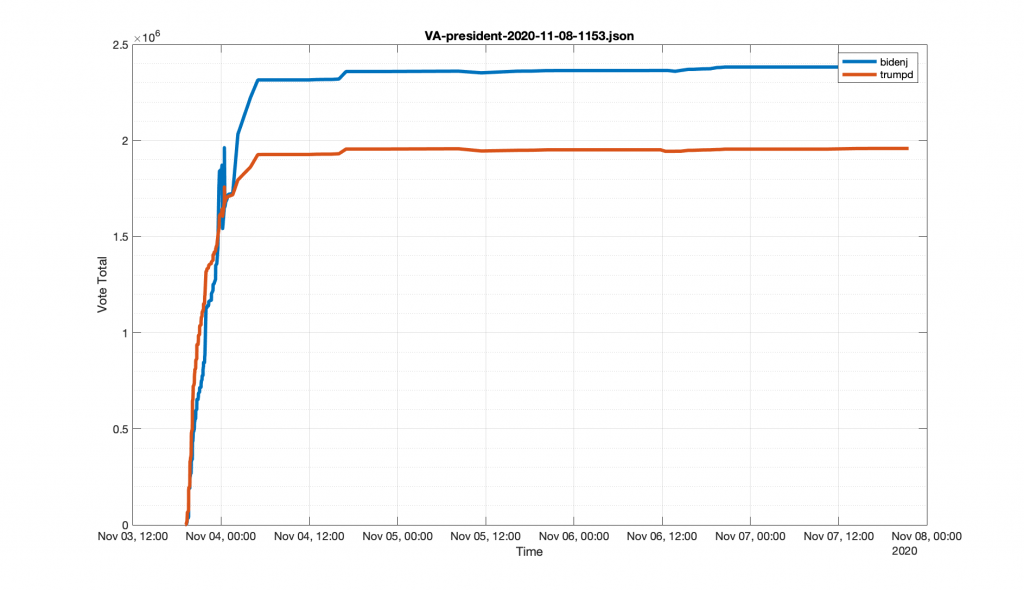
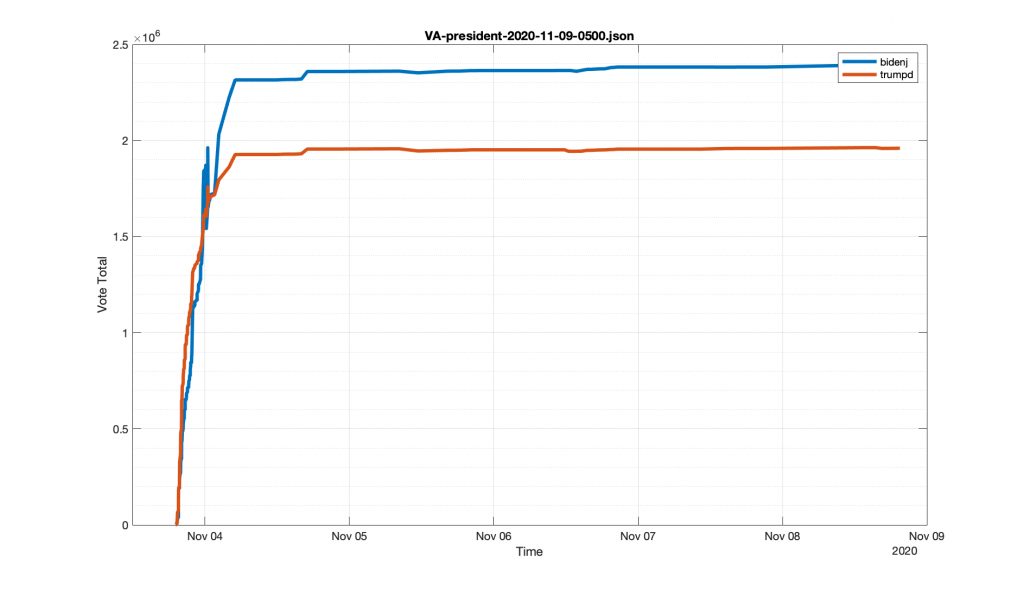
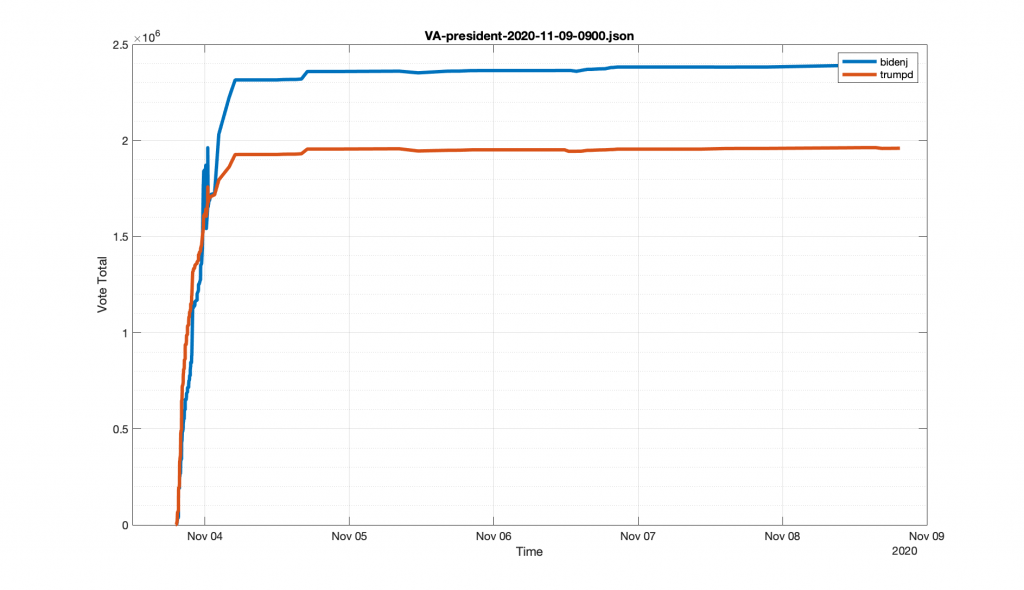
BLUF: Discovered 55,196 vote spike in Alexandria City absentee ballots with 0 (… as in … zilch, zip, nada) for Trump or Jorgensen sometime between 11:30pm 11/3/2020 and 01:00am 11/4/2020. Generated time series of VA per county election fingerprints, and cumulative vote counts. Data sources: VA Dept of Elections voter registration data by locality file, NYT Edison time series datafeed snapshots from wayback machine.
Introduction:
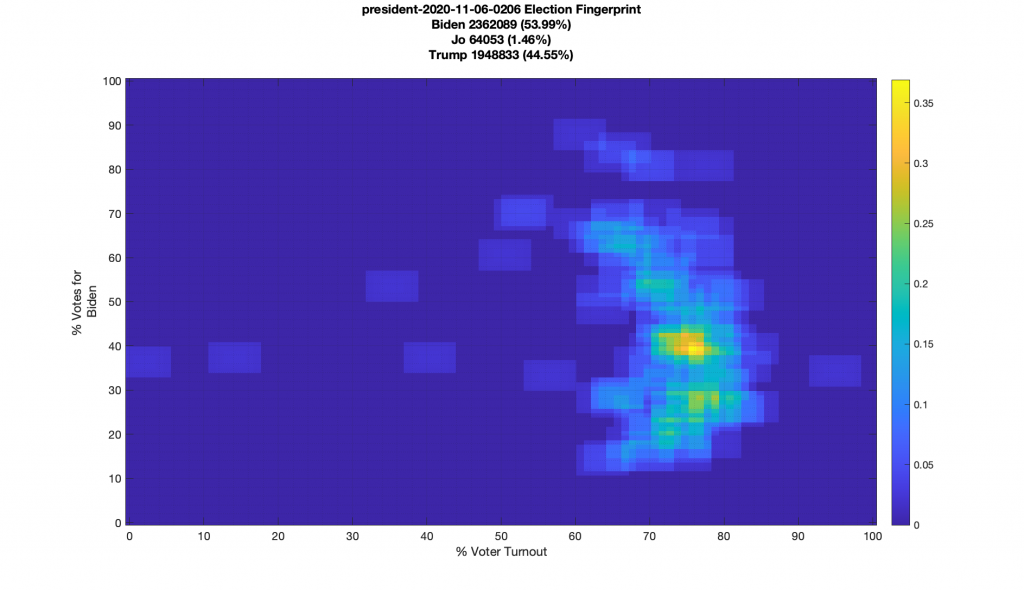
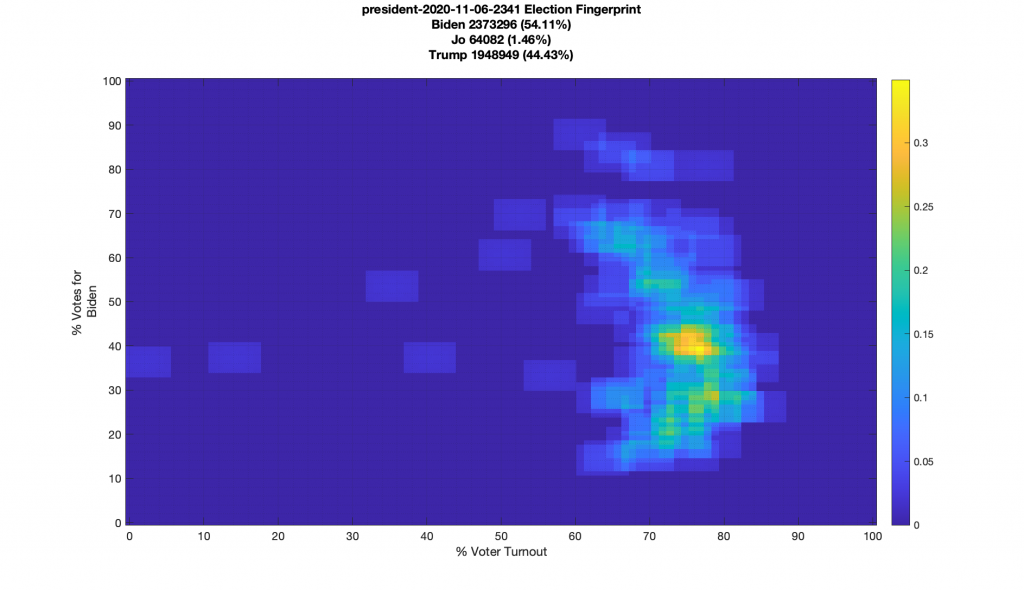
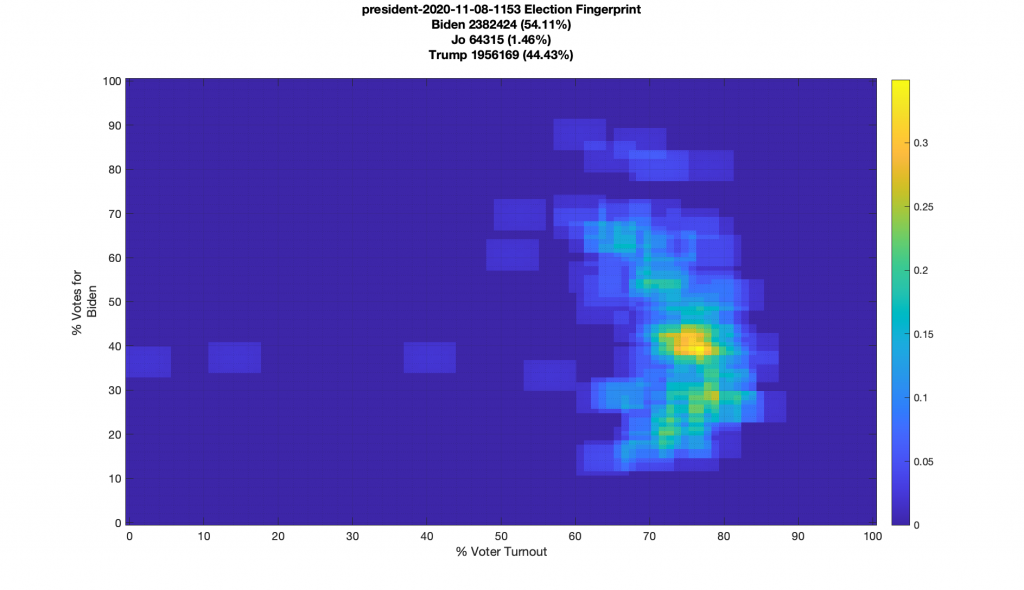
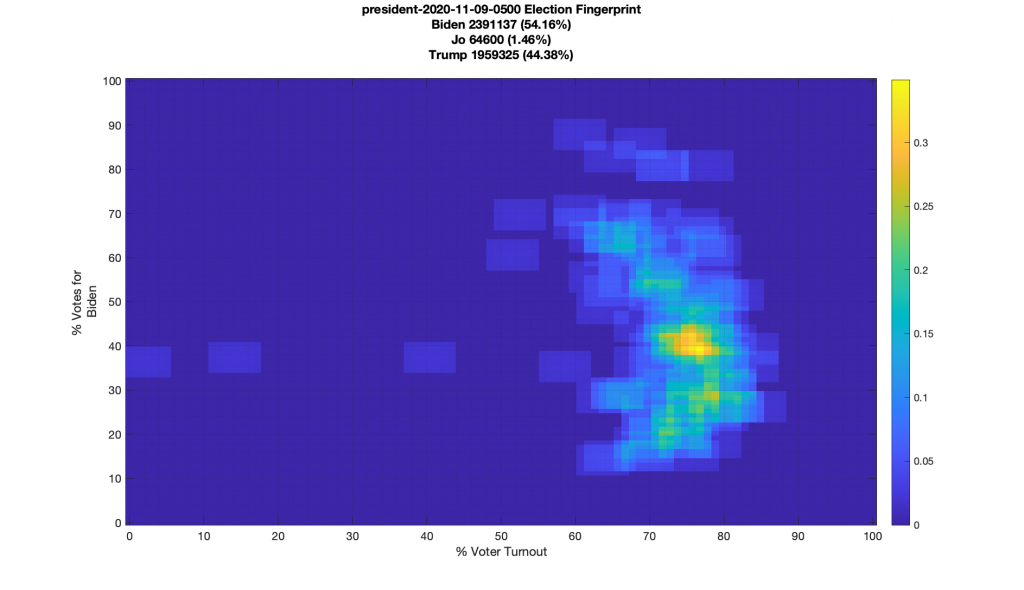
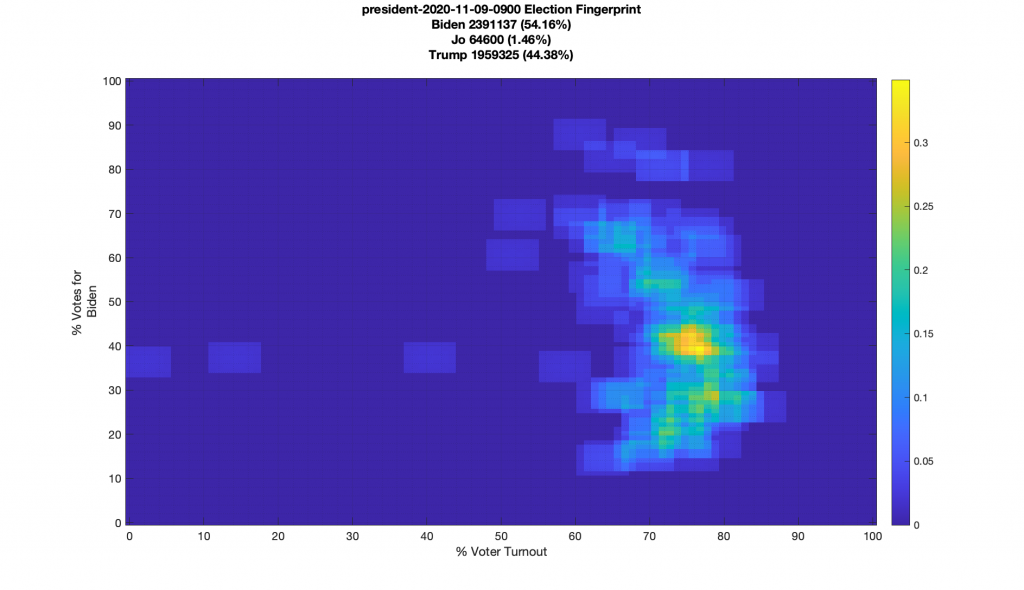
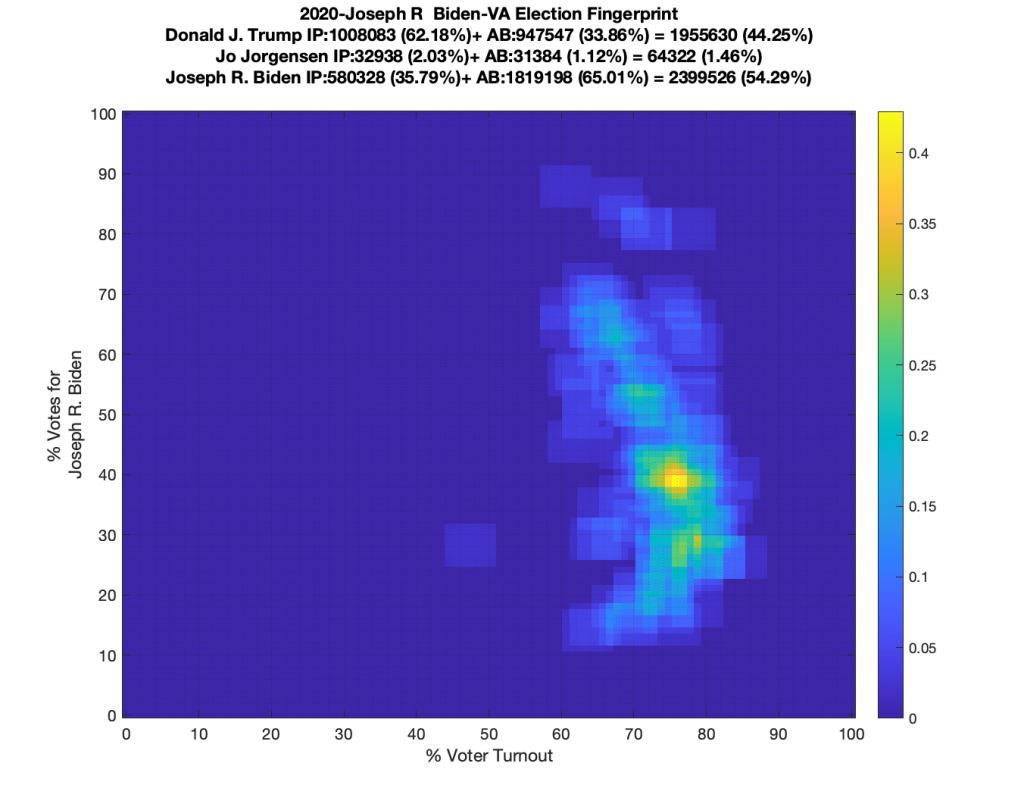
So I’m still puzzled by the shape of the per county election fingerprint in VA. Multiple scientists I’ve talked to and worked with on this are all scratching their heads as to what would explain the significant structures observed. As a reminder, the election fingerprint “should” look like one (maaaaybe two for a really split electorate) Gaussian lobes, without a lot of smearing, linear features or structures. They will of course not be perfect Gaussians, but we would expect them to be somewhat close. I go into the theory and details of generating these fingerprints here, and the VA per county data is replicated below as well. It does not look Gaussian at all and is by definition an “irregularity” in the election data.
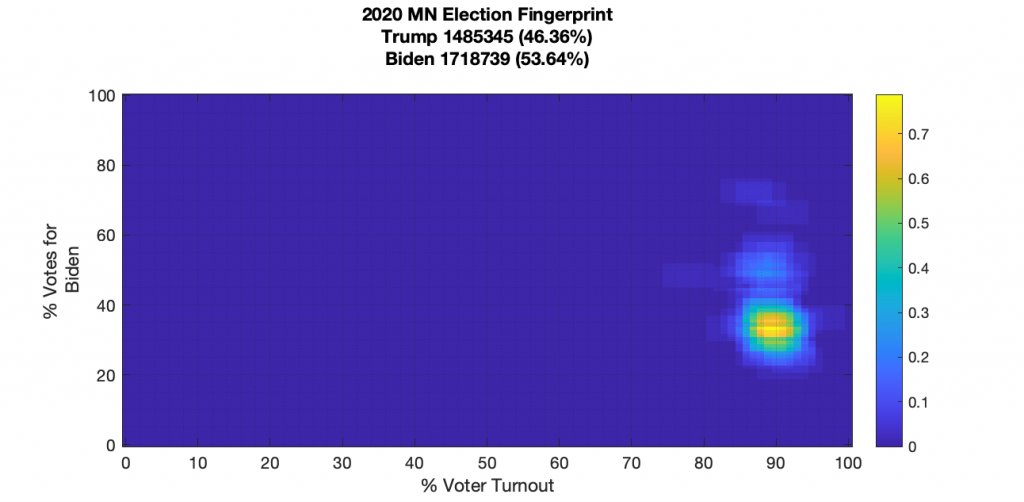
For reference I show the MN plot below as well, which still shows some slight irregularities, but for the most part it looks very clean. It’s got a little bit of kurtotic energy in the tails, but it looks like a pretty well defined 2D Gaussian main lobe otherwise. It looks like it could even have two distribution centers: one distribution center for a large number of the smaller (presumably suburban + rural) localities that didn’t go for Biden, and much fewer (but more populous) larger localities that went just slightly above 50% for Biden. Both distribution centers had about 90% turnout. The MN data makes sense to me, and other data scientists that I’ve shown it too, and it doesn’t set off any blaring alarm bells. The VA data however, remains inexplicable.
So, in trying to decipher what happened in VA, I was interested in taking a look at how the election fingerprints for VA evolved over time. Does the whole structure move fairly uniformly from left to right as more turnout occurs? Does it look Gaussian at any point in the counting process and then shift? In order to attempt to do that I need the per county vote tallies over time and unfortunately I didn’t anticipate needing to do analysis like this before the election, and so I didn’t setup anything to capture the updates to the VA Dept of Elections site or the NYT Edison datafeed. I tried to do an after-the-fact FOIA request, but it has been denied by VA Dept of Elections stating that they do not keep those records.
However … thankfully, the wayback machine does have a few snapshots of the VA datafeed. Not nearly what I would like to be able to make a full sequence to watch how the fingerprint takes shape, but its better than nothing. And while we’re at it, lets keep our eye’s out for individual counties that have large vote swings and also have statistically improbable results for any candidate (> 95%).
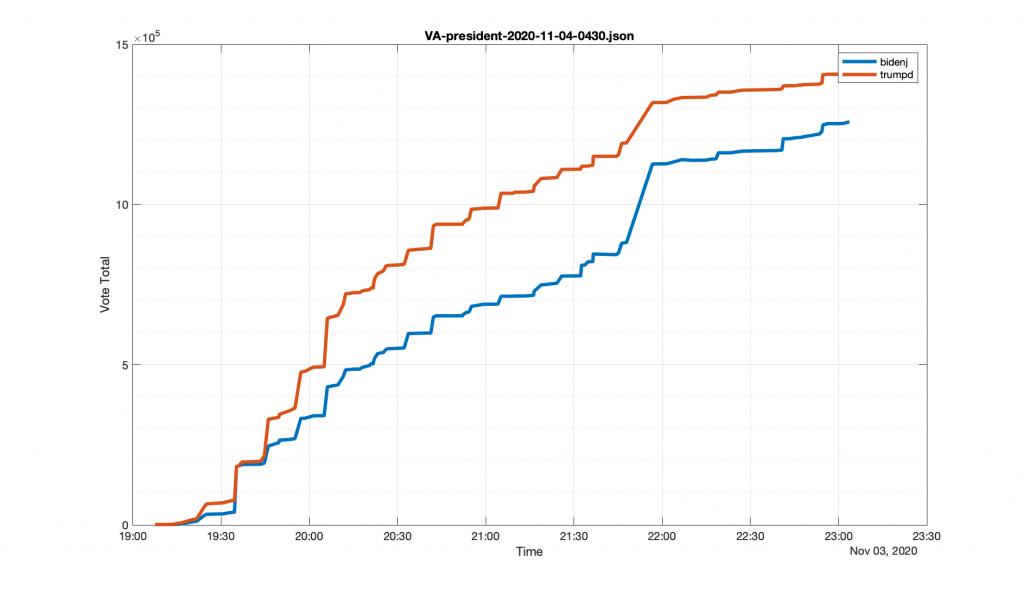
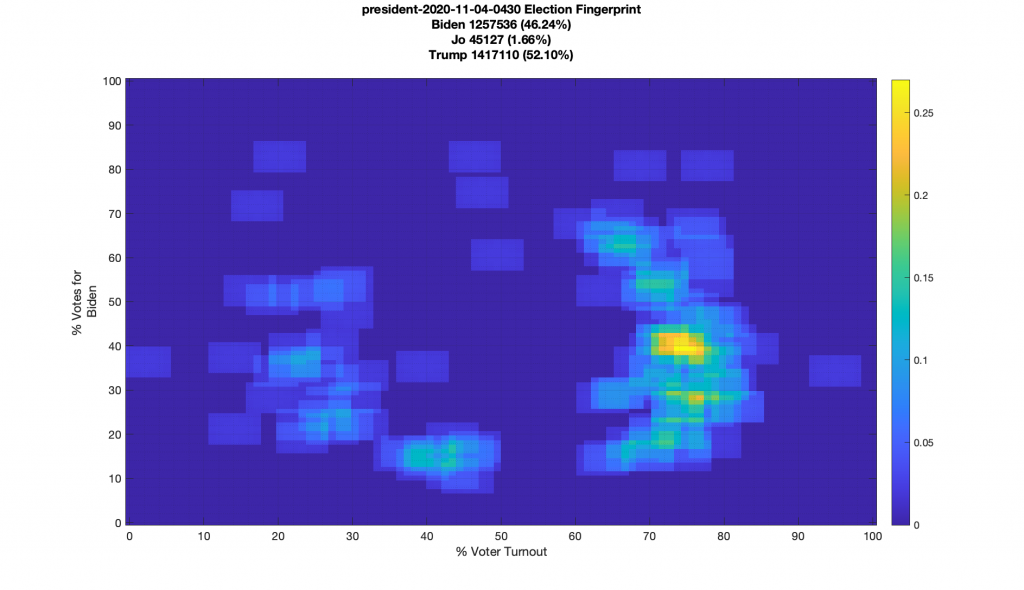
The earliest data file I could find on the wayback machine was from 2020-11-04T04:06:57.160Z and shows results through 11:30pm on the 3rd. While thats not ideal, that at least starts us off while Trump was still ahead.
2020-11-04T04:06:57.160Z
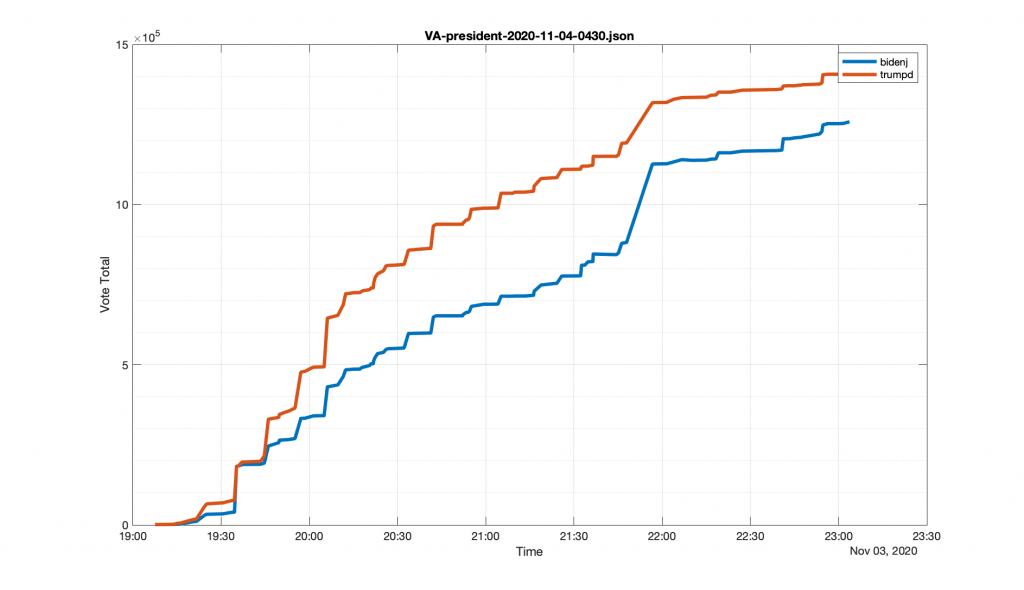
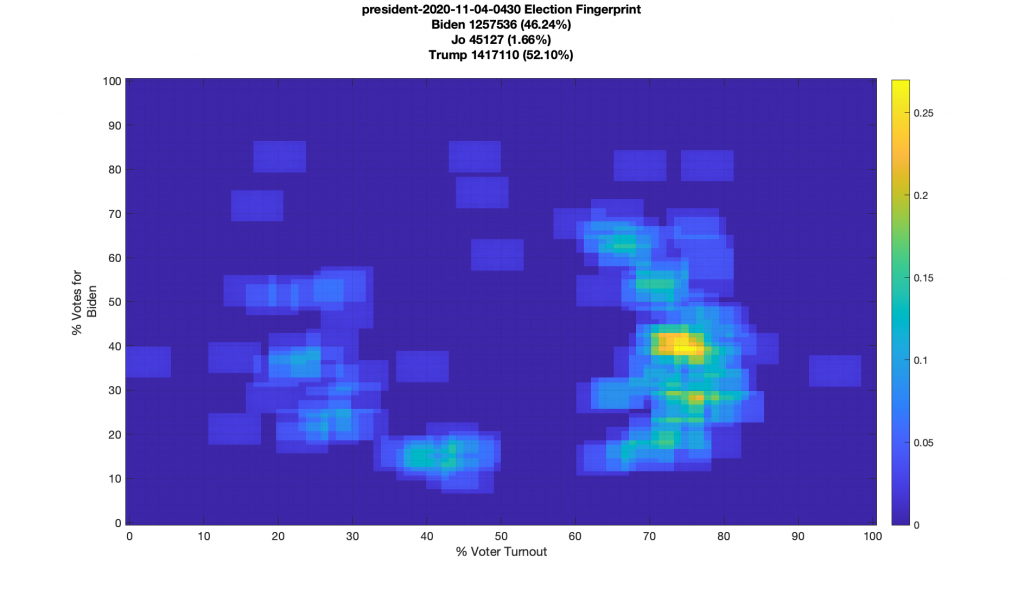
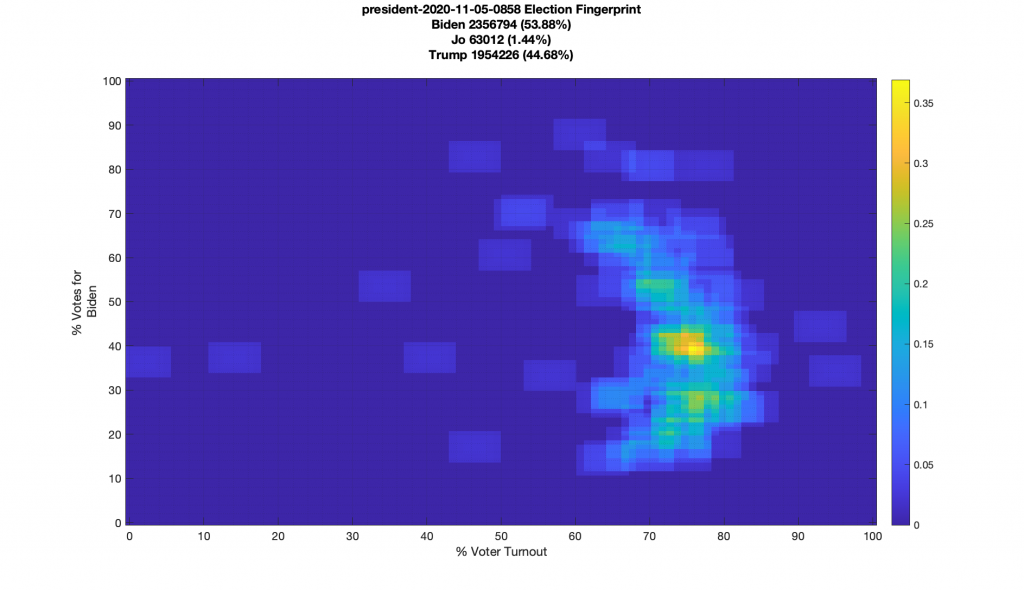
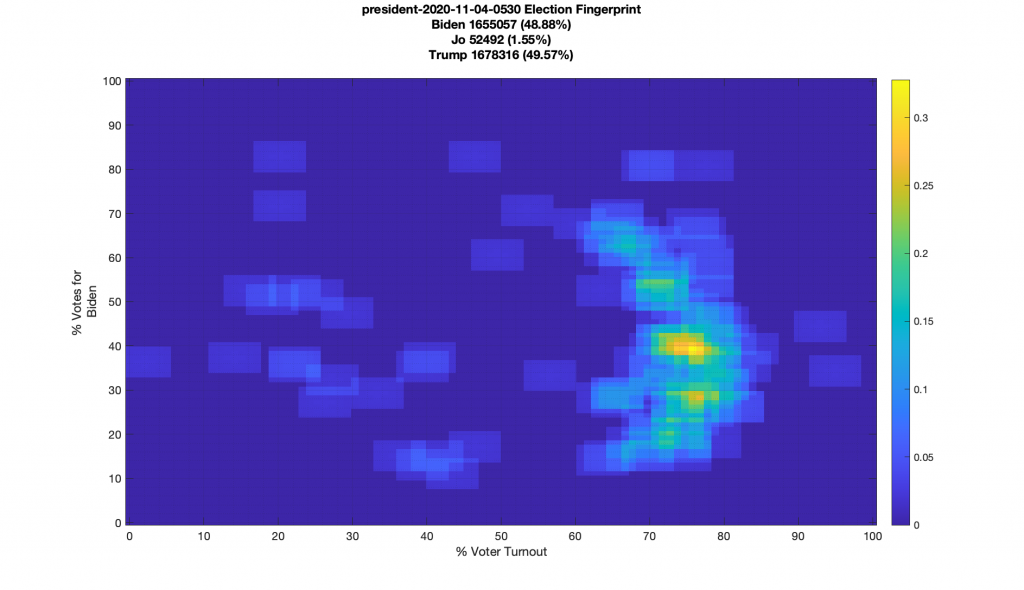
We can already see our “boomerang” structure fairly well formed in this initial plot, and I didn’t find any individual counties that had a large update with over 95% Biden. (Now that doesn’t mean such updates didn’t happen before this snapshot, but since my snapshot sampling rate is so low, each update includes more than one set of batch updates, and specific outlier batches might be just getting rolled into the sums.)
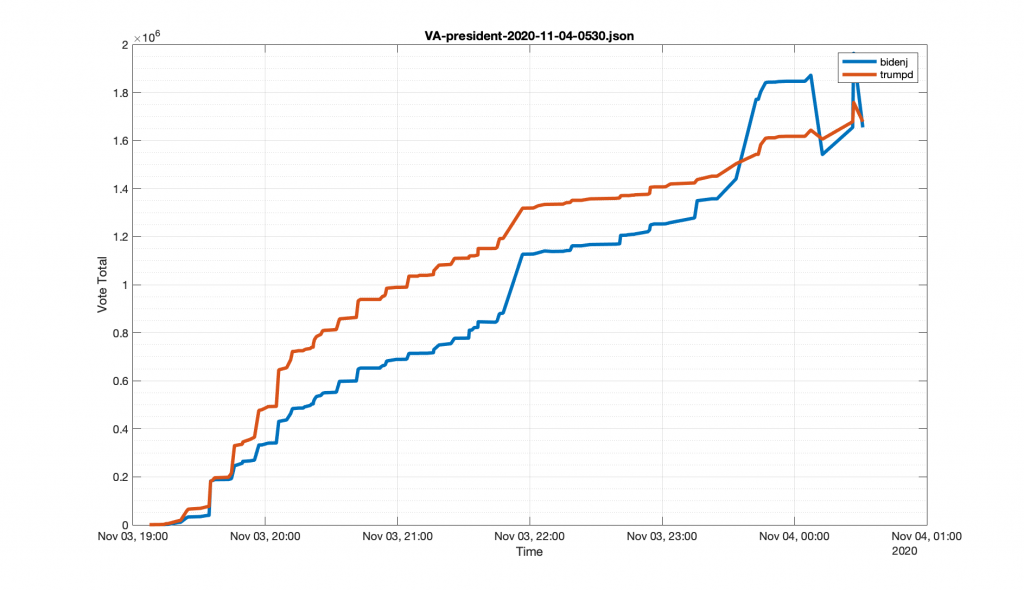
2020-11-04T05:34:34.206Z
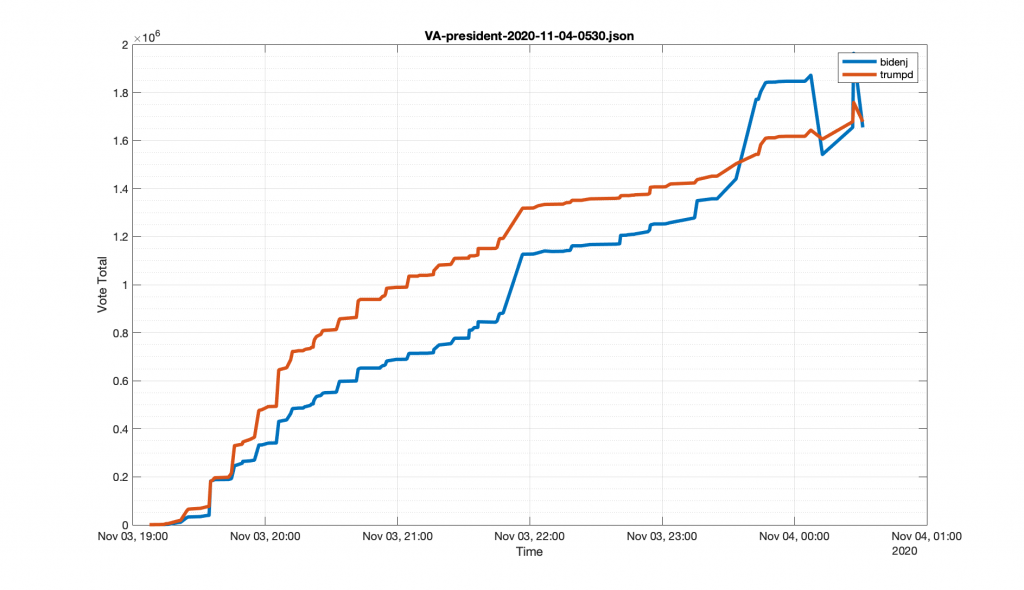
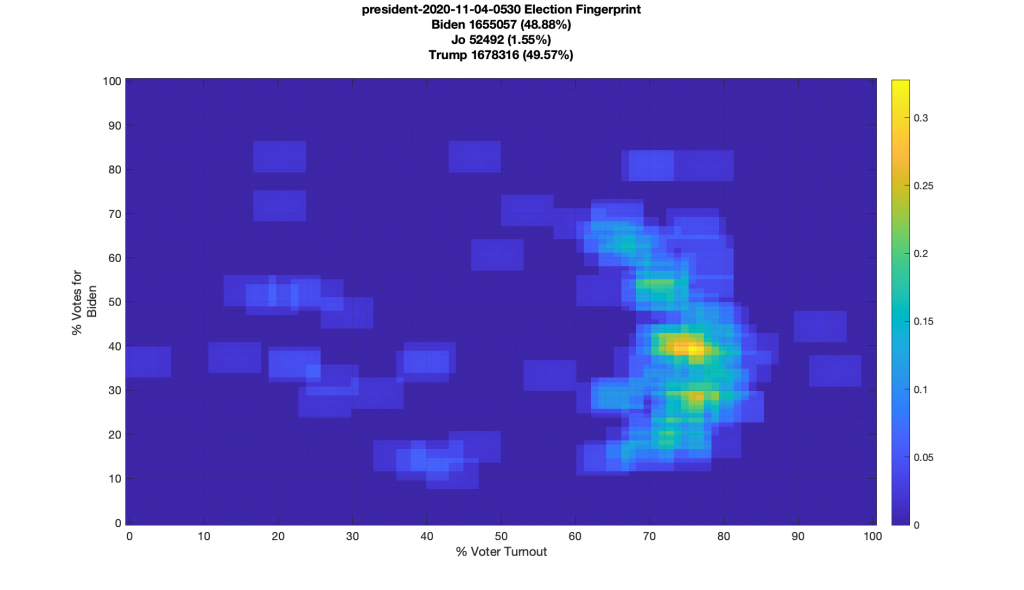
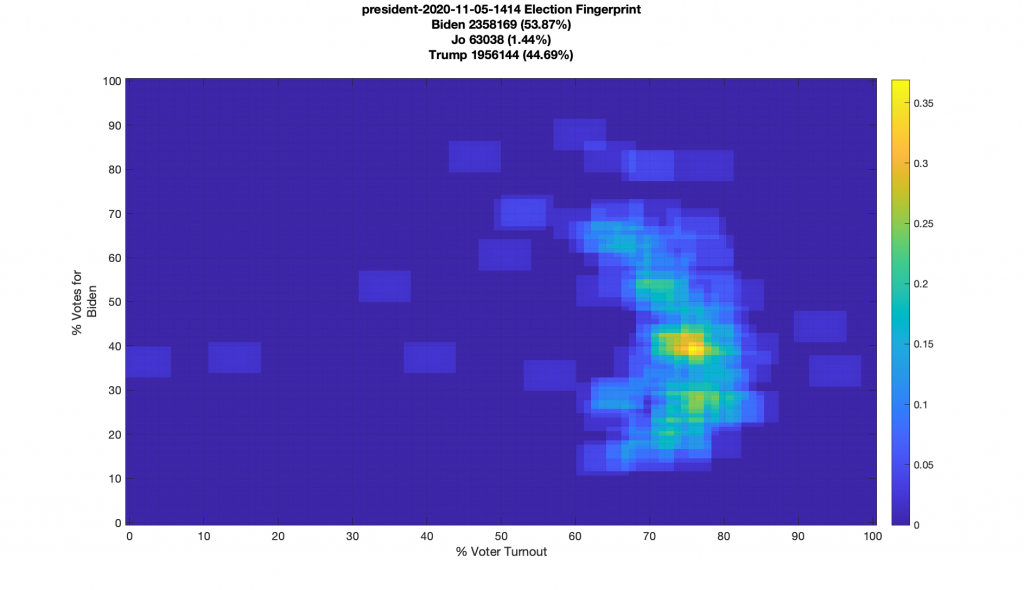
We can pretty clearly see that just after the last snapshot, right around midnight, there’s obviously some sort of issue that happened with the data, with a couple of really large bumps for Biden that end up getting reversed and reverted. I have no idea if there’s any specific event that this can be correlated to in news reporting, if this is a glitch in the NYT feed, etc. But it looks like this event occurred between the updates to the NYT datafeed that I could find on the wayback machine. So whatever it is that happened, it got baked into the cake already as far as this datafeed snapshot is concerned. (If anyone has the files for these timestamps, please share!)
In addition to that we see that we’ve had a noticeable shift in our fingerprint as it looks like more low-turnout areas have been shifted into the boomerang.
Whats really interesting to me is that there was one locality (Alexandria) that had a large change of 55,196 Biden votes and ZERO for Trump or Jorgensen votes in the near hour and a half since the previous data points. From the data, it looks like these were all absentee votes, which we admittedly expect to be a higher turnout percentage for Biden … but 100% of such a large sample size … c’mon man! According to VA Dept of Elections, the absentee vote in Alexandria broke overall 84.78% (55,940 / 65,985) for Biden and 13.57% (8,951 / 65,985) for Trump. Now we know the underlying distribution is not I.I.D., so we should not expect exactly 13.57% of this batch to have gone for Trump, but we would still expect at the very least a small handful of this batch should have been for Trump. Additionally, this batch of absentee ballots makes up 83.65% of Biden’s total absentee haul, meaning Tump must have received 8,951 / (65,985 – 55,196) = 82.96% of ALL the remaining absentee votes in Alexandria, which also seems pretty unlikely.
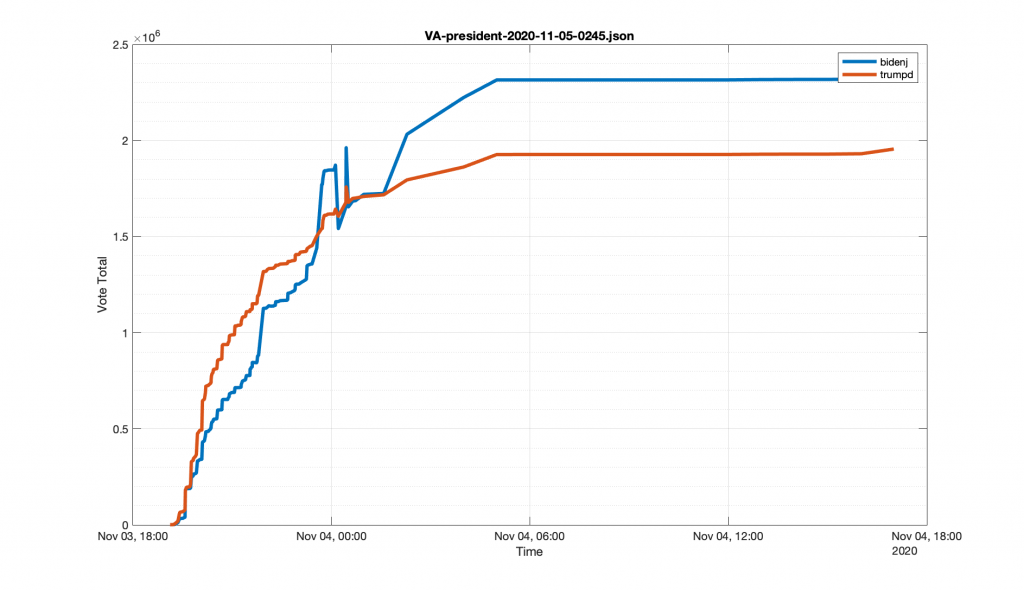
2020-11-05T02:45:04.745Z and Beyond
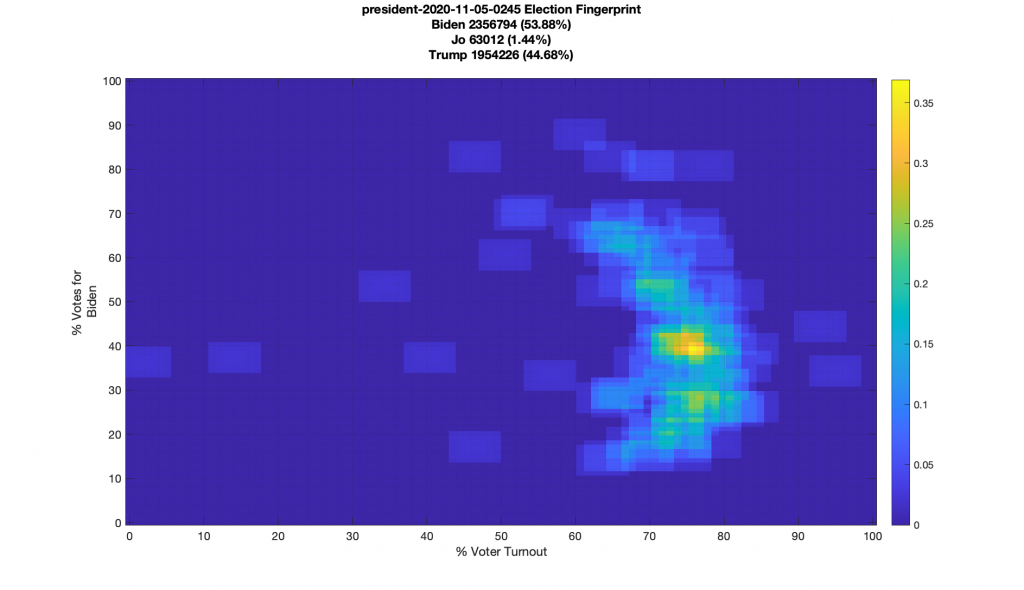
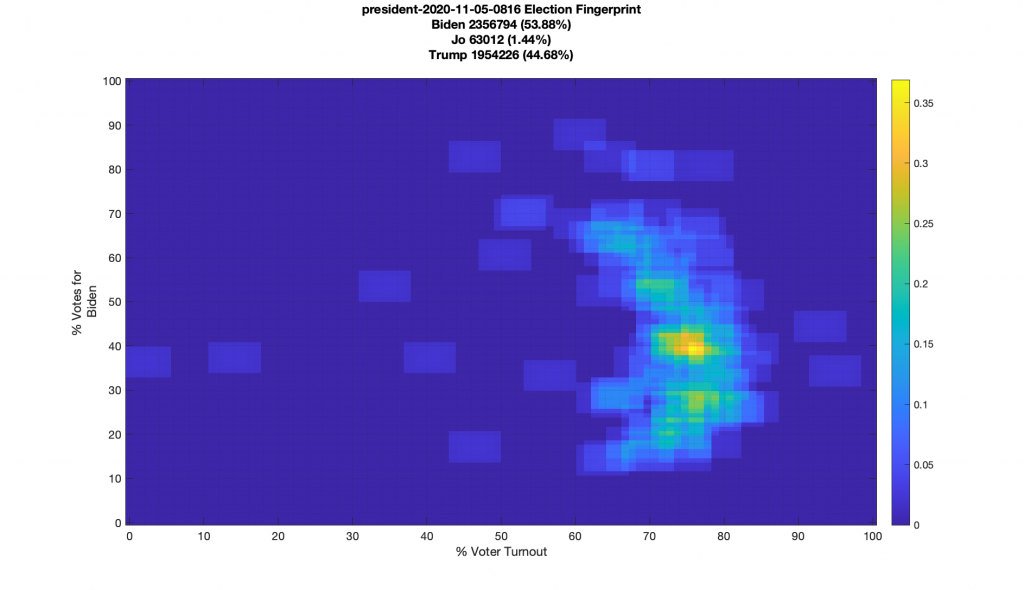
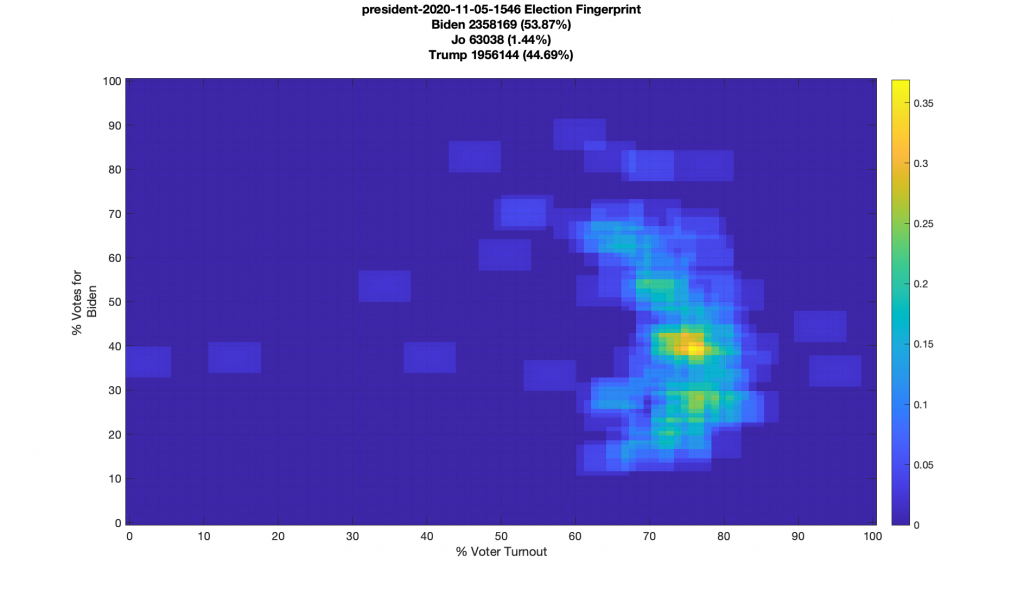
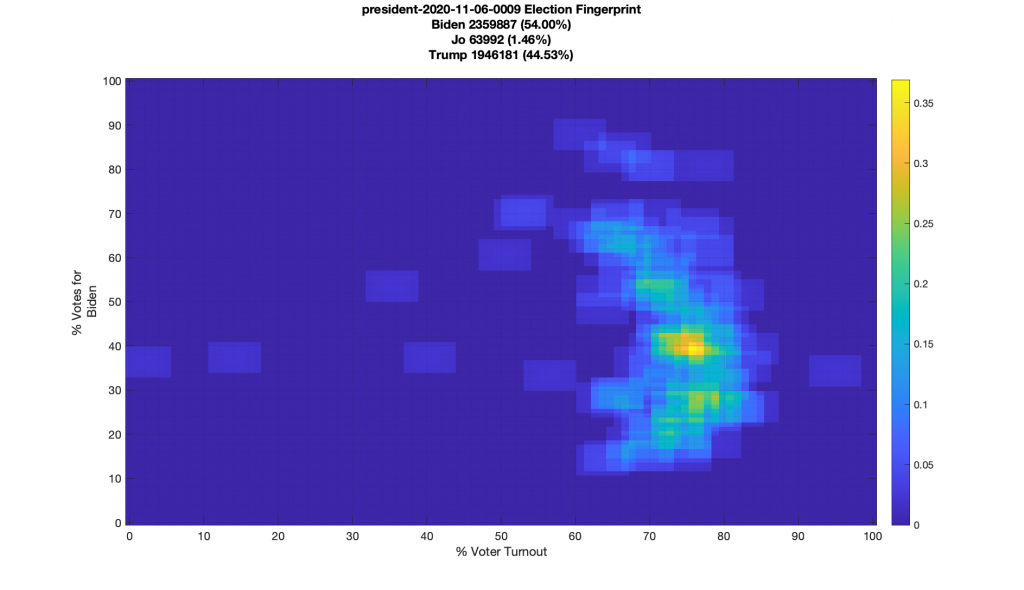
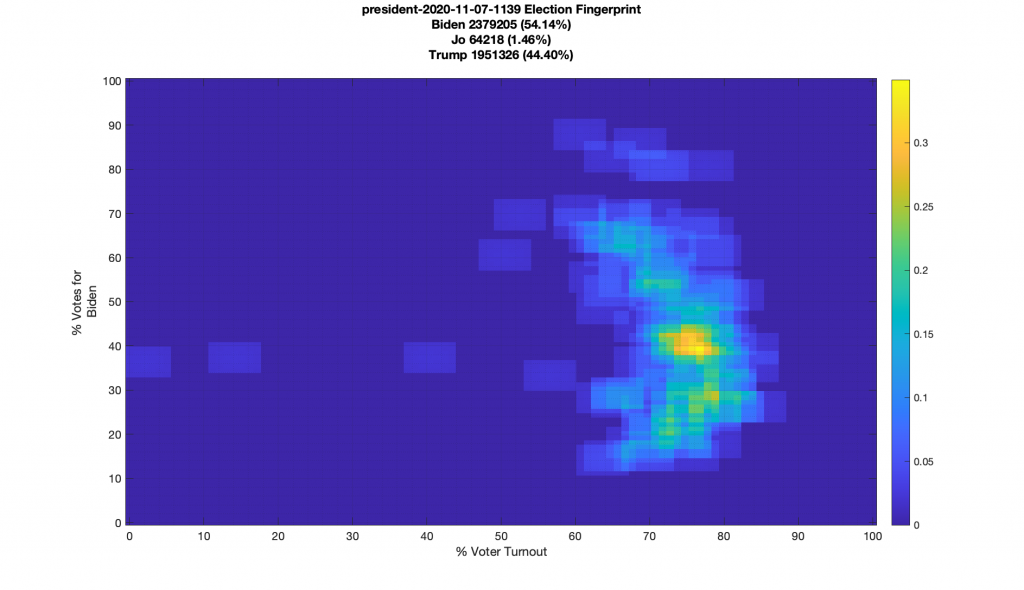
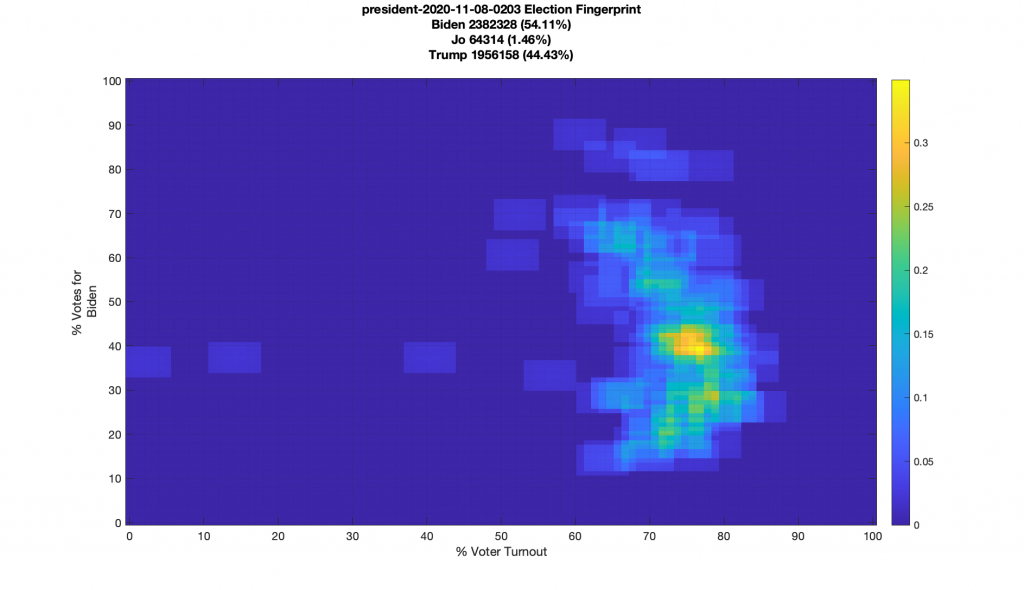
After the previous batch there aren’t any more large outliers at least that I caught. But I only have a few snapshots from the wayback machine to work with. We see the remaining straggler counties start to shift to underneath the “boomerang”. If there was a point in time where the data was looking like a 2D Gaussian, it was before the first snapshot that I was able to find and get my hands on.
Complete Galleries Below:
