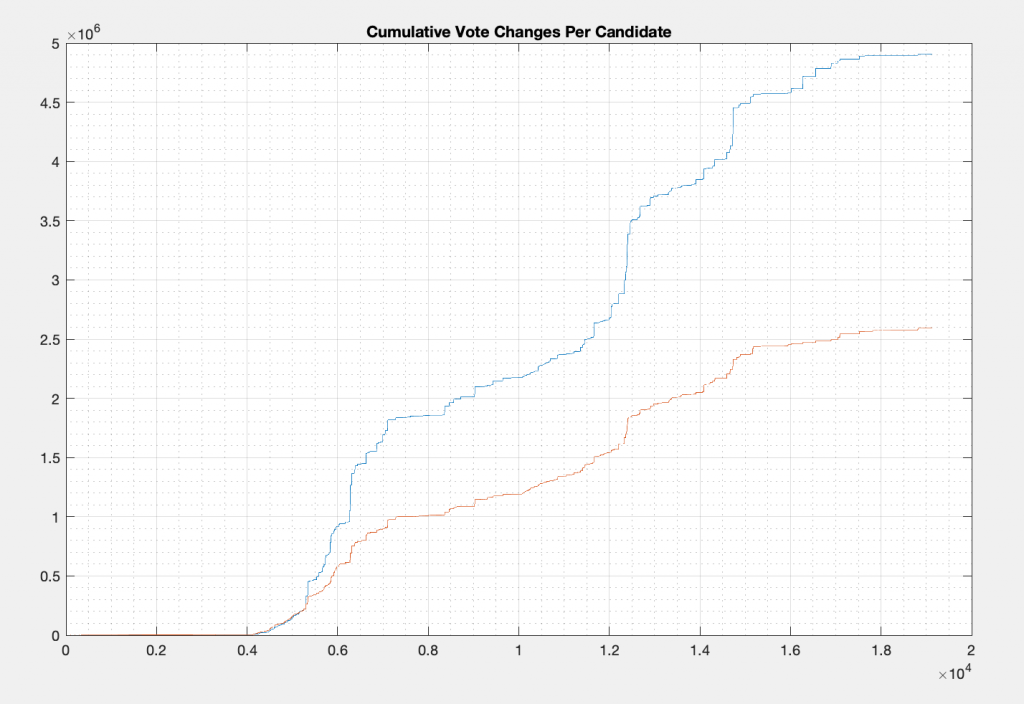
My first pass at looking at the data was to simply plot the cumulative changes for Biden and Trump. Blue is Biden, red is Trump below. This is just simply summing the non-NaN entries in the ‘TotalVotes’ column associated with when the ‘BallotName’ column contains either ‘Trump’ or ‘Biden’. More to come. Just a cursory look at the raw data for right now as I get to know the dataset. Trying to make sure I understand what this dataset is and isn’t representing.
Changelog data is available here.
% import changelog into variable ‘data’
>> t = zeros(size(data,1));
MATLAB Source Code
>> ti = contains(data.BallotName, ‘Trump’);
>> t(ti) = str2double(data.TotalVotes(ti));
>> t(isnan(t)) = 0;
>> b = zeros(size(data,1));
>> bi = contains(data.BallotName, ‘Biden’);
>> b(bi) = str2double(data.TotalVotes(bi));
>> b(isnan(b)) = 0;
>> plot(cumsum([b,t])); title(‘Cumulative Vote Changes Per Candidate’); grid on; grid minor;