Categories
Election Data Analysis Election Forensics Election Integrity programming technical Uncategorized

Records of Early Ballots Cast Do Not Have Corresponding Registration Records in VA 2023 General Election Data

Update (2023-12-14 12:00:00 EST) : Special thank you to Rick Michael of the Chesterfield Electoral board for checking their records on issues #1 and #2 below. There were 3 x Issue #1 records and 9 x Issue #2 records identified in Chesterfield County.

According to Rick, the records in question were populated and visible when looking via the electronic VERIS (the states election database) login available to the Registrar. The 3 x Issue #1 records can be found and are Active records in the electronic system, and the 9 x Issue #2 records had an update that moved the records from Inactive to Active that were not reflected in the data supplied to us.

That implies that the data that we purchased (for approximately $12,000) directly from the department of elections is inaccurate and incomplete. Our initial purchase and download of the June 30 Registered Voter List (RVL) database does not show the registrants identified in Issue #1, even though the Registrar can see them in their electronic terminal. And our Monthly Update Subscription (MUS) we receive is missing the updates showing the registrant records identified in Issue #2 being moved from Inactive to Active status.

The department of elections is required by federal law (NVRA, HAVA) to keep and maintain accurate election records AND to make those records accessible for inspection and verification, and for use by candidates and political parties. Additionally, we have paid (twice!) for this data; once as taxpayers, and once again as a 501c3 entity. If the data we, and other campaigns and candidates are receiving is not representative of the actual records in the database, incomplete and inaccurate … that needs to be addressed and fixed.

Summary:
  • Issue #1: There are 99 records of ballots cast, according to the VA Department of Elections (ELECT) Daily Absentee List (DAL) data file that do not have corresponding voter ID listed in Registered Voter List (RVL) data.
  • Issue #2: There are 380 records of ballots cast in the DAL where the corresponding RVL record has been listed as “Inactive” since June-30-2023 and no modification to the RVL record has taken place.
  • Issue #3: There are 18 records of ballots cast in the DAL where the corresponding RVL record is listed as “Inactive” as of Dec-01-2023, but there has been previous modifications to the RVL record since June-30-2023.
  • We are currently reaching out in attempts to contact the VA AG’s office and to provide them the details of this analysis in order to have these anomalies further investigated.
Data files utilized for this analysis:

Our 501c3 EPEC purchased and downloaded the full statewide VA RVL on June-30-2023 from ELECT. We additionally purchased the Monthly Update Service (MUS) package from ELECT, where on the 1st of each month we are provided a list of all of the changes that have occurred to the RVL in the previous month. By applying these changes to our baseline data file, we are able to update our copy of the RVL to reflect the latest state as per ELECT. We can also create a cumulative record of all entries associated with a particular voter ID by simply concatenating all of these datafiles.

Additionally, during the VA 2023 General Election, we purchased access to the Daily Absentee List (DAL) file generated by ELECT that documents all of the transactions associated with early mail-in or in-person voting during the 45 day early voting period. The DAL file we utilized for this analysis was downloaded from ELECT on Nov-13-2023 at 6am EST.

Identification of ballots cast via the DAL file can be performed by checking for rows of the DAL data table that have the APP_STATUS field set to “Approved” and have the BALLOT_STATUS field set to any of the following: “Marked” | “Pre-Processed” | “On Machine” | “FWAB” | “Provisional”.
Once cast ballots are identified in the DAL, the Voter Identification Number can be used to lookup all of the corresponding records in our cumulative RVL data. The data issues summarized above can be directly observed using this process. Due to VA law, we cannot publish the full specific records here in this blog but have summarized, captured and described our process and results.

For Issue #1: If there does not exist a corresponding registration record for cast ballots, then the voter should not have been able to have their mail-in ballot approved or issued, or been able to check-in to an early voting precinct to vote on-machine. If the voter record actually does exists, then why is it not reflected in the data that we purchased from ELECT. Note that all provisional and Same Day Registration (SDR) ballots were required to be entered into the states database (“VERIS”) by the Friday after the election (Fri Nov-10-2023). We specifically waited until we received the Dec-01-2023 MUS data update from ELECT to attempt to perform this or similar analysis in order to ensure that we would not be missing any last minute registrations or RVL updates.

For Issue #2: There are 380 records of ballots being cast in the DAL where the baseline June-30-2023 RVL data file shows the registrant as inactive, and there has been no modifications or adjustments to the record presented in the MUS data files. Therefore these registrants should still have been listed as “Inactive” during the early voting period which started in September through Election Day (Nov 7).

For issue #3: There are 18 records that show the cast ballot is from a registrant that is currently listed as “Inactive” but there has been adjustments to the registration record over the last 6 months. An example of such is below. Note that I have captured the MUS data file generation dates in the 5th column to note when the file was generated and received by us.

In the example given below, the first invalidation operation on the registration record appears in the MUS file dated Sep-01, with the earliest transaction date listed as Aug-29-2023. The ballot application was not received until Sept 26 according to the DAL, so the application should never have been approved or the ballot issued as the registrant status should have been “Invalid” according to the states own data.

(Also … yes … I know there is a typo in the spelling of “APP_RECIEPT_DATE” in the tables below … but this is the data as it comes from ELECT).

APP_RECIEPT_DATEAPP_STATUSBALLOT_RECEIPT_DATEBALLOT_STATUS
“2023-09-26 00:00:00”Approved“2023-10-19 00:00:00”Pre-Processed
Example Extract of a DAL data record for a mail-in ballot cast during early voting.
TRANSACTIONDATETRANSACTIONTIMETrans_TypeNVRAReasonCodeFile Source
30-June-202312:12:00BASELINEBASELINEBaseline RVL
28-Jul-202309:34:03MODIFYChange OutMUS 08/01/2023
28-Jul-202309:34:04MODIFYAddress ChangeMUS 08/01/2023
28-Jul-202309:34:04MODIFYChange InMUS 09/01/2023
28-Jul-202309:34:03MODIFYChange OutMUS 09/01/2023
28-Jul-202309:34:04MODIFYAddress ChangeMUS 09/01/2023
28-Jul-202309:34:04MODIFYChange InMUS 09/01/2023
29-Aug-202311:55:49MODIFYInactivateMUS 09/01/2023
29-Aug-202311:55:49MODIFYInactivateMUS 10/01/2023
Extract of RVL Cumulative Data Records for Voter ID in above DAL entry
Categories
Uncategorized

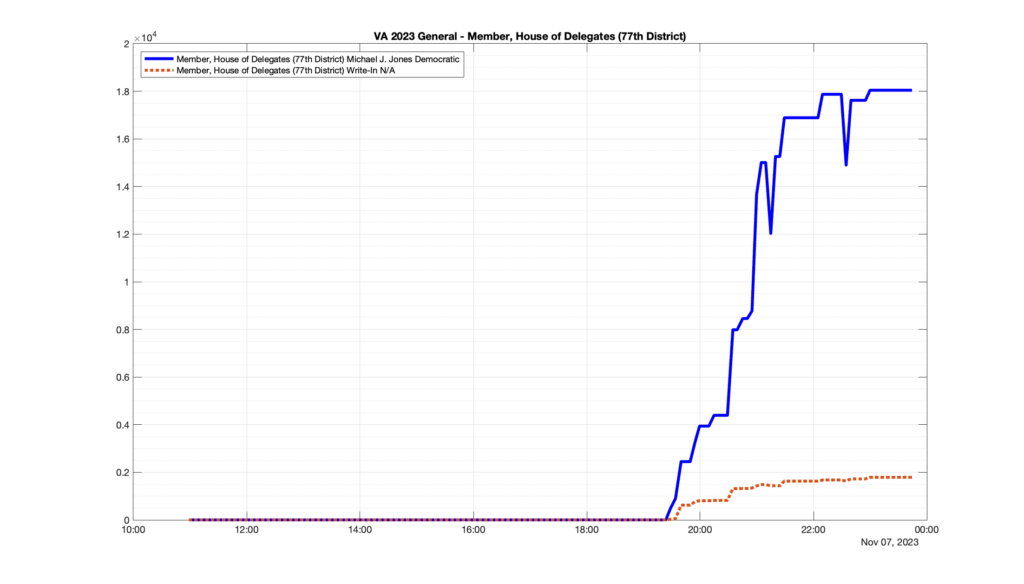
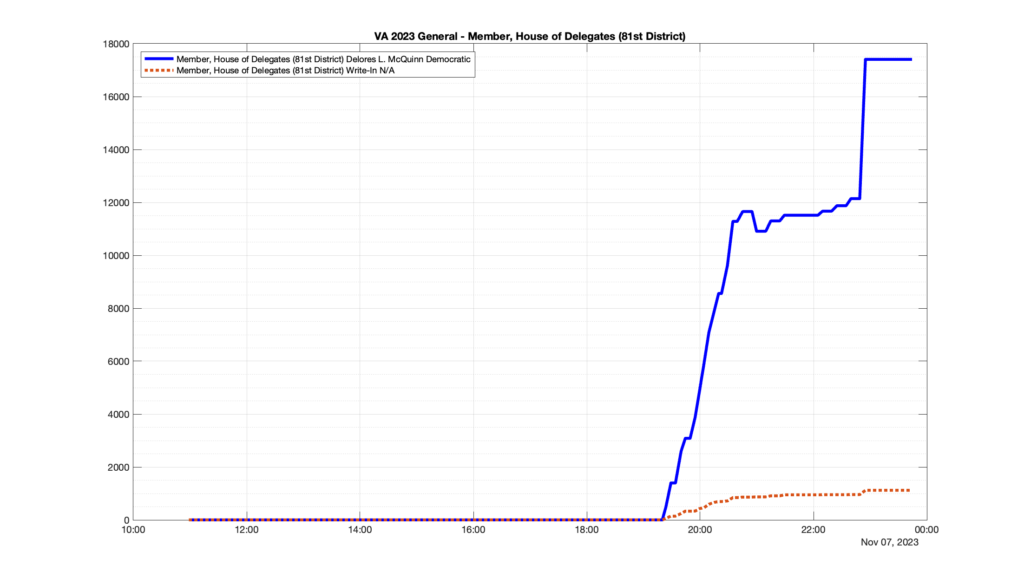
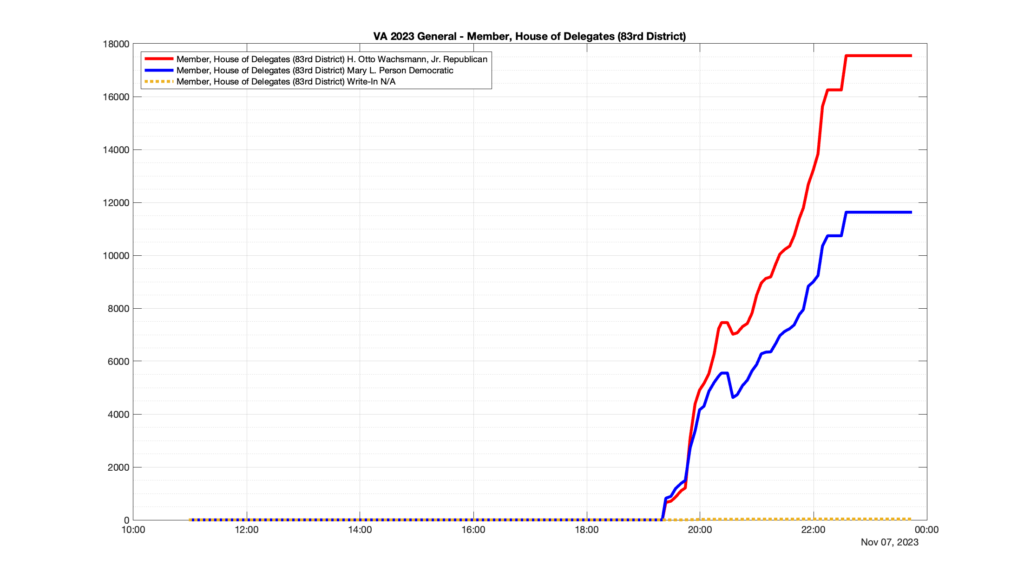
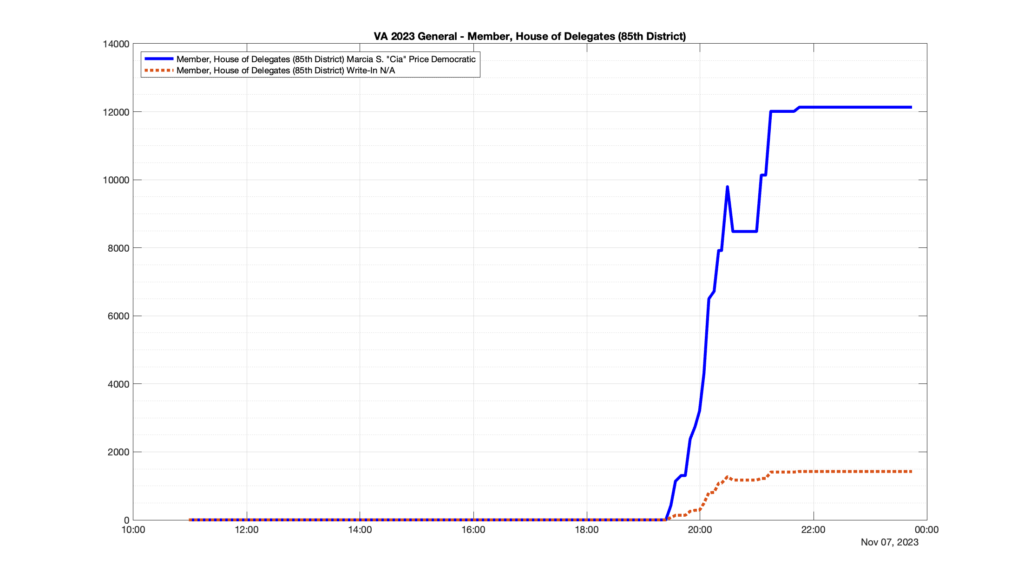
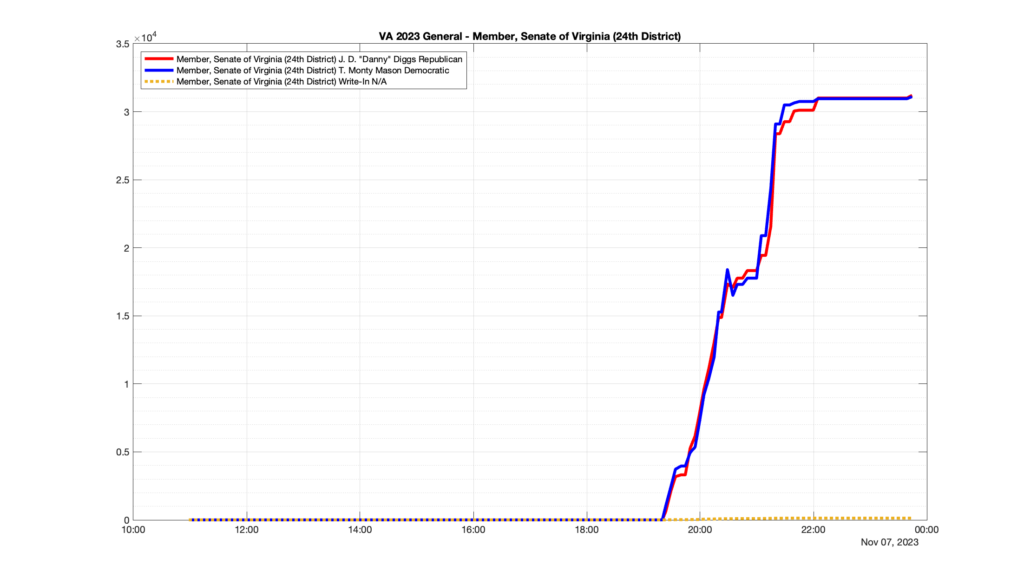
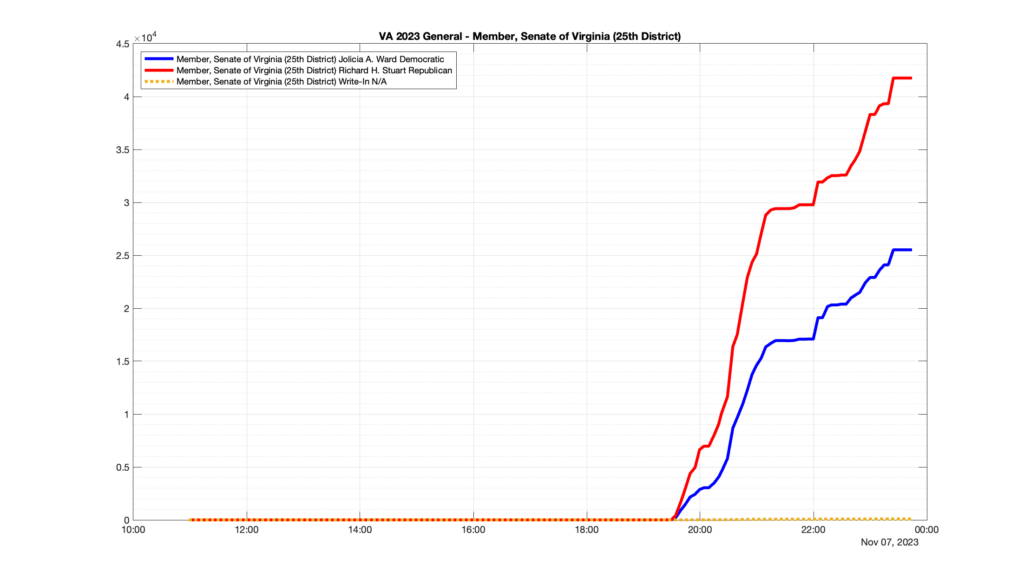
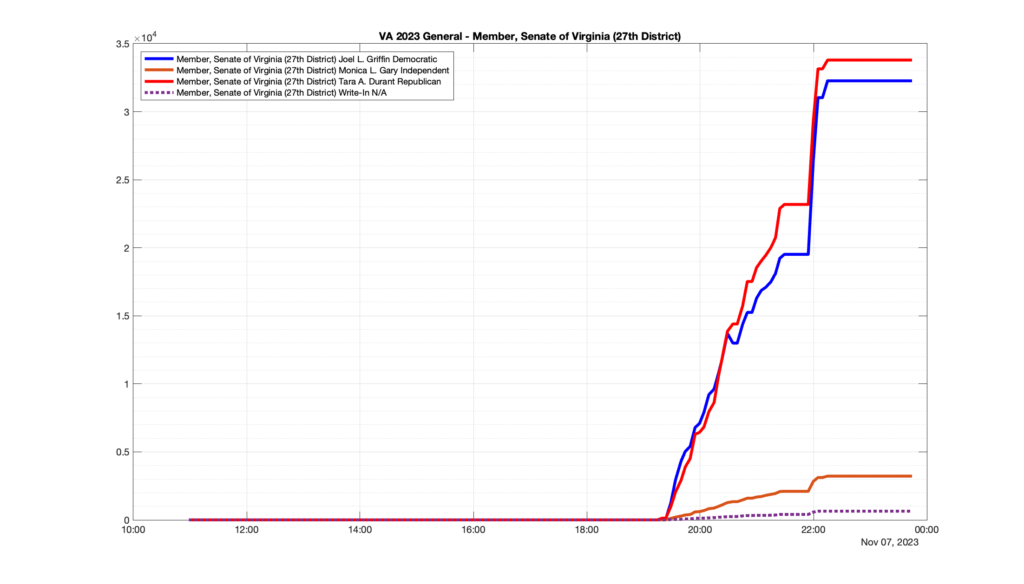
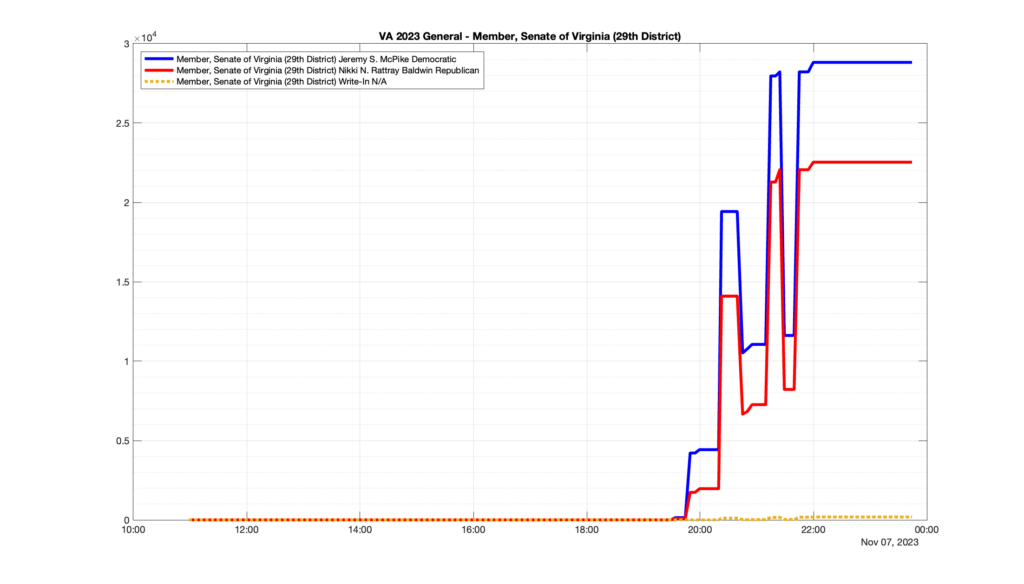
Fluctuations in election night reporting ballot counts for multiple races in VA 2023 General Election

Well, election day came and went and everyone was glued to the internet to find out the results.

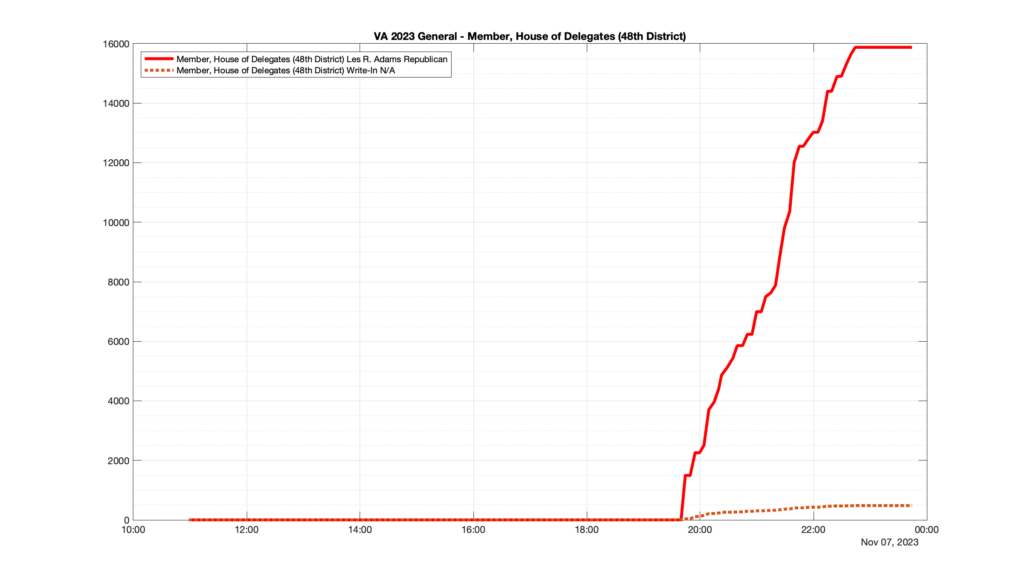
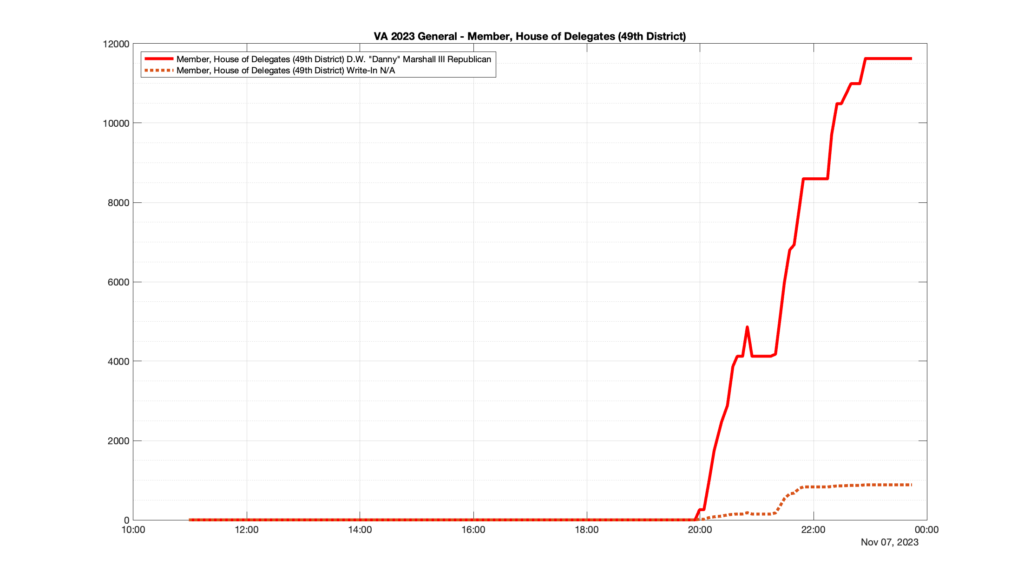
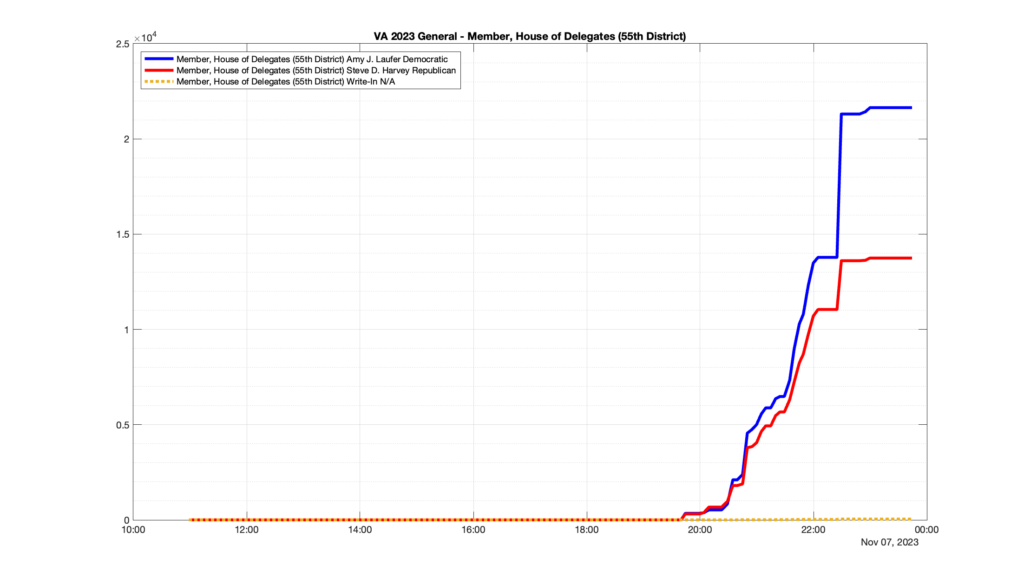
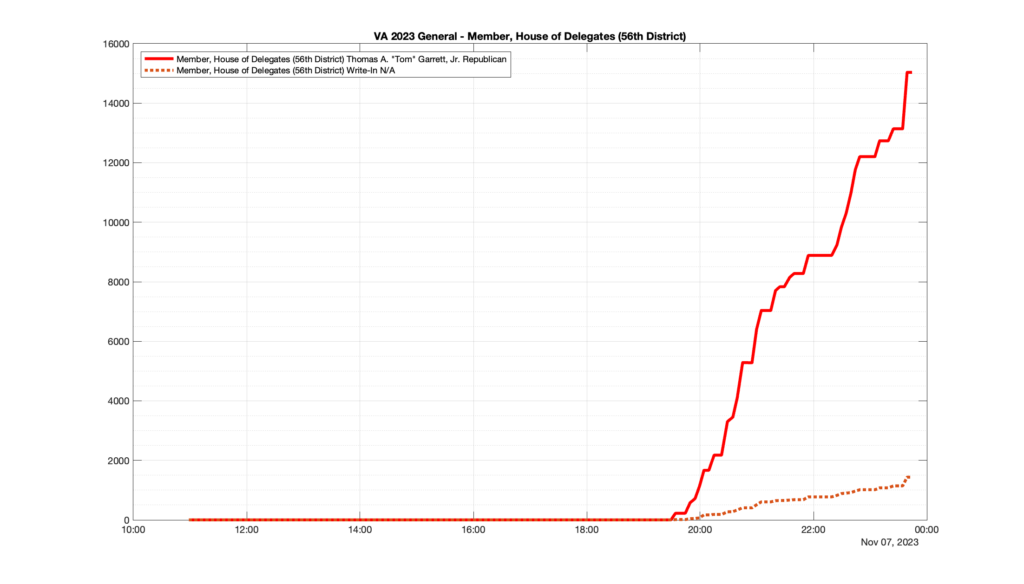
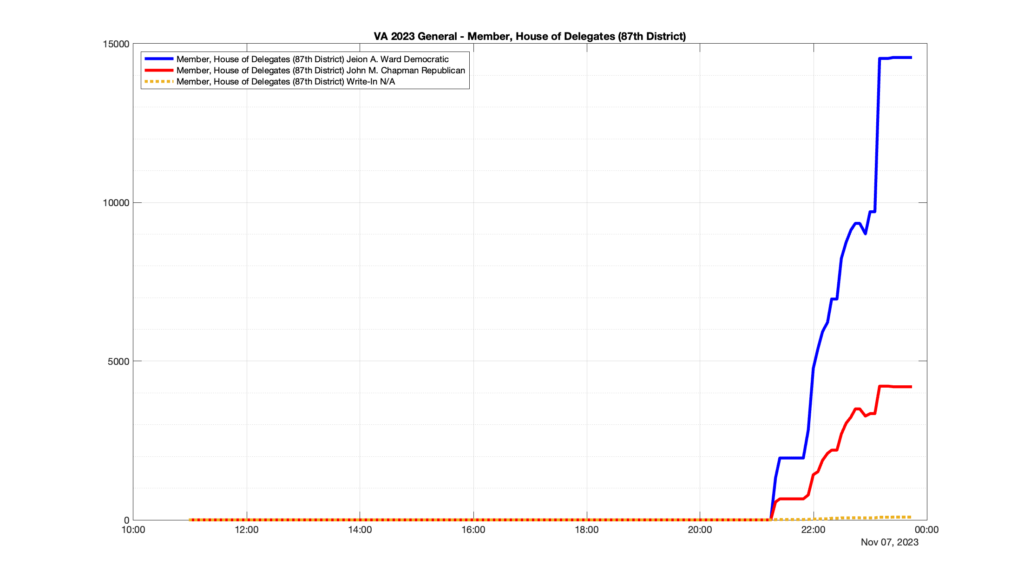
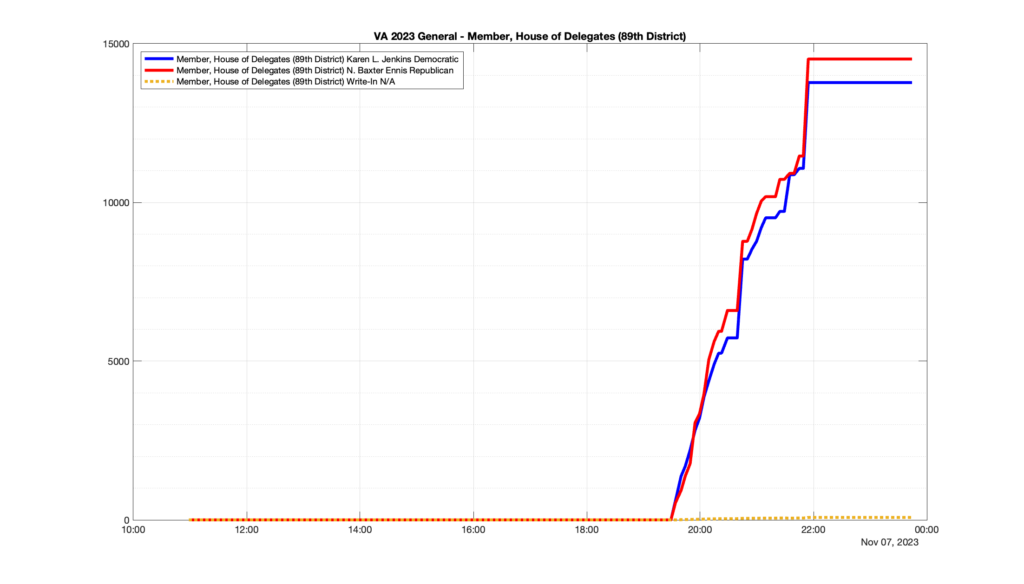
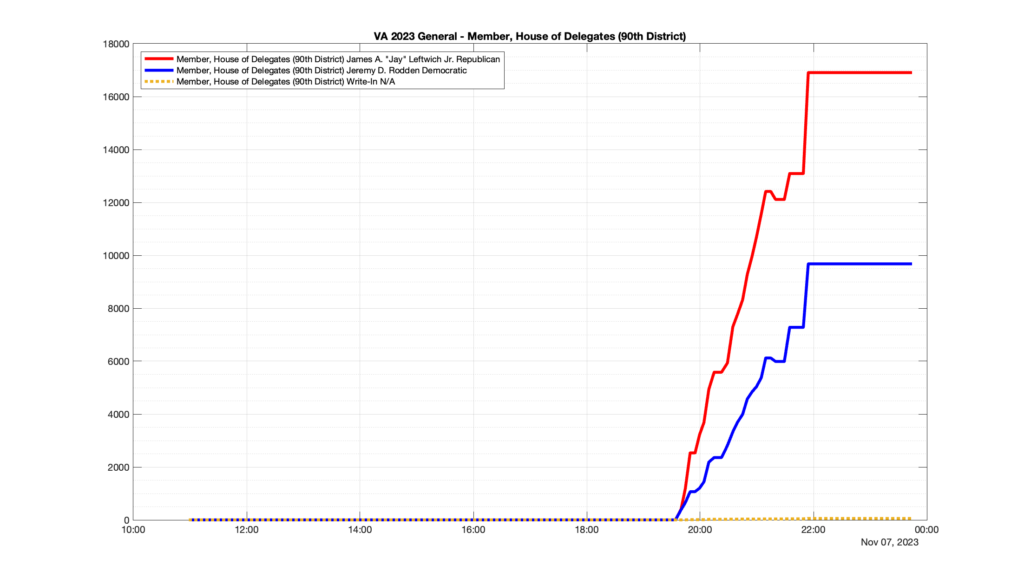
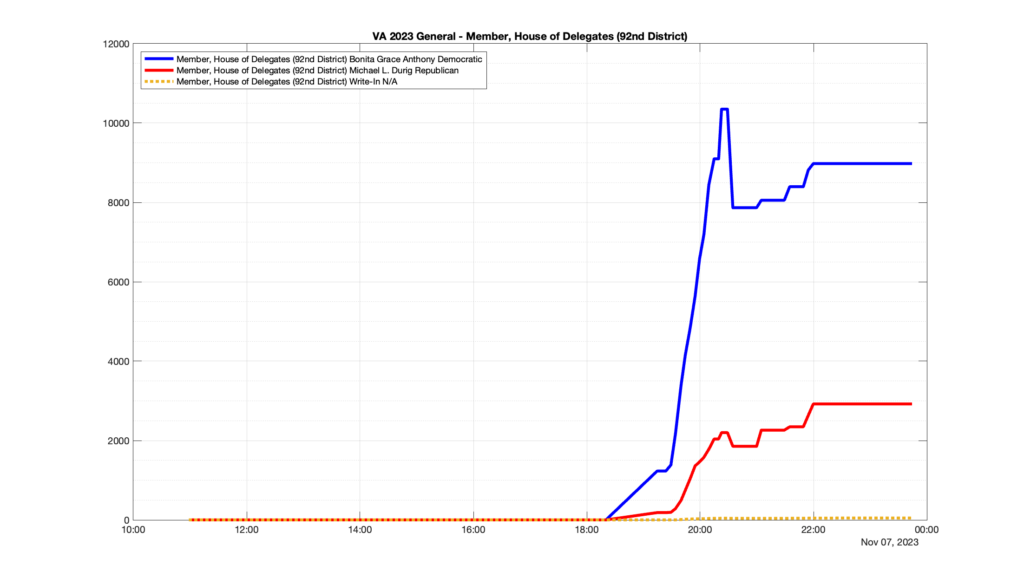
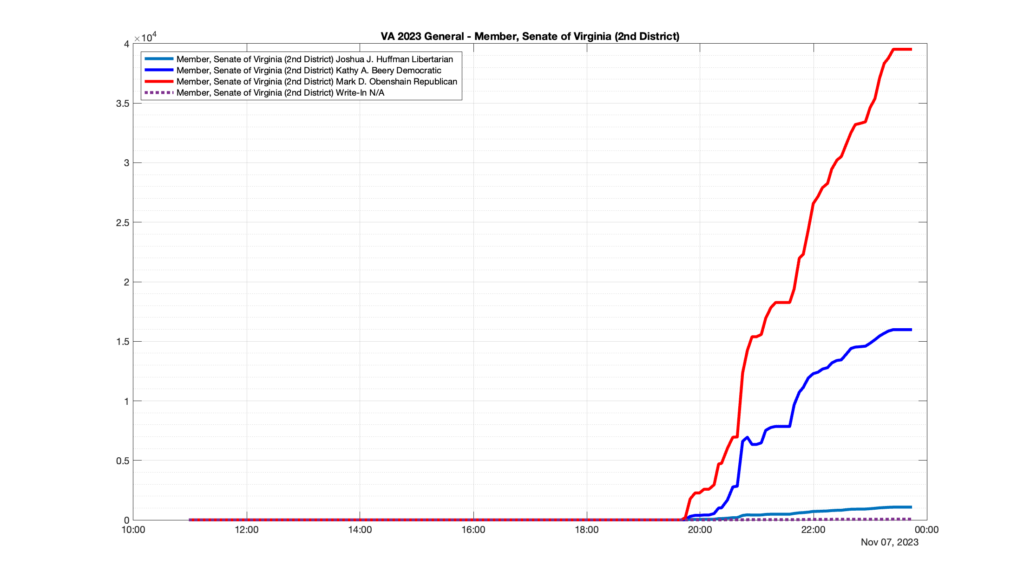
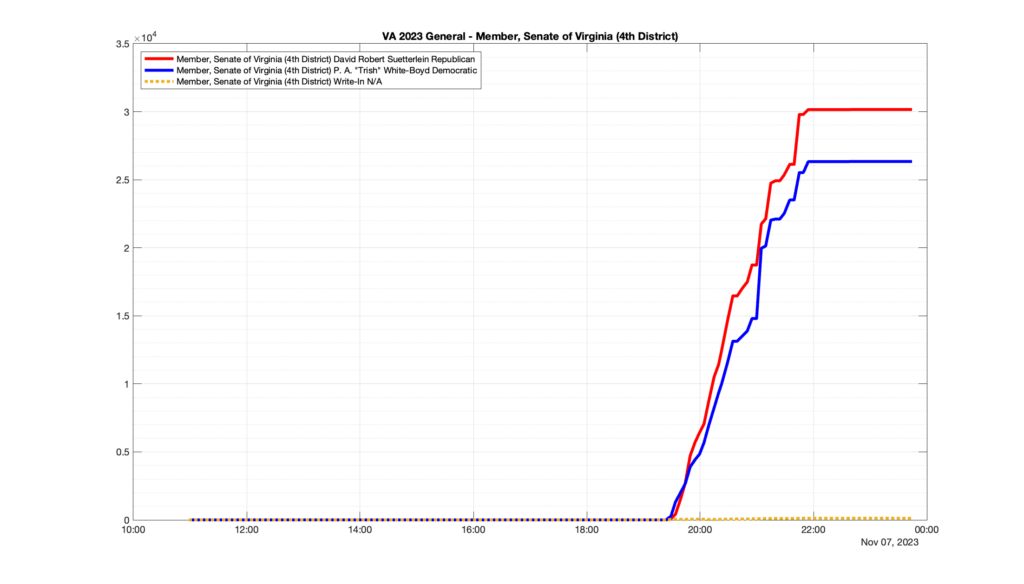
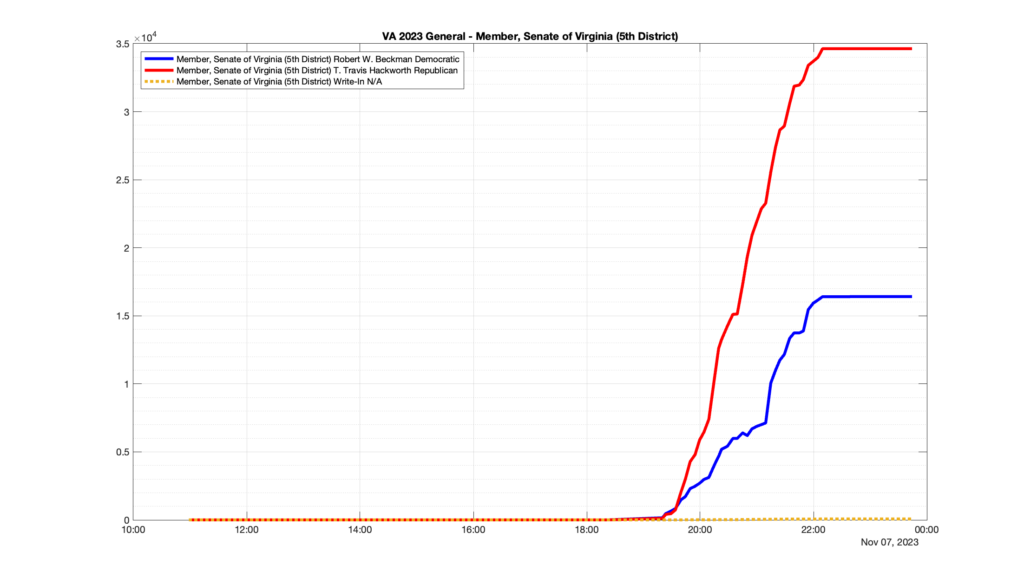
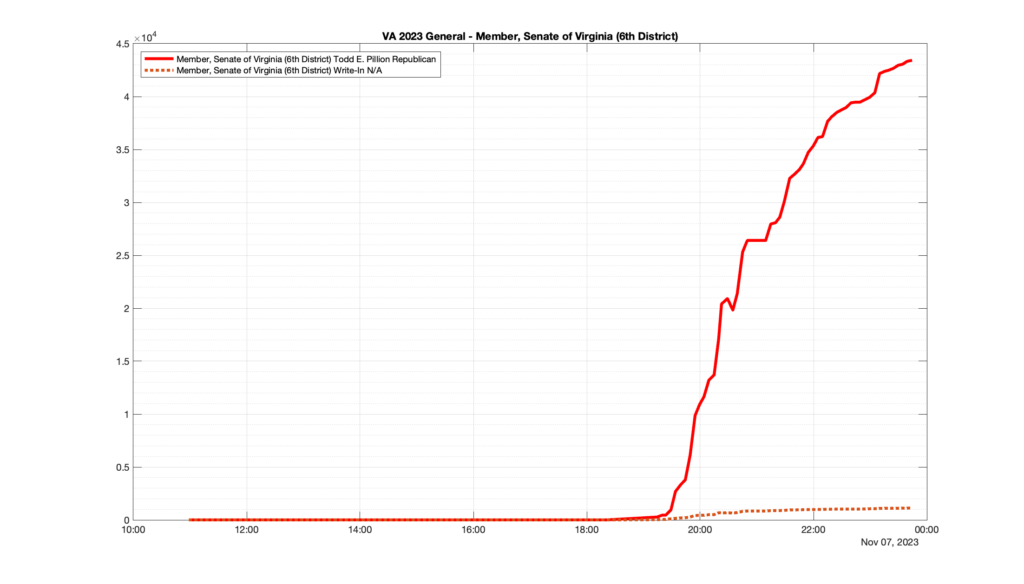
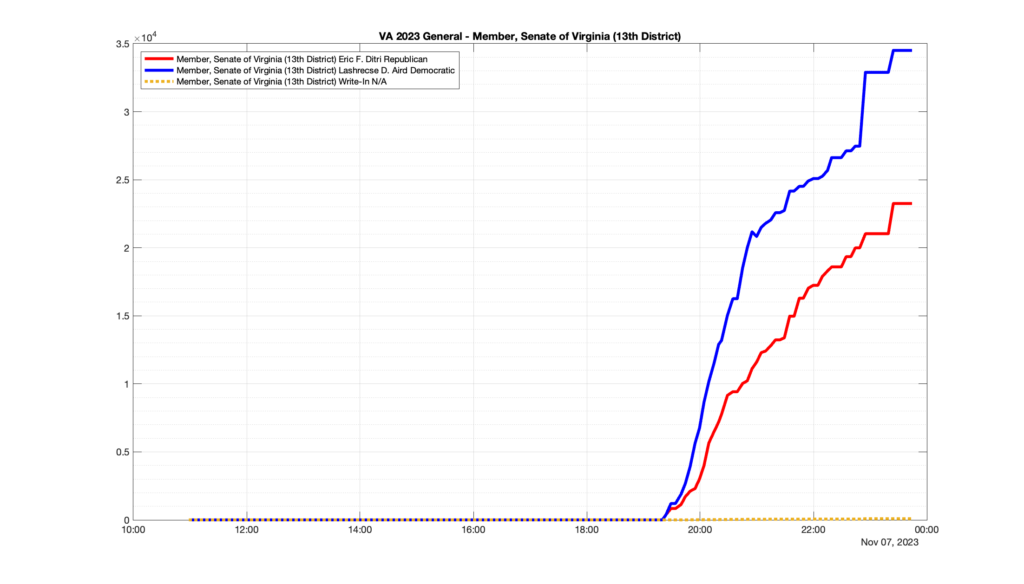
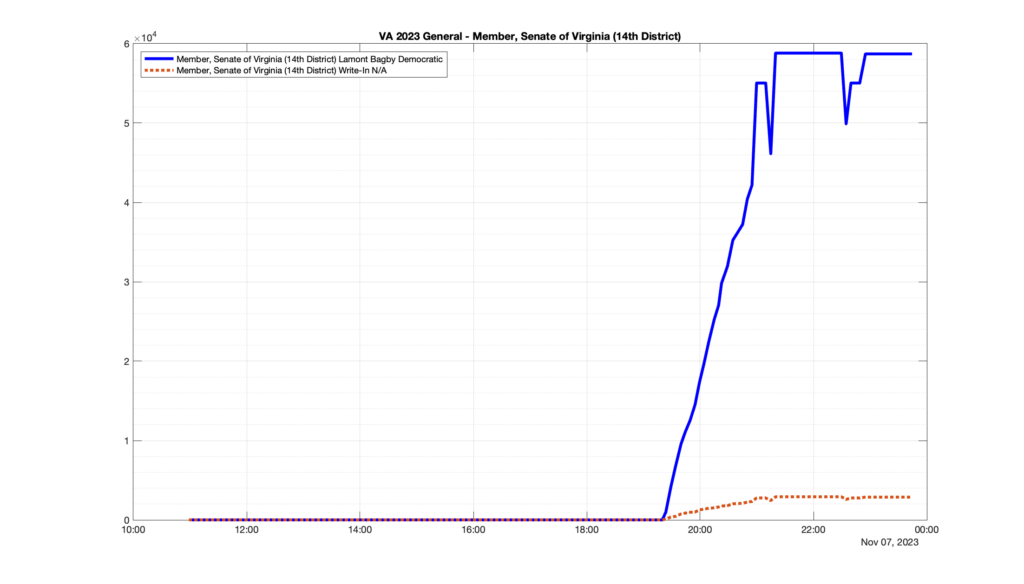
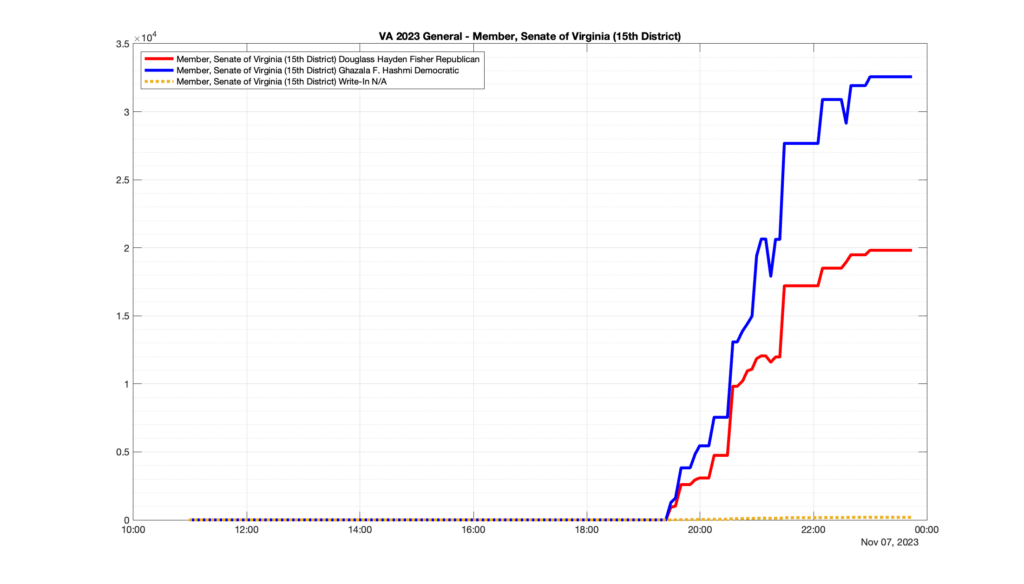
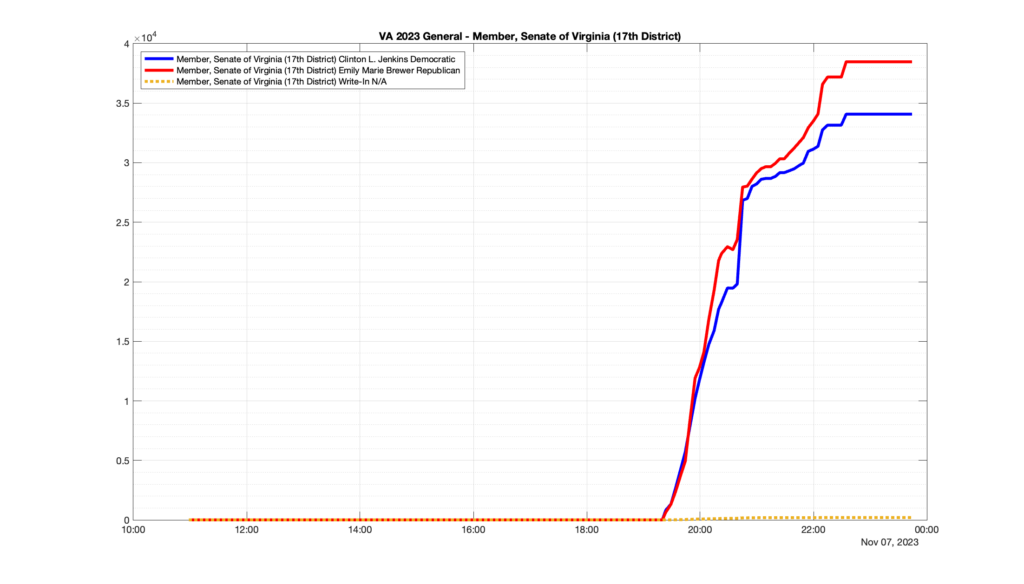
I took the extra step of logging all of the election night return files posted by the VA department of elections (“ELECT”) at 5 minute increments, as I wanted to plot the results over time as the numbers came in.

The data is from this link on ELECT’s website: https://enr.elections.virginia.gov/results/public/api/elections/Virginia/2023-Nov-Gen/files/json

I used a simple wget script to grab this file once every 5 minutes (approximately).

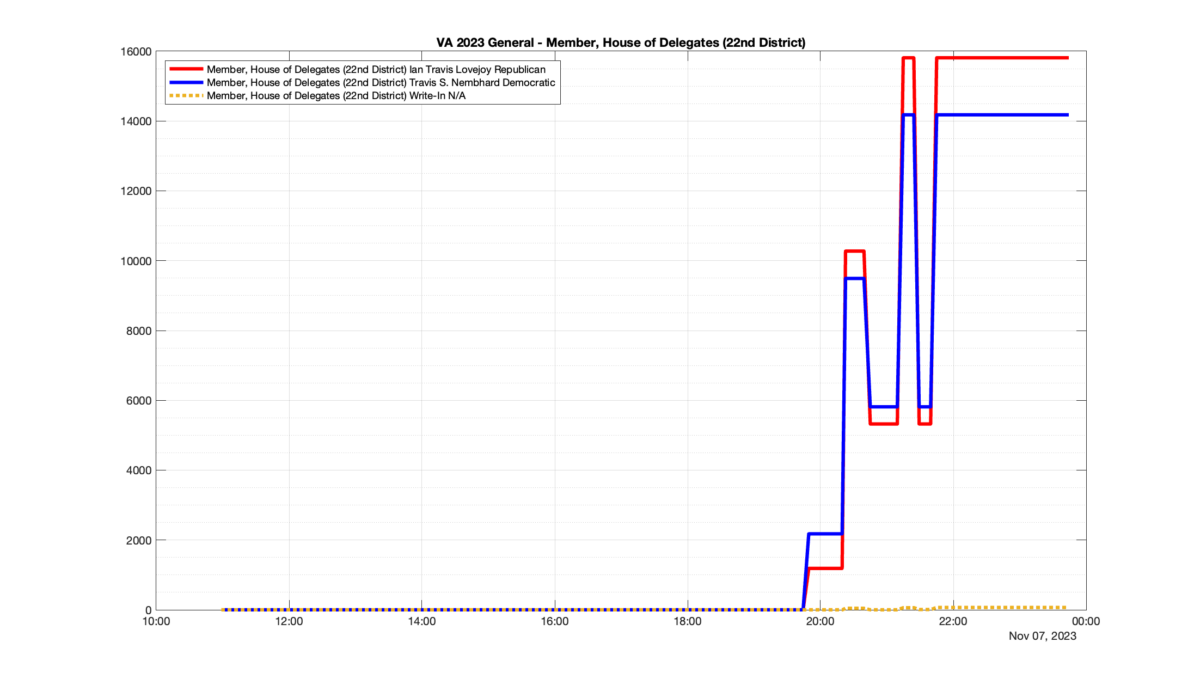
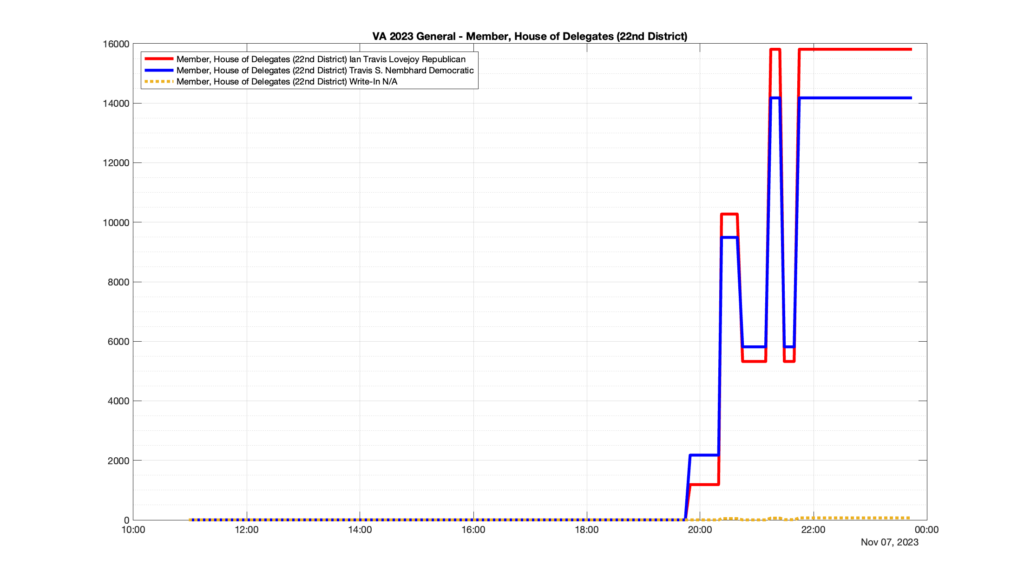
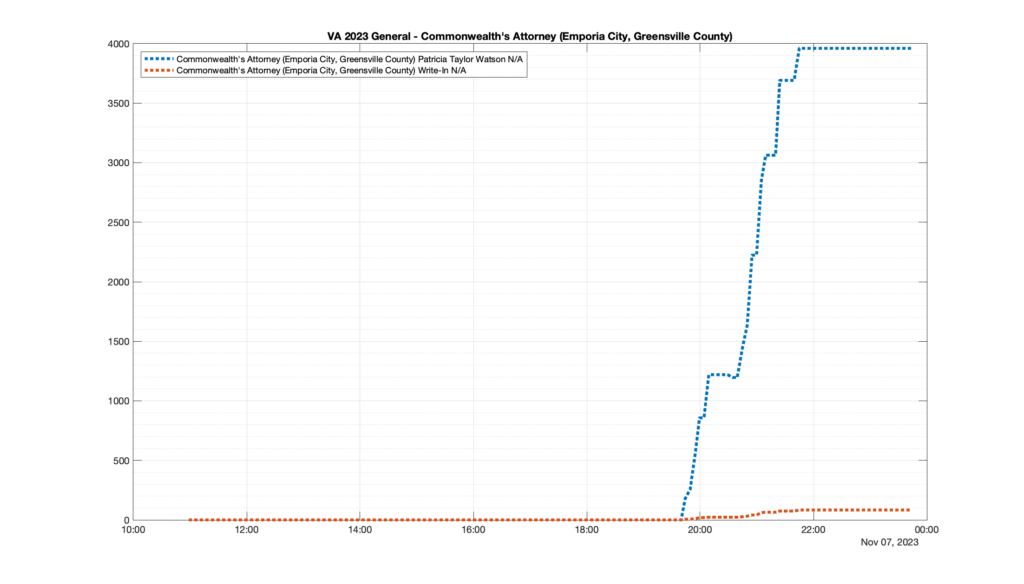
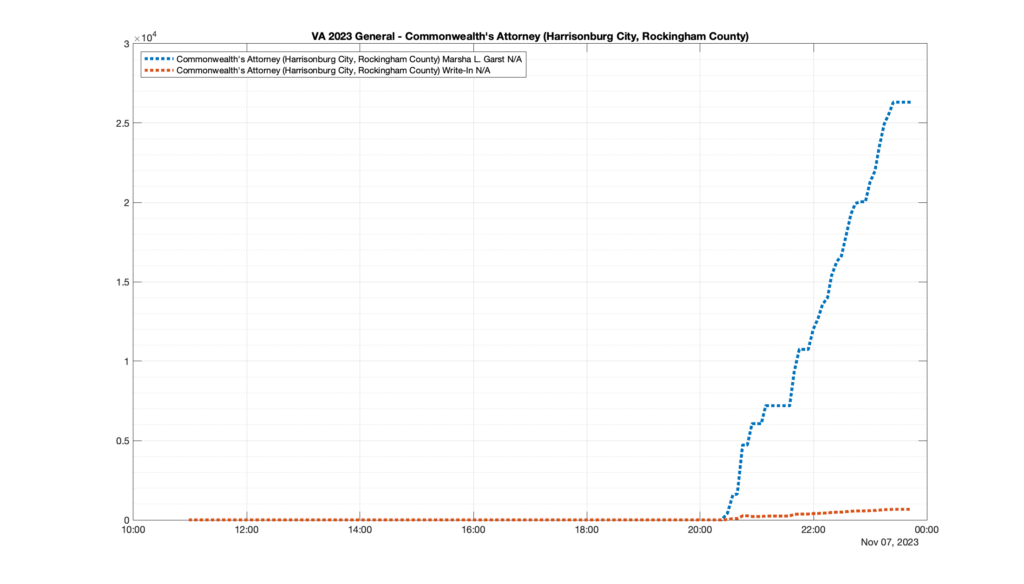
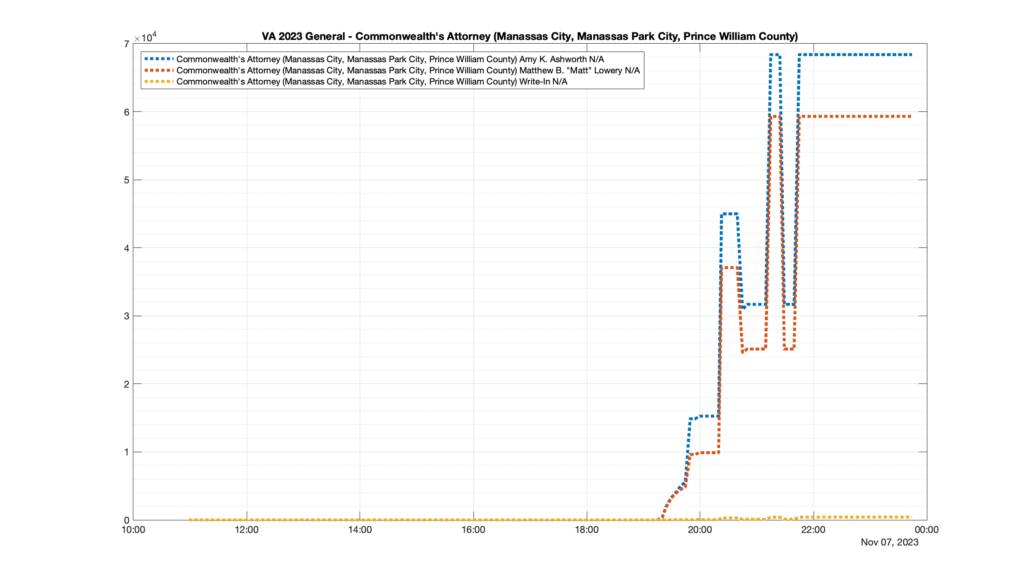
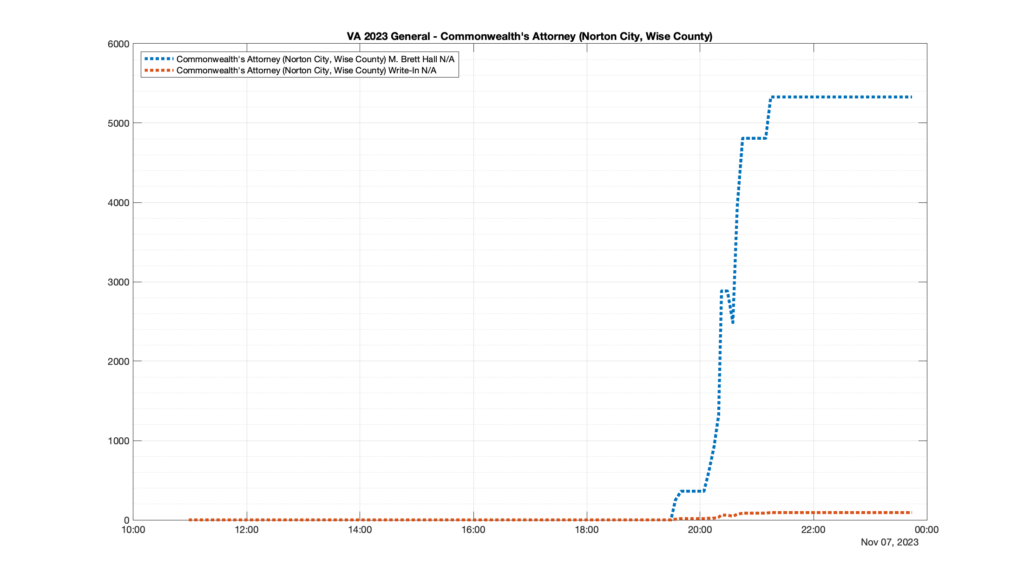
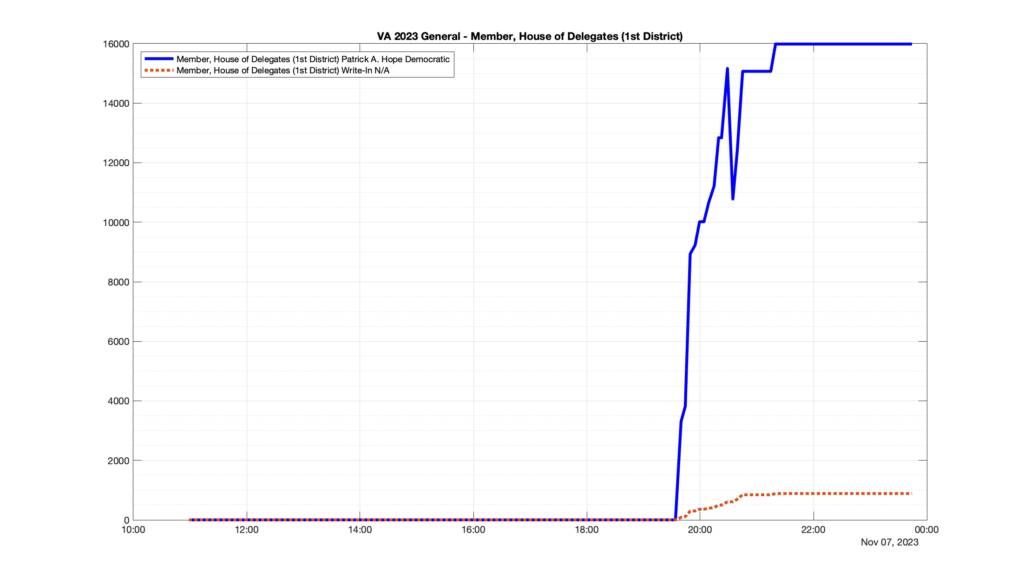
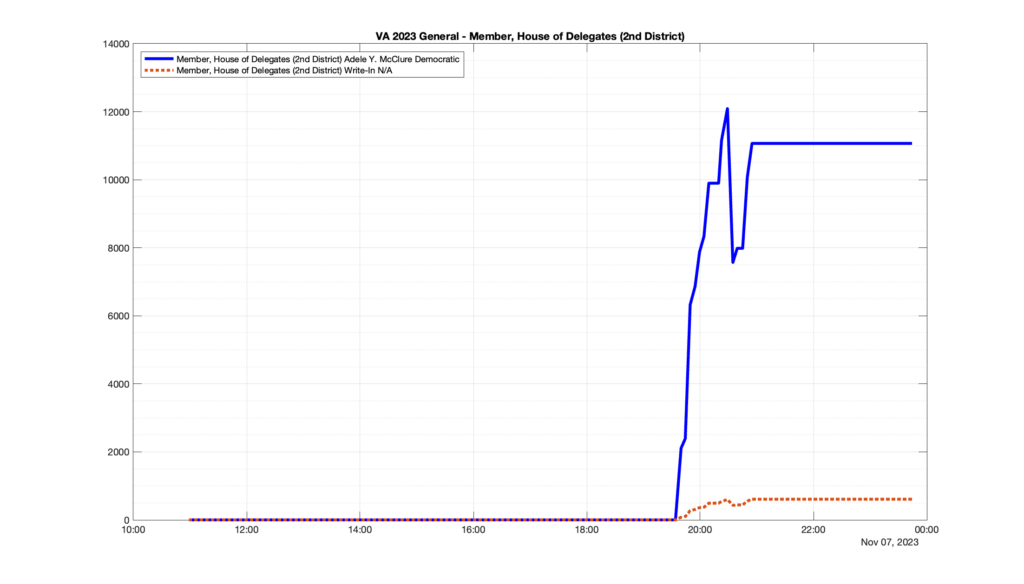
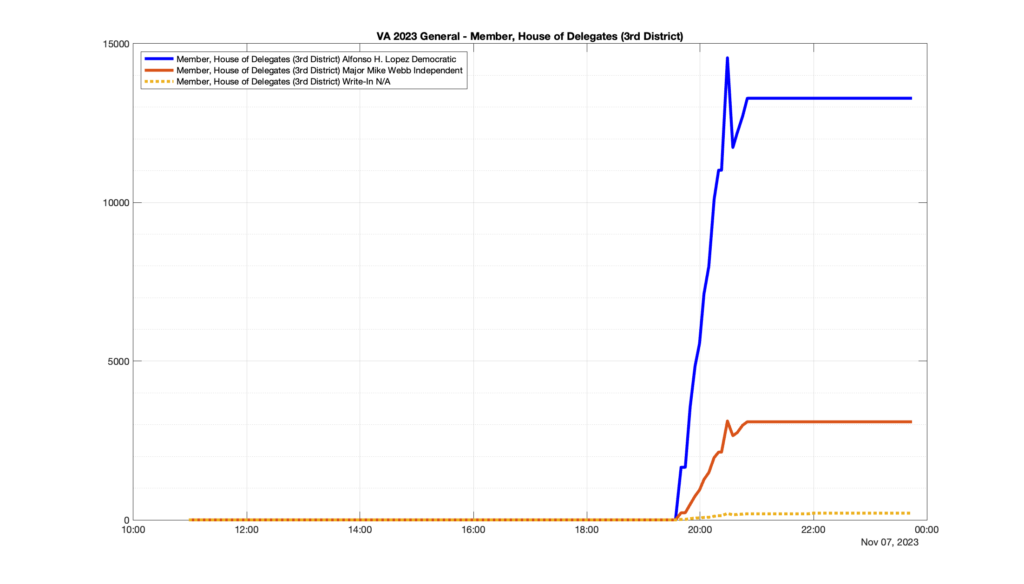
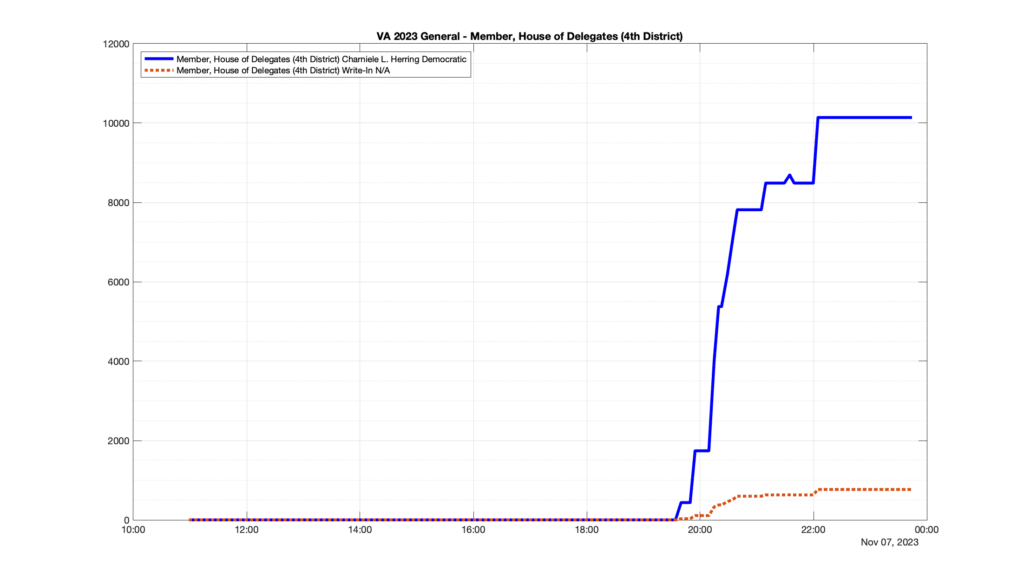
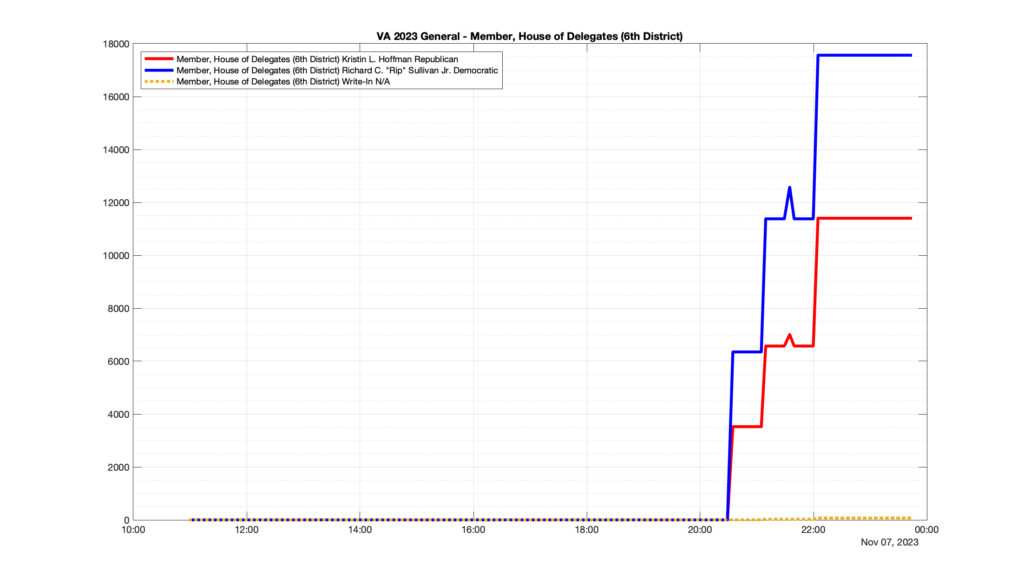
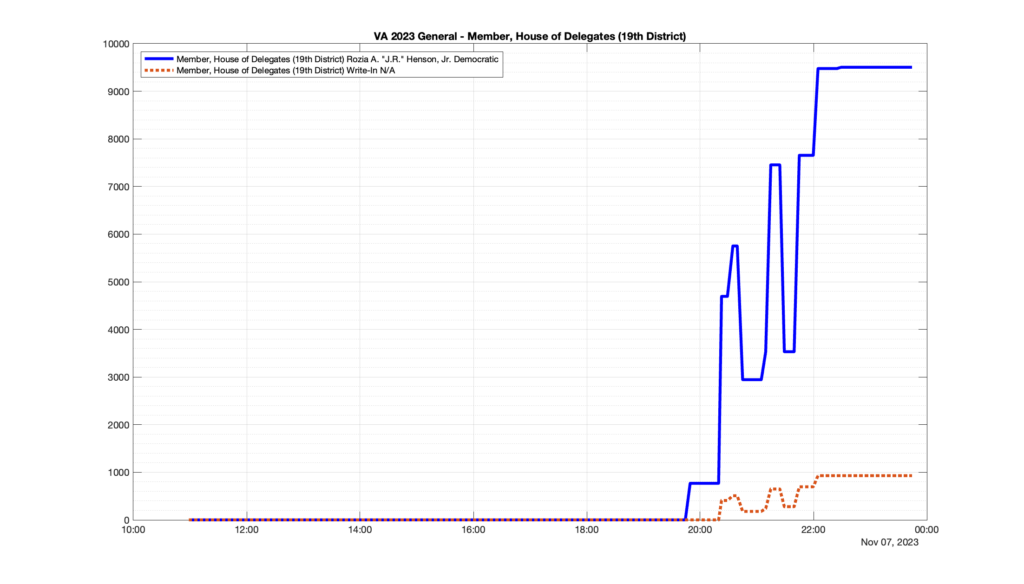
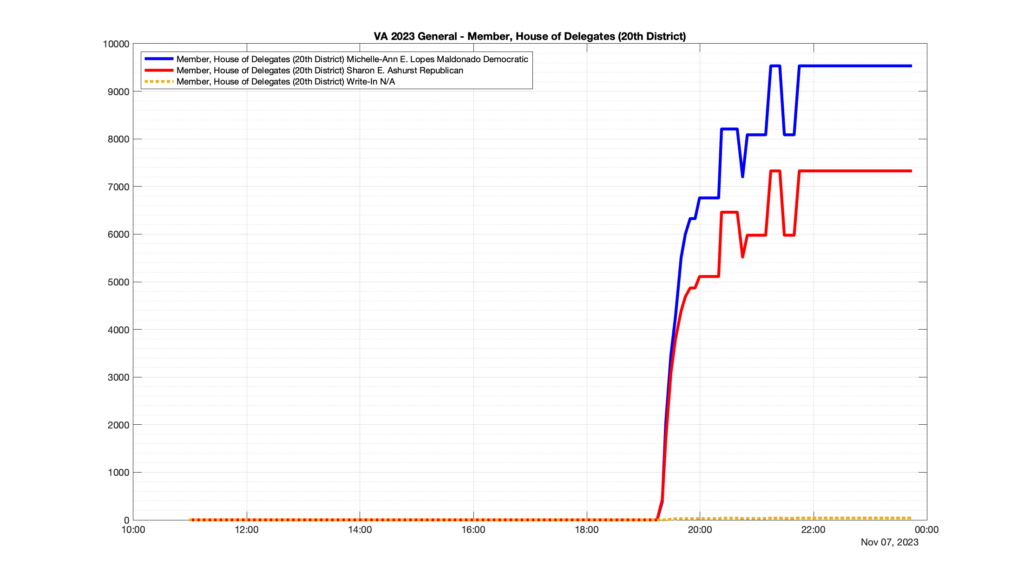
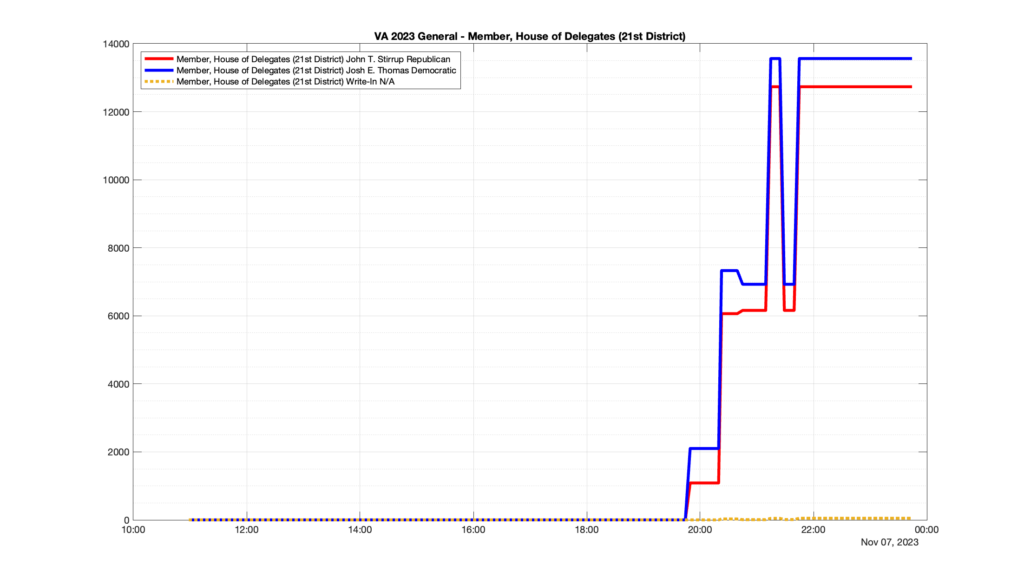
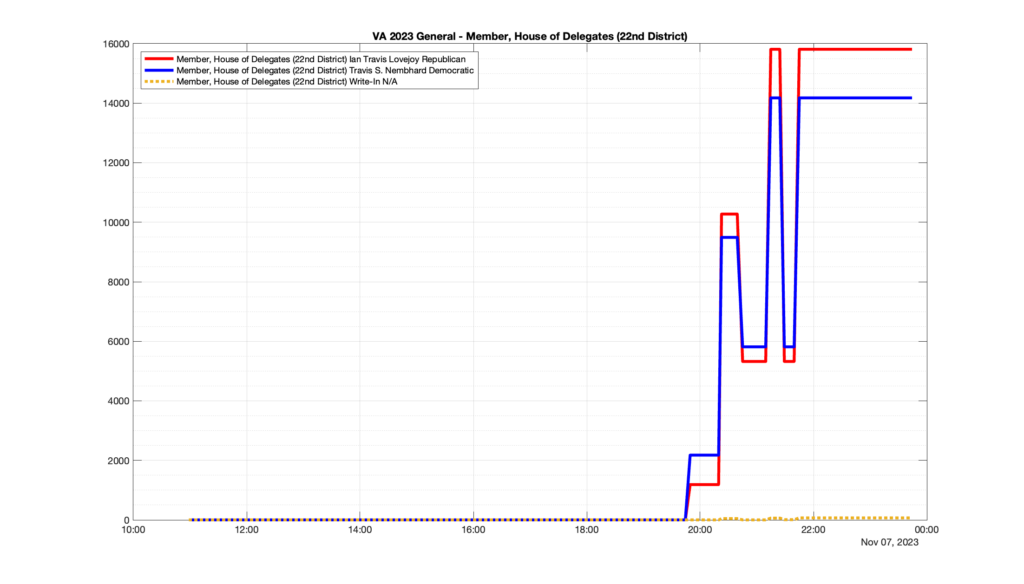
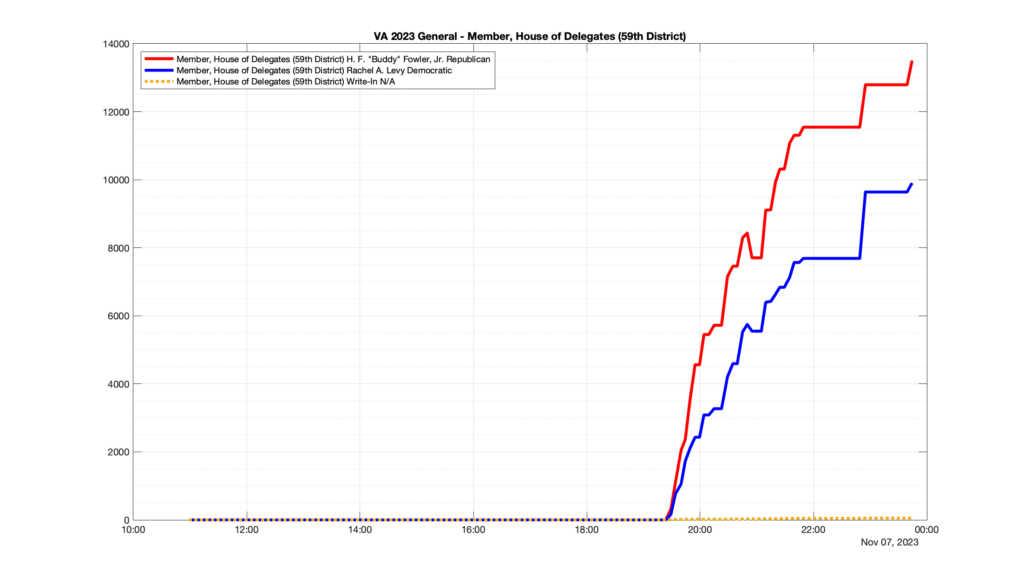
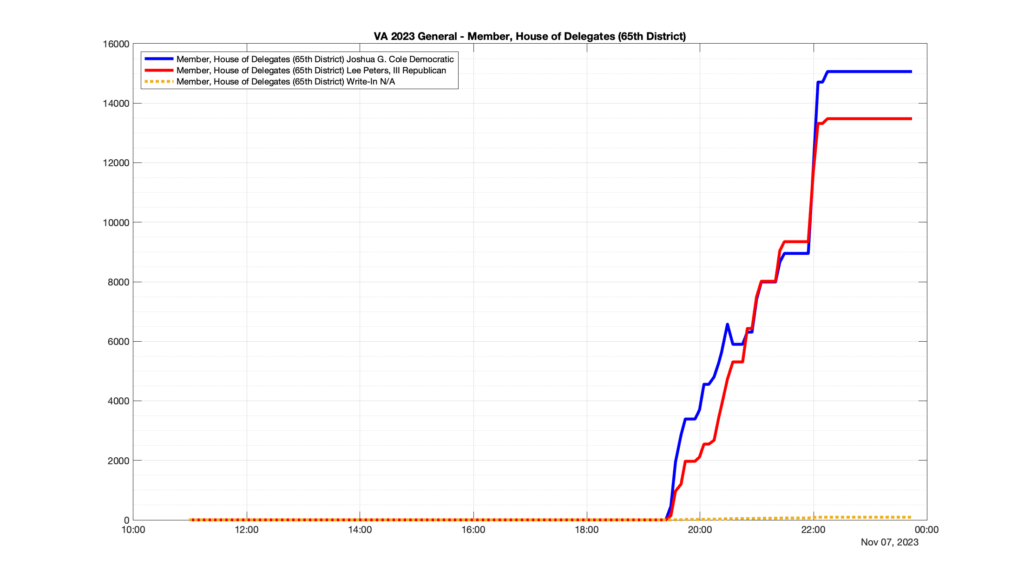
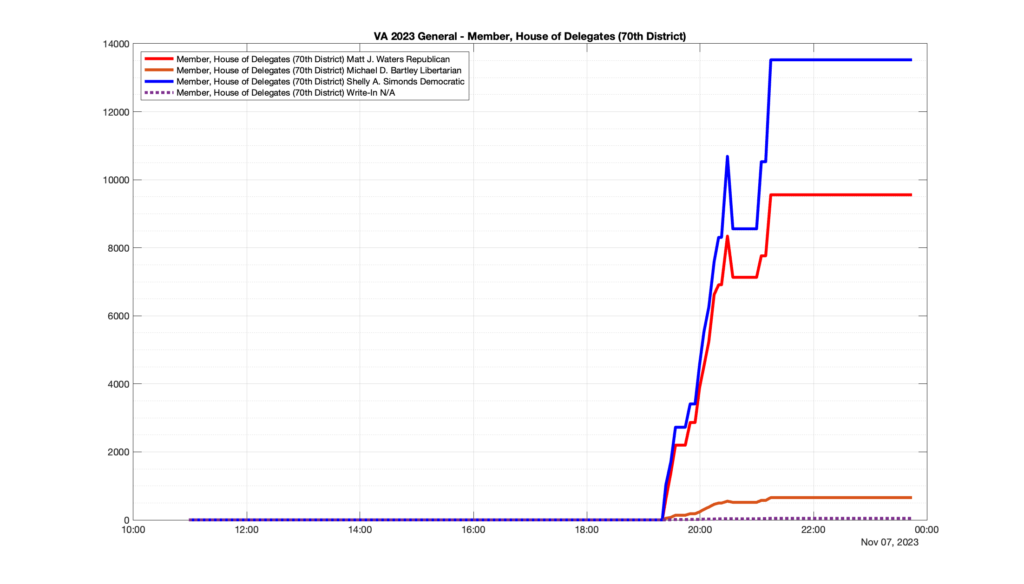
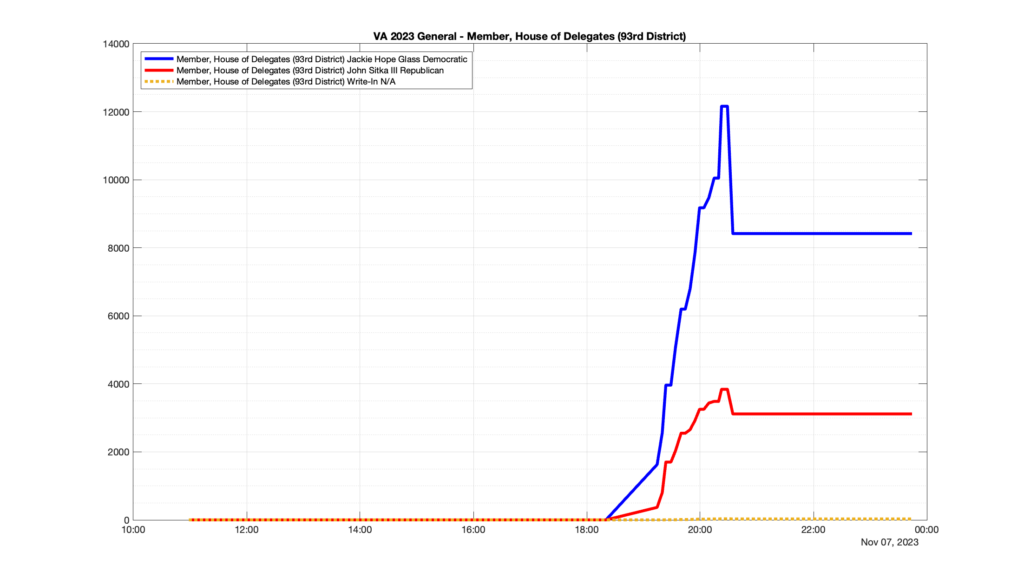
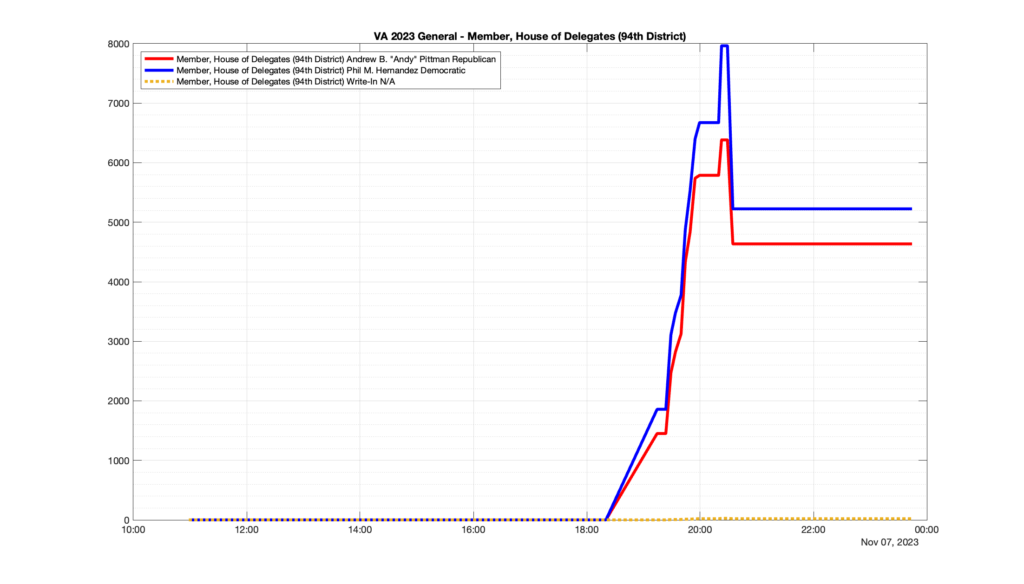
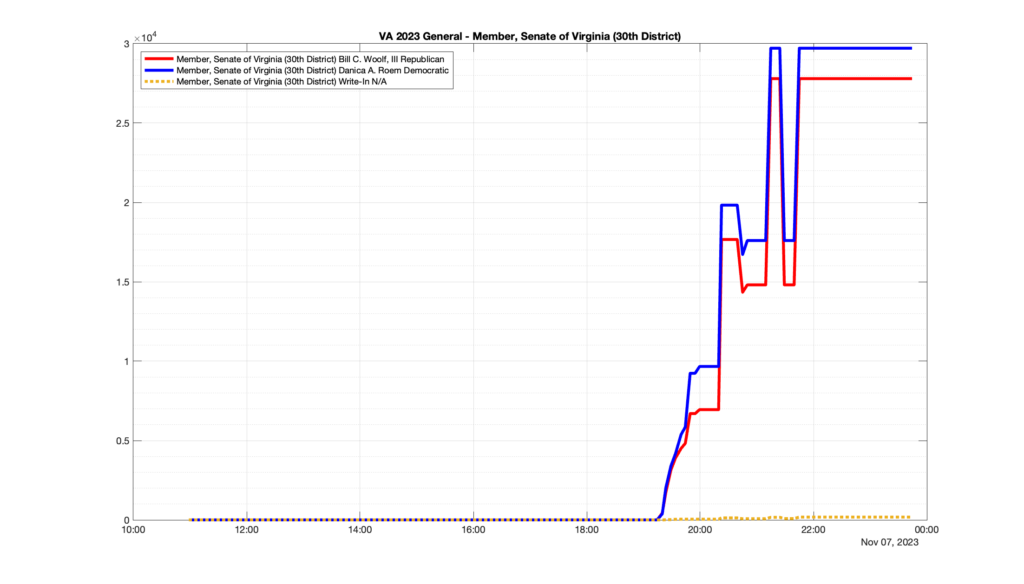
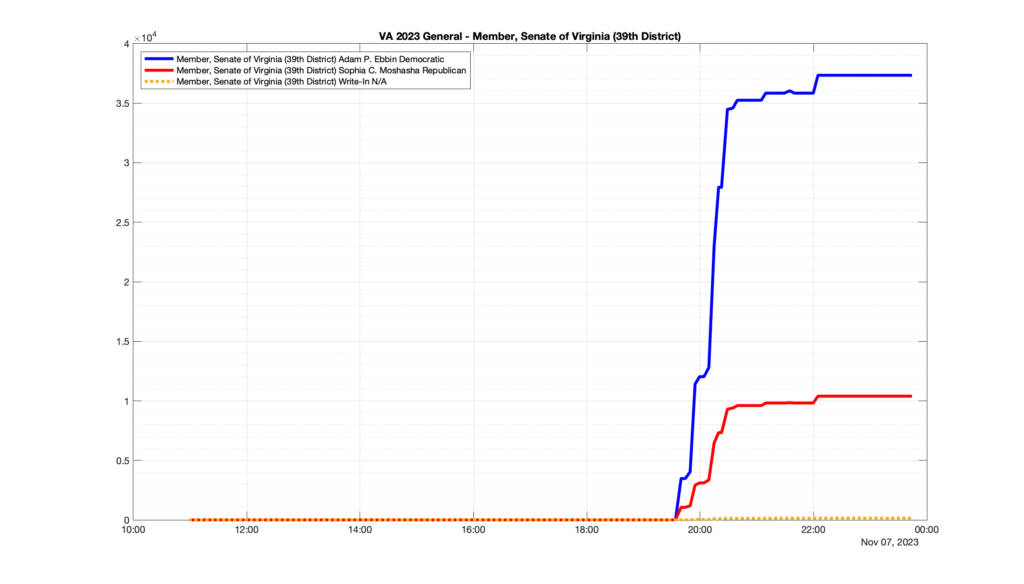
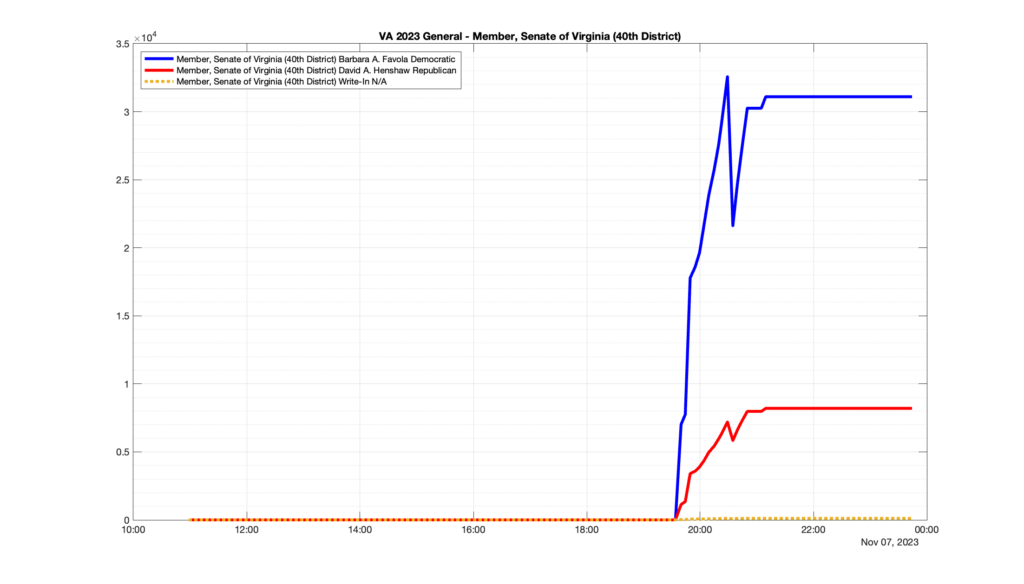
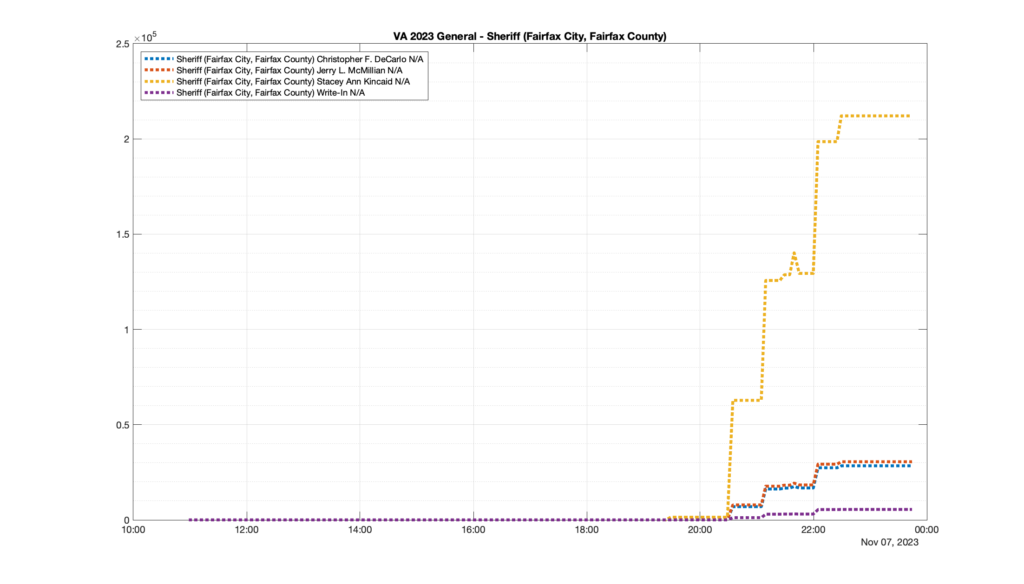
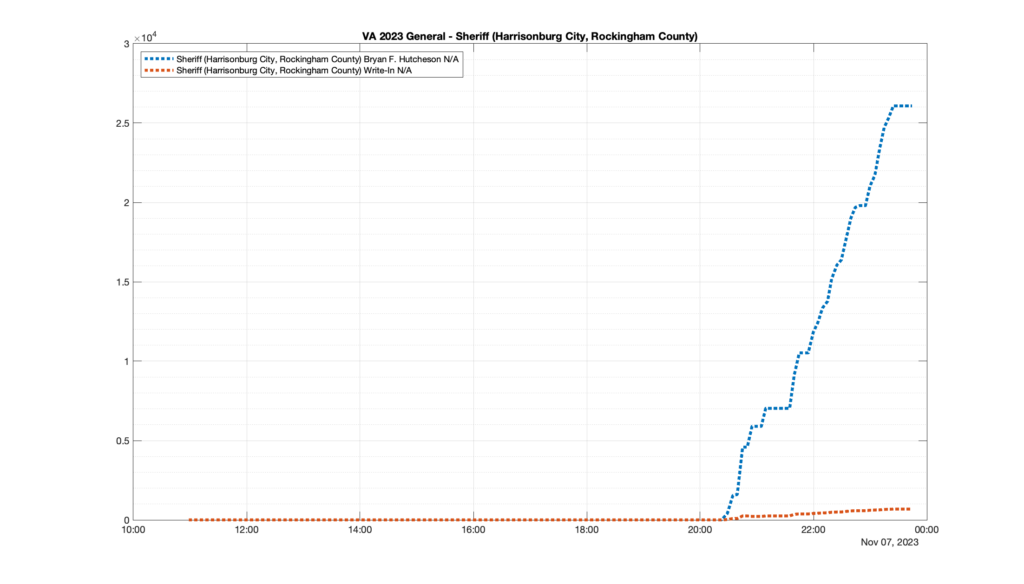
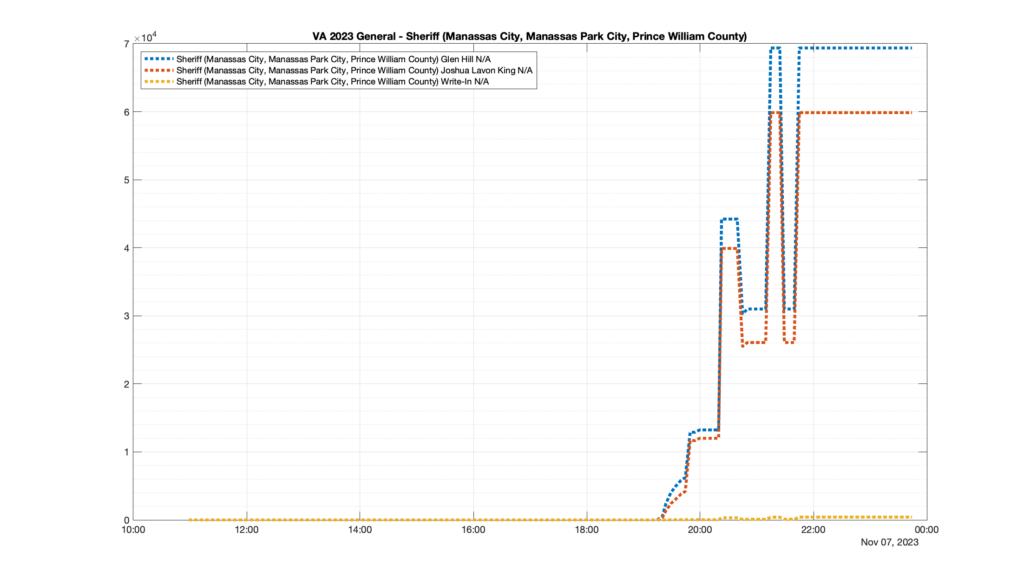
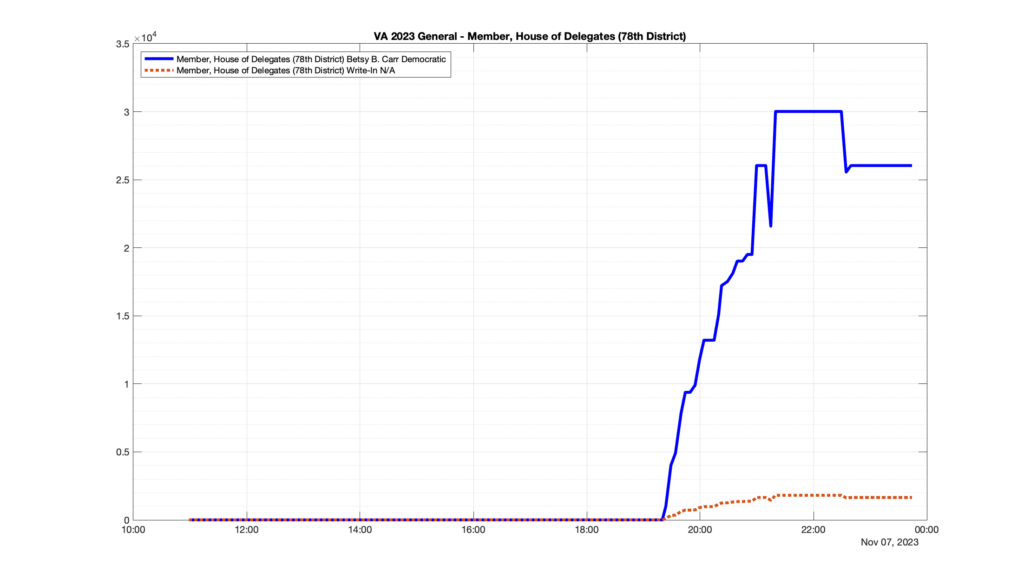
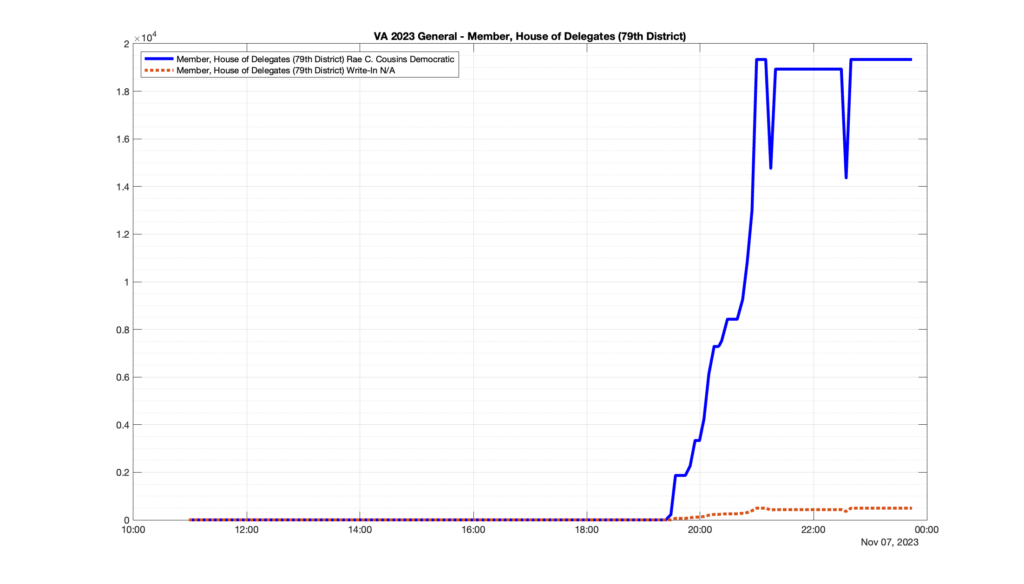
However, when I went to plot the results, I found some data curves that I can’t quite explain. Take, for example, the VA House of Delegates race in the 22nd District:

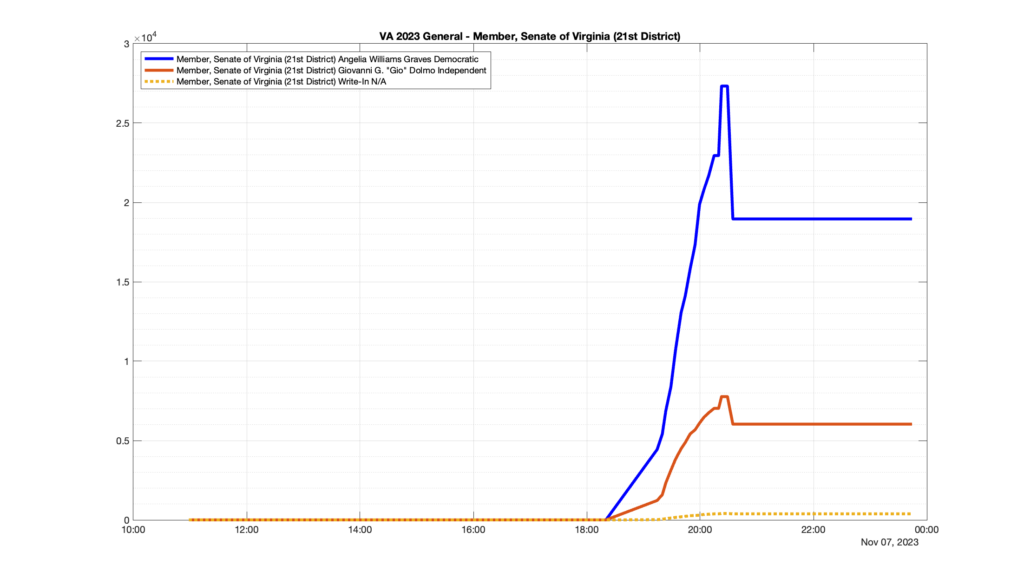
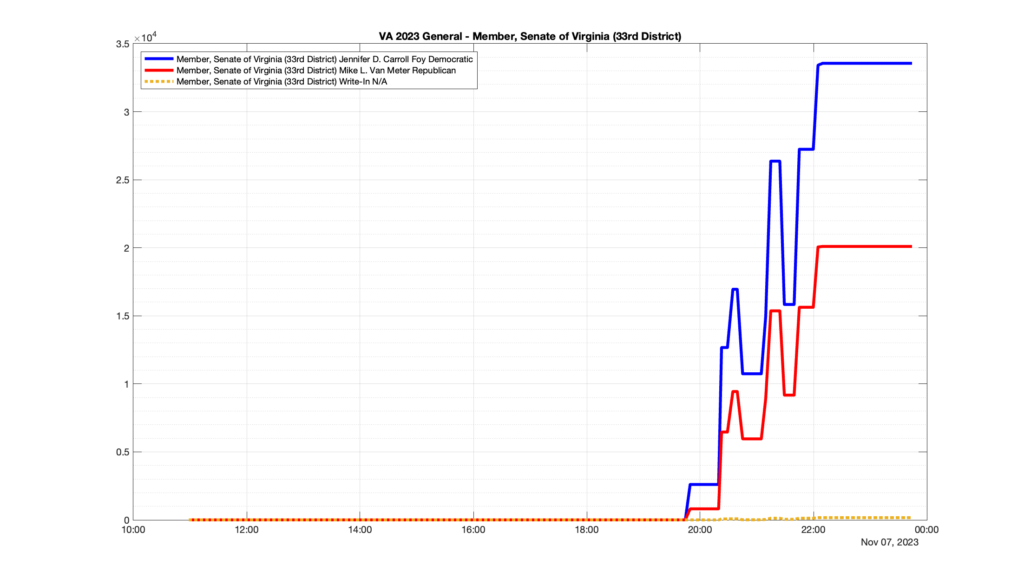
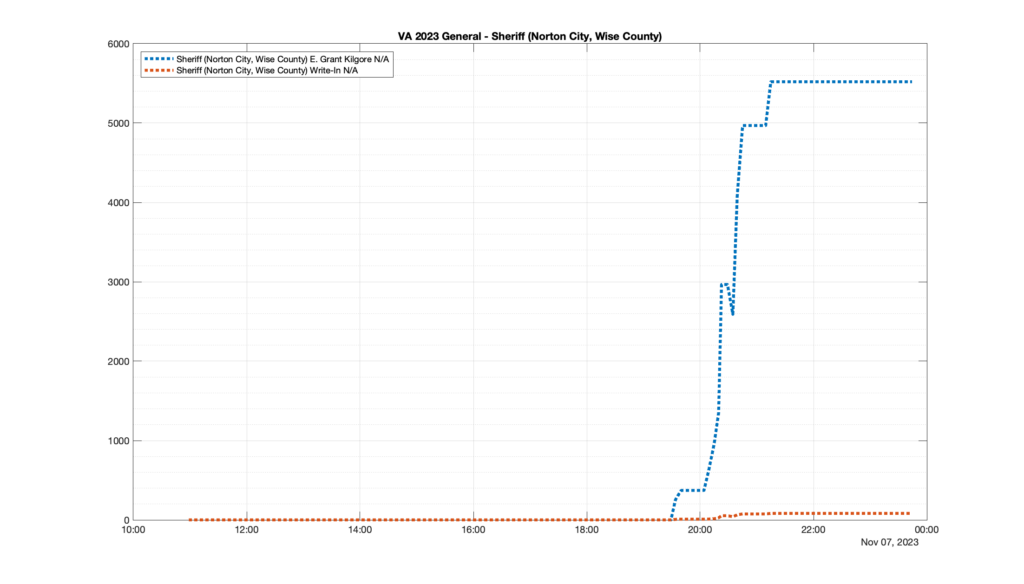
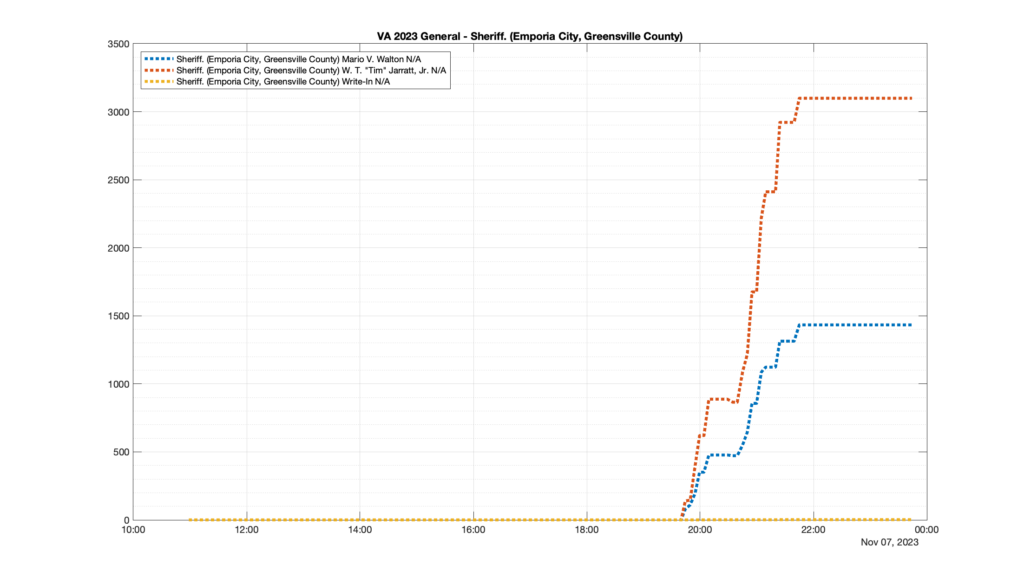
Now … last I checked, when accumulating counts of ballots … you wouldn’t expect the totals to go down, let alone oscillate back and forth.

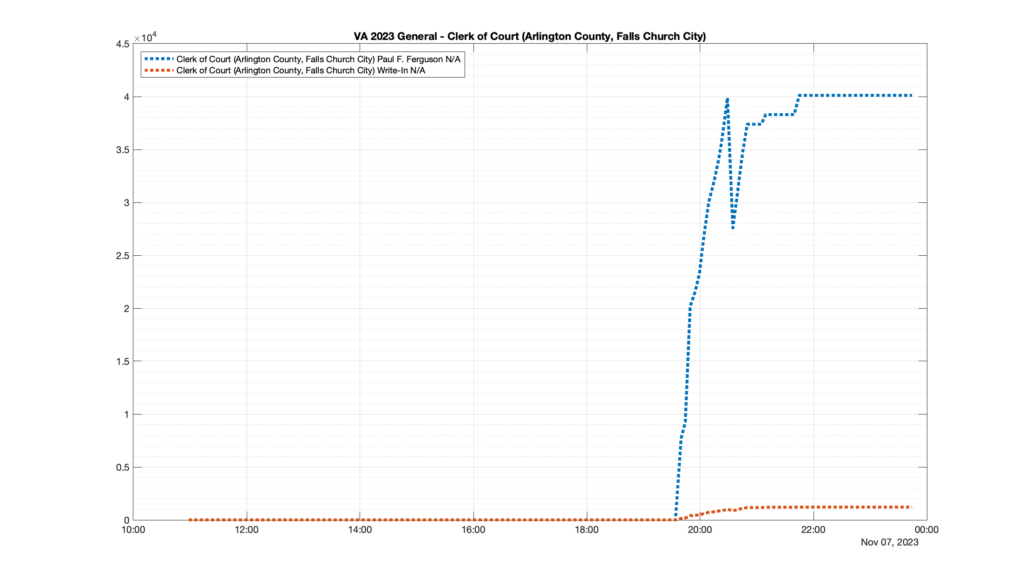
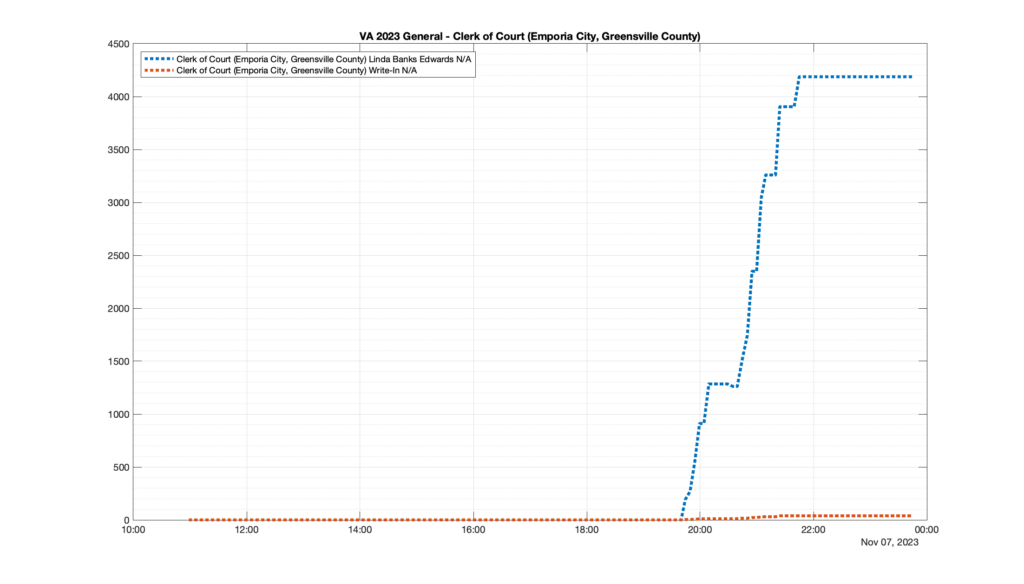
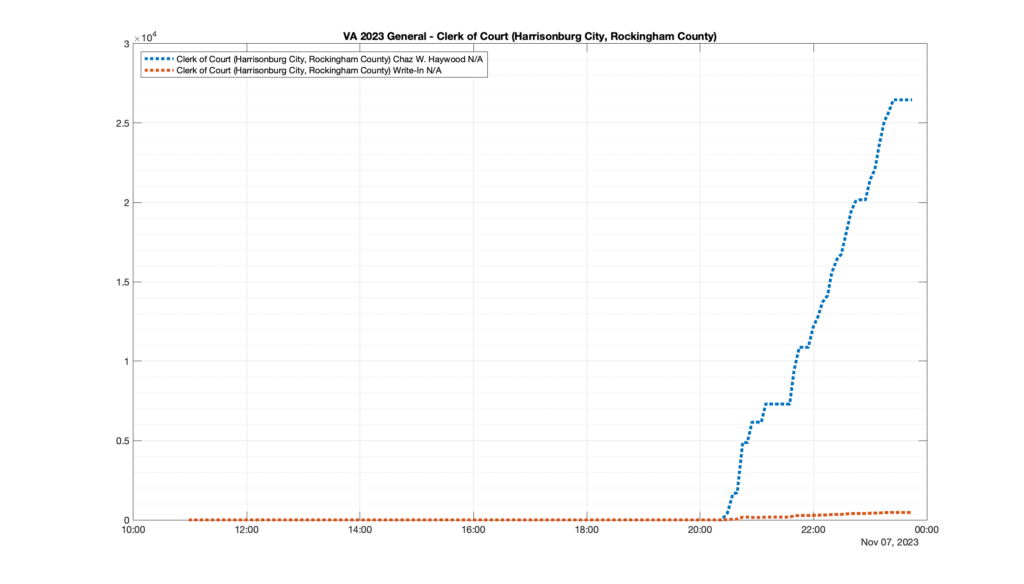
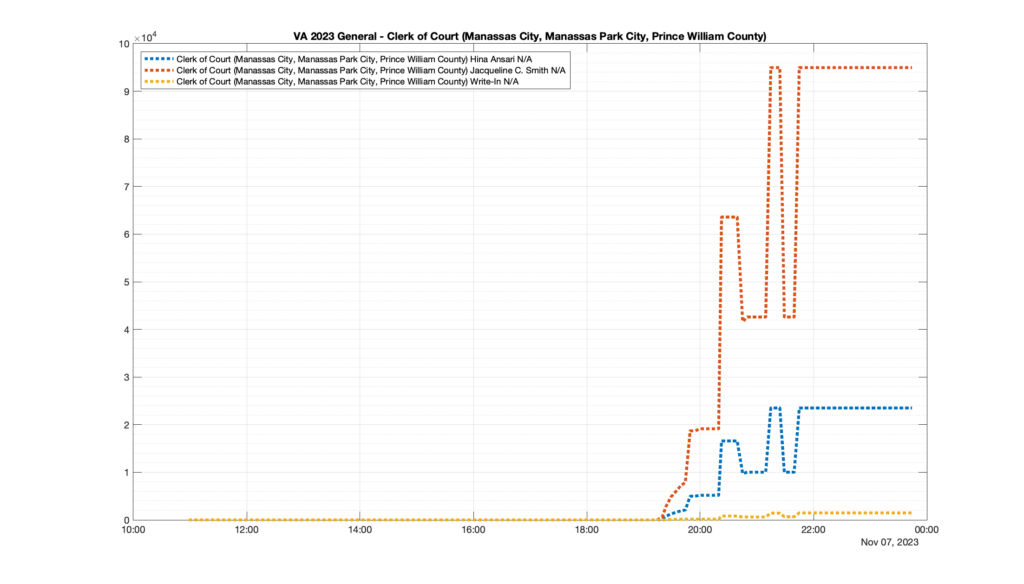
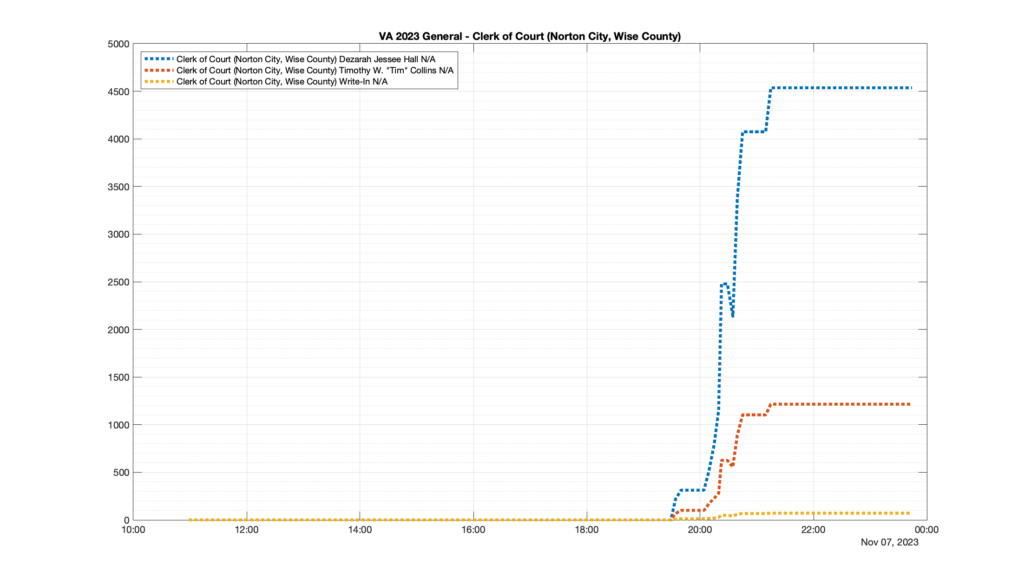
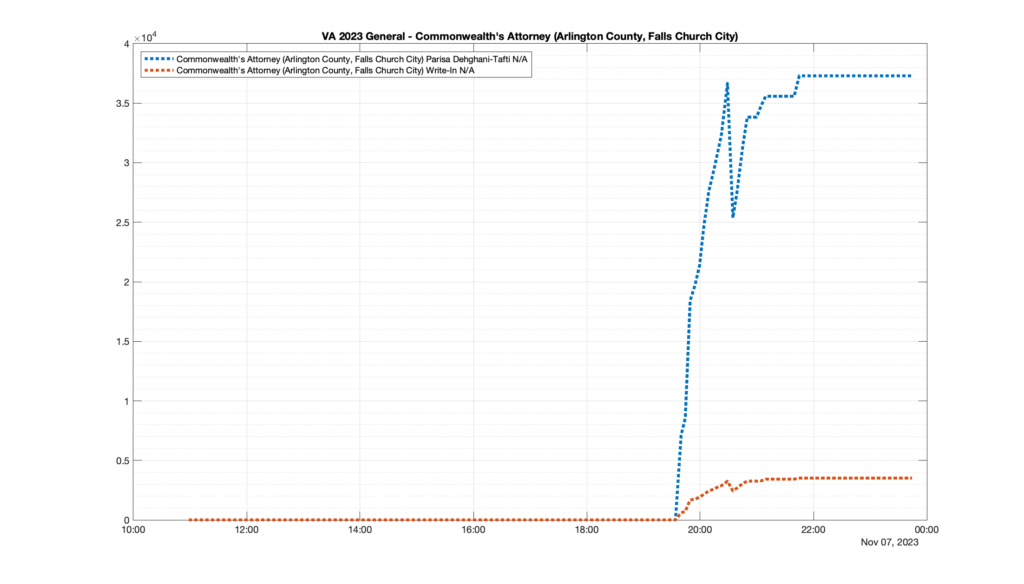
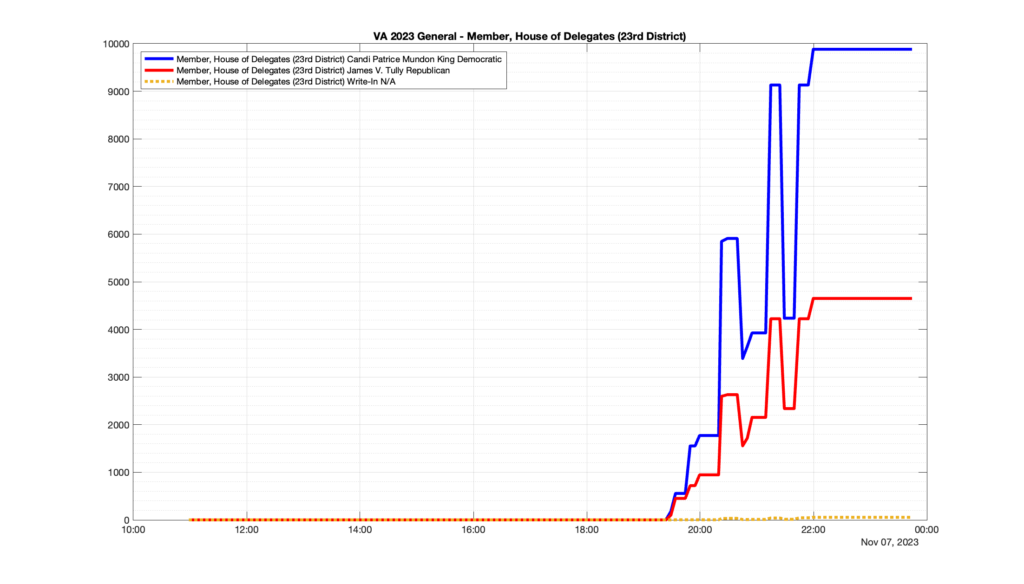
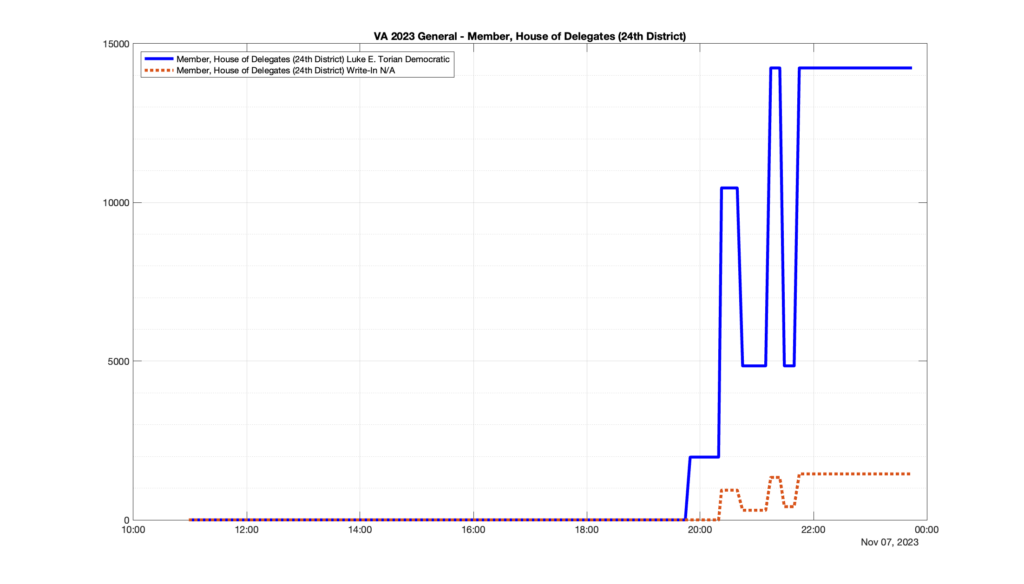
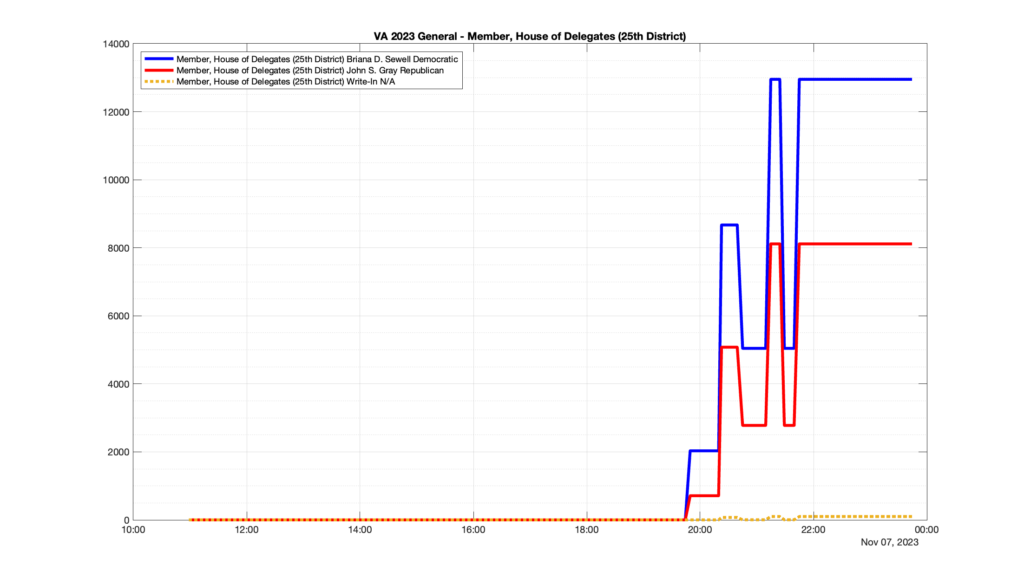
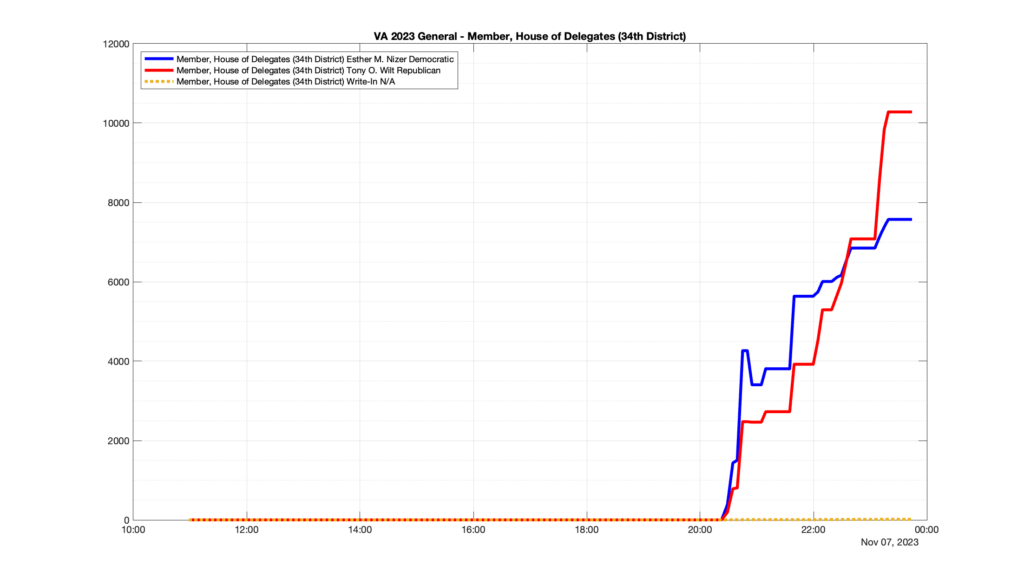
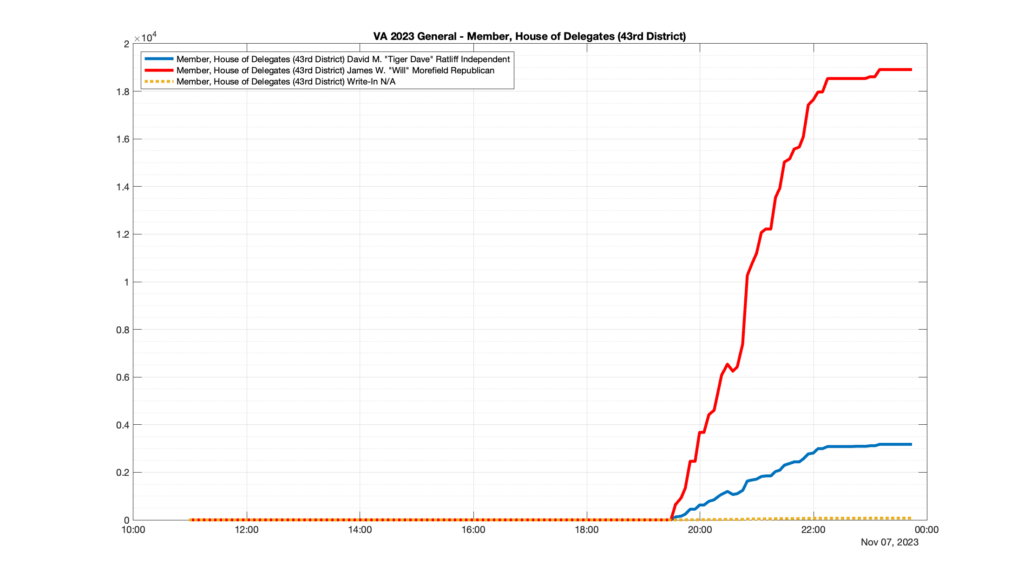
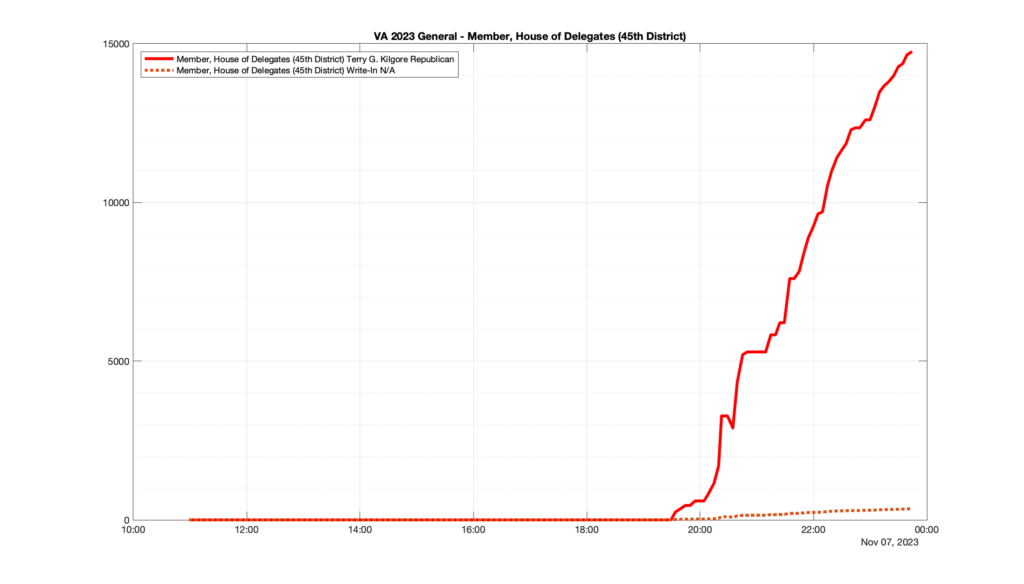
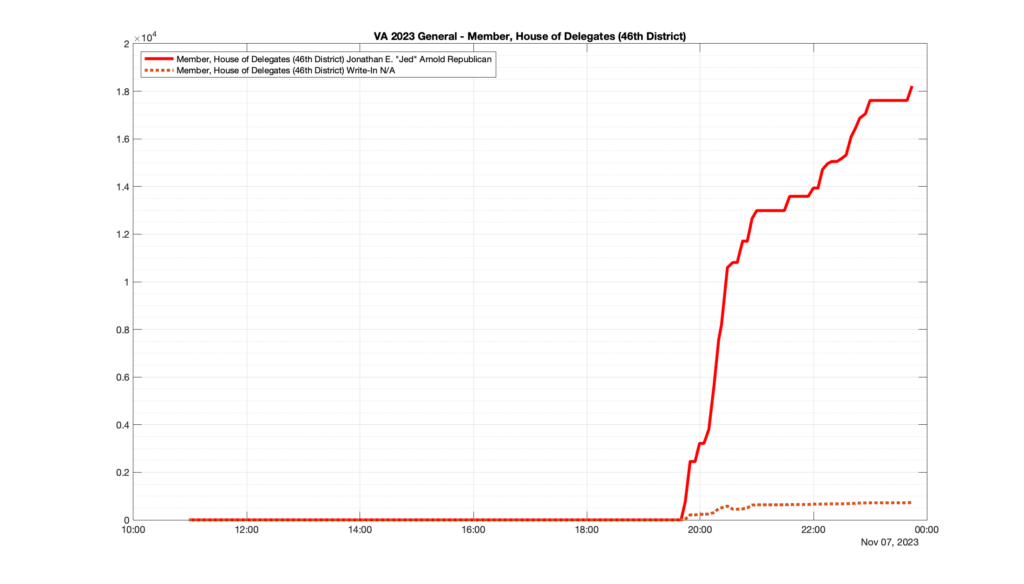
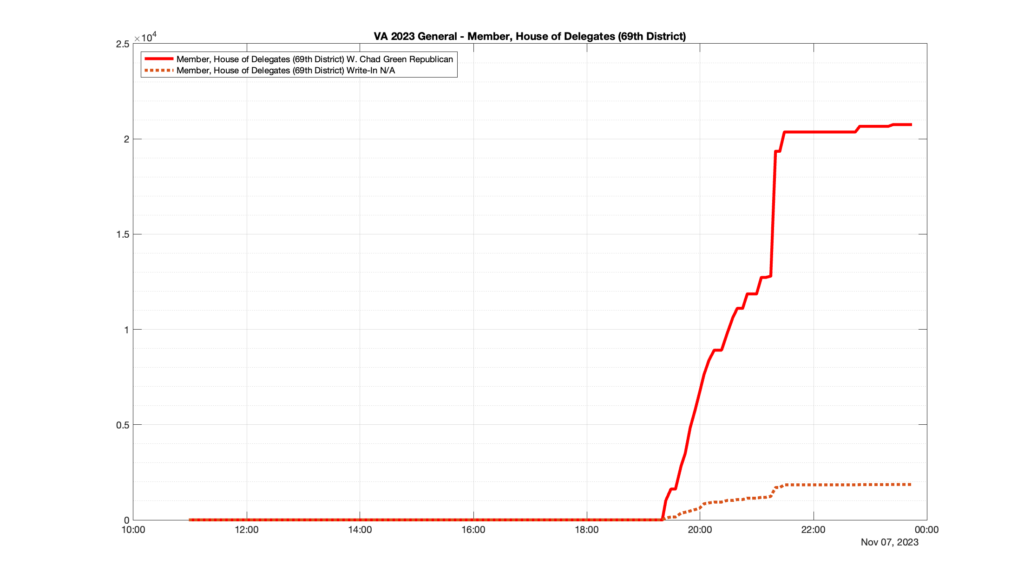
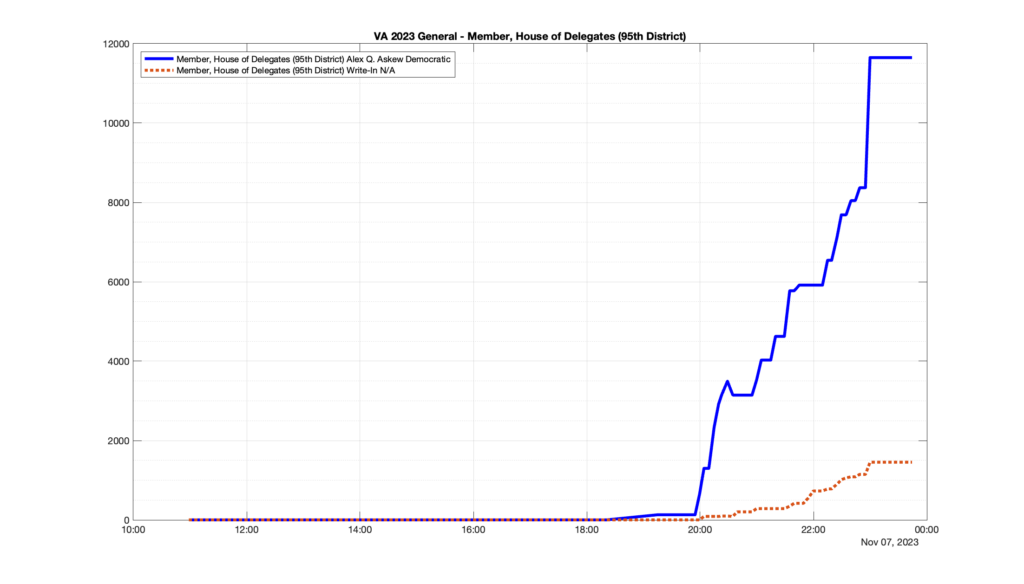
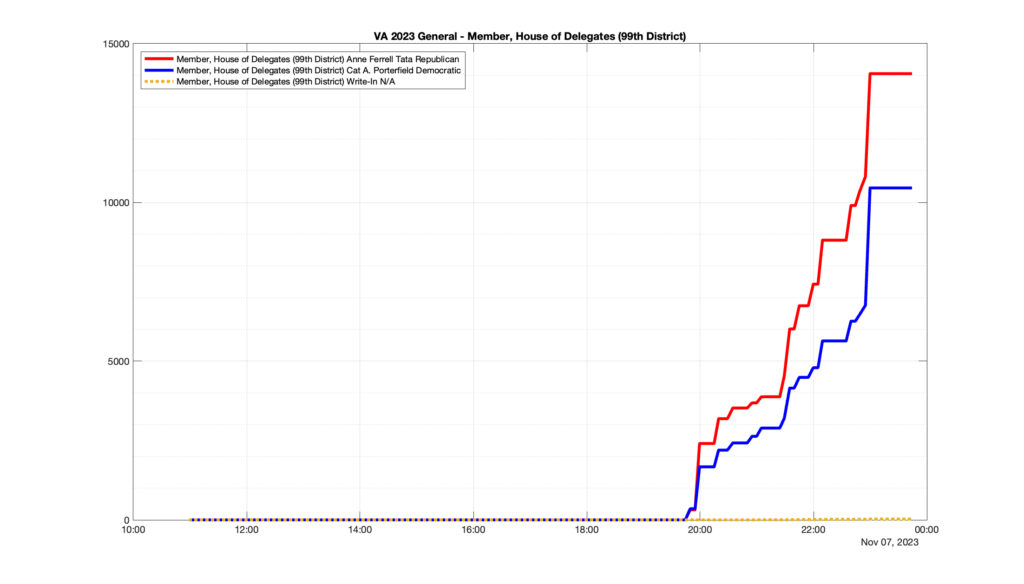
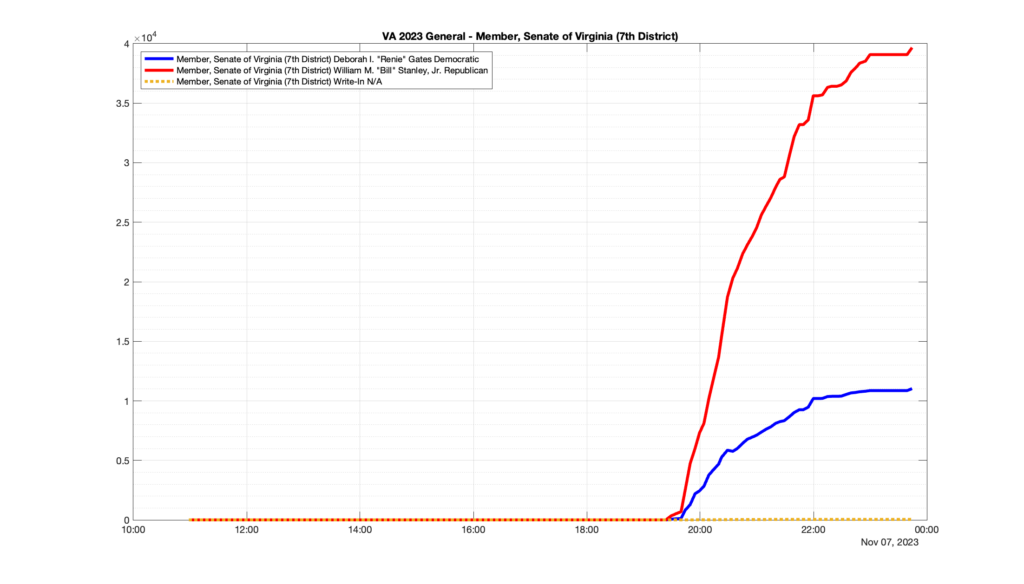
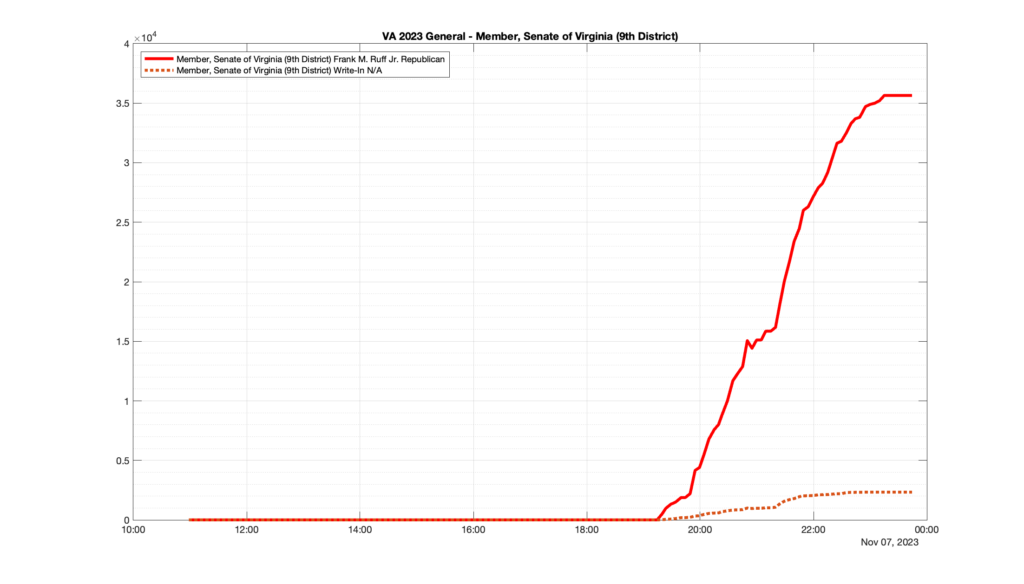
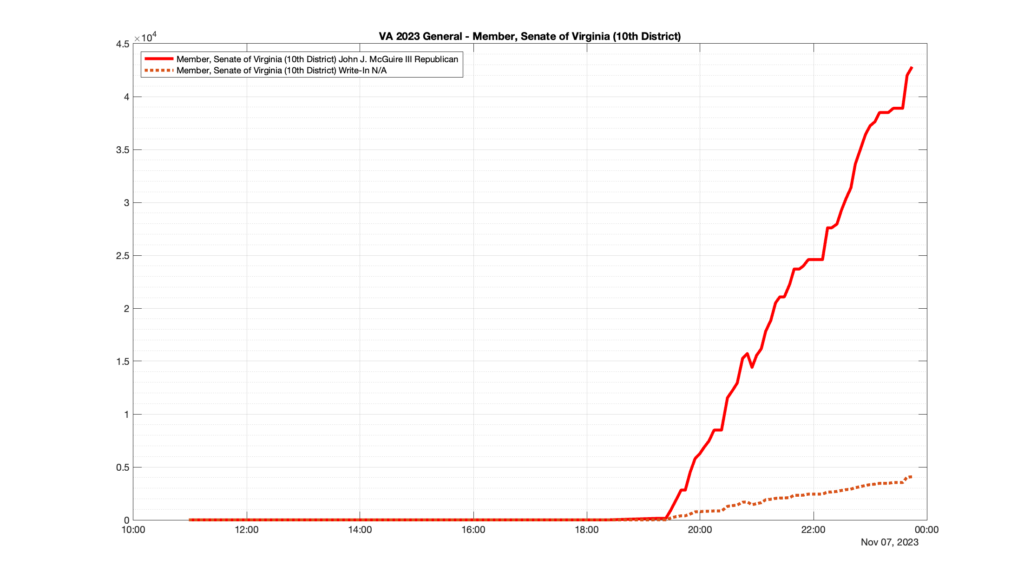
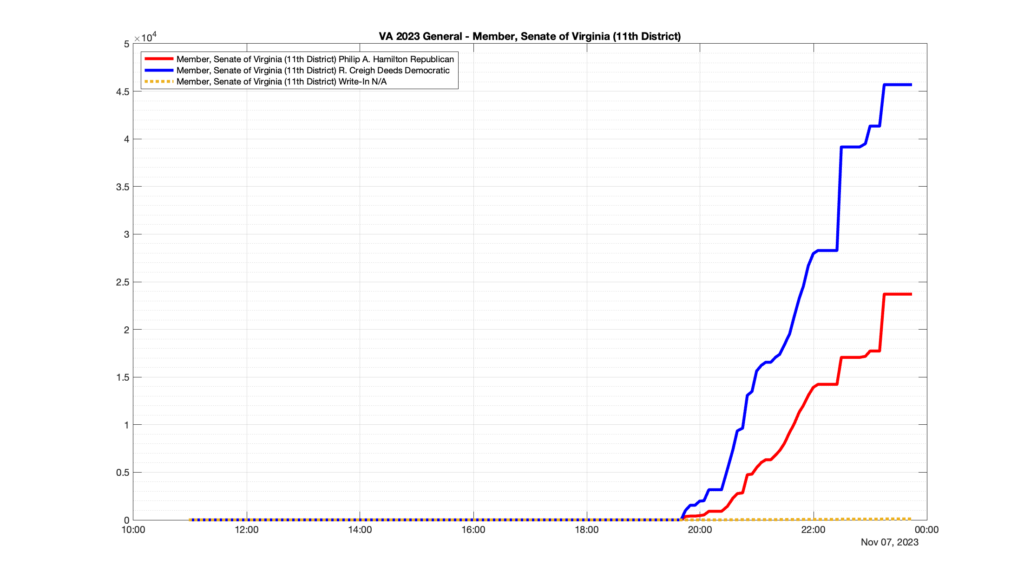
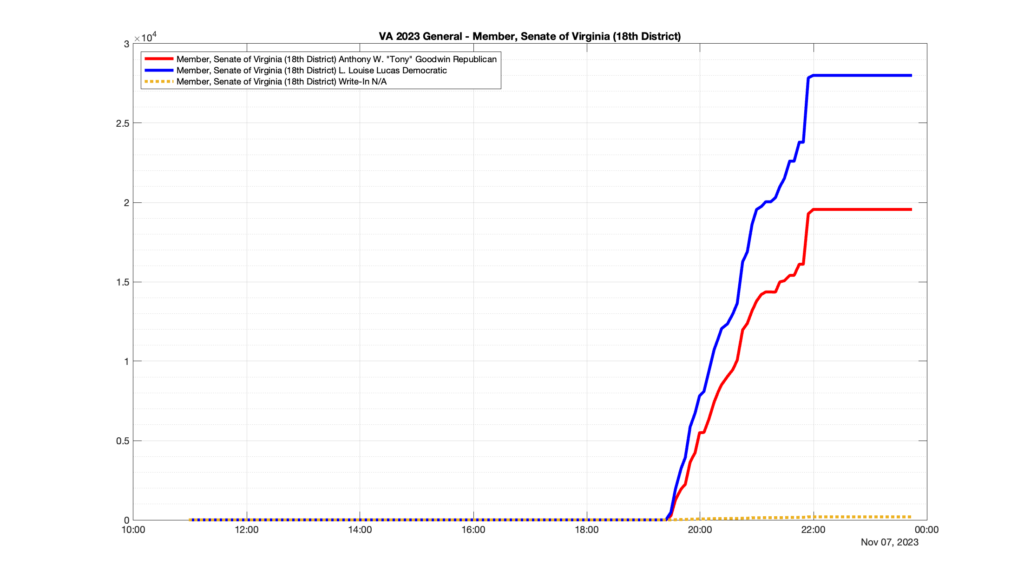
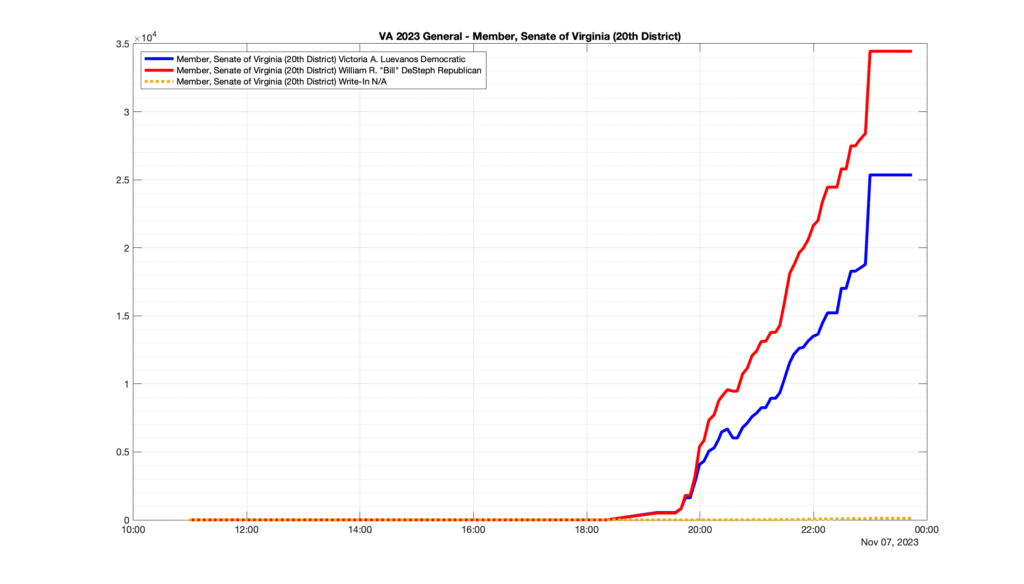
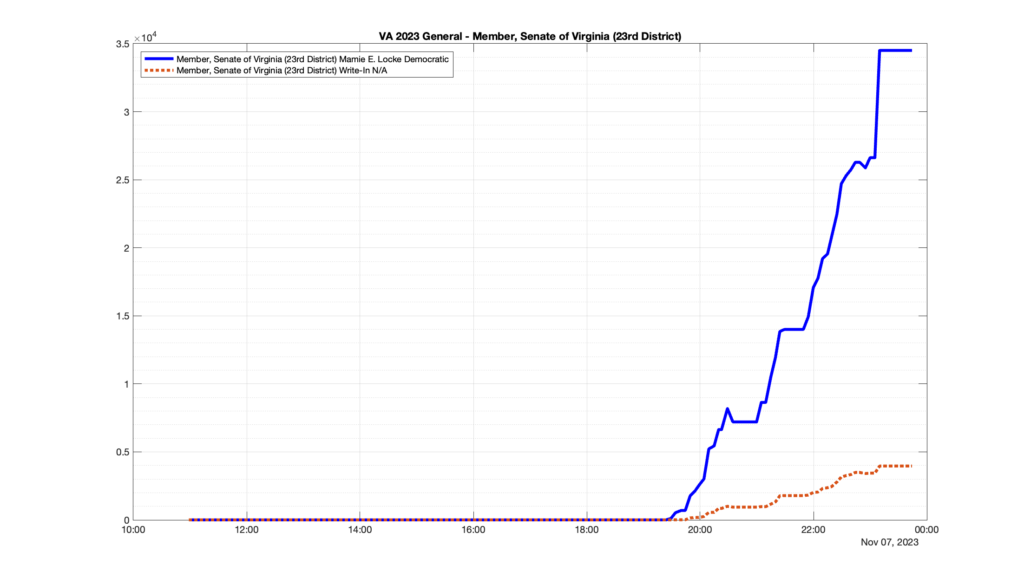
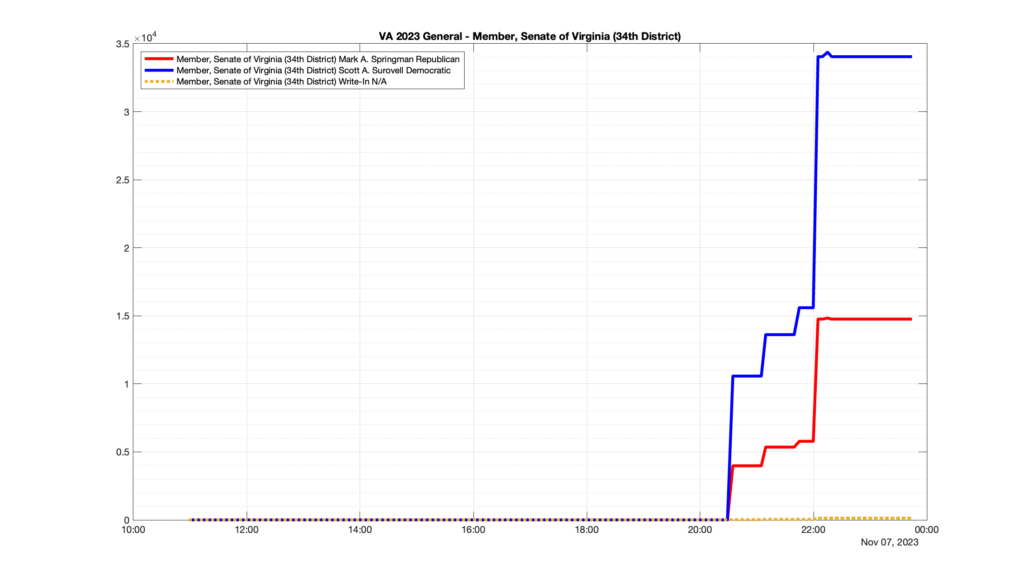
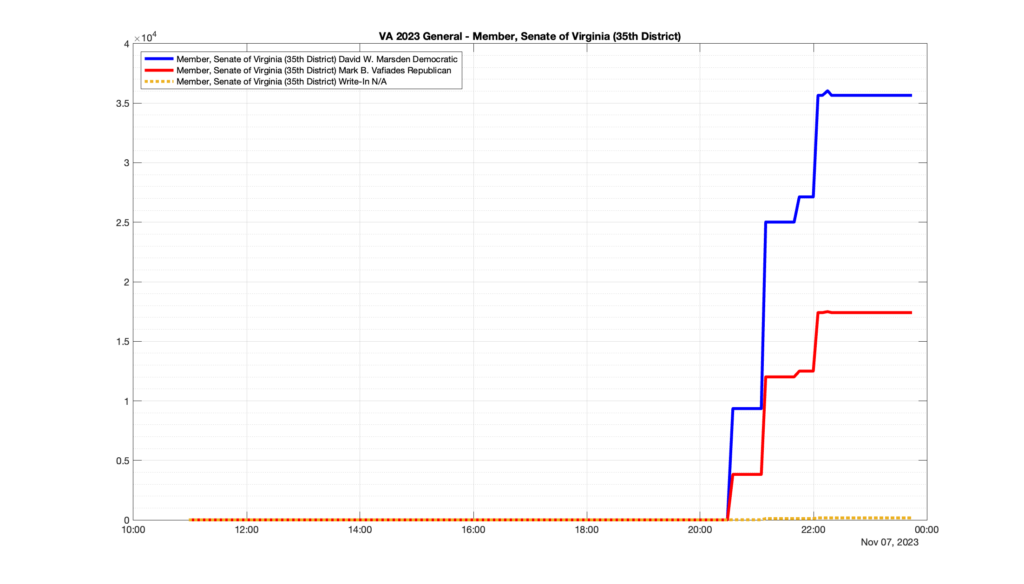
This is not the only race where I found ballot curves that have a decrease in one of the ballot count after a data update. (The gallery is posted below.) Of the 183 races I looked at so far, 79 had a ballot trace that had its count total reduced after a data update. (I haven’t looked at all of the races yet.)

Now, one expects there to be some issues and corrections that have to be made to the election night reporting data. But when 43% of the races sampled have obvious data quality issues like this … I think that deserves some explanation.

So … can ELECT please address this:

  • Why do 79 (and counting) races (~43% of races sampled) in the VA election night reporting have obvious issues where the vote totals decreased after a data reporting update?
  • What was the cause?
  • Why was it not caught by your QA/QC procedures?
  • How will you be addressing it going forward?
Categories
Election Data Analysis Election Integrity Uncategorized

VA Daily Absentee List

The EPEC staff monitors the Virginia Daily Absentee List for unexpected values. We essentially “audit” the electoral process in Virginia during an election cycle. We are currently monitoring the 2022 General Election.

One of the areas of interest is the DAL – Daily Absentee List. It shows the current status of absentee voting in Virginia – by mail in ballot and early voting (absentee in person).

In Virginia, Absentee In-Person Early Voting started on Friday, September 23. Our initial DAL file was saved on Saturday, September 24, at 9 PM.

The official Ballot Status in the DAL at 9 PM was:

Issued: 290,095

Federal Worker Absentee Ballot (FWAB) 1

Marked: 2,118

On Machine: 8,397

Not Issued: 5,766

Unmarked: 546

Pre-Processed: 1

Deleted: 13,015

Grand Total: 319,939

Nearly 19,327 ballots – 6 % of those requested, were in a state which would not be counted if the election vote counting period were over today – Not Issued, Unmarked, or Deleted. There was also 1 ballot in a Pre-Processed Ballot Status state. The magnitude of ballots in one of these “states” is surprising but not alarming.

It appears Not Issued means there is either a backlog in mailing out ballots or an issue with voter registration – legal name, address of record in the registration database, citizenship, etc. Unless the backlog or issue is resolved, the voter will be denied a ballot.

Unmarked is associated with mail-in Absentee Ballots. A Marked ballot is moved to an Unmarked status if an election official notices an error with the associated absentee ballot documents such as a name or address error, missing signature, or missing signature verification. Election officers are required to contact voters if their ballot requires a cure – correction to the information accompanying the ballot. If the cure is not provided, the ballot will not be counted. Some voters choose to have a new ballot mailed to them if a cure is required, in which case a ballot in the Unmarked state will be spoiled and marked Deleted in the system. This is one of the reasons we see voters having one or more Deleted ballots associated with them in the DAL files.

Deleted ballots are not supposed to be processed (counted). We believe these are officially referred to as “spoiled ballots. The process to keep these separate from countable ballots is an interest area for election integrity observers. The most common reason for ballots to get Deleted (spoiled) is voter error. Examples: mistake when filling out a ballot in person resulting in the first ballot being spoiled and a new ballot issued, or a voter surrendering an absentee ballot to vote in person or receive a new one via the mail.

More accurate voter registration records MAY reduce the volume of initial Not Issued and Deleted ballots. Our post-election observations and recommendations will address this issue. Our initial hypothesis – changes in residency, relocation within Localities, ineligible voters requesting ballots, and voters passing away probably account for most of the unexpectedly large values of ballots in an “at risk” state.

Categories
Uncategorized

Multiple Active Ballots

Individual voters should NEVER have more than one (1) active ballot. If this occurs, there is a risk that human error by an election official will result in a voter having more than one ballot counted.

Virginia has 226 individuals with two or more active ballots according to the Daily Absentee List file as of 28 October, 6 AM. This is occurring in nearly half of the Localities in Virginia – 59 out of 133.

This is a process issue – either procedural, or ballot tracking. The process should make it impossible for more than one vote to be counted.

It is possible that these will be caught before they get counted … but mistakes are made when people get overloaded or distracted. Process software should prevent the possibility of this “defect” occurring to prevent the perception of malfeasance.

Categories
Election Data Analysis Uncategorized

VA “Provisional” Ballots

The number of ballots in “Provisional” status is growing. This is to be expected because Virginia began allowing “same day voter registration” on 1 October, and same-day votes are to be labeled Provisional.

A handful of ballots were Provisional status prior to 1 October, and this ought to be explained. The steady increase of Provisional ballots started on 19 October. The count of Provisional ballots is currently growing by approximately 200 ballots each day. This number is expected to grow exponentially as we approach election day.

The root cause of the Provisional ballot increase is most likely “same day registration and voting” but a detailed study has not yet been performed.

Categories
Uncategorized

Variances Observed in TX Early Vote Data

Recently I’ve started downloading all of the data from the TX secretary of state website multiple times per day. Each time I download the data I grab new versions of files representing how many Mail-In or In-Person votes have happened since mail-in votes have started to be accepted, according to the TX SOS. Note that this TX Early Voting return data, which is required by law to be publicly posted daily, is supposed to reflect the number of voted ballots (either In-Person or Mail-In) per the previous days in the ongoing election and serves as the official public record of these ballot transactions.

The TX SOS does site not post the cumulative results, but instead has individual links by day that show the totals of each category of voted ballot. I have downloaded copies all of this data over multiple days.

Now you would think, that if the TX SOS data was trustworthy and accurate, that I shouldn’t see differences in the historical data on the TX SOS site day to day. I should see new data as a newly available download, but the data associated with previous days results should stay the same.

… except it doesn’t.

In the gallery below are 3 separate graphs of the data pulled from the TX SOS site. Each pull of the data grabbed the entire history of the data.

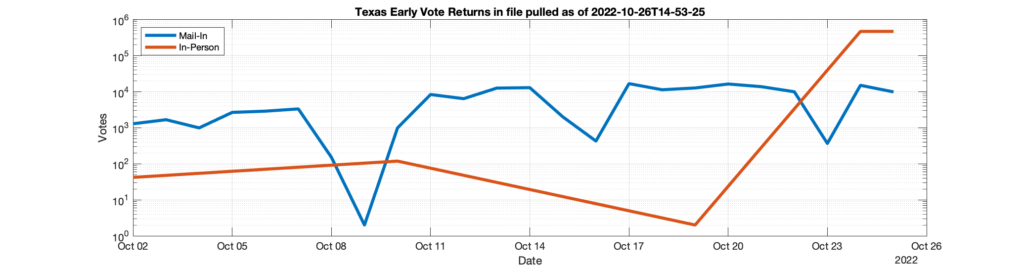
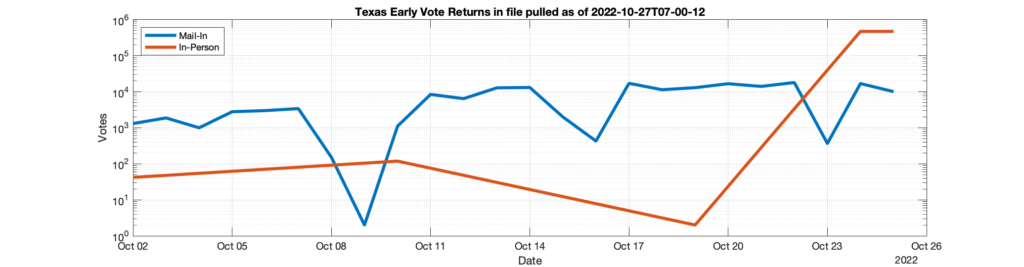
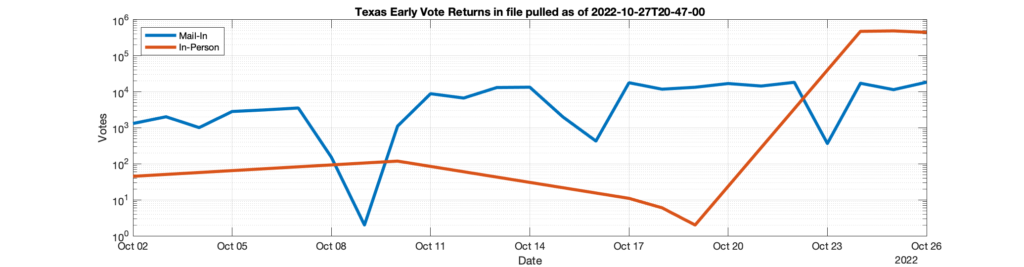
If you play the images in sequence you will notice that between the 1st (captured on 10/26 @ ~3pm) and second image (captured 10/27 @ ~7am) there are a few thousand ballots that suddenly appear in the Mail-In ballot trace attributed to 10/22. Between the second and third image (captured 10/27 @ ~9PM) you will see that there are a handful (~10) of ballots that get retrospectively added to the In-Person ballot totals attributed to 10/17 and 10/18.

What is the explanation for these additions?

I’m happy to supply the raw downloaded and timestamped files to anyone who is interested. Feel free to contact me and I will send the latest zip files and source code used to download.

Categories
Uncategorized

2022 General Election GA Daily Absentee Report Statistics

Similar to the statistics that I have been computing for the VA Daily Absentee List (DAL), I have also been collecting the daily early voting reports from the GA secretary of states website. These are also a set of cumulative files that track the status of early and absentee ballots.

I’m using the same set of processing techniques on the GA data as I am doing with the VA datafiles, save for some slight tweaks due to differences in the datasets. (1) GA doesn’t have the ‘Marked’ or ‘Pre-Processed’ distinction in how they track their mail in ballots like VA does, those records are all simply labeled as ‘Mail-In’. (2) GA has an ‘Electronic’ category for ballots, which I’m assuming is the equivalent of the ‘FWAB’ category in VA.

There are two plots below representing the same data, one plot with a linear y-axis and the other with a logarithmic y-axis. The x-axis is the date that each DAL file processed was archived and pulled from the Dept of Elections servers. Solid traces are directly extracted data from the DAL files. Dashed traces are computed metrics such as the number of “vanished” voters detected. Red datapoints are placed on traces that exhibit questionable behavior, for example if the number of “approved” and “countable” ballots ever decreases, etc. Vertical dotted lines indicate important dates.

All of the latest plots for every locality and precinct as well as the corresponding underlying CSV data files will be updated daily, and you can download them here.

The semilog versions of the plots for all localities or precincts that appear in the DAL data per locality are shown in the gallery below. The image carousel below might take a moment to load, btw.

Categories
Uncategorized

Difference in number of duplicated records in the VA RVL from 2021-2022

Since I know there have been a number of registrars and volunteers around the state that have been working to try and improve the maintenance of the VA voters rolls, I thought people would be interested in some summary results that I can now compute. While there is still plenty of work to be done, we have at least made some progress.

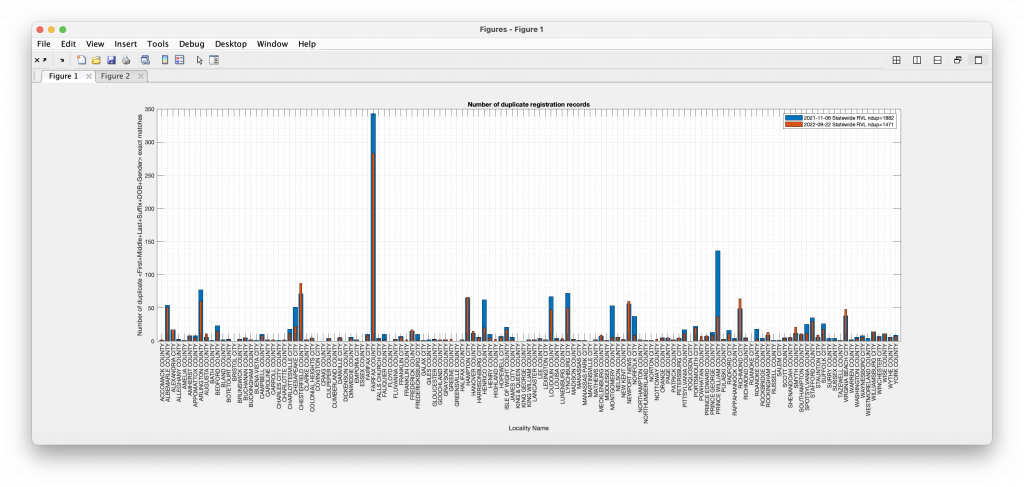
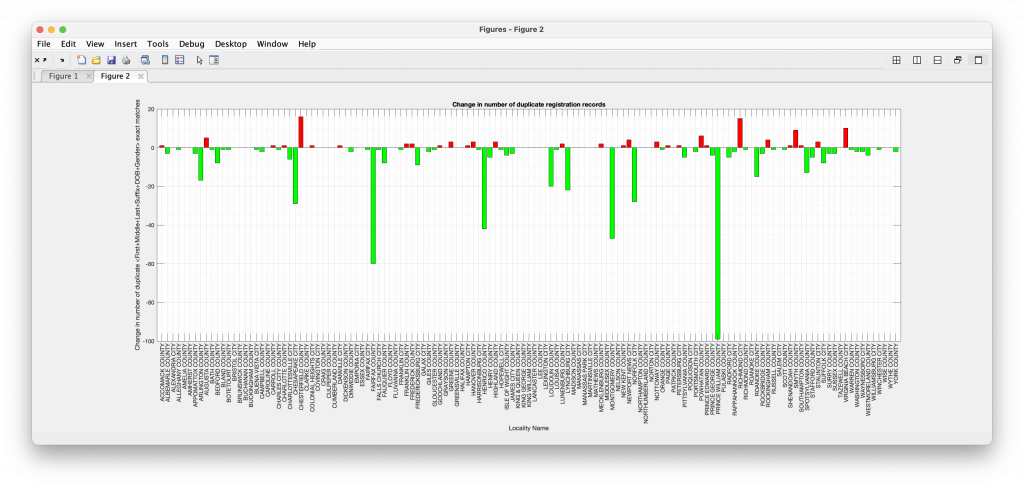
Below you will find the graph of the number of detected duplicate records in the statewide VA Registered Voter Lists as pulled on 2021-11-06 and 2022-09-22. The duplicate detection is based on an exact match of the join of (First Name + Middle Name + Last Name + Suffix + DOB + Gender) fields.

The total number of duplicate records detected in the 2021-11-06 RVL was 1882, and the total number of duplicate records in the 2022-09-22 RVL was 1471. Thats a 21% reduction in the number of duplicated voter records!

Interestingly enough, many of the duplicates actually cross over between multiple localities, so it is possible that many of these duplicated records are people that legitimately moved, but for some reason were given a new voter ID in the new locality and the old locality never removed their record. (A persons voter ID is supposed to be unique to them and ‘follow’ them throughout moves, etc.)

Any registrars who are interested in reviewing the specific records identified, please feel free to contact us.

Categories
Election Data Analysis Election Forensics Election Integrity Interesting programming technical Uncategorized

Vanishing Voter ID’s in sequential 2021 DAL files

During the 2021 election I archived multiple versions of the Statewide Daily Absentee List (DAL) files as produced by the VA Department of Elections (ELECT). As the name implies, the DAL files are a daily produced official product from ELECT that accumulates data representing the state of absentee votes over the course of the election. i.e. The data that exists in a DAL file produced on Tuesday morning should be contained in the DAL file produced on the following Wednesday along with any new entries from the events of Tuesday, etc.

Therefore, it is expected that once a Voter ID number is listed in the DAL file during an election period, subsequent DAL files *should* include a record associated with that voter ID. The status of that voter and the absentee ballot might change, but the records of the transactions during the election should still be present. I have confirmed that this is the expected behavior via discussions with multiple former and previous VA election officials.

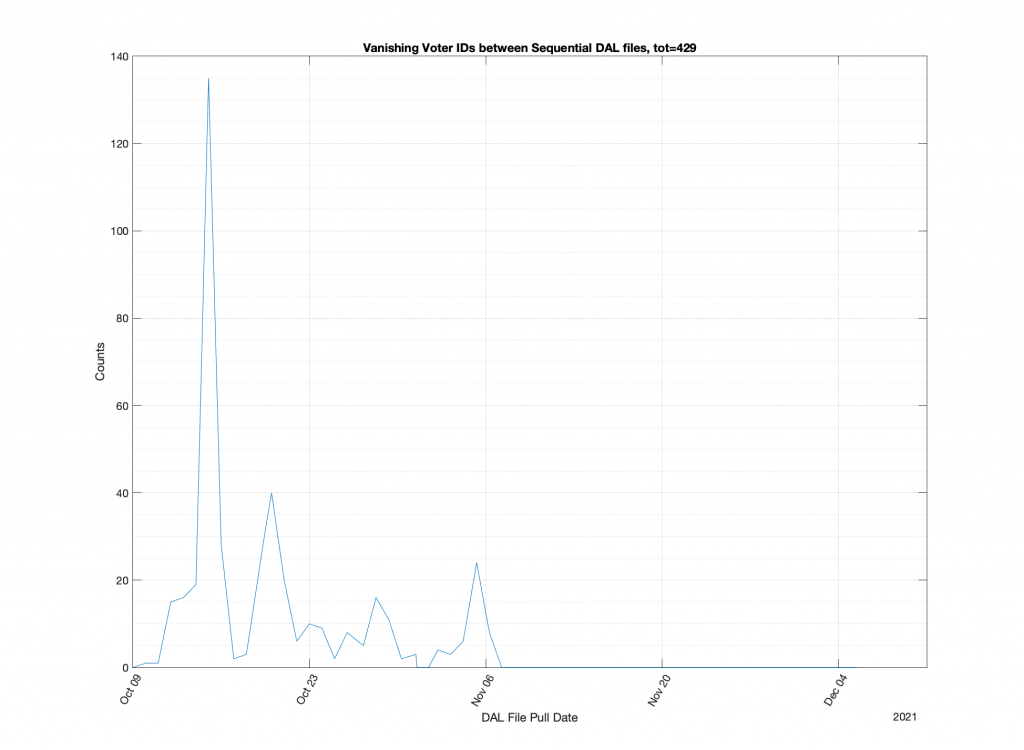
Stepping through the snapshots of collected 2021 DAL files in chronological order, we can observe Voter IDs that mysteriously “vanish” from the DAL record. We can do this by simply mapping the existence/non-existence of unique Voter ID numbers in each file. The plot below in Figure 1 is the counts of the number of observed “vanishing” ID numbers as we move from file to file. The total number of vanishing ID numbers is 429 over the course of the 2021 election. Not a large number. But it’s 429 too many. I can think of no legitimate reason that this should occur.

Now an interesting thing to do, is to look at a few examples of how these issues manifest themselves in the data. Note that I’m hiding the personally identifiable information from the DAL file records in the screenshots below, BTW.

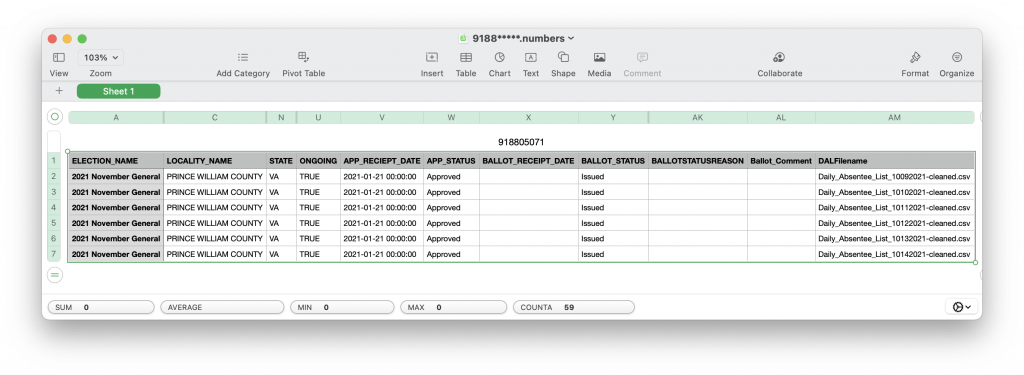
The first example in the screenshot below is an issue where the voter in question has a ballot that is in the “APPROVED” and “ISSUED” state, meaning that they have submitted a request for a ballot and that the ballot has been sent out. The record for this voter ID is present in the DAL file up until Oct 14th 2021, after which it completely vanishes from the DAL records. This voter ID is also not present in the RVL or VHL downloaded from the state on 11/06/2021.

This voter was apparently issued a real, live, ballot for 2021 and then was subsequently removed from the DAL and (presumably) the voter rolls + VERIS on or around the 14th Oct according to the DAL snapshots.  What happened to that ballot? What happened to the record of that ballot? The only public record of that ballot even existing, let alone the fact that it was physically issued and mailed out, was erased when the Voter ID was removed from DAL/RVL/VHL records.  Again, this removal happened in the middle of an election where that particular voter had already been issued a live ballot!

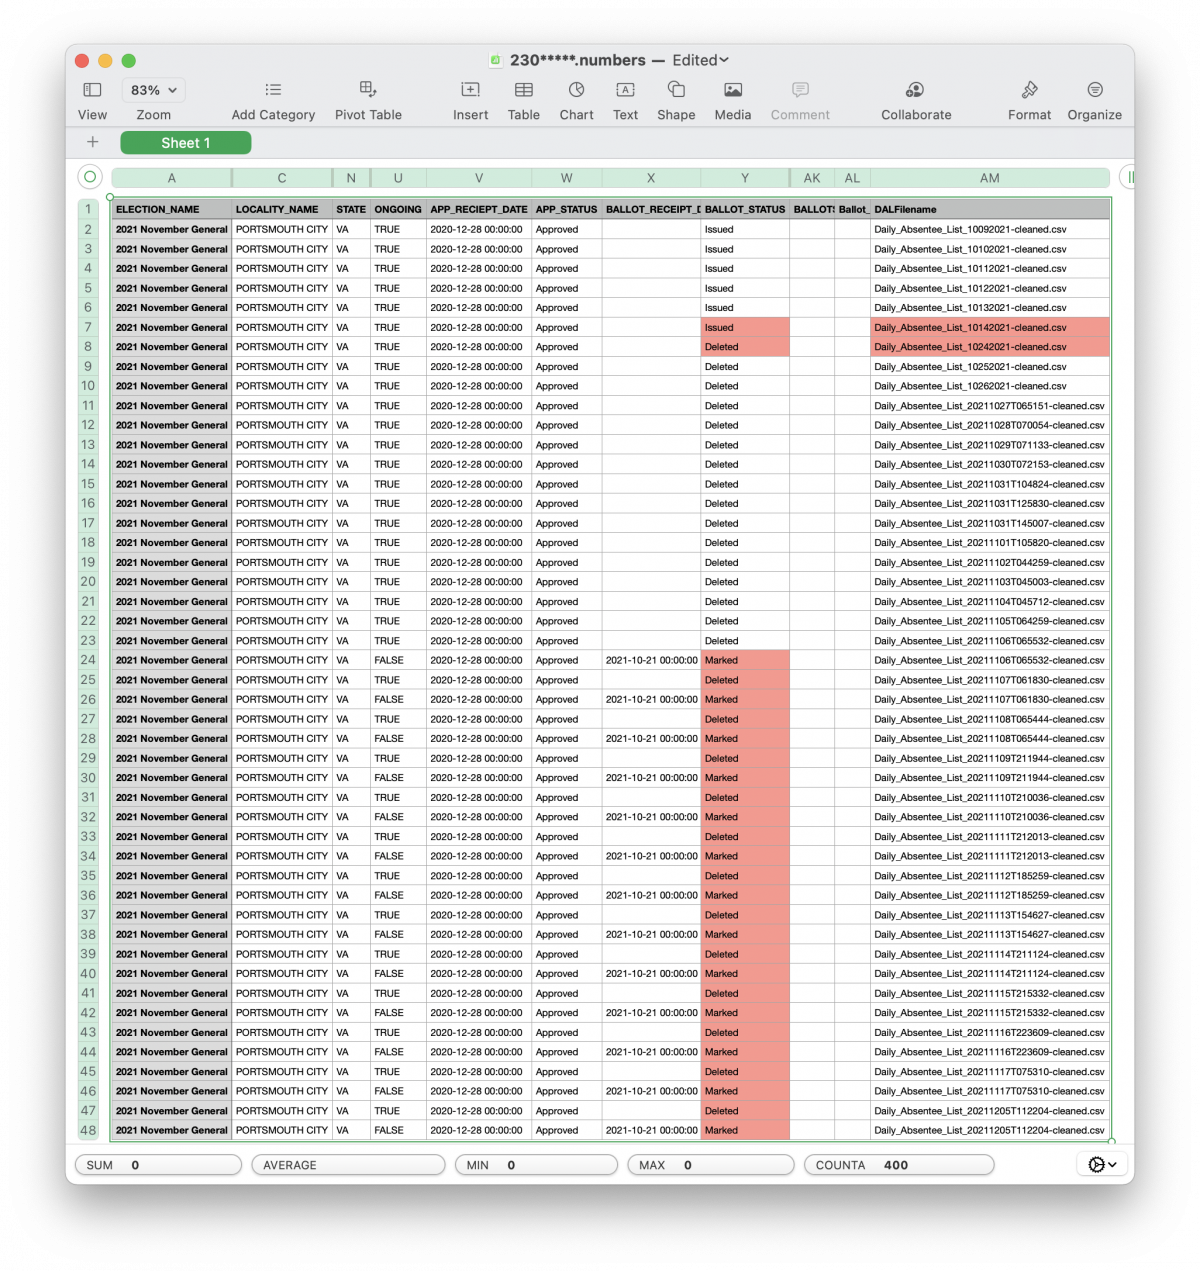
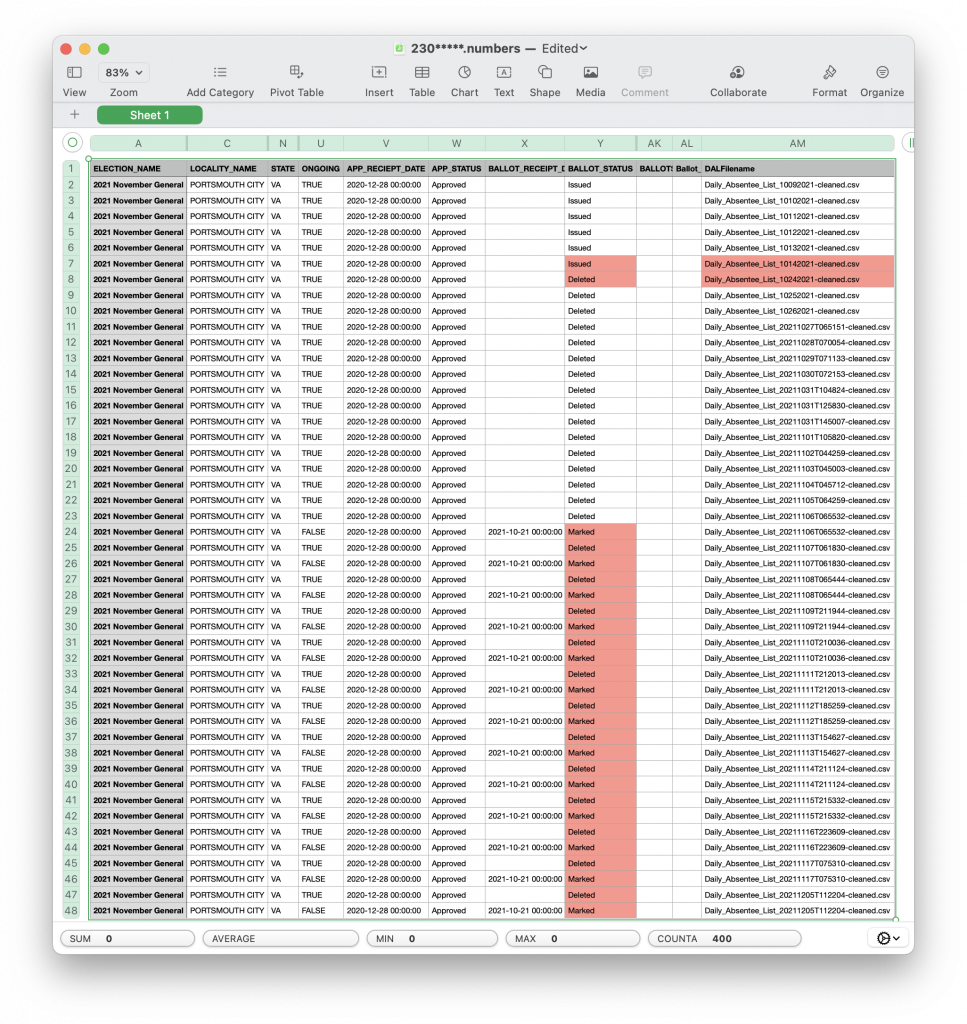
A few of these IDs actually “reappear” in the DAL records.  ID “230*****” is one example, and a screenshot of its chronological record is below.  The ballot shows as being ISSUED until Oct 14th 2021.  It then disappears from the DAL record completely until the data pull on Oct 24th, where it shows up again as DELETED.  This status is maintained until Nov 6th 2021 when it starts oscillating between “Marked” and “deleted” until it finally lands on “Marked” in the Dec 5 DAL file pull.  The entire time the Application status is in the “Approved” state for this voter ID.  From my discussions with registrars and election officials the “Marked” designation signifies that a ballot has been received by the registrar for that voter and is slated to be tabulated.

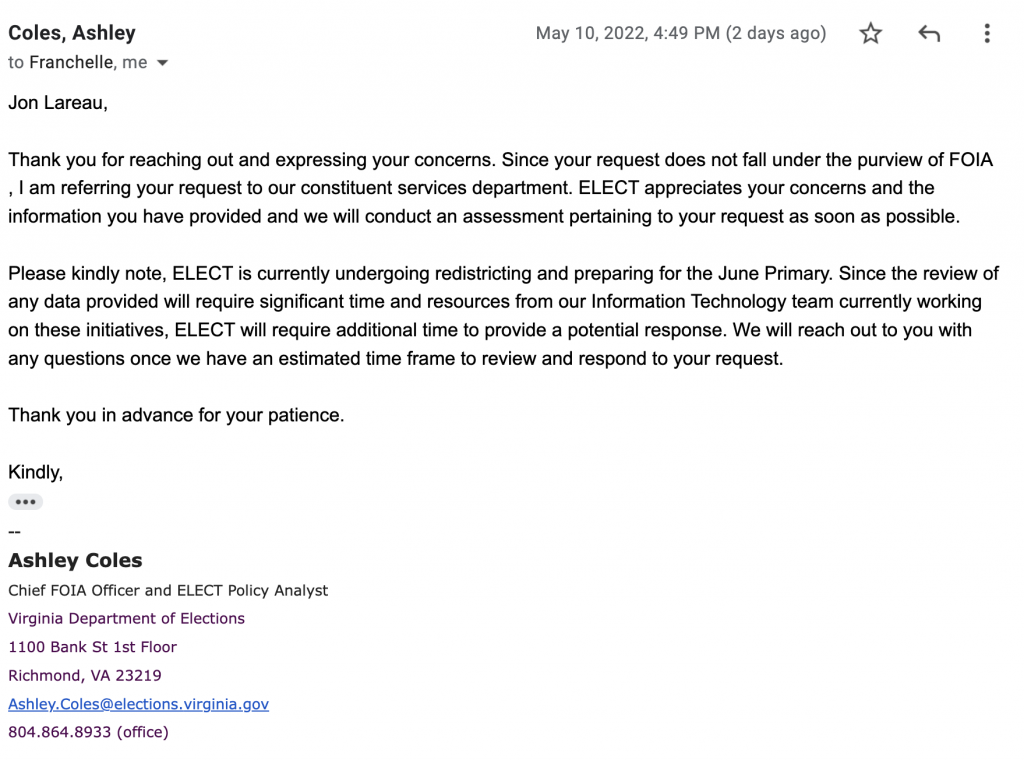
I have poked ELECT on twitter (@wwrkds) on this matter to try and get an official response, and submitted questions on this matter to Ashley Coles at ELECT, per the advice of my local board of elections chair. Her response to me is below:

I will update this post as information changes.

Categories
Election Data Analysis Election Forensics Election Integrity programming technical Uncategorized

VA 2020 and 2021 Machine Tapes Compared to Official Results for a single VA County

(Updates in red text as of 01-27-2022)

Walt Lantham, the registrar of York county (yes … it’s York County … don’t worry … I asked Walt if he was ok with me identifying him and the locality publicly before making this update) generously reached out and contacted me to try and clear up some of the original numbers I posted below. We had a long and detailed couple of phone calls (over two hours in total) and went over all over these results in detail. It turns out that I was missing the hand counted ballot tally sheets from the data that I had received. This cleared up most of the technical issues with the 2021 data and all but 1 issue with the data below for 2020. The remaining issue is the discrepancy with the official State CSV files, which is outside of Walt’s ability to diagnose. Our discussion also brought up some of the interesting procedural issues and challenges related to data reporting, retention, maintenance and general practices as well. I’ll touch on that in a bit. It was a great conversation and a big thank you to Walt and his staff for taking the time to address these issues in detail.

Special thanks again to the grassroots folks in VFA, and throughout the state, for all their hard work in collecting the machine tape information for various localities. There were a few localities that provided not only the 2021 machine tapes, but the 2020 versions as well! The first one of those that I have compiled all the data for is reported below. As with all of my results, I invite those that wish to replicate, validate or refute to contact me and I will happily provide the necessary details and data files.

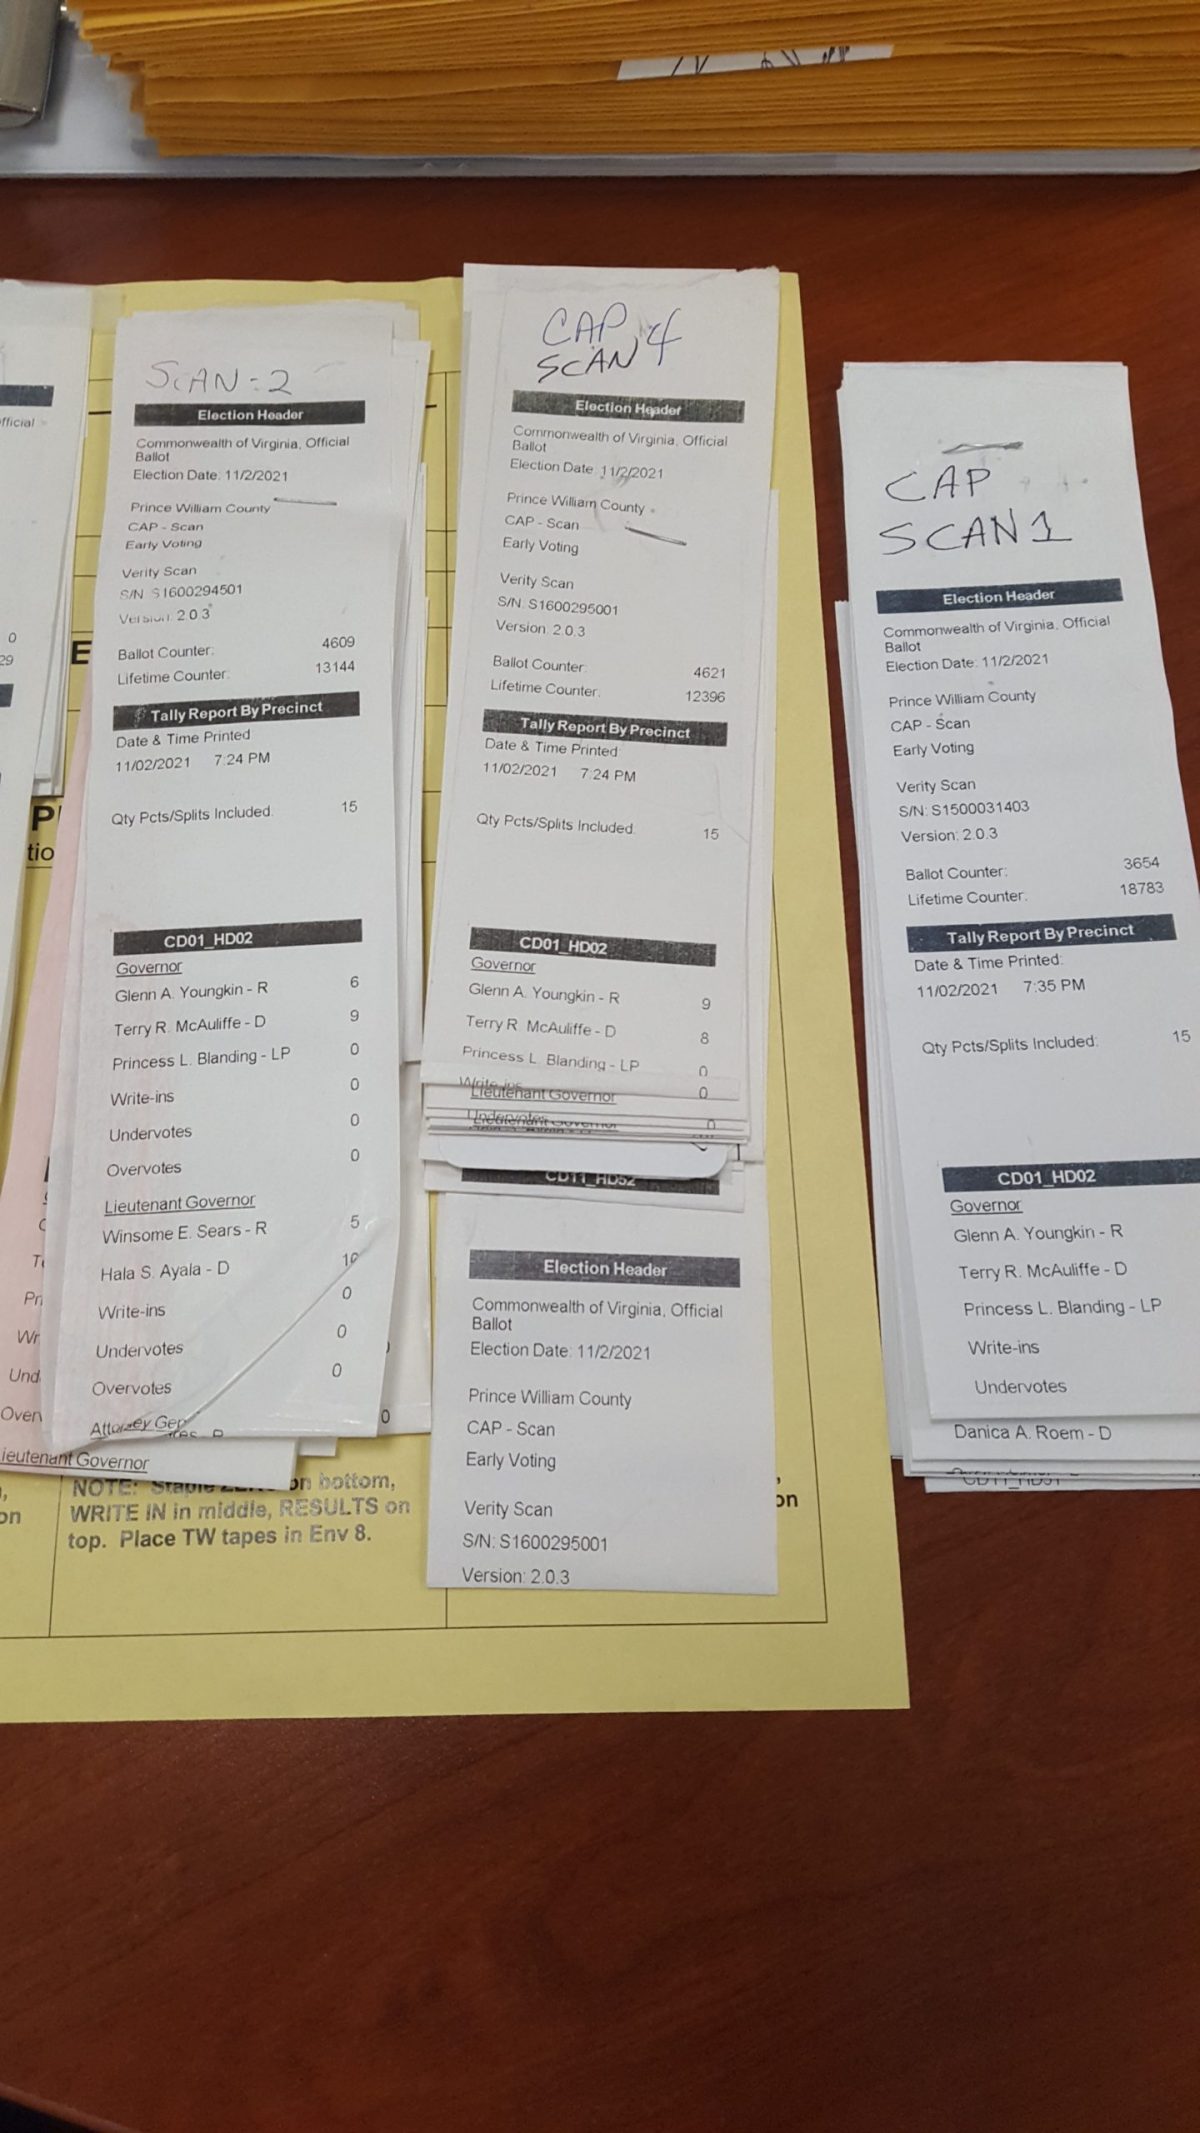
I believe we have some significant issues with our elections in VA. The data below helps clearly make that case, in conjunction with the multiple other data analyses that I’ve done and posted here on my blog. The data below is only from a single locality in the state (I am working on others). I am purposefully summarizing the data and abstracting which locality this represents, as I do not want to jeopardize any potential legal proceedings or official investigations. But I do feel strongly that the “fact of” this information needs to be made public and become part of the discussion on the matter. (And … just to be clear … the background image for this blog post is the tapes from a different locality in 2021 only, which I discussed here)

I’ll note that the machine tapes and Statements of Results (SORs) are the “gold standard” to measure the published election results against in VA. Once a vote is cast on a machine, there is no process for it to be removed from the official vote count. Each ballot category is supposed to be scanned into a set of dedicated machines. Provisional ballots have their own dedicated machines that they get scanned into. Mail-In ballots have their own dedicated machines. Early In-Person ballots get their own machines, as do the In-Person Early and Day-Of ballots.

Ballots that cannot be scanned for some reason must be hand counted. This hand counting and verification is performed at the post-election canvass. In my discussion with Walt, we noted the fact that there is no requirement for the hand-count tally worksheets used during the canvass to be included in the statement of results reports that are available for the public to view. There is also no mechanism for the state to track or delineate the numbers of hand-counted ballots, or way for voters to know the various reasons why ballots needed to be hand counted in the first place. But luckily for me … Walt keeps good notes and records, and e-mailed me a copy of the Tally sheets that he preserved from the canvass for my records and to fill in the data gaps.

There should be zero difference from the sum of these reports (including the hand counts) to the reported official results, save for very very very small and rare documented errors and issues. Maaaaaybe 1 or 2 differences here and there, but nowhere near the results presented below when compared to the State CSV files. I have talked to multiple elections officers, public officials, registrars and lawyers and ALL of them have agreed with this sentiment.

Input Data:

The official results are supplied by the VA Dept. of Elections (ELECT) website in a csv file for 2020 (here) and 2021 (here). Additional versions of the official results are reported through a web portal to the ELECT historical archive for 2020 (here). Turnout numbers are supplied similarly from csv files on the ELECT servers for 2020 (here) and 2021 (here). Note that the official CSV and WEB tally results for 2020 show significant differences, yet both are supposed to reflect the “official” results. That, on its own, is a significant issue that warrants further inspection. I’ve computed the deviations between both data sets for this locality, so it’s dealers choice as to which dataset you want to compare against. For 2021 the CSV results are the only ones available.

SOR and machine tape information was obtained by volunteers across the state going to their local registrar or county clerks office. For some counties complete datasets of both 2021 and 2020 election results were obtained, with hand transcriptions of tape returns as well as photographic copies of the originals. The results reported below are for a moderately sized York County and were derived from both hand transcribed results and photographic copy of the machine tapes for both 2020 and 2021. The Statement of Results (SOR) reports and change logs from the county do not document any issues that would account for the discrepancies below. There were no issues presented at the canvass (where the tapes and SOR’s are checked against the state database entries for errors) that would explain the results below that I am aware of. As noted above per my discussions with Walt, and with him providing the copies of the hand-count tally worksheets, we were able to address most of the discrepancies that I came across except for the discrepancy of the 2020 data with the CSV version of the official results posted by VA ELECT. In fact, Walt’s corrections made the discrepancy with the CSV results slightly worse, even though they fixed the discrepancies with the WEB based portal results.

Results:

The tables below show the computed differences of the VA Dept of Elections data minus the collected machine tape results, stratified by major candidate party. The 2020 results are for office of president, the 2021 results for Governors race. The 2021 and 2020 Web results were strictly positive differences, so there is no distinction between the Sum of the differences (the NET change) and the Sum of the Absolute Value of the differences (how many votes were affected). Whereas, the 2020 CSV results had some negative differences, so there are two different ways to compute the effects of these deviations.

The 2021 Governor’s race showed a smaller amount of % deviation from the machine tapes than the 2020 Presidential race for this locality, but still show non-zero differences. (Remember, there should be zero difference.)

It is notable to mention that in 2021 the reporting was changed such that absentee mail-in and early-vote totals are separated in the reported data. The 2021 In-Person Day-Of results were identical to the reported results presented by the VA Department of Elections, with the In-Person Early vote only showing a single vote discrepancy. Almost all of the differences are manifested in the Mail-In or Provisional ballots for the 2021 data.

Likewise for 2020 there is very little difference (a single vote again) in the In-Person Day-Of precinct totals from the reported results. Almost all of the differences can be attributed to Central Absentee Precinct (CAP) data when compared against the state’s official CSV report.

2021 Results

YearPRECINCTVDOE-TAPE difference for Democratic candidateVDOE-TAPE difference for Libertarian candidateVDOE-TAPE difference for Republican candidate
2021Total Differences Provisional22 0018 0
2021Total Differences AB – Central Absentee Precinct25 009 0
2021Total Differences EV – Central Absentee Precinct001
2021Total Differences PE – Central Absentee Precinct1 002 0
2021Total Differences Day-Of Precincts000
Total Differences48 0030 1
Machine Tape Totals12142 1219015017455 17484
% of Machine Tape Totals48/12142*100 = 0.40%
0/12190*100 = 0.00%
0/150*100 = 0.00%30/17455*100 = 0.17%
1/17484*100 = 0.006%
Differences of 2021 Tape Counts from Official Results (CSV)

2020 Results (ELECT Web Portal Archive)

YearPRECINCTVDOE-TAPE difference for Democratic candidateVDOE-TAPE difference for Libertarian candidateVDOE-TAPE difference for Republican candidate
2020Total Differences AB – Central Absentee Precinct234 010 112 0
2020Total Differences Provisional2 001 0
2020Total Differences Day-Of Precincts001
Total Differences236 010 0114 1

Machine Tape Totals17447 17683670 68020027 20240

% of Machine Tape Totals236/17447*100 = 1.35%
0/17447*100 = 0.00%
10/670*100 = 1.49%
0/670*100 = 0.00%
114/20027*100 = 0.57%
1/20027*100 = 0.005%
Differences of 2020 Tape Counts from Official Results (WEB)

2020 Results (ELECT CSV Report)

YearPRECINCTVDOE-TAPE difference for Democratic candidateVDOE-TAPE difference for Libertarian candidateVDOE-TAPE difference for Republican candidate
2020Total Differences AB – Central Absentee Precinct77 157-1 1111 101
2020Total Differences Provisional-114 116-1 1-52 53
2020Total Differences Day-Of Precincts001
Total Differences-37 2732 1264 155

Machine Tape Totals17447 17683670 68020027 20240

% of Machine Tape Total-37/17447*100 = -0.21%
273/17683*100 = 1.54%
-2/670*100 = -0.30%
12/680*100 = 1.80%
64/20027*100 = 0.32%
155/20240*100 = 0.77%
Abs Val Total Differences191 2732 12164 155
Abs Val % of Machine Tape Totals191/17447*100 = 1.09%
273/17683*100 = 1.54%
2/670*100 = 0.30%
12/680*100 = 1.80%
164/20027*100 = 0.82%
155/20240*100 = 0.77%
Differences of 2020 Tape Counts from Official Results (CSV)