After getting a pointer to the higher fidelity per-ward WI data and redoing that analysis (here), which was not only able to produce the election fingerprints but also a statistical model for each county that could identify statistically outlying wards for further scrutiny, I wanted to go back to the VA data and see if I could update that analysis to do the same thing. There is a problem with the VA data, however, as VA uses “virtual” absentee and provisional ballot counting precincts and collects all absentee and provisional ballots at the county congressional district level. That means that there is no direct mapping for the absentee or provisional ballots back to the precincts that they came from in the data published by the Virginia Department of Elections. What I really need to have is all of the votes (in person, absentee, provisional) accounted for at the per precinct level.
In theory, if the reported totals from VA DoE are accurate and truly represent the sum of what occurred at the precinct level, such a mapping should be trivial to produce with standard optimization methods. That doesn’t mean that such a produced mapping would be necessarily accurate to specific real precinct vote tallies, just that mathematically there should be at least one, if not many, possible such mappings of vote shares at the precinct level that sum to the results presented by VA DoE and obey all of the constraints due to voter turnout, reported absentee registrations and returned ballots, etc. One of those possible mappings should also correctly represent what the real votes shares were for the election.
Side Note: I’d argue that the fact that VA has tallied and published their data in such a way that makes it near impossible to transparently review precinct level results is reason enough to audit the entire VA vote, and needs to be addressed by our legislature. Even if there was absolutely no flaws, errors, or fraud in the VA election … the vote should still be thoroughly and completely audited across the state, and reporting standards should be updated to make inspection of the per precinct results transparent without needing to perform advanced algorithms as described below.
Previously I tried adjusting the “registered voter” counts for each virtual district by subtracting off the number of actual votes counted in person in their constituent real precincts. That method is accurate and produces self-consistent data for the “virtual precincts” which are summed at the county congressional district level, but it does nothing for being able to plot accurate fingerprints at the real per-precinct level.
But then I had an idea (ding!) after my discussions with Ed Solomon as to how to “unwrap” and distribute the Absentee and Provisional ballots from the virtual precinct sums back to the component real precincts. We can use the fact that we have the actual county level sums, and the real precinct level turnout numbers as constraints to perform a non-linear model fit that estimates the numbers of votes for Biden and Trump for each precinct that should be summed into the virtual district results.
Fair Warning: If you’ve been following my other blog posts, this one is going to get way more technical. I’ll still try to make sure that I include ample descriptions and educational cross-links … but buckle up!
Input Data:
The input data to this is the same as the input data to all of the VA Election Fingerprint analysis. Direct from the VA Dept of Elections, we need the per precinct vote tallies and the voter registrations numbers. We’d like the registered voter results as close to the nov election as possible. Links to the most recently updated versions of these files from VA DoE are below. I’ve made one addition to the standard dataset, which is that I’ve used the Daily Absentee List (DAL) from the 2020 November General provided by VA DoE to estimate the number of accepted and returned absentee ballots per precinct.
https://www.elections.virginia.gov/candidatepac-info/client-services/index.html
Description and Method:
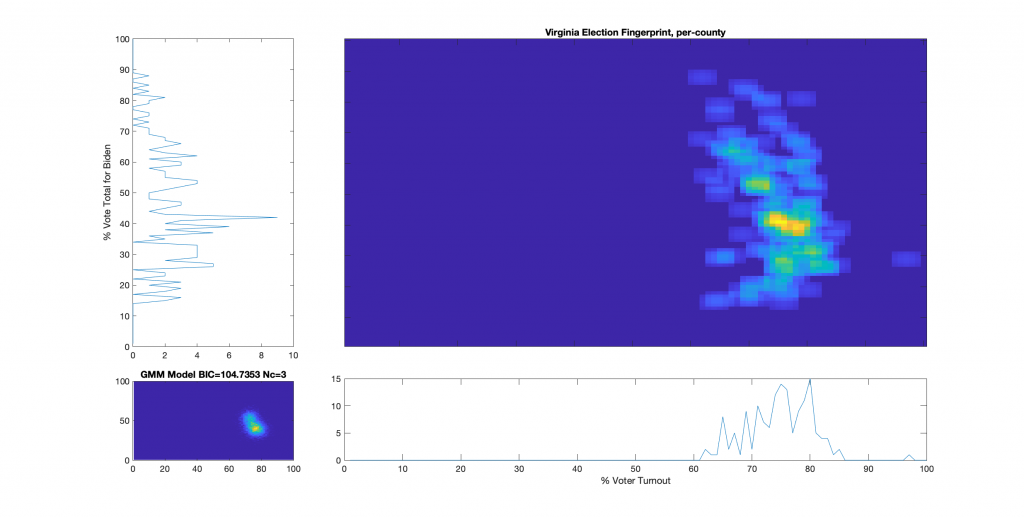
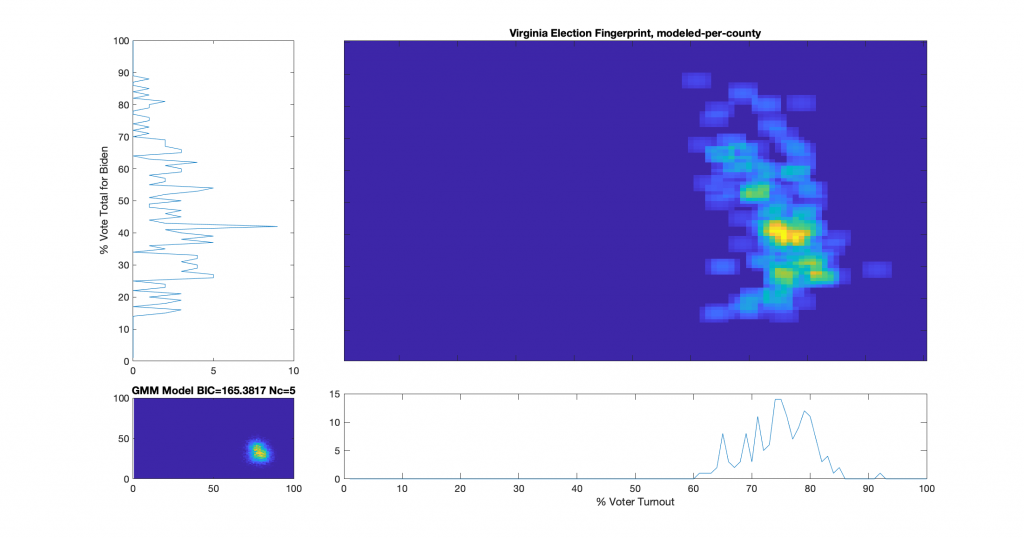
We know the per county per congressional district vote tallies and registration numbers [note that I routinely just refer to this as the “per county” data, but its really per county per congressional district], including all In-Person and Absentee ballots. We can compute the per County fingerprint in the standard manner according to the methods in the NAS paper that describes the Election Fingerprint method, as I did previously here and here. We take the data provided from the links above and sum them into per county results, and creating a 2D histogram of the (% Vote Share for Biden) vs (% Voter Turnout).
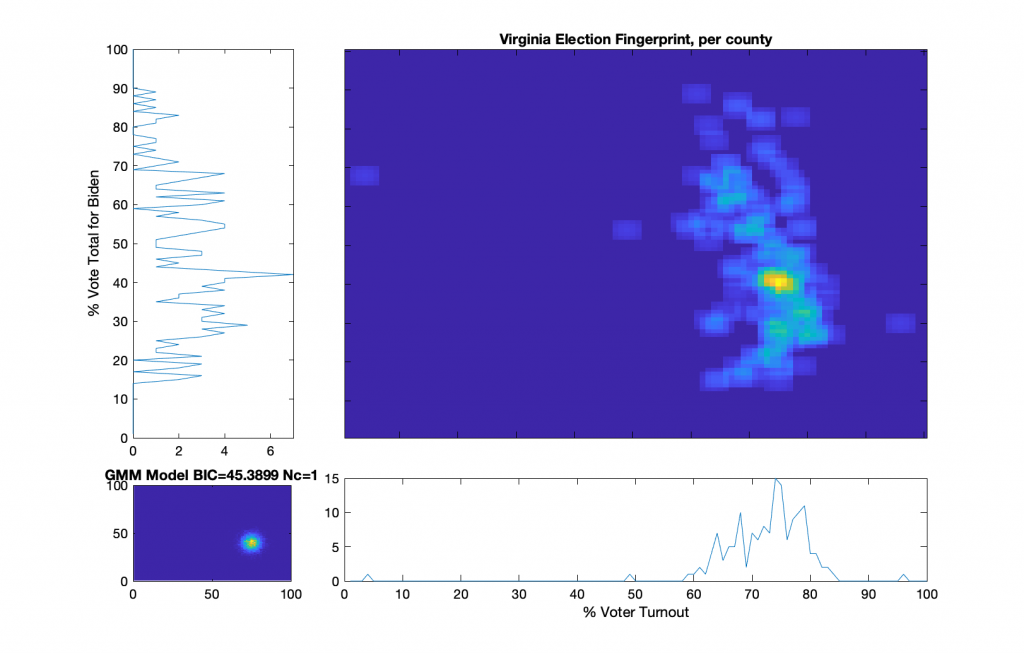
I’ll mention quickly about how the Fingerprint above from the reported data appears to have significant irregularities and correlations that deviate from a 2D Gaussian. We see a central lobe with some very distinct intersecting curves overlaid. This distribution does not comport with the theory of a free and fair election. That is not the focus of this post however.
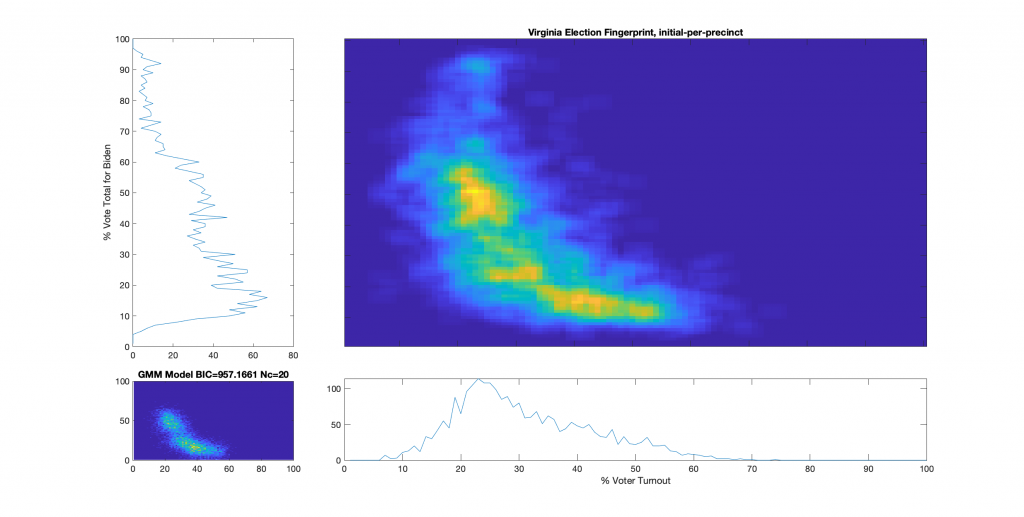
I (and others) would like the ability to accurately examine the data at the per–precinct level. We know the per precinct In-Person vote total from the VA DoE data, but not the per precinct Absentee votes for each candidate. Which means that the VA per precinct maps I produced before, while useful for looking at the In-Person, Absentee or Provisional votes independently, are not really suited for performing hypothesis testing for outlier precincts in relation to the election results as a whole. This is because the In-Person and Absentee votes share the same universe of possible voters (e.g. registered voters) with an unknown “mixing” coefficient (also known as a set of latent or hidden variables), and the Central Absentee Precinct (CAP) data from VA DoE encompass a number of summed component real precinct data. We also know that a large portion of the 2020 election was due to non-In-Person ballots, so this is a pretty gaping hole in our ability to understand what happened in VA.
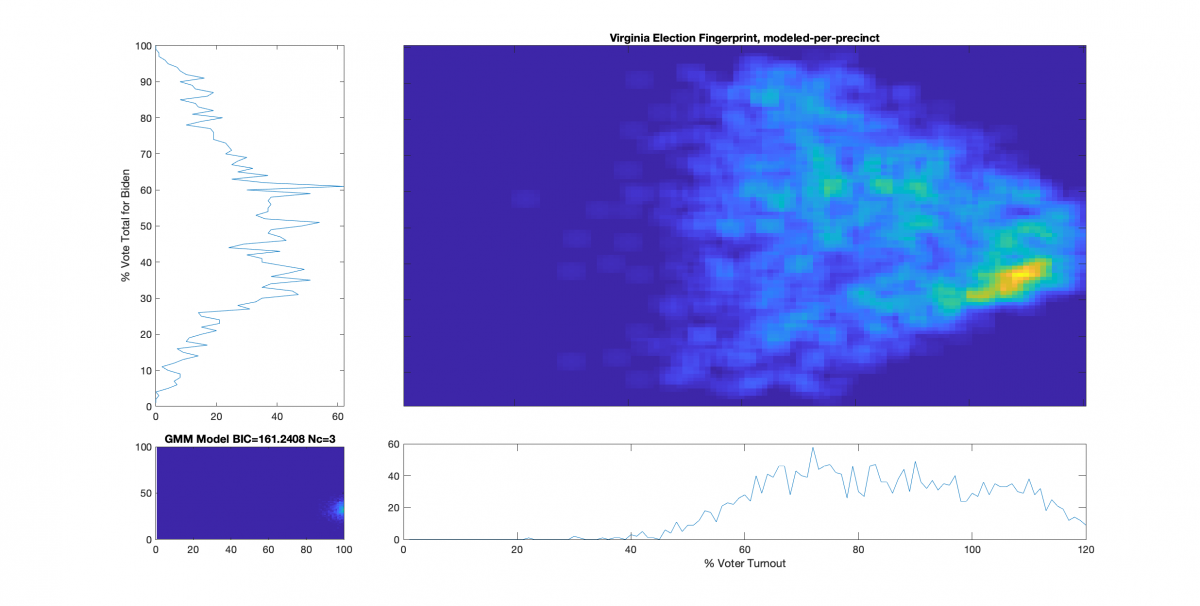
We therefore need to estimate the number of additional (absentee or provisional) votes for Trump and Biden that should be attributed to each real precinct. Since we are missing important data from the VA DoE published data, we going to have to try and model this data using a non-linear optimization subject to a number of constraints. The desired end result of this is a self-consistent (but modeled) per precinct data set that accounts for all In-Person and Absentee ballots AND sums within each county congressional district to equal the per county fingerprints that we produced previously AND does not violate any of the expectations of a free and fair election (i.e. no over 100% turnout, no linear correlations in the histogram, etc). I will caveat again that this modeled result is only one possible solution to the “unmixing” optimization problem, albeit the most likely, given the constraints. If we can find such a mapping, then we have an existence proof. If the election was truly free and fair, and the data has not been manipulated, then there should exist at least one such mapping that can be discovered by the optimization process.
We’re going to perform this modeling under the following assumptions and constraints:
- The total number of votes (In-Person, Absentee) allocated to a precinct should not exceed the number of registered voters for the precinct. Our optimization function will include a penalty when this is violated.
- The total number of Absentee votes allocated to a precinct should not exceed the number of returned absentee ballots for the precinct (computed from the DAL). Our optimization function will include a penalty when this is violated.
- The sum of the vote totals in all of the component precincts of a county congressional district should equal the data as provided by VA DoE (Votes Trump, Votes Biden, Total Absentee Votes, etc). Our optimization function will include a penalty when this is violated.
We’ll use the MATLAB optimization toolbox lsqnonlin function, which uses a Trust-Region-Reflective or Levenberg-Marquradt algorithm, and try and create this new model by finding the additive factors (x Abs Vote for Biden, y Abs Votes for Trump) for each precinct’s Biden and Trump votes that warp the In-Person dataset such that each precincts data incorporates the contributions from Absentee votes. We are also going to clamp each of the (x, y) factors to be greater than 0 and less than the total number of estimated absentee ballots per precinct. Note that if the only limit was this clamping we could still have 2x the number of allocated absentee votes since there are two variables, so this limit serves only as an extreme upper bound for numerical stability reasons and computation speed.
The objective function for the MATLAB lsqnonlin(...) algorithm is given below. I’ve also parameterized which penalties are to be included so that I can try different permutations.
function [y, a, b, c, v] = ofunc2(abVotes,pivotMatrix,ipVotes,countyVotes,doA,doB,doC)
% abVotes is the current estimate of absentee votes for trump and biden
% attributed per precinct
%
% pivotMatrix is a boolean sparse matrix that sums the component precinct
% level data into their respective county gongressional district units.
%
% ipVotes is the in person [Biden, Trump, ..., TotalIP, RegisteredVoters,
% AcceptedAndReturnedAbsentee] tallies per precinct
%
% countyVotes is the total [Biden, Trump, ..., Total, RegisteredVoters, ...,
% TotalAbsenteeVotes] tallies per county congressional district

dim = size(abVotes,2);
xvotes = ipVotes;
xvotes(:,1:dim) = xvotes(:,1:dim)+abVotes;
mvotes = pivotMatrix*xvotes;        % Modeled votes per county
avotes = pivotMatrix*abVotes;       % Absentee votes per county

% extra penalty for breaking the rules...
exPen  = 1;
if nargin < 5 || isempty(doA)
    doA = true;
end
if nargin < 6 || isempty(doB)
    doB = true;
end
if nargin < 7 || isempty(doC)
    doC = true;
end

v = {};
a = [];
b = [];
c = [];

y = [];

% Difference at the county vote tally level
a = (mvotes(:,1:dim)-countyVotes(:,1:dim));
if nargout > 1 && sum(abs(a(:))) > 0
    v{end+1} = ['Violation of County Vote Tally: ',num2str(sum(abs(a(:))))];
end

if doA
    % Penalize for going over number of registered voters per county
    a(:,dim+1) = exPen * (sum(mvotes(:,1:dim),2) - countyVotes(:,dim+2));
    a(a(:,dim+1)<0,dim+1) = 0; % No penalty if we dont go over limit

    if nargout > 1 && sum(abs(a(:,dim+1))) > 0
        v{end+1} = ['Violation of County Registered Voters: ',num2str(sum(abs(a(:,3))))];
    end

    % Penalize for difference from number of absentee voters per county
    a(:,dim+2) = exPen * (countyVotes(:,end-1) - sum(avotes(:,1:dim),2));
    if nargout > 1 && sum(abs(a(:,dim+2))) > 0
        v{end+1} = ['Violation of County Absentee Votes: ',num2str(sum(abs(a(:,dim+2))))];
    end
end
y = [y;a(:)];

if doB
    % Penalize difference from number of computed absentee votes per precinct
    b = exPen * (sum(abVotes,2)-ipVotes(:,end));
    %b(b<0) = 0;  % No penalty if we dont go over limit
    y = [y;b(:)];

    if nargout > 1 && sum(abs(b(:))) > 0
        v{end+1} = ['Violation of Precinct Approved and Returned Absentee Ballots: ',num2str(sum(abs(b(:))))];
    end
end

if doC
    % Penalize going over the total number of registered voters per precinct
    c = exPen * (sum(xvotes(:,1:dim),2)-ipVotes(:,dim+2));
    c(c<0) = 0;  % No penalty if we dont go over limit
    y = [y;c(:)];

    if nargout > 1 && sum(abs(c(:))) > 0
        v{end+1} = ['Violation of Precinct Registered Voters: ',num2str(sum(abs(c(:))))];
    end
end
Rsults:
I was unable to find a solution using ANY of the constraint permutations that satisfied mathematical consistency. While I was able to produce estimates of absentee vote share per precinct, none of the solutions generated fell completely within the reported turnout, reported absentee ballot splits, or other constraints as defined by the published and certified VA DoE results.
Based on the deviations otherwise observed and reported by VA DoE, an error threshold of 0.1% on reconstructed totals using the modeled absentee ballot distributions should be readily achievable, with exact matches the ideal and desired result . The closest solution I have achieved so far is off by a min of 0.35% (for reconstructed Trump vote total) and a max of 0.62% (for the reconstructed total number of votes cast).
I have issued on FB, Twitter and Telegram an open challenge and reward of $1000 to the first person that can provide such a solution. I do not believe that such a solution exists.

A bugfix, but still no solution found … (update @ 2021-08-17 3:19pm)
There was a bug in the objective function posted above. The penalty score for going over the number of registered voters per county and the penalty score for going over the number of registered voters in the precinct should have had a negative sign in front of them. This has been fixed in the program listing above. While the LM optimization gets much closer with this bugfix, I have still yet to find a solution that satisfies all constraints and matches the results reported by VA DoE.
The “best bad” solution I could find … (update @ 2021-08-26 0:09 am)
After weeks of running different variations the “best bad” numerical solution I can find still busts the constraints derived from the reported VA data. The error function code and the resultant images have been updated. The following deviations are the mathematical minimum amount of deviations that I could achieve using the Levenberg-Marquardt optimization. There does not appear to be a mathematical solution to the absentee unwrapping problem in VA that does not violate the published tallies from VA DoE. There *should* be an entire universe of possibilities. The fact that there isn’t one is near irrefutable proof that the election vote tallies certified by VA are egregiously flawed.
Violation of County Vote Tally: 1401
Violation of County Absentee Votes: 1267
Violation of Precinct Approved and Returned Absentee Ballots: 15255
Violation of Precinct Registered Voters: 1808
The “worst bad” solution, which only tried to constrain the problem based on reported vote tallies, performed significantly worse.
Violation of County Vote Tally: 2382
Violation of County Absentee Votes: 970
Violation of Precinct Approved and Returned Absentee Ballots: 559492
Violation of Precinct Registered Voters: 75041