Note: As of Update 2021-08-13 (see below) the discrepancy is now 382176 Votes.
This needs to be explained. I hope this is just a mistake on my part or it can be attributed to a documented clerical or reporting error. I’ve gone over this a number of times now and triple checked my data sources and methods (all described or linked here). I’m only using the publicly available data from the VA Dept of Elections website and a doing a fairly basic consistency check between the machine readable data (csv) and what is presented on their site.
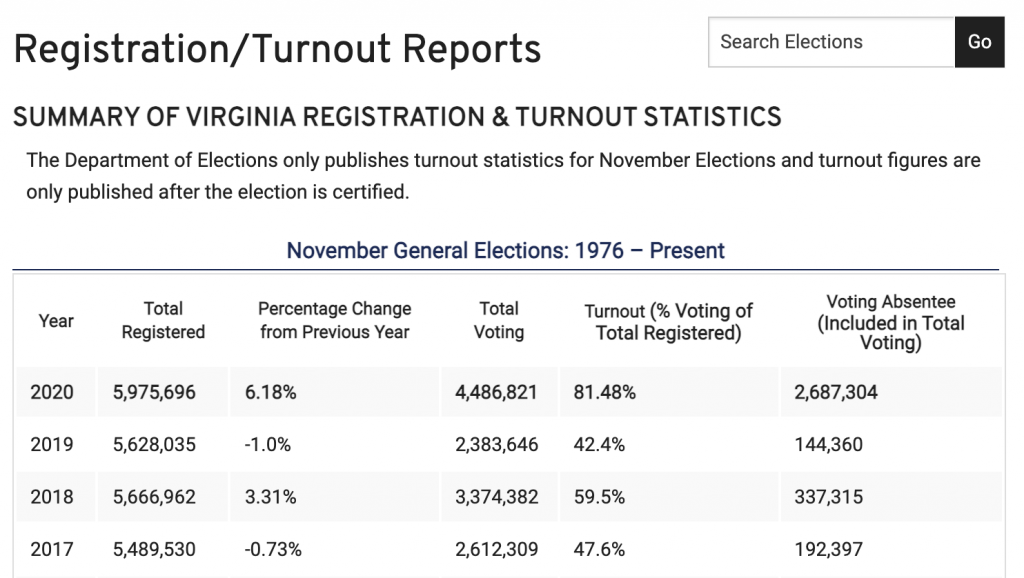
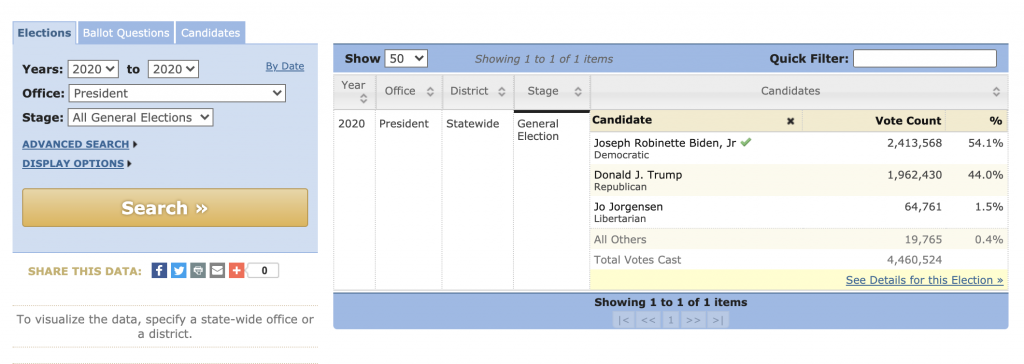
The VA Dept of Election summarizes the voting results for the 2020 Presidential election as follows. We note that even just taking screen shots from the VA DoE website we can notice that the vote totals for the same elections have some error in them. The first screen shot shows the total number of votes in the 2020 Presidential Election as 4,486,821 while the second shows the number of votes cast as 4,460,524. Now that is not a major difference in relation to the margin of victory or the number of votes cast, so it’s not something that bothers me. The two reported numbers are close enough that it is plausible that one includes overvotes/undervotes and the other doesn’t, or something similar. But it IS a noted difference, none the less. (issue # 1)


The VA DoE also publishes the 2020 General Election results (here) as a csv file. (I pulled a fresh copy as of 2021-08-10 to run this analysis, but its too large to upload to the site). One would expect the data in the csv and the data presented on the VA DoE website to match, or at least be close enough to chalk up any errors to something simple like over-votes/undervotes, etc.. They don’t. Not only do they not match, but they don’t match in a very peculiar way. Let’s walk through the process of grabbing the data from the csv and tabulating metrics above in a very simple MATLAB script, shall we?
% %%%%%%%%%%%%%%%%%%%%%%%%%%%%%%%%%%%%%%%%%%%%%%%%%%%%%%%%%%%%%%%%%%%%%%%%%
% Import the November General vote totals and collate ...
NovemberGeneral = importVAVotefile("SourceData/2020 November General.csv", [2, Inf]);
NovemberGeneral = NovemberGeneral(NovemberGeneral.OfficeTitle == 'President and Vice President',:);
LocalityName = NovemberGeneral.LocalityName;
DistrictName = NovemberGeneral.DistrictName;
PrecinctName = NovemberGeneral.PrecinctName;

uid = join(cat(2,string(LocalityName),string(DistrictName),string(PrecinctName)),' : ');

[uuids, ui,ua] = unique(uid);
[ulns, uci,uca] = unique(NovemberGeneral.LastName);
votes = accumarray([ua,uca],NovemberGeneral.TOTAL_VOTES);
votes(isnan(votes)) = 0;
votes(:,end+1) = sum(votes,2);

isAbsentee = contains(string(uuids),"Central Absentee Precinct");
isProvisional = contains(string(uuids),"Provisional");

% Compute the sum of all ballots
TotalVotes = sum(votes(:,end))

% Compute the sum of the in person ballots
InPersonVotes = sum(votes(~isAbsentee & ~isProvisional,end))

% Compute the sum of the provisional or absentee ballots
Absentee = sum(votes(isAbsentee | isProvisional,end))
>> TotalVotes = 4462600>> InPersonVotes = 1630833>> Absentee = 2831767Wait a minute?? … the data from the first link show the Absentee vote being 2,687,304. Yet the “2020 November General.csv” file shows 2,831,767 absentee votes. Thats a difference of somewhere around 144,463 votes! Even more interesting is the fact that the total number of votes is still consistent with the published summary screenshots above. Thats a significant enough discrepancy that I get my worry beads out. Now, granted, this could … in some convoluted Rube Goldberg esque manner … be just be a clerical error, or maybe I’m just missing something totally obvious about the data. But no matter the reason, this NEEDS to be explained.

Update 2021-08-10 6:57pm
I’ve received a update that further corroborates the discontinuity in these numbers. In response to a FOIA request, the VA Dept of Elections supplied a summary file of the counts of all requested and returned absentee ballots per county.
This data file comes from ashley.coles@elections.virginia.gov. It contains only two data columns, the Total Requested and the Total Returned. Summing the Total Returned column produces a result of 2,829,037. which is only off from my result by 2730 (<< 1%). So we have yet another official source of VA election data that shows a discrepancy from the official results that were certified by VA. No fancy MATLAB scripts required to process, just simple sum of the table columns.
Update 2021-08-13 3:00 PM
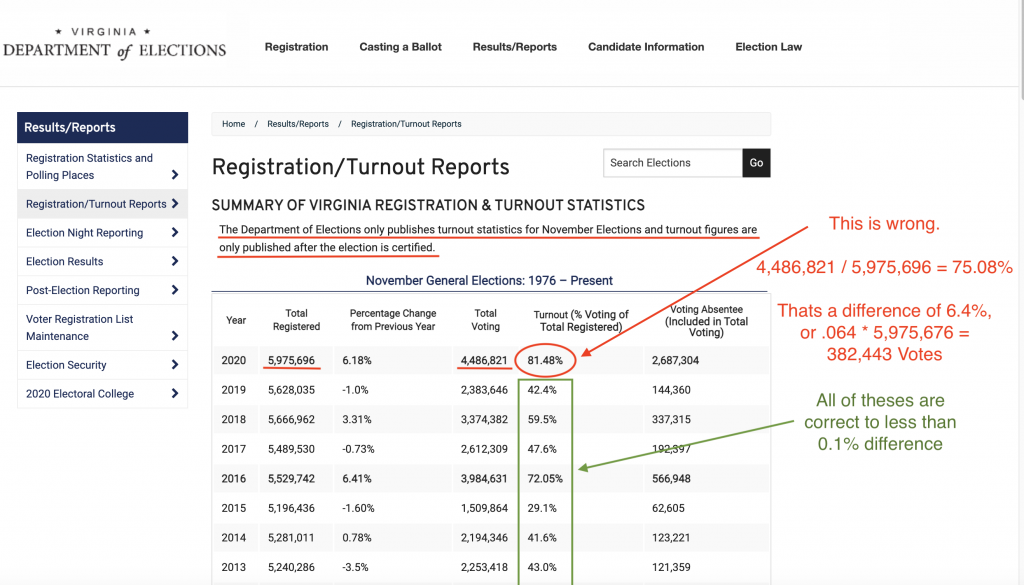
Looking closer at the official certified results from the VA DoE (first graphic and link above), they report that in 2020 the Total Registered = 5,975,696, the Total Voting = 4,486,821, and the % Turnout = 81.48%. They define the “Turnout” metric in the header as “% Voting of Total Registered”. So according to VA DoE … Total Voting / Total Registered * 100 = 4486821 / 5975696 * 100 = 81.48. Simple, right?
Except its wrong. Way wrong. Go ahead … grab a calculator. Try it for yourself.
4486821 / 5975696 * 100 = 75.0845 is what you’ll come up with. That’s a Difference of 6.40% from the reported turnout. .064 * Total Registered = .064 * 5,975,696 = 382,176 (rounded) Unaccounted for votes.
But Jon … you say … surely you are just misinterpreting their metric! They wouldn’t have published the certified results with that glaring of an error. There has to be some other variable that’s counted in the turnout numbers that they just forgot to describe in the header line of the report.
If that were the case, we would expect the other election totals in the subsequent rows to show similar errors then, right? Yeah … not so much. Every other year in this same report has a difference of less than 0.1%.
Remember these are the numbers that VA certified to congress. Even if this is just a clerical error, we need to know how and why it happened and make sure it doesn’t happen again. We need a full audit of the VA 2020 Election.
| Year | Total Registered | Percentage Change from Previous Year | Total Voting | Turnout (% Voting of Total Registered) | Voting Absentee (Included in Total Voting) | Total Voting / Total Registered | Difference From Reported Turnout |
| 2020 | 5,975,696 | 6.18% | 4,486,821 | 81.48% | 2,687,304 | 75.08% | 6.40% |
| 2019 | 5,628,035 | -1.00% | 2,383,646 | 42.40% | 144,360 | 42.35% | 0.05% |
| 2018 | 5,666,962 | 3.31% | 3,374,382 | 59.50% | 337,315 | 59.54% | -0.04% |
| 2017 | 5,489,530 | -0.73% | 2,612,309 | 47.60% | 192,397 | 47.59% | 0.01% |
| 2016 | 5,529,742 | 6.41% | 3,984,631 | 72.05% | 566,948 | 72.06% | -0.01% |
| 2015 | 5,196,436 | -1.60% | 1,509,864 | 29.10% | 62,605 | 29.06% | 0.04% |
| 2014 | 5,281,011 | 0.78% | 2,194,346 | 41.60% | 123,221 | 41.55% | 0.05% |
| 2013 | 5,240,286 | -3.50% | 2,253,418 | 43.00% | 121,359 | 43.00% | 0.00% |
| 2012 | 5,428,833 | 6.10% | 3,858,043 | 71.06% | 447,907 | 71.07% | -0.01% |
| 2011 | 5,116,929 | 1.68% | 1,463,761 | 28.61% | 59,519 | 28.61% | 0.00% |
| 2010 | 5,032,144 | 1.54% | 2,214,503 | 44.01% | 106,888 | 44.01% | 0.00% |
| 2009 | 4,955,750 | -1.57% | 2,000,812 | 40.40% | 88,182 | 40.37% | 0.03% |
| 2008 | 5,034,660 | 10.70% | 3,723,260 | 74.00% | 506,672 | 73.95% | 0.05% |
| 2007 | 4,549,864 | -0.10% | 1,374,526 | 30.20% | 30,619 | 30.21% | -0.01% |
| 2006 | 4,554,683 | 2.30% | 2,398,589 | 52.70% | 116,629 | 52.66% | 0.04% |
| 2005 | 4,452,225 | -1.50% | 2,000,052 | 44.92% | 75,982 | 44.92% | 0.00% |
| 2004 | 4,517,980 | 7.10% | 3,198,367 | 70.79% | 222,059 | 70.79% | 0.00% |
| 2003 | 4,217,227 | -0.10% | 1,296,955 | 30.80% | 35,716 | 30.75% | 0.05% |
| 2002 | 4,219,957 | 2.70% | 1,331,915 | 31.56% | 44,493 | 31.56% | 0.00% |
| 2001 | 4,109,127 | 0.90% | 1,905,511 | 46.40% | 52,344 | 46.37% | 0.03% |
| 2000 | 4,073,644 | 7.00% | 2,739,447 | 67.20% | 150,414 | 67.25% | -0.05% |
| 1999 | 3,808,754 | 2.30% | 1,373,527 | 36.10% | 10,686 | 36.06% | 0.04% |
| 1998 | 3,724,683 | 4.50% | 1,229,139 | 33.00% | 31,494 | 33.00% | 0.00% |
| 1997 | 3,565,697 | 7.30% | 1,764,476 | 49.50% | 47,571 | 49.48% | 0.02% |
| 1996 | 3,322,740 | 9.40% | 2,416,642 | 72.70% | 116,606 | 72.73% | -0.03% |
| 1995 | 3,038,394 | 1.30% | 1,585,783 | 52.20% | 45,785 | 52.19% | 0.01% |
| 1994 | 3,000,560 | 0.90% | 2,078,106 | 69.30% | 81,636 | 69.26% | 0.04% |
| 1993 | 2,975,121 | -2.60% | 1,817,777 | 61.10% | 53,904 | 61.10% | 0.00% |
| 1992 | 3,055,486 | 9.40% | 2,558,665 | 83.70% | 141,123 | 83.74% | -0.04% |
Summary:
In summary, I can rectify the “2020 November General” and the “Daily_Registrant_Count_By_Locality” data files to give the following results compared to the HTML web report. The additional cross check of the response from FOIA request, matches my number to within a few thousand. All of this data is provided by VA DoE. All of it is supposed to be authoritative and definitive. And none of it makes any sense.
| VA DoE Certified Results | Biden Vote | Trump Vote | Total Voting | Total Registered | % Change from previous year | (Reported) Turnout (Total Voting / Total Registered) | (Computed) Turnout | Voting Absentee | |
| #1 | VA DoE Report: Registration / Turnout | 4,486,821 | 5,975,676 | 6.18% | 81.48% | 75.08% (~382,443 Votes) | 2,687,304 | ||
| #2 | VA DoE Elections Database | 2,413,568 | 1,962,430 | 4,460,524 | |||||
| #3 | CSV: 2020-November-General | 2,413,568 | 1,962,430 | 4,462,600 | 2,831,767 | ||||
| #4 | CSV: Registrations 11-01-2020 | 5,975,717 | 6.18% | ||||||
| #5 | FOIA’d CSV | 2,829,037 | |||||||
| #6 | Daily Absentee List (by Request) | 2,826,484 | |||||||
| Computed from #3 & #4 | 74.68% | 74.68% | |||||||
| Max Abs Difference | 0 | 0 | 24,221 | 41 | 0 | 6.8% | 0.4% | 144,463 |
Registration / Turnout Report: https://www.elections.virginia.gov/resultsreports/registrationturnout-statistics/
Elections Database: https://historical.elections.virginia.gov/elections/search/year_from:2020/year_to:2020/office_id:1/stage:General
CSV-2020-November-General: https://apps.elections.virginia.gov/SBE_CSV/ELECTIONS/ELECTIONRESULTS/2020/
CSV-Registrations-2020-11-01: https://www.elections.virginia.gov/media/registration-statistics/2020/nov/Daily_Registrant_Count_By_Locality_2020_12_01_054401.csv
FOIA’s CSV: https://www.elections.virginia.gov/media/registration-statistics/2020/nov/Daily_Registrant_Count_By_Locality_2020_12_01_054401.csv
DAL (as of 2020-11-30): https://www.elections.virginia.gov/candidatepac-info/client-services/index.html
Other Code Used in this analysis:
I will note for completeness here that the importVAVotefile(...) function referenced above is auto-generated by the MATLAB Import Data tool. I’ve listed it below for the record.
function NovemberGeneral = importVAVotefile(filename, dataLines)
%IMPORTFILE Import data from a text file
%  NOVEMBERGENERAL = IMPORTFILE(FILENAME) reads data from text file
%  FILENAME for the default selection.  Returns the data as a table.
%
%  NOVEMBERGENERAL = IMPORTFILE(FILE, DATALINES) reads data for the
%  specified row interval(s) of text file FILENAME. Specify DATALINES as
%  a positive scalar integer or a N-by-2 array of positive scalar
%  integers for dis-contiguous row intervals.
%
%  Example:
%  NovemberGeneral = importVAVotefile("2020 November General.csv", [2, Inf]);
%
%  See also READTABLE.
%
% Auto-generated by MATLAB on 07-Aug-2021 14:36:17

%% Input handling

% If dataLines is not specified, define defaults
if nargin < 2
    dataLines = [2, Inf];
end

%% Set up the Import Options and import the data
opts = delimitedTextImportOptions("NumVariables", 22);

% Specify range and delimiter
opts.DataLines = dataLines;
opts.Delimiter = ",";

% Specify column names and types
opts.VariableNames = ["CandidateUid", "FirstName", "MiddleName", "LastName", "Suffix", "TOTAL_VOTES", "Party", "WriteInVote", "LocalityUid", "LocalityCode", "LocalityName", "PrecinctUid", "PrecinctName", "DistrictUid", "DistrictType", "DistrictName", "OfficeUid", "OfficeTitle", "ElectionUid", "ElectionType", "ElectionDate", "ElectionName"];
opts.VariableTypes = ["categorical", "categorical", "categorical", "categorical", "categorical", "double", "categorical", "categorical", "categorical", "double", "categorical", "categorical", "categorical", "categorical", "categorical", "categorical", "categorical", "categorical", "categorical", "categorical", "string", "categorical"];

% Specify file level properties
opts.ExtraColumnsRule = "ignore";
opts.EmptyLineRule = "read";

% Specify variable properties
opts = setvaropts(opts, "ElectionDate", "WhitespaceRule", "preserve");
opts = setvaropts(opts, ["CandidateUid", "FirstName", "MiddleName", "LastName", "Suffix", "Party", "WriteInVote", "LocalityUid", "LocalityName", "PrecinctUid", "PrecinctName", "DistrictUid", "DistrictType", "DistrictName", "OfficeUid", "OfficeTitle", "ElectionUid", "ElectionType", "ElectionDate", "ElectionName"], "EmptyFieldRule", "auto");

% Import the data
NovemberGeneral = readtable(filename, opts);

end
