The following presentation is adapted from a presentation and discussion EPEC staff had with select VA legislators on 2025-02-18. Our team was very thankful for being invited to present and explain our methods, data and observations and look forward to further interactions with legislative teams.
Corrections: On slide 5, bullets 1 and 4 had typos in the dates of the RVL files mentioned. The slides were corrected and re-uploaded on 2025-02-21 at 8:40pm.
We have updated our previous analysis (see March, July, Sept, Oct and Nov posts) with the latest information from the VA Department of Elections data.
Abstract:
Using the data provided by the VA Department of Elections (ELECT), we have identified at least 3,765 unique registrations that were self-identified as “Declared Non-Citizen” and removed by ELECT from the voter rolls since May of 2023. Of those 3,765 removals there were 562 that also had corresponding records of recent ballots cast at some point in the official Voter History record that we could observe. There were 1,318 associated ballots cast identified since Feb of 2019. There were an additional 3 non-citizen registrations and ballots as per the Daily Absentee List (DAL) data, that were not contained in the Voter History data. The total number of identified non-citizen ballots cast is therefore 1,321 by 565 registrants when combining unique VHL and DAL identifications.
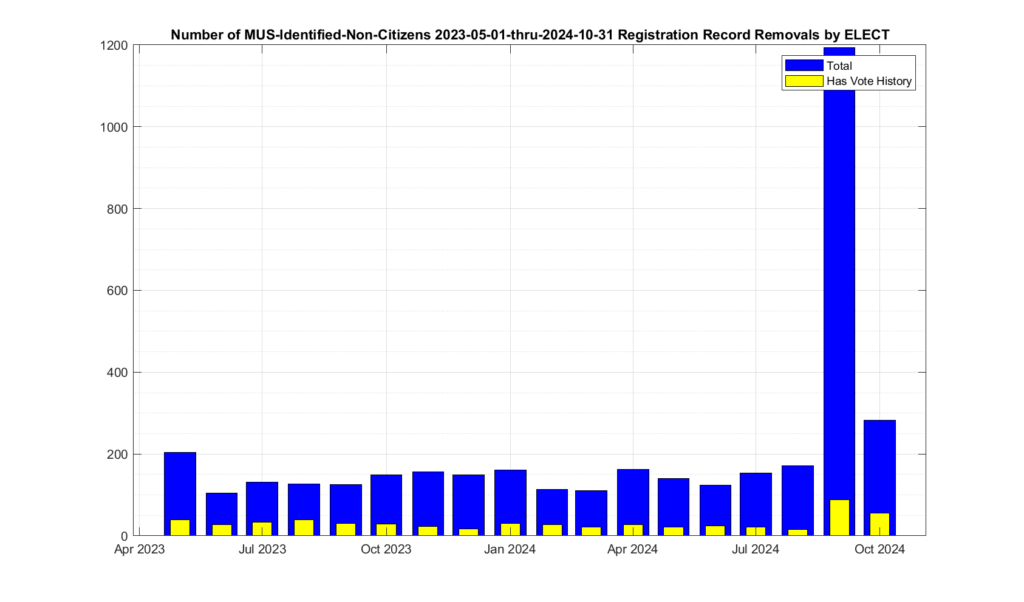
Note that there was a large spike (see Figure 1) in declared non-citizen removals in Sept that seems to have returned to the norm in October, and dropped to almost nothing in November. We do not receive enough information from VA ELECT in order to determine if this spike and drop is due to simply the number of interactions and interest in the 2024 general election, or changes in the procedures by ELECT, etc. But we can observe this change in the data, even though we do not have enough information as to make a hypothesis as to why it is present.
After our March 2024 post on this topic, we submitted all of the relevant information that we had at the time to the VA AG’s office. We have not heard any response or update on the matter since that time, besides this being considered an active investigation. We subsequently sent our July results as well to the same contact at the AG’s office, but have had no response.
The Arlington County VA Electoral Board undertook their own investigation into this matter after our previous results were posted, and they recently (as of Sept 10 2024) voted 3-0 to send the information to the AG’s office as well. The Arlington County Commonwealths Attorney also is reported to have an ongoing investigation into the matter. Similar efforts are underway in multiple other counties, including Loudoun and Fairfax counties, to name a few.
In October the League of Women Voters along with the US DOJ sued VA over this issue and attempted to get an injunction to place ~1,600 of these removed registrations back on the Voter roll. After two lower courts granted the injunction, it was stayed by the US Supreme Court. It is EPEC’s opinion that the State of VA is correctly applying the law in this matter, as I detailed in a X.com post on Oct 12, but we will be closely watching how this case continues to play out as we move forward.
Background:
The VA Department of Elections continuously tries to identify and remove invalid or out of date registration records from the voter rolls. One category used for removal is if a registrant has been determined to be a non-citizen. It is required by the VA Constitution that only citizens are allowed to vote in VA elections.
In elections by the people, the qualifications of voters shall be as follows: Each voter shall be a citizen of the United States, shall be eighteen years of age, shall fulfill the residence requirements set forth in this section, and shall be registered to vote pursuant to this article. …
Additionally, according to VA Code Section 24.2-1004, the act of knowingly casting a ballot by someone who is not eligible to vote is a Class 6 felony.
A. Any person who wrongfully deposits a ballot in the ballot container or casts a vote on any voting equipment, is guilty of a Class 1 misdemeanor.
B. Any person who intentionally (i) votes more than once in the same election, whether those votes are cast in Virginia or in Virginia and any other state or territory of the United States, (ii) procures, assists, or induces another to vote more than once in the same election, whether those votes are cast in Virginia or in Virginia and any other state or territory of the United States, (iii) votes knowing that he is not qualified to vote where and when the vote is to be given, or (iv) procures, assists, or induces another to vote knowing that such person is not qualified to vote where and when the vote is to be given is guilty of a Class 6 felony.
ELECT makes available for purchase by qualifying parties various different data sets, including the registered voter list (RVL) and the voter history list information file (VHL). Additionally, ELECT makes available a Monthly Update Service (MUS) subscription that is published at the beginning of each month and contains (almost) all of the Voter List changes and transactions for the previous period.
In the MUS data there is a “NVRAReasonCode” field that is associated with each transaction that gives the reason for the update or change in the voter record. This is in accordance with the disclosure and transparency requirements in the NVRA. One of the possible reason codes given for records that are removed is “Declared Non-Citizen.”
EPEC has been consistently purchasing and archiving all of these official records as part of our ongoing work to document and educate the public as to the ongoing operations of our elections. (If your interested in supporting this work, please head on over to our donation page, or to our give-send-go campaign to make a tax-deductible donation, as these data purchases are not cheap!)
EPEC looked at the number of records associated with unique voter identification numbers that had been identified for removal from the voter record due to non-citizenship status, per the entries in the MUS, and correlated those results with our accumulated voter history list information in order to determine how many non-citizen registrations had corresponding records of ballots cast in previous elections. We only considered those records that are currently in a non-active state as of the latest MUS transaction log, as some determinations of non-citizenship status in the historical MUS transaction log might have been due to error and subsequently corrected and reinstated to active status. That is, we are not considering those records that had a “Declared Non-Citizen” disqualification, but were then subsequently reinstated and reactivated by ELECT.
While EPEC has periodically purchased full copies of the Voter History List for our archive, there is a known issue with the way ELECT handles removals from the voter record that can cause sampling issues depending on the time the VHL file is purchased, and records of legitimately cast ballots to not be present in the VHL: Namely, when ELECT removes a voter from the voter list, they also remove all instances of that voter ID from voter history information and other data files provided to qualified organizations. (IMO … thats a terrible way to manage the data, but that is the way it is done.) In light of that, EPEC also used its archived versions of the Daily Absentee List (DAL) for recent elections in order to attempt to find records of votes cast that might otherwise be missing from the VHL.
Results:
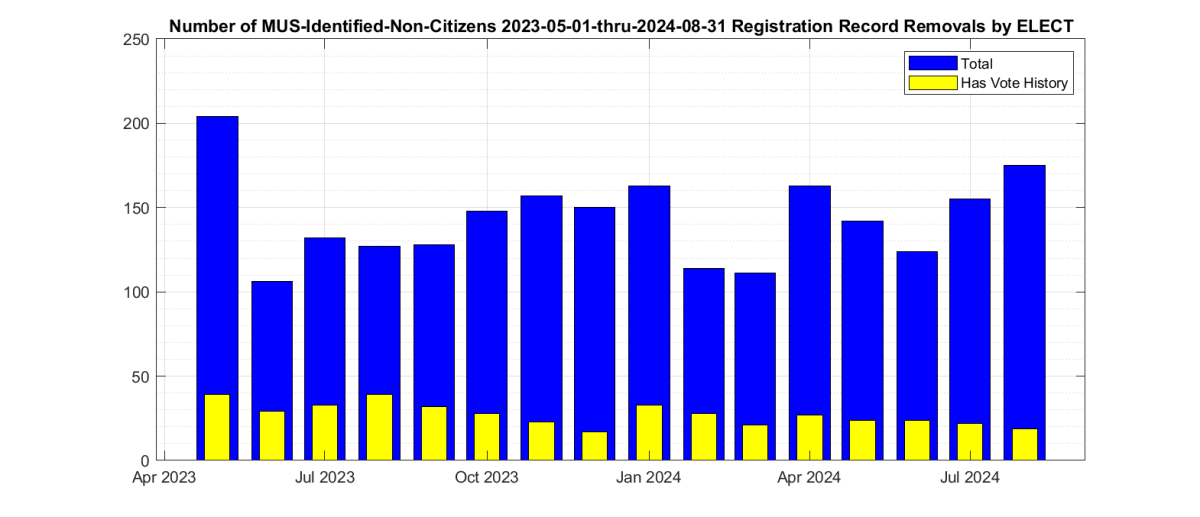
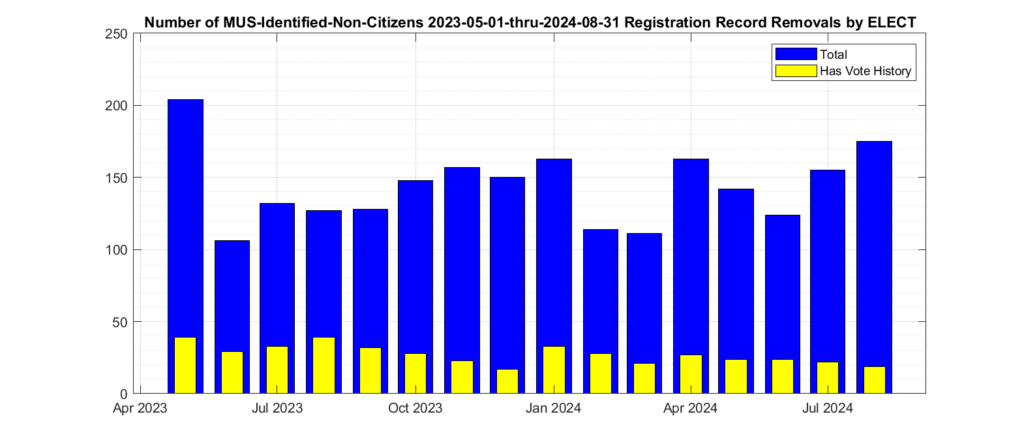
There were 3,765 unique voter records marked for removal with the reason of “Declared Non-Citizen” and not subsequently reinstated in the accumulated MUS record that EPEC began collecting in mid-2023. Of those 3,765 there were 562 that also had corresponding records of recent ballots cast at some point in the official Voter History record that we could observe. There were 1,318 associated ballots cast identified since Feb of 2019. Figure 1 shows the distribution of non-citizen voters in the cumulative MUS file history. The blue trace represent the total identified and CANCELED non-citizen registrations, and the yellow trace represents the number of those records that also had corresponding records in the accumulated voter history data.
Figure 1: Distribution if the number of identified non-citizen records and ballots in the cumulative ELECT MUS file history. The x-axis is the date that a record was marked as CANCELED for the reason of “Declared Non-Citizen”.
Note that the data contained in the MUS updates often covers more than a single month period. In other words, the individual MUS files are oversampled. Subsequent MUS files can therefore also have repeated entries from previous versions, as their data may overlap. Our analysis used the first unique entry for a given voter ID marked as “Declared Non-Citizen” in the cumulative MUS record in order to build Figure 1. This data oversampling in the MUS helps explain the relative increase in the May 2023 bin.
As VHL information can be incomplete depending on the time the VHL data was purchased in relation to the time that registrants were removed from voter records, EPEC also checked these non-citizen removals against the archived history of Daily Absentee List (DAL) files that EPEC has accumulated. There were an additional 2 non-citizen registrations and ballots as per the Daily Absentee List (DAL) data, that were not contained in the Voter History data. The total number of identified non-citizen ballots cast is therefore 1,321 by 535 registrants when combining unique VHL and DAL identifications.
These identifications represent only the individuals who declared themselves as non-citizen status through official interactions with ELECT, DMV, or other agencies. Each removed registrant was then contacted by the registrar to confirm their non-citizen status.
The distribution of identified unique voter ID’s for the 562 identified non-citizen voters per VA locality is given below in Table 1. It should be noted that each ballot record has a specific locality associated with where the ballot was cast, whereas unique individuals might move between localities over time. The assignment of unique identified individuals to each locality in table 1 is therefore based on the locality listed in the specific MUS “Declared Non-Citizen” record for that individual, while the assignment of ballot cast to Localities is based on the individual VHL/DAL records. A person could have lived and voted multiple times in one county, then moved to another county and voted again before finally being determined as a non-citizen. The same person would have generated multiple VHL/DAL records for each ballot cast, and associated with potentially different localities. This should be kept in mind when attempting to interpret Table 1.
LOCALITY_NAME
REMOVED
VOTED_VHL
VOTES_VHL
VOTED_DAL_NOT_IN_VHL
VOTES_DAL_NOT_IN_VHL
ACCOMACK COUNTY
7
0
0
0
0
ALBEMARLE COUNTY
45
8
13
0
0
ALEXANDRIA CITY
169
23
39
0
0
AMELIA COUNTY
2
1
3
0
0
AMHERST COUNTY
1
0
0
0
0
APPOMATTOX COUNTY
1
0
0
0
0
ARLINGTON COUNTY
107
14
39
0
0
AUGUSTA COUNTY
15
3
3
0
0
BEDFORD COUNTY
11
2
4
0
0
BOTETOURT COUNTY
2
0
0
0
0
BRISTOL CITY
1
0
0
0
0
BRUNSWICK COUNTY
2
1
2
0
0
BUCKINGHAM COUNTY
3
0
0
0
0
CAMPBELL COUNTY
0
0
0
0
0
CAROLINE COUNTY
9
3
10
0
0
CARROLL COUNTY
8
2
5
0
0
CHARLES CITY COUNTY
2
1
3
0
0
CHARLOTTESVILLE CITY
24
2
7
0
0
CHESAPEAKE CITY
95
22
51
0
0
CHESTERFIELD COUNTY
238
25
53
0
0
CLARKE COUNTY
8
3
4
0
0
COLONIAL HEIGHTS CITY
13
1
3
0
0
COVINGTON CITY
2
0
0
0
0
CRAIG COUNTY
1
0
0
0
0
CULPEPER COUNTY
27
2
2
0
0
DANVILLE CITY
19
3
9
0
0
DICKENSON COUNTY
1
0
0
0
0
DINWIDDIE COUNTY
9
1
1
0
0
EMPORIA CITY
2
0
0
0
0
ESSEX COUNTY
3
1
3
0
0
FAIRFAX CITY
9
3
13
0
0
FAIRFAX COUNTY
680
103
227
1
1
FALLS CHURCH CITY
0
0
0
0
0
FAUQUIER COUNTY
25
3
10
0
0
FLUVANNA COUNTY
2
1
1
0
0
FRANKLIN CITY
0
0
0
0
0
FRANKLIN COUNTY
2
1
1
0
0
FREDERICK COUNTY
30
2
2
0
0
FREDERICKSBURG CITY
23
2
4
0
0
GALAX CITY
2
0
0
0
0
GILES COUNTY
2
0
0
0
0
GLOUCESTER COUNTY
2
1
1
0
0
GOOCHLAND COUNTY
5
0
0
0
0
GRAYSON COUNTY
1
0
0
0
0
GREENE COUNTY
6
1
2
0
0
HALIFAX COUNTY
1
0
0
0
0
HAMPTON CITY
60
11
13
0
0
HANOVER COUNTY
14
2
6
0
0
HARRISONBURG CITY
84
5
6
0
0
HENRICO COUNTY
79
3
14
0
0
HENRY COUNTY
0
0
2
0
0
ISLE OF WIGHT COUNTY
1
0
2
0
0
JAMES CITY COUNTY
31
4
13
0
0
KING GEORGE COUNTY
5
0
0
0
0
KING WILLIAM COUNTY
1
0
0
0
0
LOUDOUN COUNTY
234
52
114
0
0
LOUISA COUNTY
8
0
0
0
0
LYNCHBURG CITY
23
3
4
0
0
MANASSAS CITY
50
4
11
0
0
MANASSAS PARK CITY
19
1
5
0
0
MARTINSVILLE CITY
6
1
0
0
0
MECKLENBURG COUNTY
7
3
10
0
0
MIDDLESEX COUNTY
2
0
0
0
0
MONTGOMERY COUNTY
1
0
3
0
0
NELSON COUNTY
2
0
0
0
0
NEW KENT COUNTY
3
1
0
0
0
NEWPORT NEWS CITY
111
23
48
0
0
NORFOLK CITY
95
12
32
0
0
NORTHAMPTON COUNTY
1
0
1
0
0
NORTHUMBERLAND COUNTY
3
2
5
0
0
NORTON CITY
1
0
0
0
0
NOTTOWAY COUNTY
4
0
0
0
0
ORANGE COUNTY
3
1
4
0
0
PATRICK COUNTY
1
0
0
0
0
PETERSBURG CITY
28
3
9
0
0
PITTSYLVANIA COUNTY
7
2
4
0
0
PORTSMOUTH CITY
44
13
38
0
0
POWHATAN COUNTY
3
0
1
0
0
PRINCE EDWARD COUNTY
10
3
11
0
0
PRINCE GEORGE COUNTY
12
0
0
0
0
PRINCE WILLIAM COUNTY
414
61
139
0
0
PULASKI COUNTY
6
1
2
0
0
RAPPAHANNOCK COUNTY
2
0
0
0
0
RICHMOND CITY
171
24
64
1
1
RICHMOND COUNTY
0
0
0
0
0
ROANOKE CITY
72
3
1
0
0
ROANOKE COUNTY
19
2
3
0
0
ROCKBRIDGE COUNTY
0
0
1
0
0
ROCKINGHAM COUNTY
21
5
13
0
0
RUSSELL COUNTY
3
1
1
0
0
SALEM CITY
3
0
0
0
0
SCOTT COUNTY
1
1
4
0
0
SHENANDOAH COUNTY
18
2
6
0
0
SMYTH COUNTY
2
0
0
0
0
SPOTSYLVANIA COUNTY
65
4
10
0
0
STAFFORD COUNTY
97
17
36
1
1
STAUNTON CITY
4
0
0
0
0
SUFFOLK CITY
40
15
38
0
0
SURRY COUNTY
1
0
0
0
0
SUSSEX COUNTY
2
1
3
0
0
TAZEWELL COUNTY
4
1
1
0
0
VIRGINIA BEACH CITY
165
21
69
0
0
WARREN COUNTY
14
2
5
0
0
WASHINGTON COUNTY
5
2
6
0
0
WAYNESBORO CITY
3
0
0
0
0
WESTMORELAND COUNTY
1
0
0
0
0
WILLIAMSBURG CITY
11
1
0
0
0
WINCHESTER CITY
24
2
2
0
0
WISE COUNTY
2
1
2
0
0
WYTHE COUNTY
3
0
0
0
0
YORK COUNTY
22
11
41
0
0
3765
562
1318
3
3
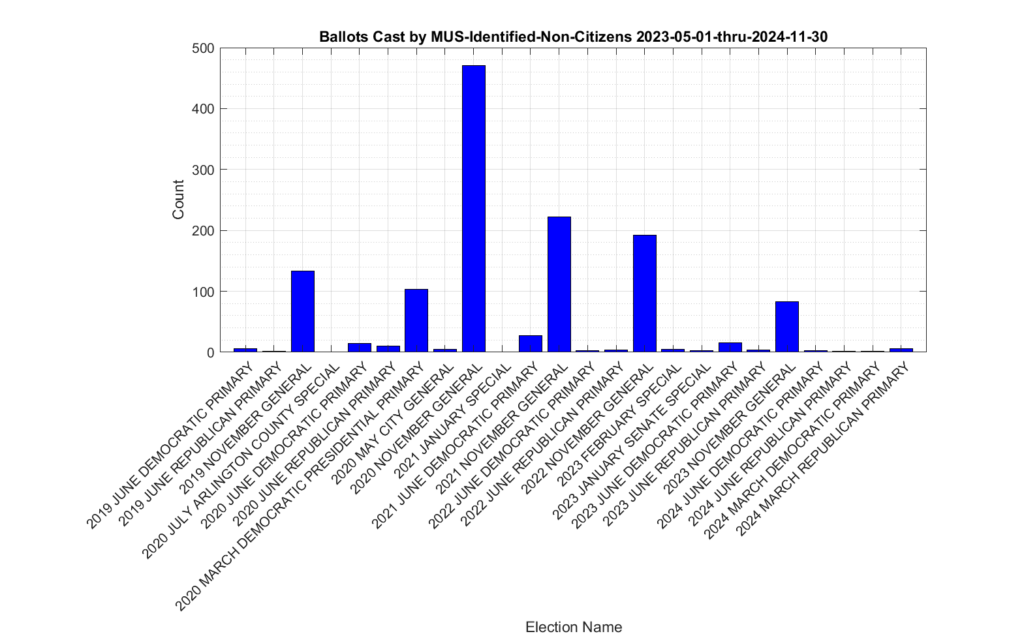
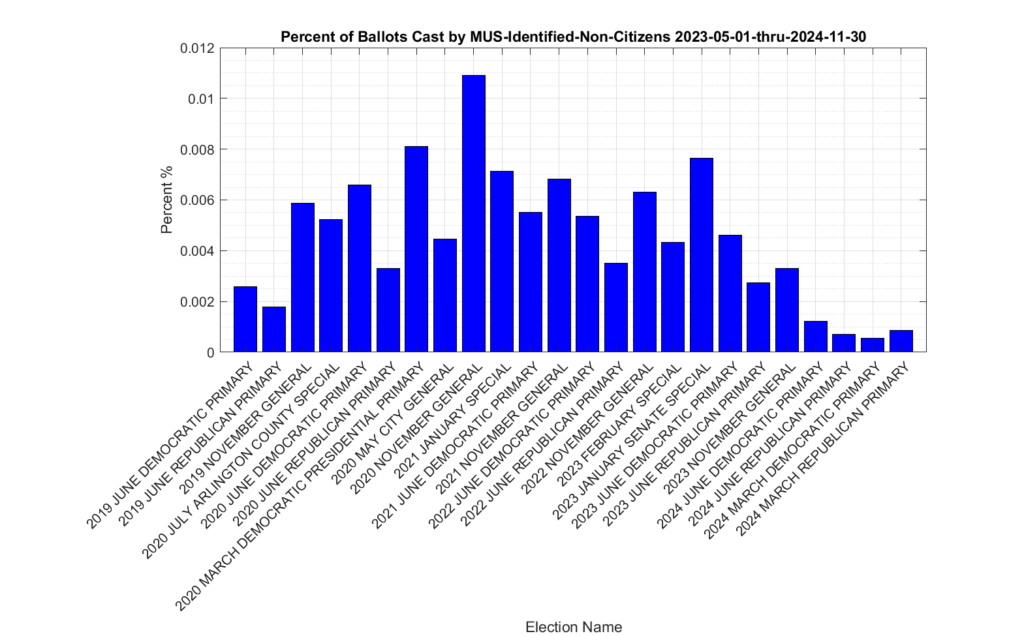
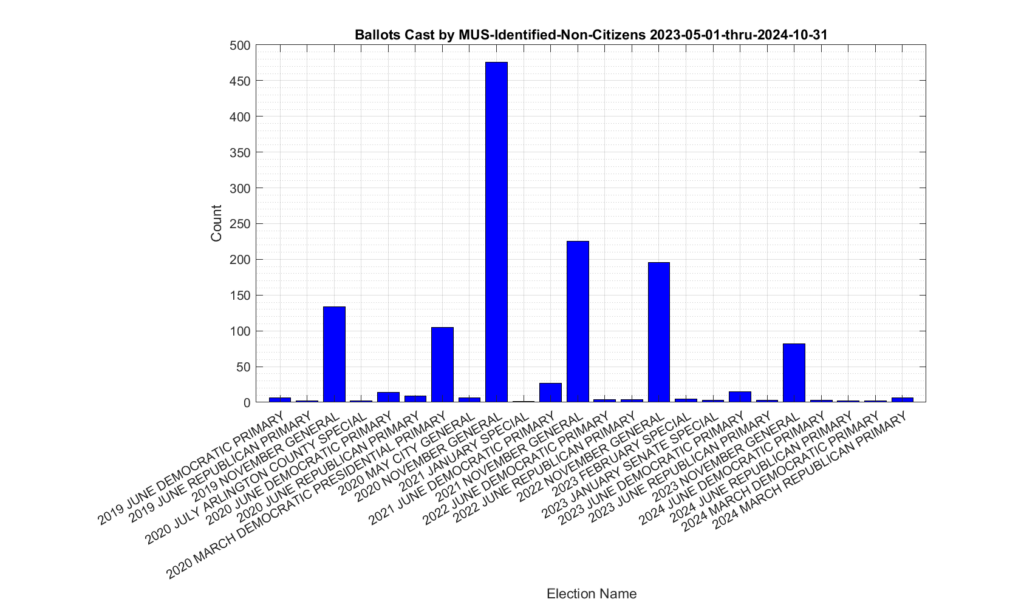
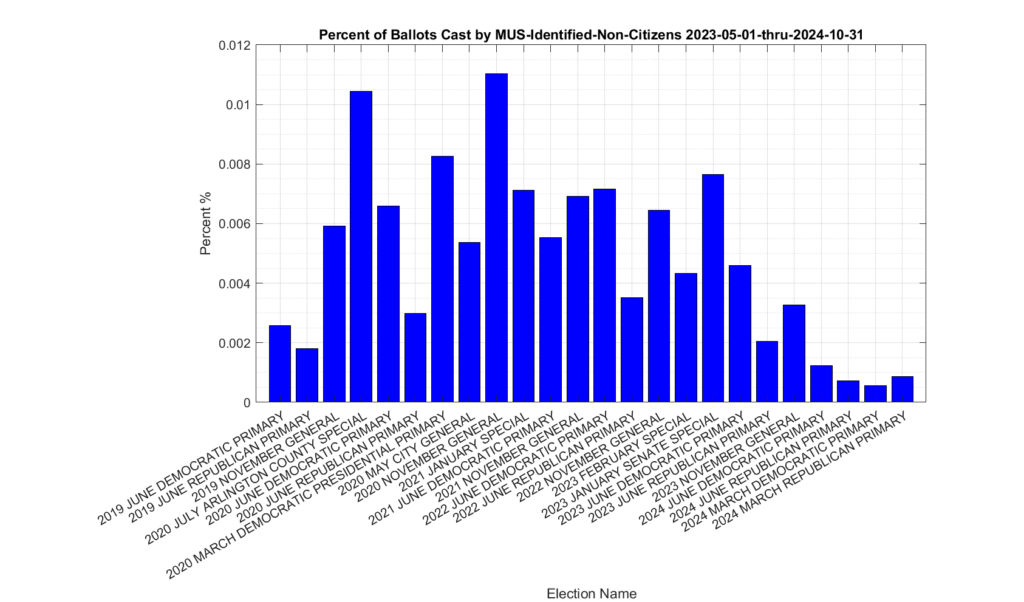
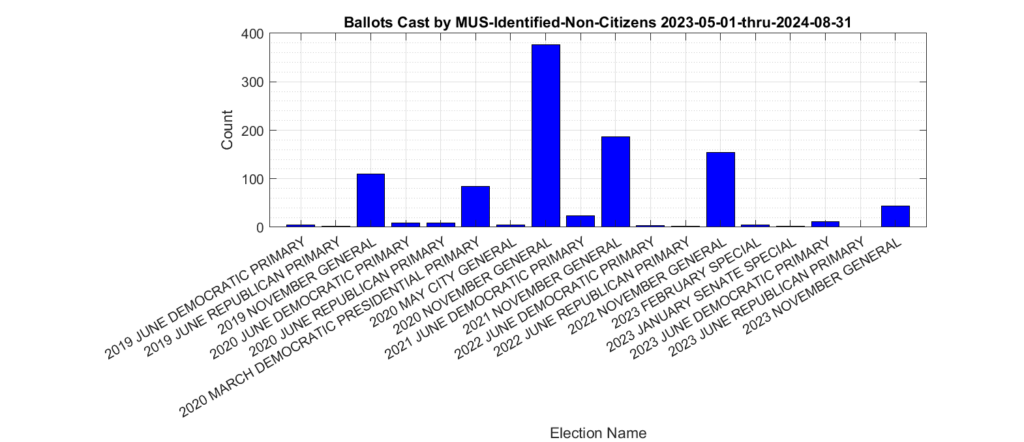
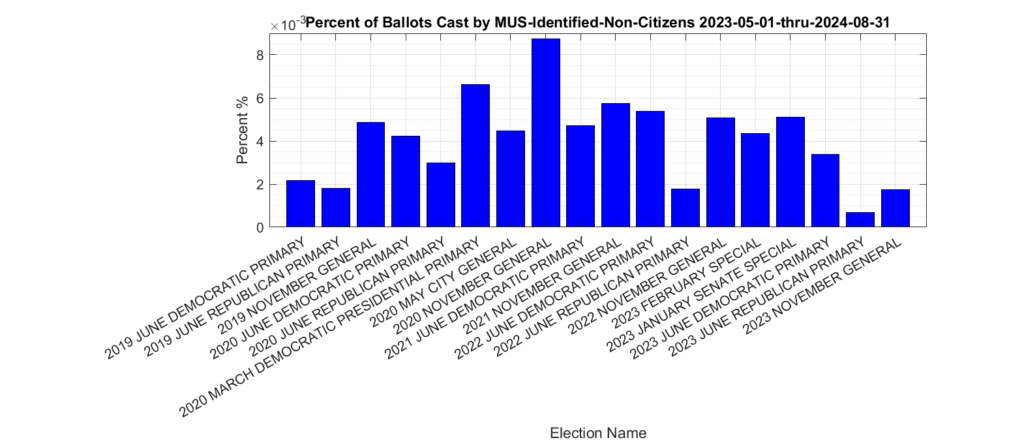
The distribution of the 1,318 ballots that were identified as being cast by non-citizen voters (the yellow trace in Figure 1) in previous elections is shown in Figure 2. The most significant spikes are in the 2019, 2020, 2021 and 2022 November General elections, as well as the 2020 March Democratic presidential primary. Figure 3, which shows this distribution as a percentage of votes cast. Please note the scale of the Y-axis on the percent plot in Figure 3 is in percent of total ballots cast in each election. These graphs were only produced for the VHL data, and do not include the DAL identified records.
Figure 2: Distribution of identified non-citizen ballots cast in previous elections.
Figure 3: Distribution of identified non-citizen ballots cast in previous elections as percent of total ballots cast, according to entries in the VHL/DAL data files.
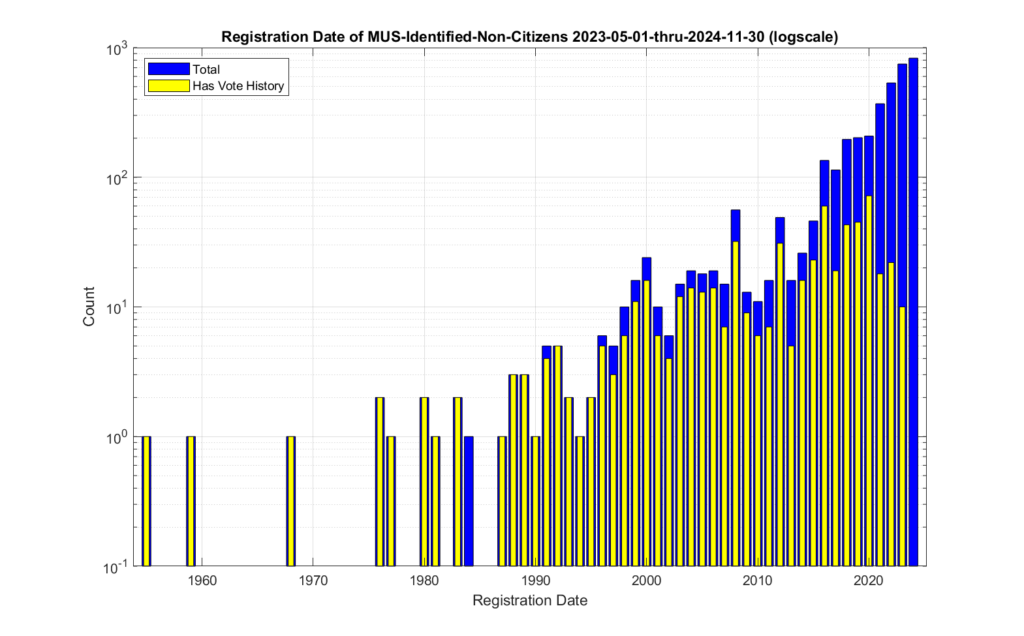
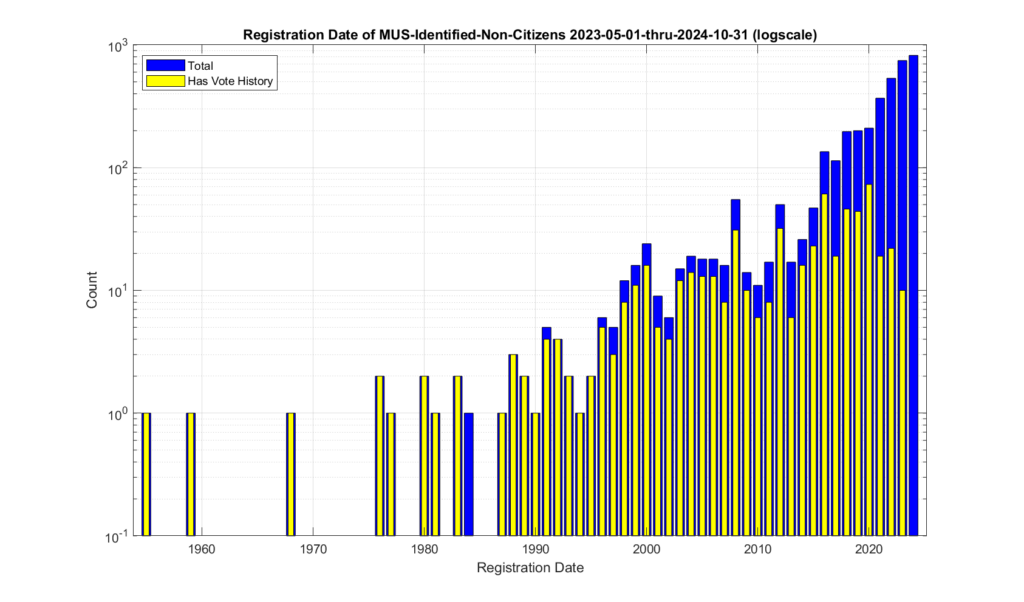
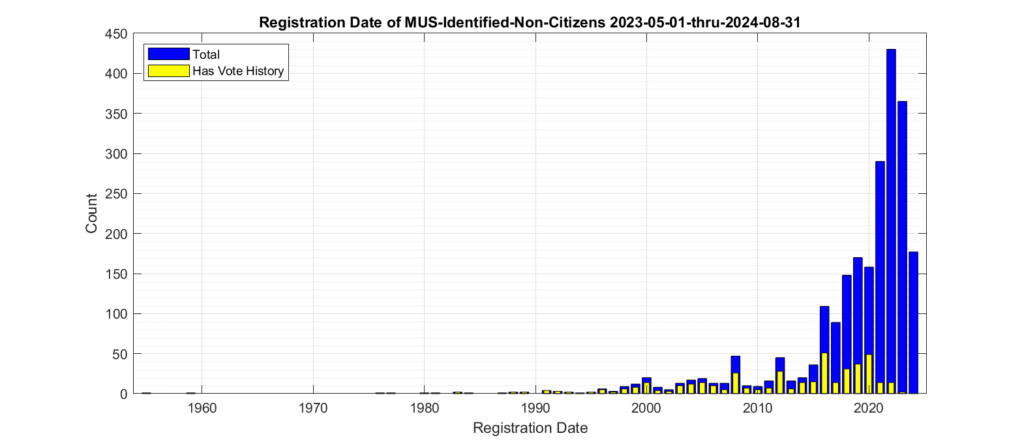
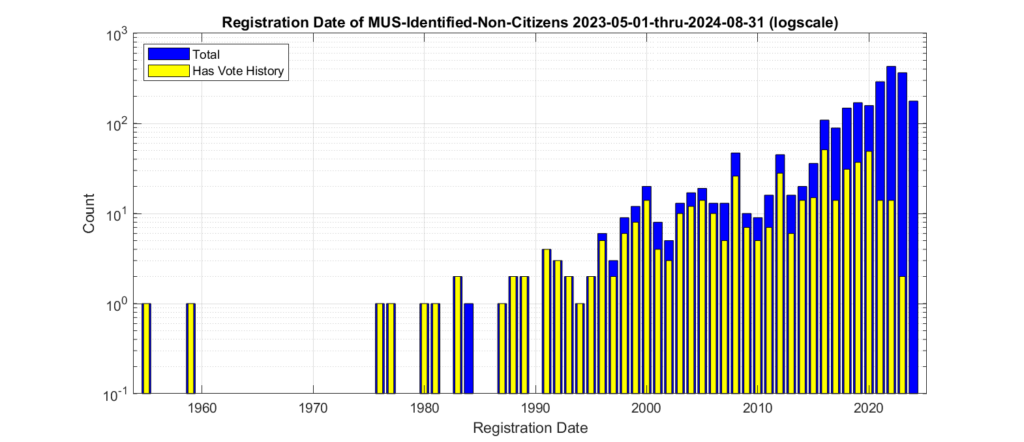
Figures 4 and 5 show the distribution of the registration dates of the identified non-citizen records. The same data is plotted in figure 4 and 5, with the only difference being the scale of the Y-axis in order to better observe the dynamic range of the values. When we look at the registration date of these identified records, we see that there is a distinct relative increase starting around 1996, and then again around 2012.
Figure 4: Registration dates of the identified non-citizen records. Absolute count on y-axis.
Figure 5: Registration dates of the identified non-citizen records. Logarithmic Y-axis scale.
EPEC made a FOIA request to the VA Attorney General’s office on March 11, 2024 inquiring for any records regarding how many prosecutions for non-citizen voting had occurred since June of 2023. We received a response that the AG had no such relevant records.
EPEC subsequently submitted our March analysis dataset to the VA AG’s office upon their request. We have heard no updates or status as to any action taken by the AG’s office since that time, except that it is being considered an ongoing investigation.
Discussion
It appears from the MUS data, that the VA Department of Elections (ELECT) is doing routine identification, cleanup and removal of non-citizen registrations, which is a good thing and we commend them for their continued efforts to maintain clean voter registration lists.
Given the current court cases filed by LWV and DOJ against the state of VA on the matter, it is important to note that the records identified in the MUS are only those resulting from individuals self-identifying as a non-citizen via interactions with DMV, ELECT, or other official avenues.
The fact that a small number of these identified non-citizen registrations are also associated with (presumably … if the data from ELECT is accurate) illegally cast ballots in previous elections does raise a number of questions that citizens should be (politely) asking and discussing with their legislators, elected and appointed government officials. Each act of non-citizen voting is a de-facto disenfranchisement of legal voters rights, and is a punishable offense under VA law.
Q: How did these registrants get placed onto the voter rolls in the first place?
Q: What method and/or data sources are used by the state to identify non-citizen registrations for removal? If that process is exhaustive, and covers all registrations, then these numbers might be considered to represent a statistical complete picture of the problem. If that process is not exhaustive, in that it only uses serendipitous corroborating data sources, then these results likely under-represent the scale of the issues.
Q: As noted above, we are only considering here those individuals who have not had their records re-instated or reactivated after a determination of non-citizen status. We do not have enough information to determine how or why some records were first determined to be non-citizen, canceled and then subsequently re-instated. One potential area of concern is determining whether or not registrants might be falsely or errantly claiming to not be a citizen on official documents in order to be excused from jury duty, for example, and then work to re-instate their voting status once those documents percolate through the system to ELECT and are flagged for removal. This is a wholly separate but serious issue, as making false claims on official documents is itself a punishable offense.
Q: What procedures, processes and technical solutions are in place to prevent current or future registration and casting of ballots by non-citizens? This is especially pertinent given the current state of the flow of illegal immigrants crossing our national borders. According to a recent report by Yahoo Finance, VA is one of the top 30 destinations for illegal migrants, with both Loudoun County and Fairfax making the list.
Q: Why have none of the identified non-citizens who also cast ballots been investigated or prosecuted under VA Code 24.2-1004? As the identification of these ballots comes directly from looking at the official records produced by ELECT, it seems prudent for these to be forwarded by ELECT to the AG’s office with a recommendation to investigate and prosecute. Yet our FOIA request to the VA AG’s office inquiring as to any records associated with these types of investigations or prosecutions produced a “no relevant records exist” response. And since we submitted this information to the AG’s office, there has been no follow up.
Additionally, this evidence which is derived from only official state records, directly contradicts multiple news media reports and attestations that non-citizen voting is a “Myth”, and that non-citizen voting happens “almost never”. If the data from ELECT is accurate, then there are at least 1,318 ballots that have been cast by non-citizen voters just since 2019. Now, that is still very infrequent, but it is not “almost never.” It is a legitimate concern … and these discoveries are only the registrations that have been found and removed from the voter roles by ELECT and that we can observe in the data. We do not know how many exist that we do not know about.
It should be reiterated that these are only the records that we can observe given our data repository, and how often we can realistically purchase and acquire voter history and voter registration information. It is therefore likely that this represents a significant undercount of the occurrences of non-citizen voters and non-citizen voting.
It costs us (EPEC) approximately ~$5K for each purchase of the statewide voter history list, and approximately $15K/year to maintain RVL records using a single baseline full purchase + 2 purchases of the 6mo MUS subscription. Due to the infrequent nature of these data purchases, it is very likely that some individuals have had their voter history or voter registration information completely removed from the record in between our purchases. Additionally, we know that the MUS data does not entirely encompass all transactions performed on the RVL by the department of elections, so there may be yet other unknown transactions that we are missing.
For information that is supposed to be publicly available (according to federal NVRA laws), the state has put up significant hurdles in order for citizens and organizations to acquire it for use it for ensuring transparency and integrity of our electoral process. If we are to have elections that are transparent and accountable to the public, then we must insist that the data be made available and accessible.
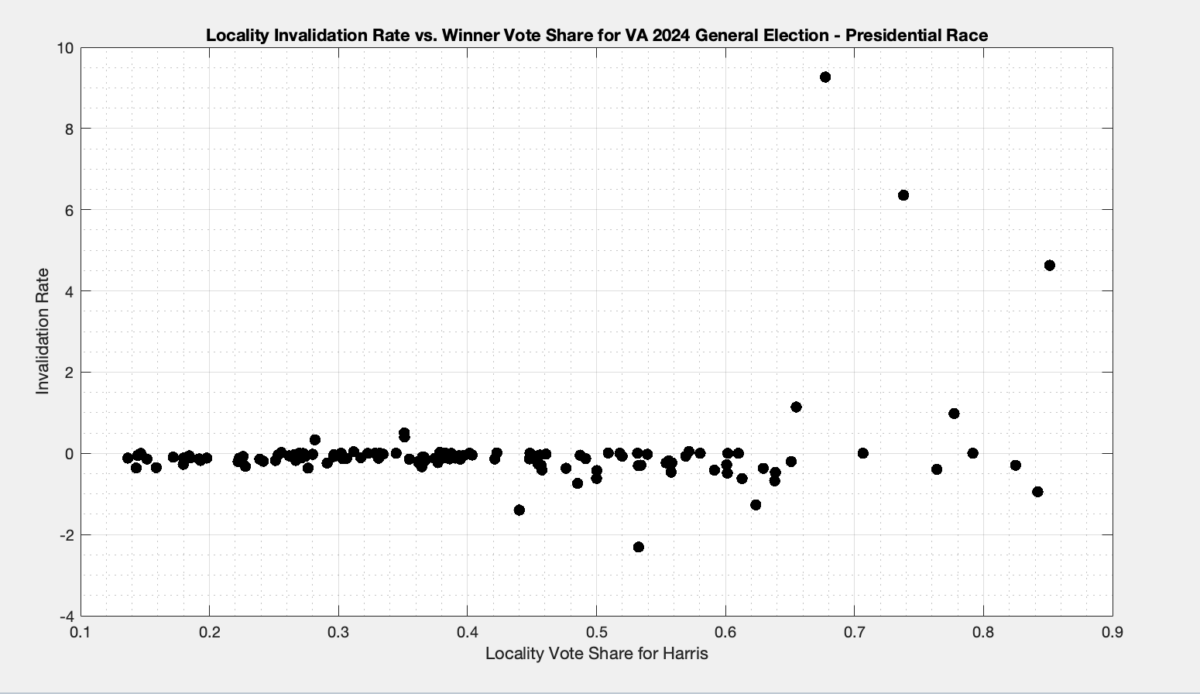
Using data published by the VA Department of Elections (“ELECT”), we plotted the Ballot Invalidation Rate (BIR) vs. the % of vote share for the winner in order to attempt to determine if “Differential Invalidation” of ballots occurred in the 2024 VA General Election. The plotted data appears to show differential invalidation and suggests that there are underlying issues that should be investigated and addressed, including data reliability and consistency issues where the number of reported total votes cast is greater than the number of reported ballots cast for some localities.
Details
“Differential invalidation” takes place when the ballots of one candidate or position are invalidated at a higher rate than for other candidates or positions. Note that differential invalidation does not directly indicate any sort of fraud. It is however indicative of an unfairness or inequality in the rate of incomplete or invalid ballots conditioned on candidate choice. While it could be caused by fraud or malfeasance, it could also be caused by confusing ballot layout, poor procedural controls and uniformity, under-voting (not choosing a candidate) by the voter, or other compounding factors, etc. (ref: [1] ch. 6)
The Free and Fair Hypothesis
In a democratic election, each persons vote counts the same. There are other requirements, but this is a necessary condition. In the presense of invalidation, the free and fair hypothesis reduces to each person’s vote having the same probability of being invalidated as any other persons ballot. From a statistical standpoint, this means that the invalidation must be independent of the candidate chosen on the ballot (or of the person voting) [ref: 1, pg. 132]
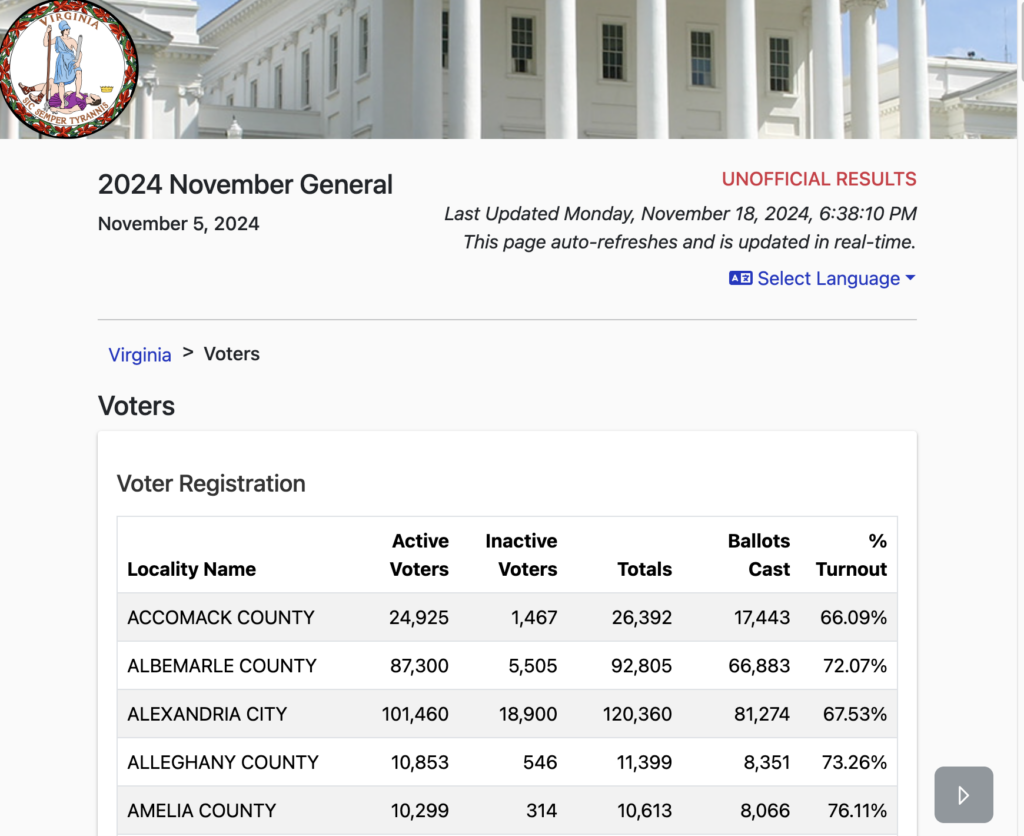
The data used for this analysis was the “unofficial” election results (the certified results are not yet published), and comes directly from the VA Dept of Elections. The data was downloaded on Nov 18th at 4:34 pm. We purposefully waited to perform this analysis until after the localities had completed their canvass operations, and for the data feeds on the VA Department of Elections (“ELECT”) website to mostly stabilize. The actual certified results will not be available until at least Dec 2 after the State Electoral Board meets to finalize the certification. We will revisit this analysis at that time.
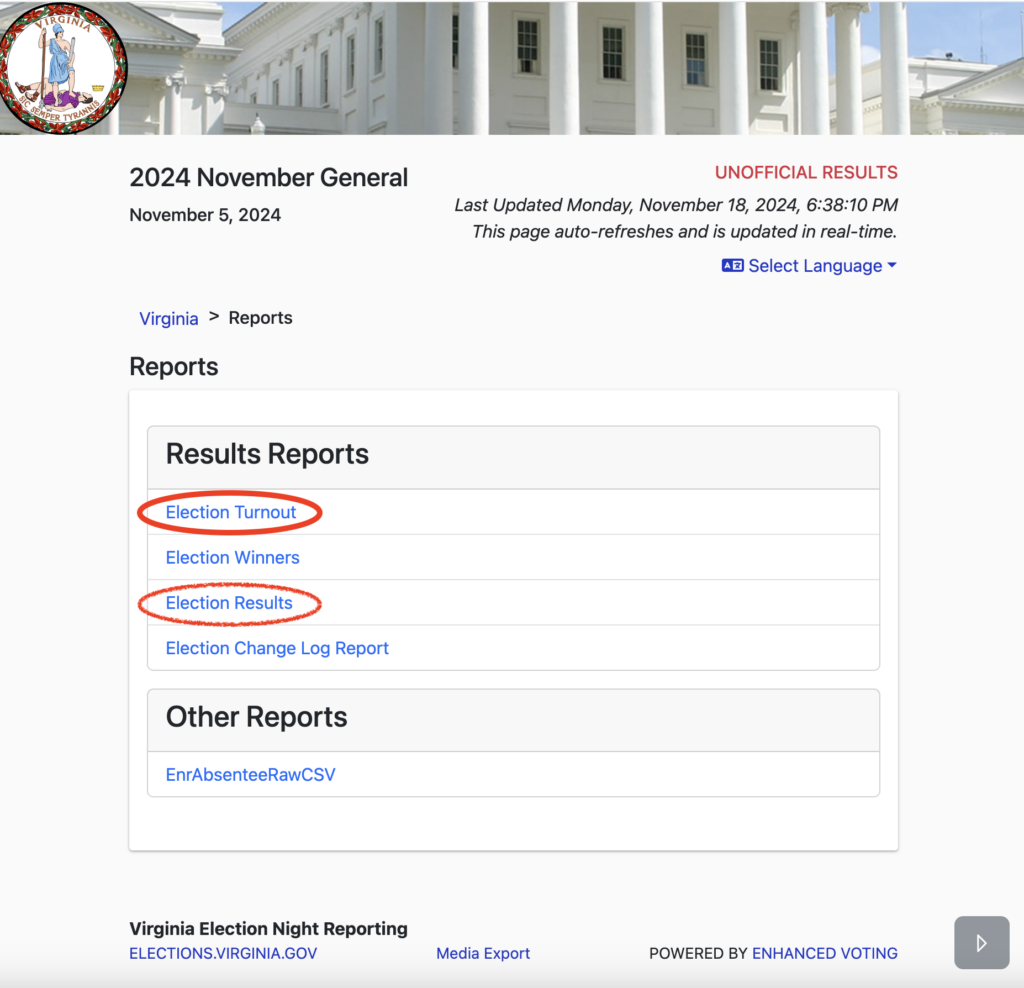
Figure 2: Listing of the link for report CSV files as appeared on the VA Dept of Elections Website on Nov 18 16:34:00 EST at https://enr.elections.virginia.gov/results/public/Virginia/elections/2024NovemberGeneral/reports. Note that additional CSV files for “Election Winners”, “Election Change Log Report”, “EnrAbsenteeRawCSV”, as well as a complete JSON listing under the “Media Export” link at the bottom of the page.
With this dataset in hand we can know how many ballots were cast, as well as how many votes were counted for each candidate in each race in each locality (at least as reported by the state). For a given race, we can then compute the number of incomplete or invalid ballots by subtracting the total number of votes recorded for that race in the locality from the total number of reported ballots cast.
In accordance with the techniques presented in [1] and [2], we computed the plots of the Invalidation Rate vs the Percent Vote Share for the Winner in an attempt to observe if there looks to be any evidence of Differential Invalidation ([1], ch 6). This is similar to the techniques presented in [2], which we have used previously to produce election fingerprint that plotted the 2D histograms of the vote share for the winner vs the turnout percentage. (The 2024 versions are coming, just not ready yet.)
Each dot in Figure 3 below is representing the ballots from a specific locality. The x axis is the percent vote share for the winner (Harris), and the y axis is the ballot invalidation rate, and is computed as 100 – 100 * Nvotes / Nballots.
Figure 3: Plot of the Invalidation rate vs the % of vote share for the winner in each locality in the 20204 VA General Election for President.
A few things are immediately apparent from the plot in Figure 3:
There is clearly a distinction in the invalidation rate between localities that had low vote share and high vote share for harris.
The data for localities where Harris had low vote share do not have a large distribution of invalidation rates, whereas the high vote share localities do.
There are a number of localities that are reporting negative invalidation rates. How is this possible, you ask? Well there are a number of localities in the CSV data that have higher vote totals than the corresponding reported number of total ballots cast in the locality.
This implies that there is something significantly wrong in the data and reporting tools or procedures used by ELECT, as all of this data was pulled nearly simultaneously and therefore the data should be at least self-consistent. While we understand that this is still unofficial data and that new updates may occur over time, at any given point in time the data should at least be self-consistent.
Note that there are still a few localities that have not yet had their vote totals reflected in the CSV files from ELECT. Those localities were omitted from this analysis. The combined information from all of the data source files that was used to generate this plot is available below.
In conclusion there does appear to be some indications that differential invalidation occurred in the 2024 VA General Election for President. Due to data inconsistencies and the fact that this data is still officially “unofficial” it is hard to make any definitive conclusions, but these results are suggestive of the existence of multiple underlying issues that need to be examined, understood and/or resolved. We can definitively say, however, that this is yet another example of the data streams from ELECT lacking self-consistency, which is a big problem in and of itself.
References
[1] Forsberg, O.J. (2020). Understanding Elections through Statistics: Polling, Prediction, and Testing (1st ed.). Chapman and Hall/CRC. https://doi.org/10.1201/9781003019695
[2] Klimek, Peter & Yegorov, Yuri & Hanel, Rudolf & Thurner, Stefan. (2012). Statistical Detection of Systematic Election Irregularities. Proceedings of the National Academy of Sciences of the United States of America. 109. 16469-73. https://doi.org/10.1073/pnas.1210722109.
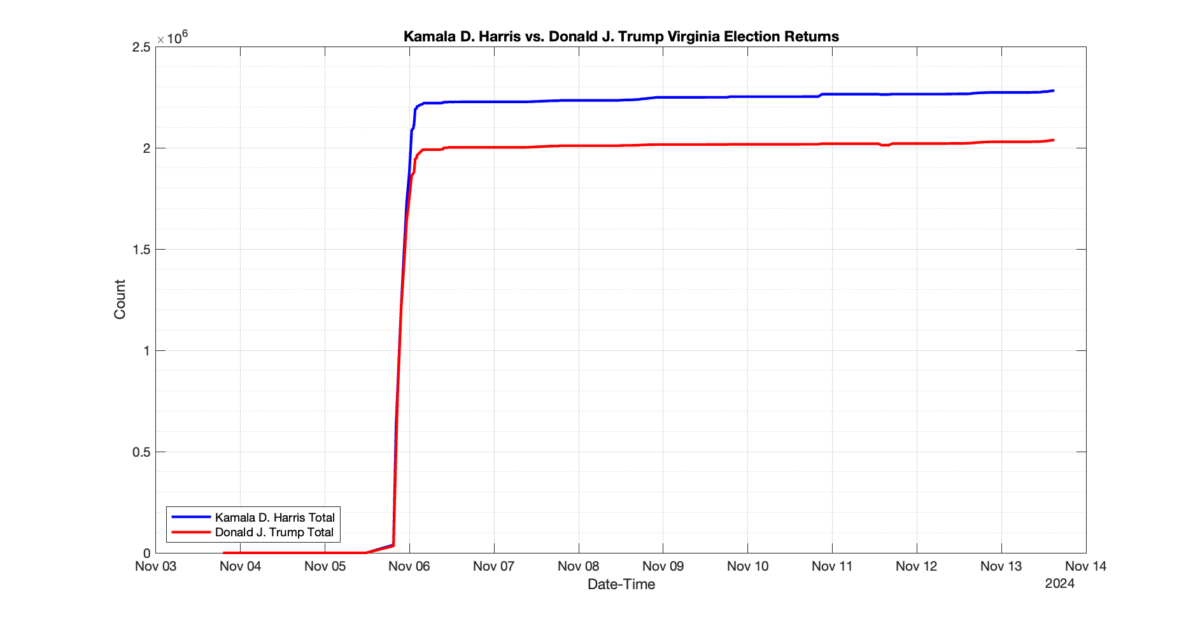
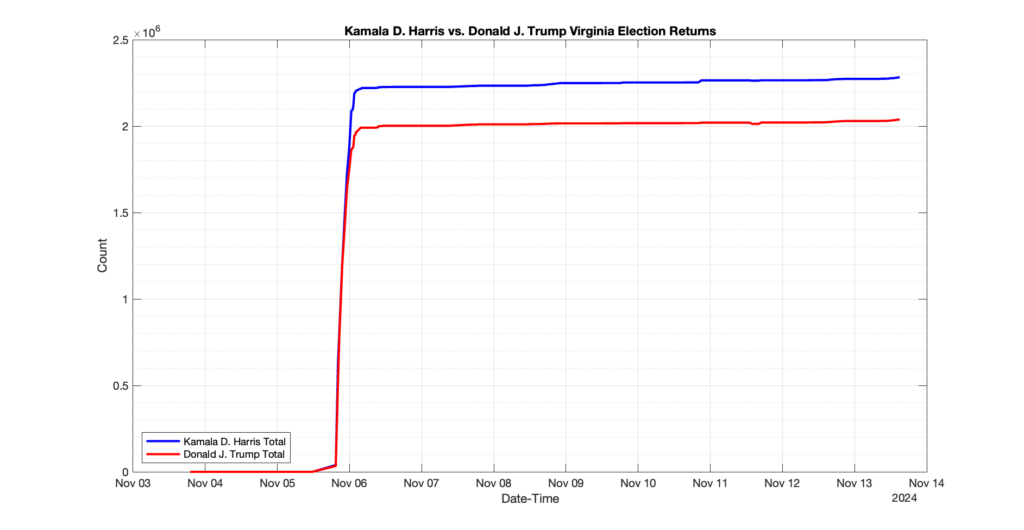
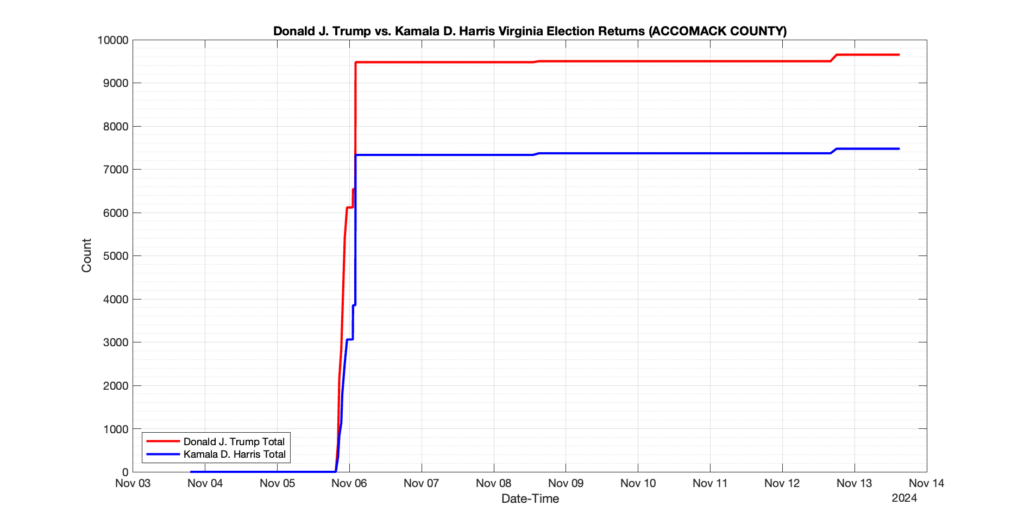
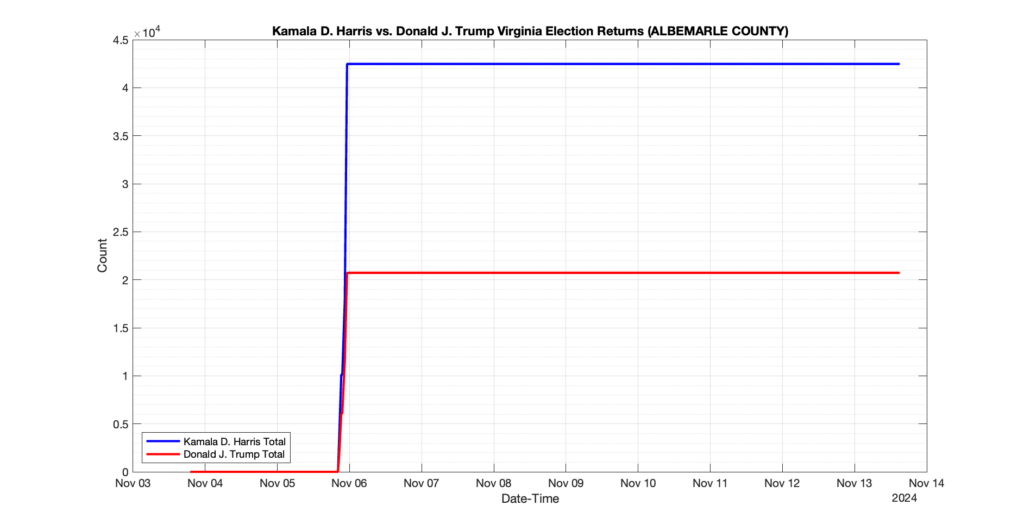
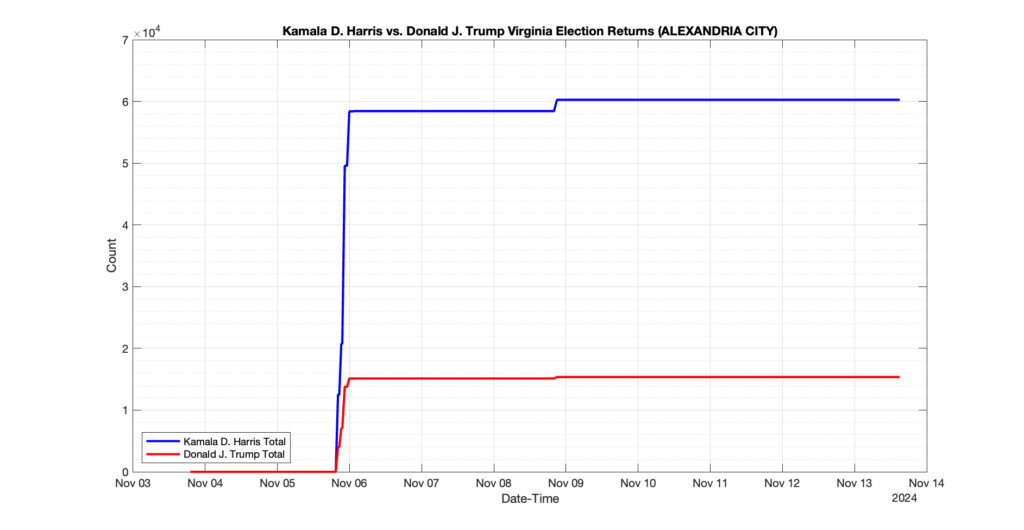
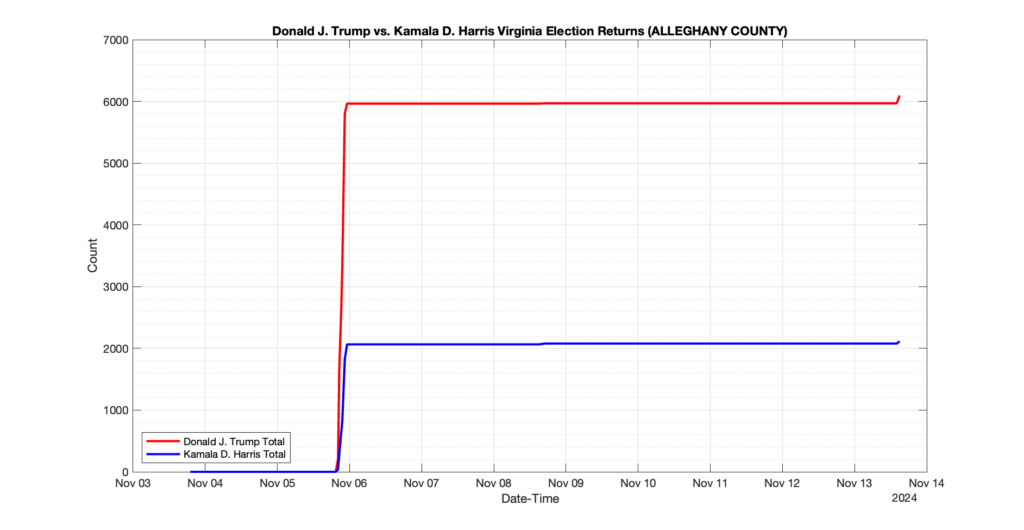
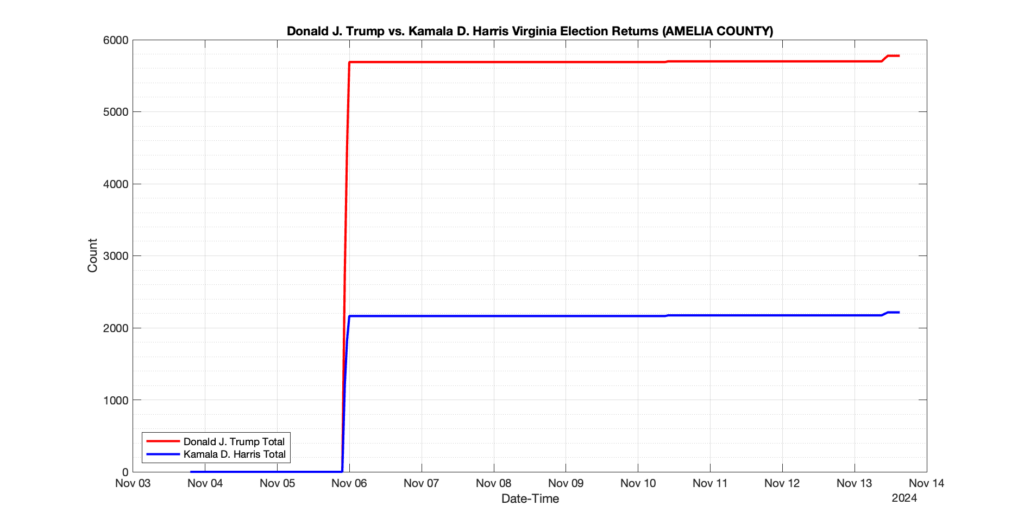
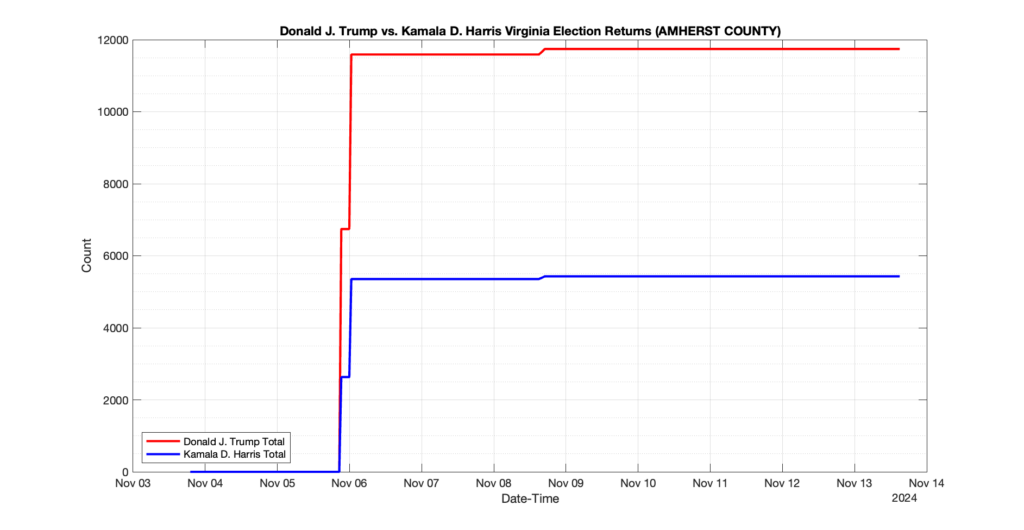
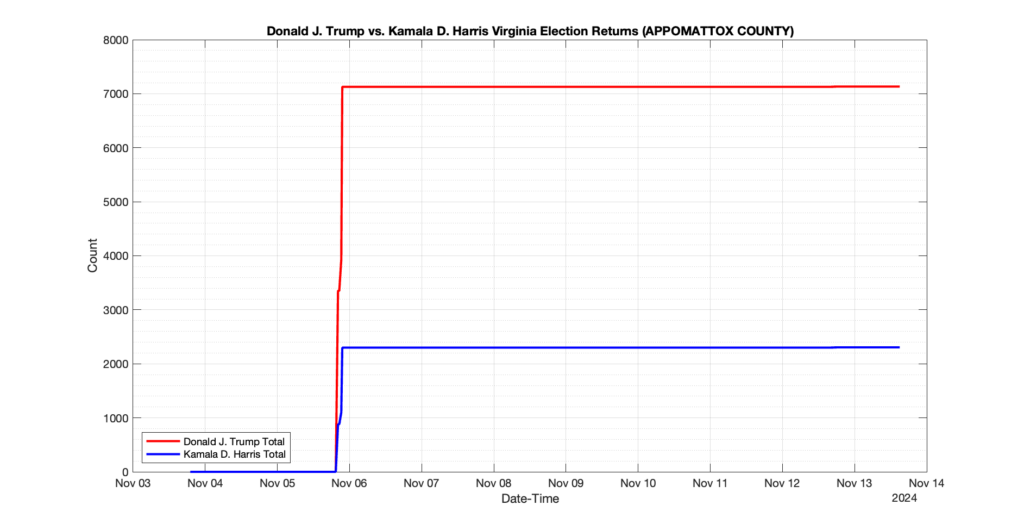
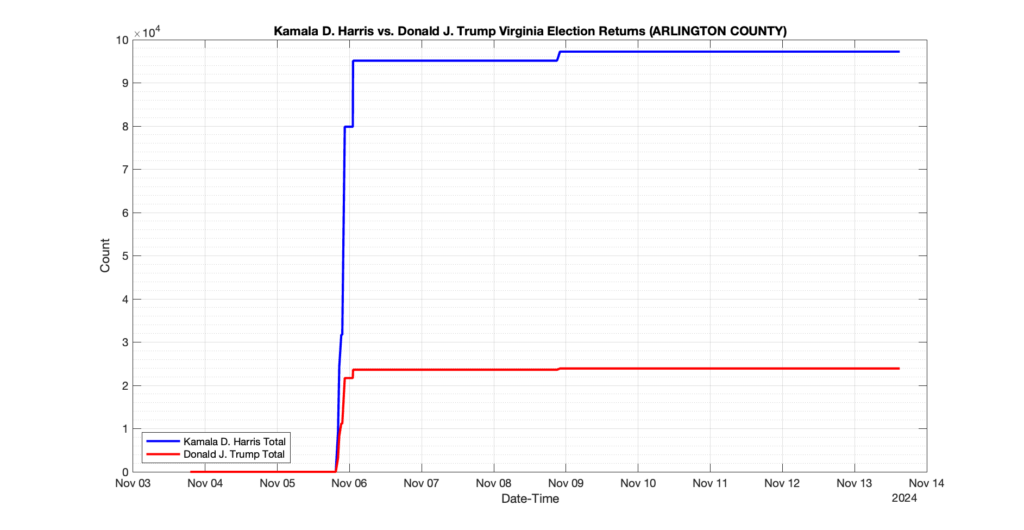
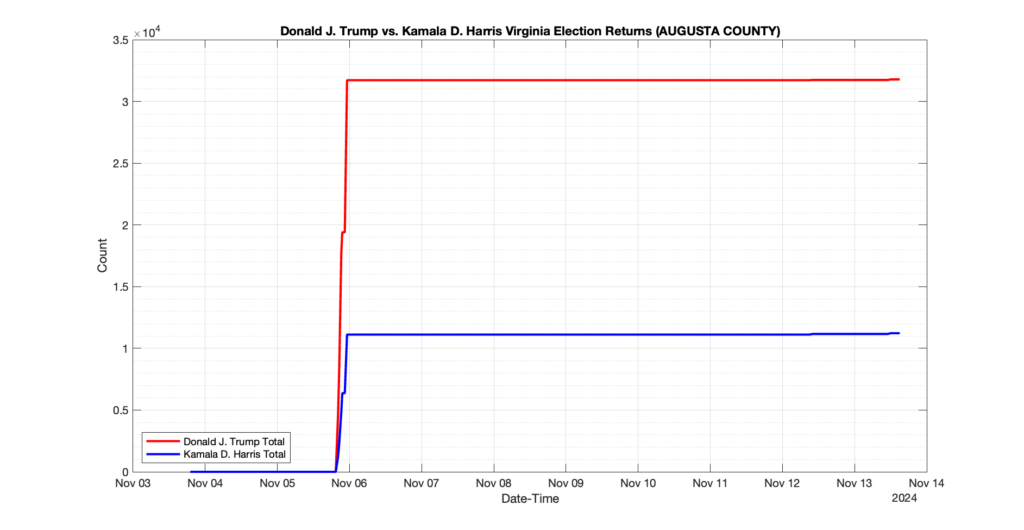
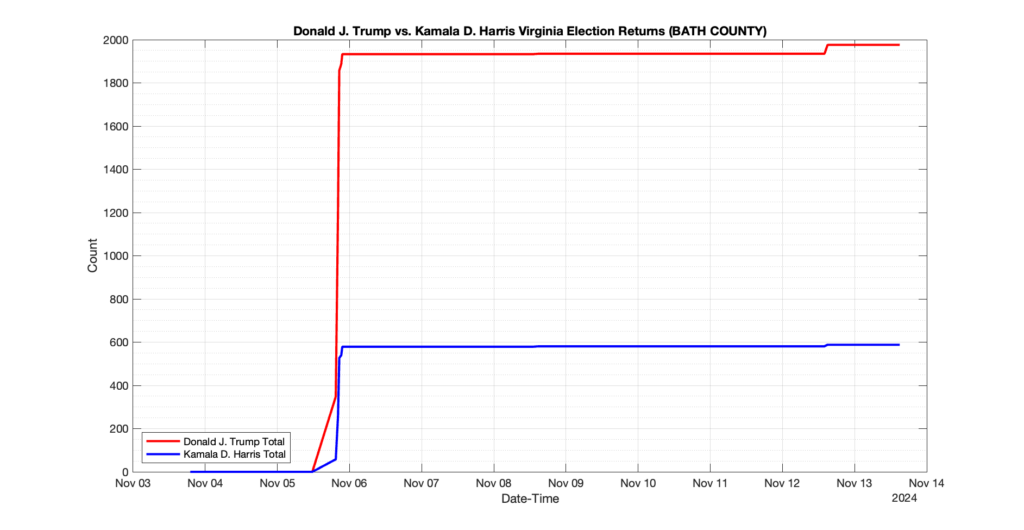
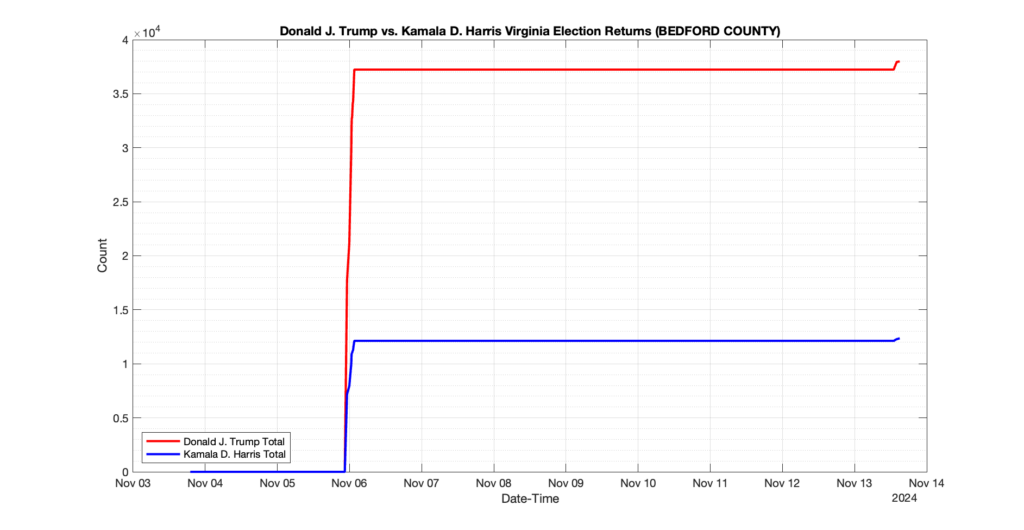
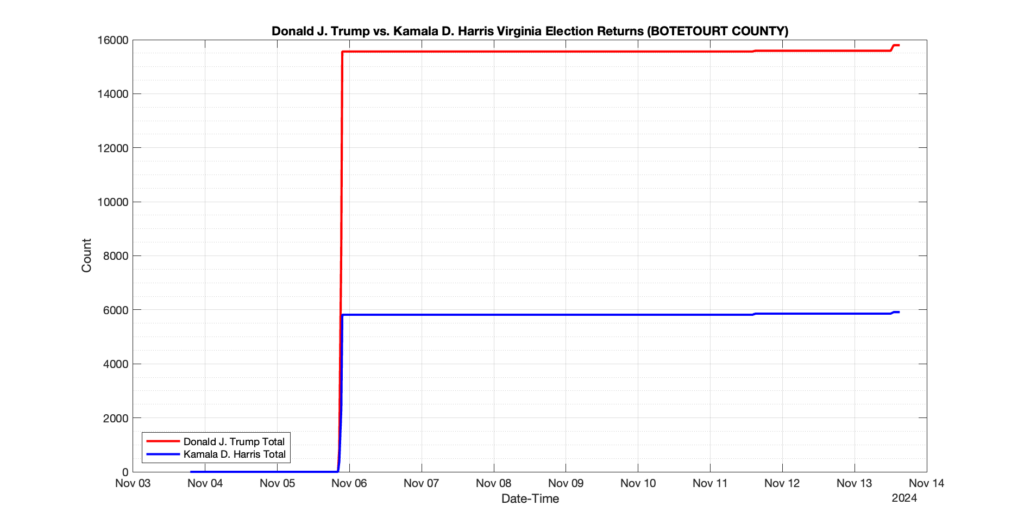
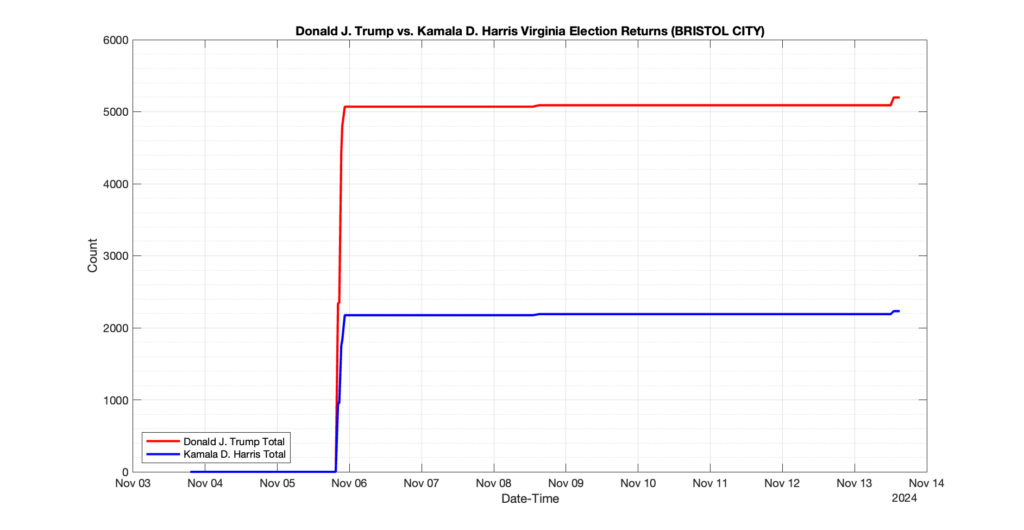
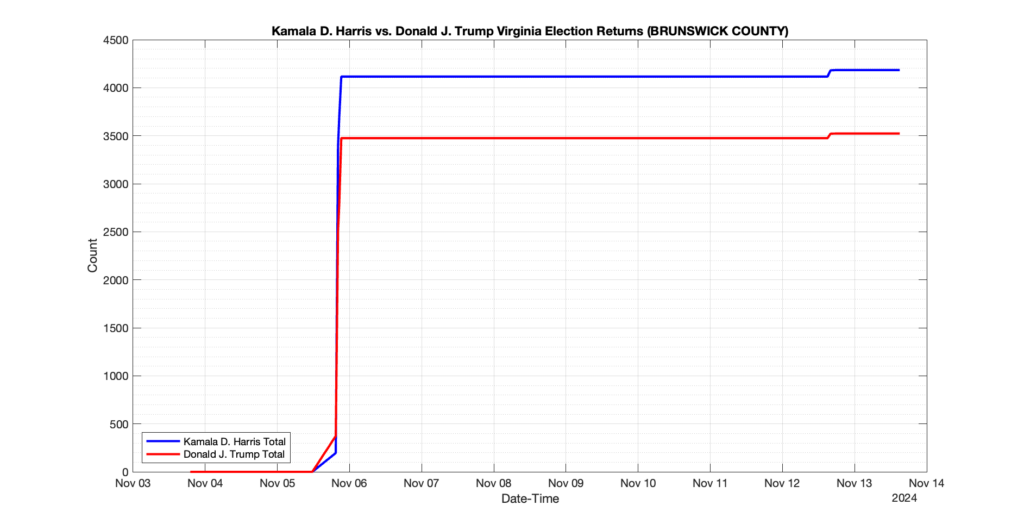
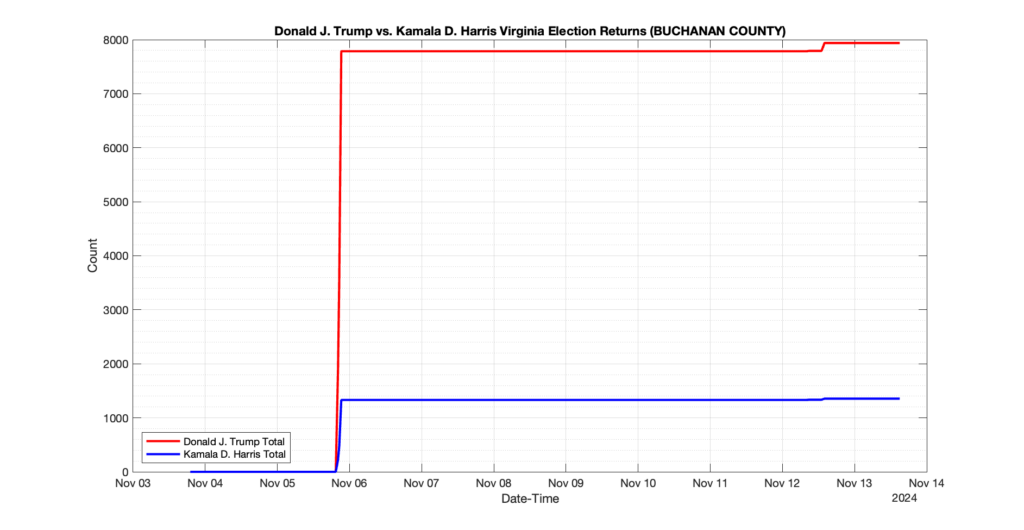
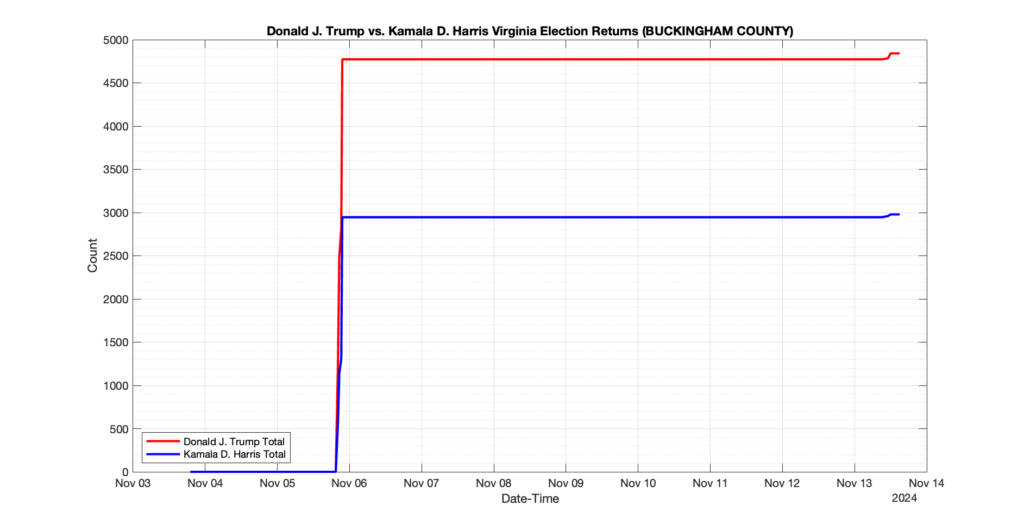
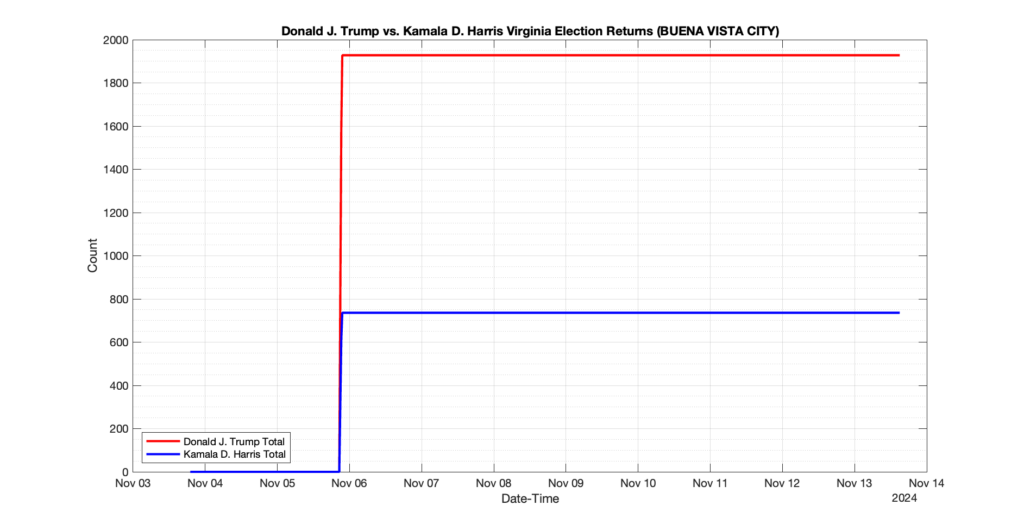
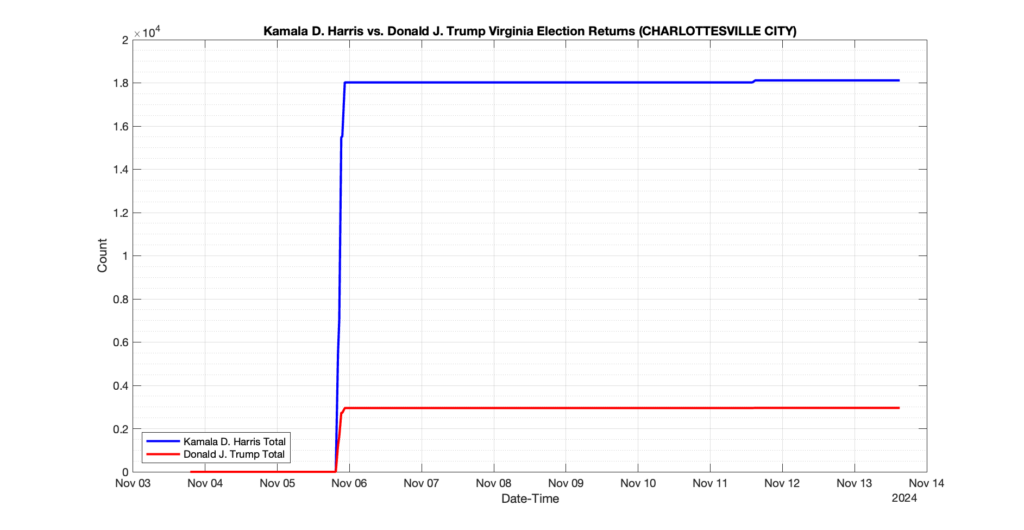
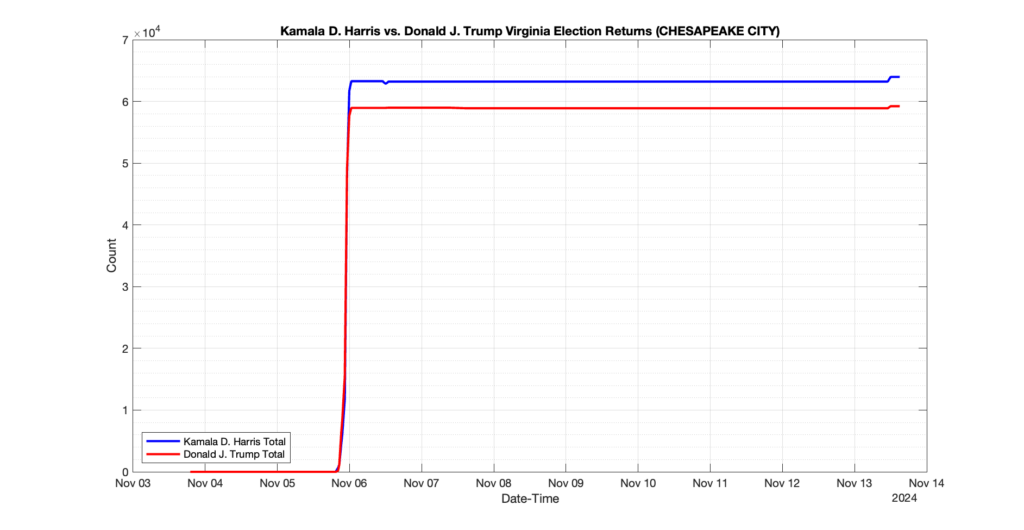
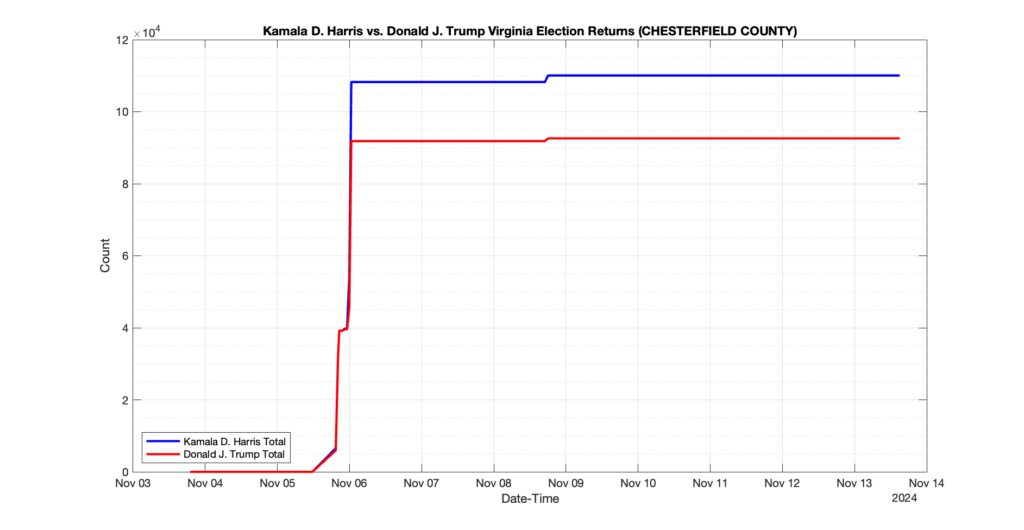
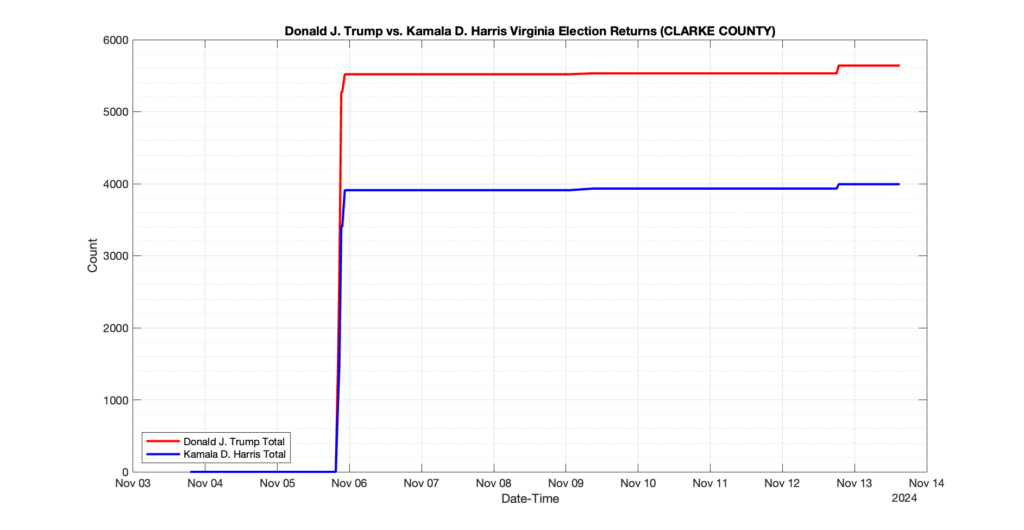
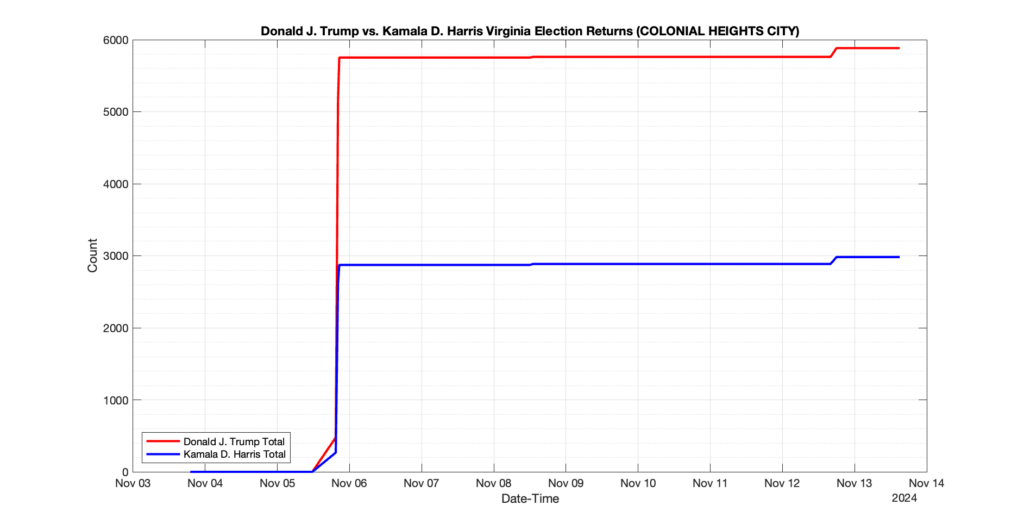
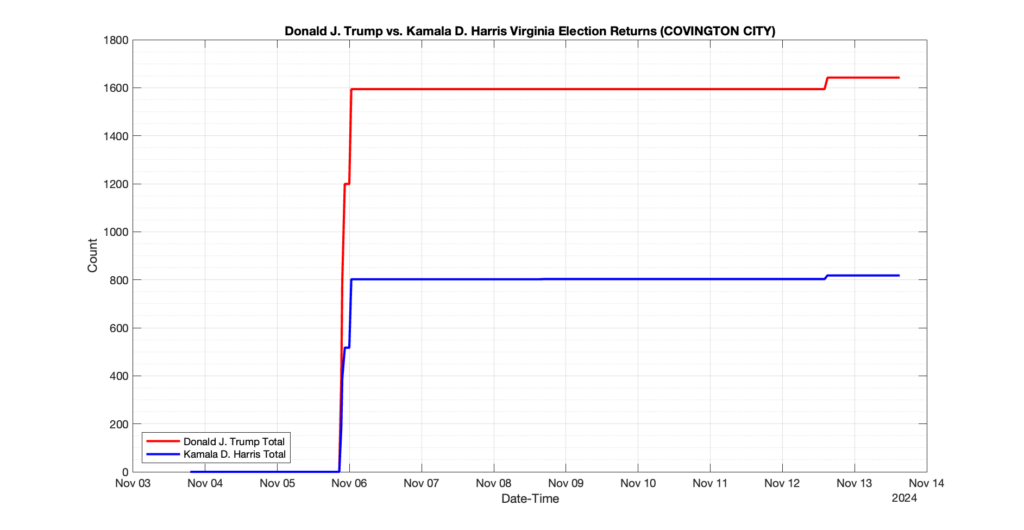
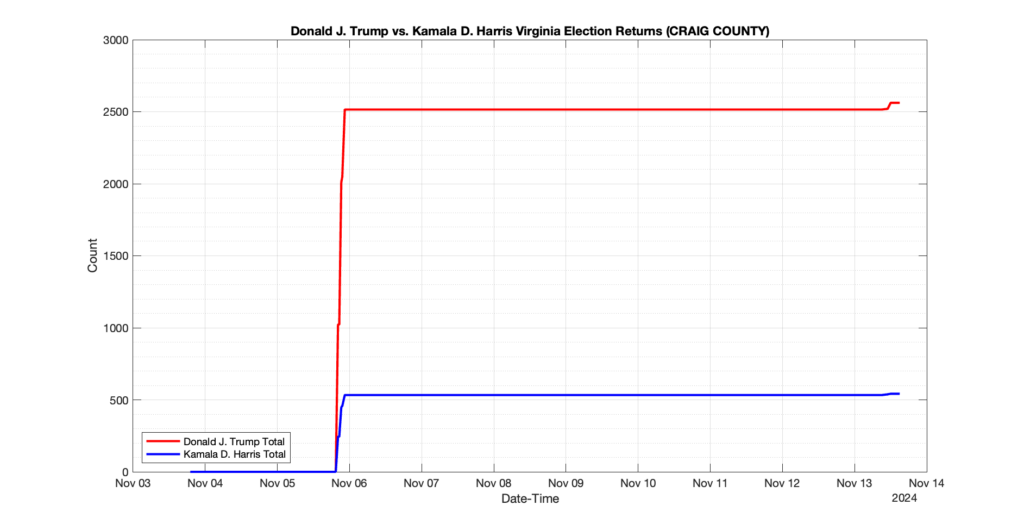
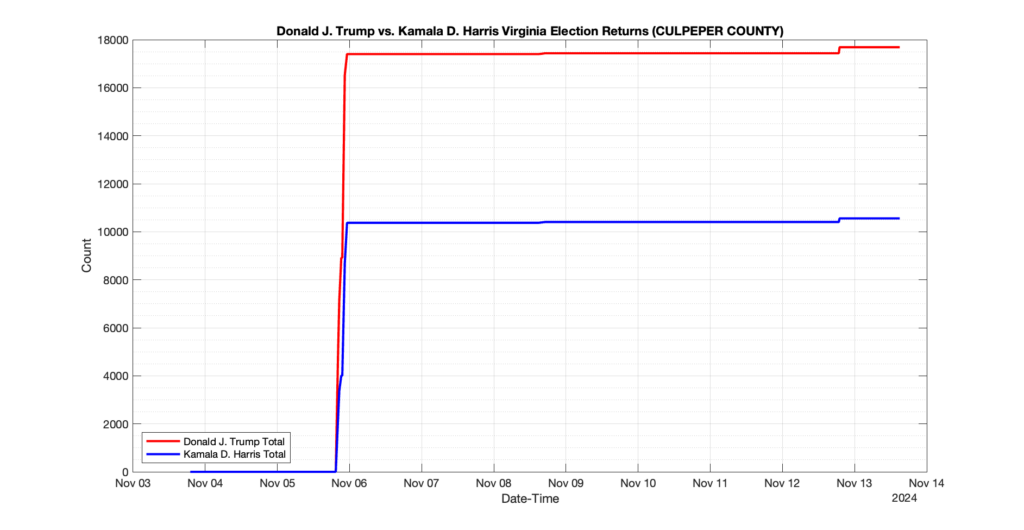
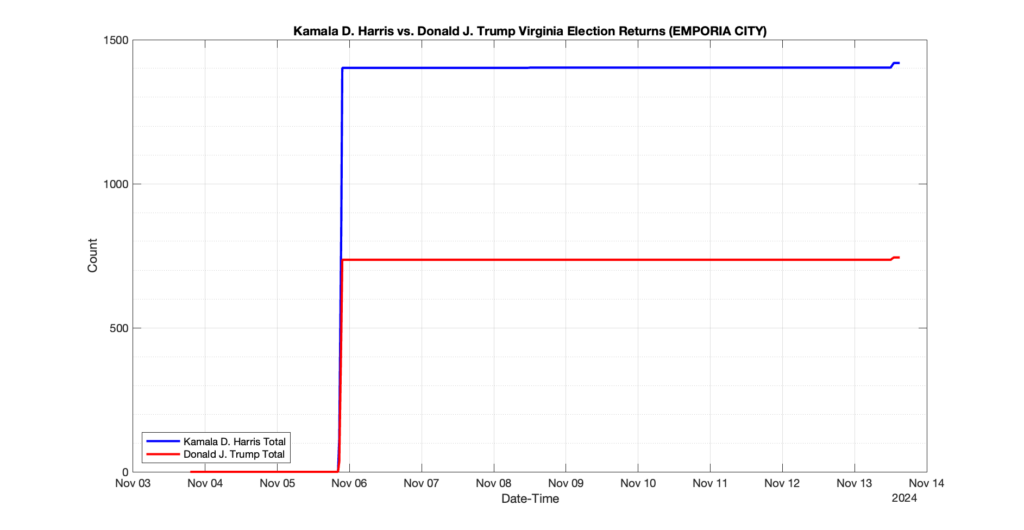
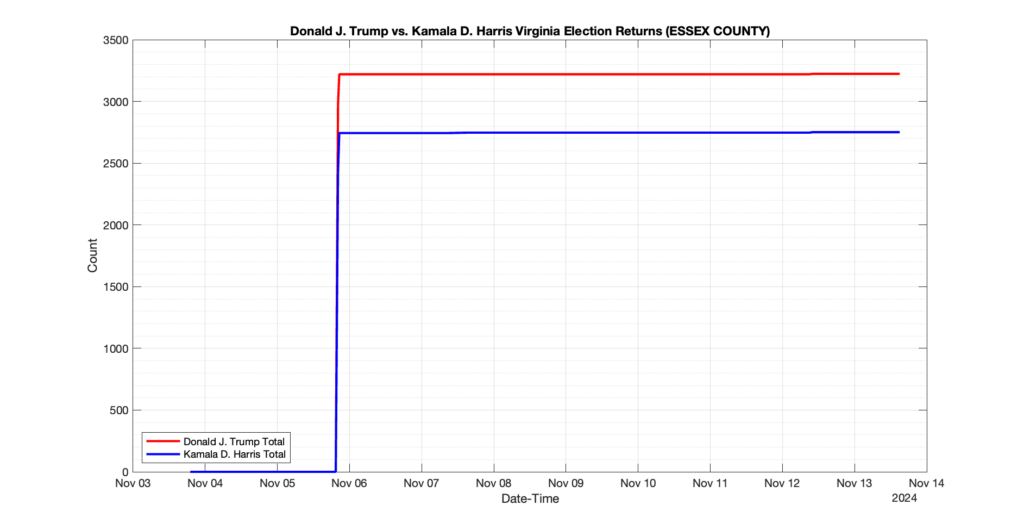
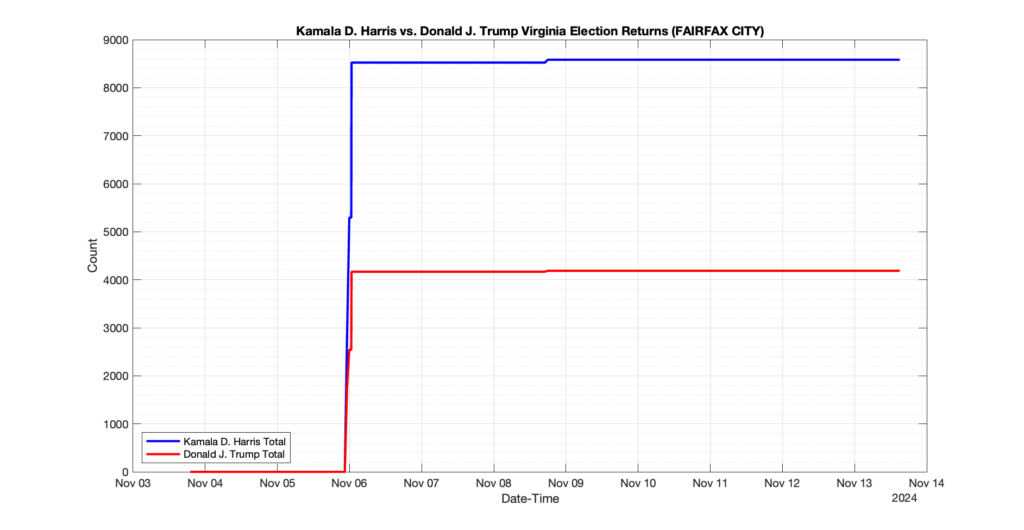
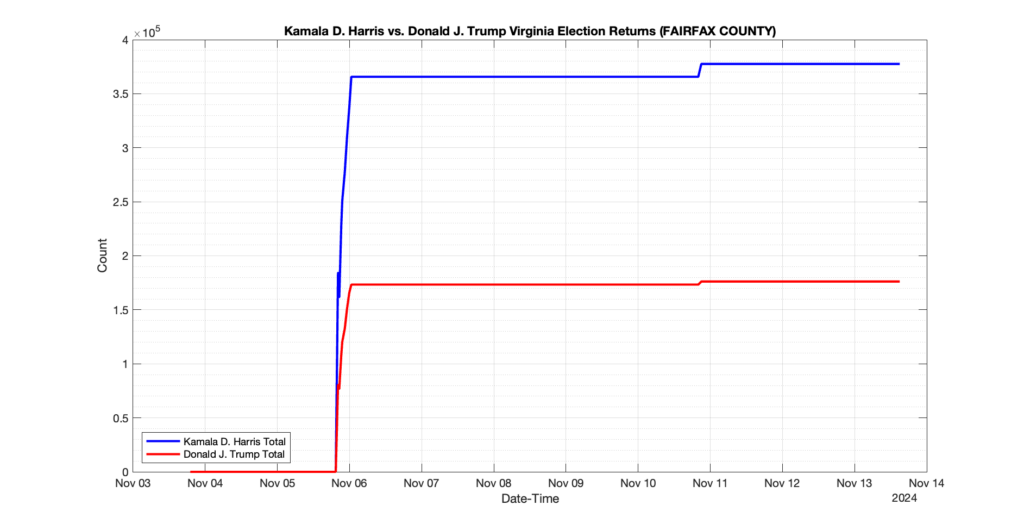
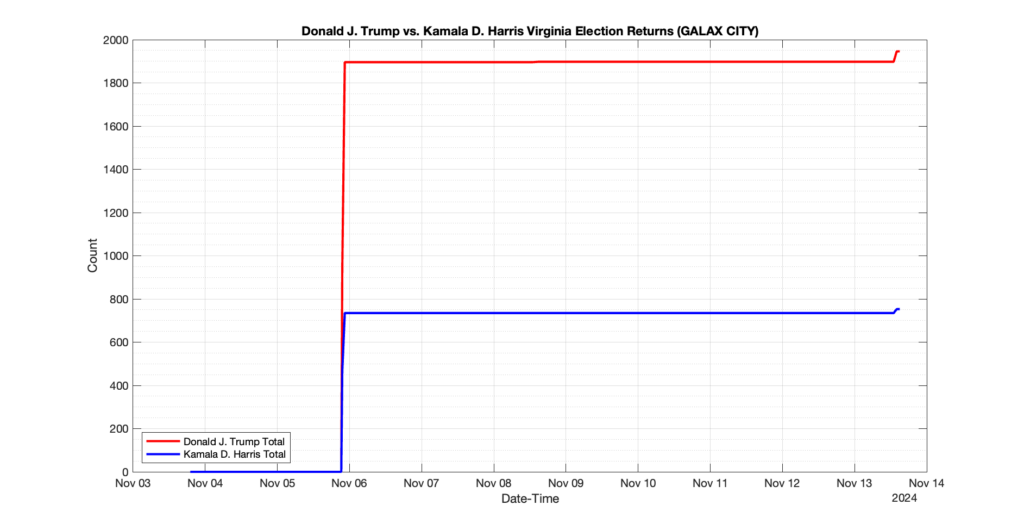
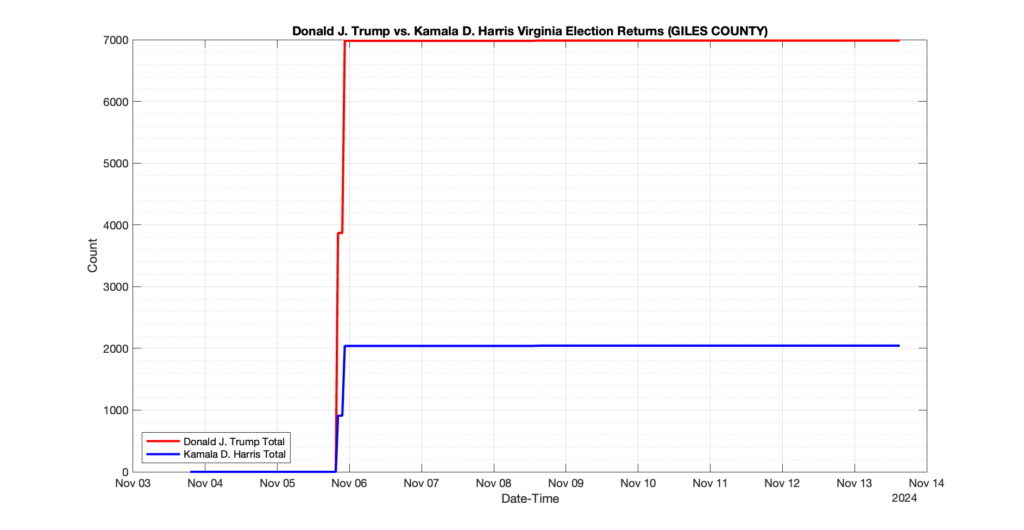
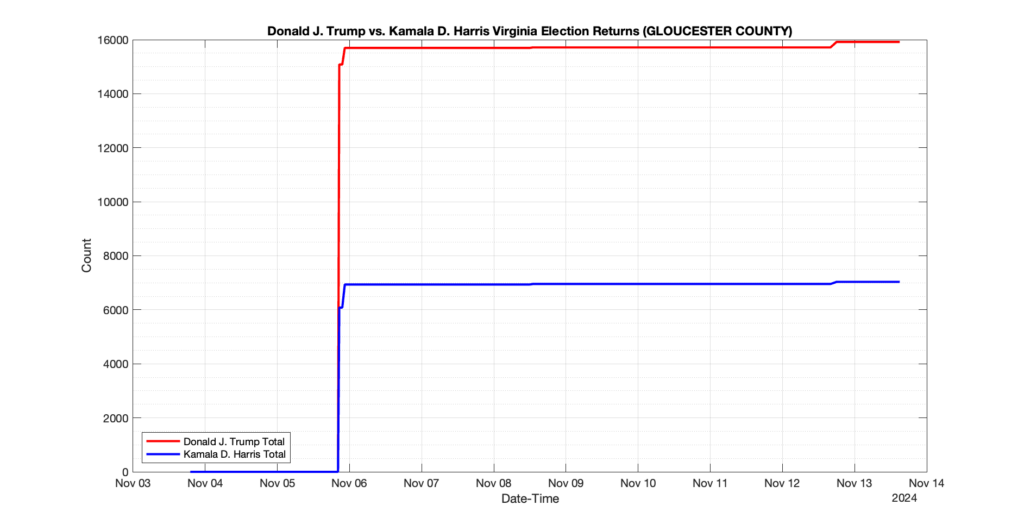
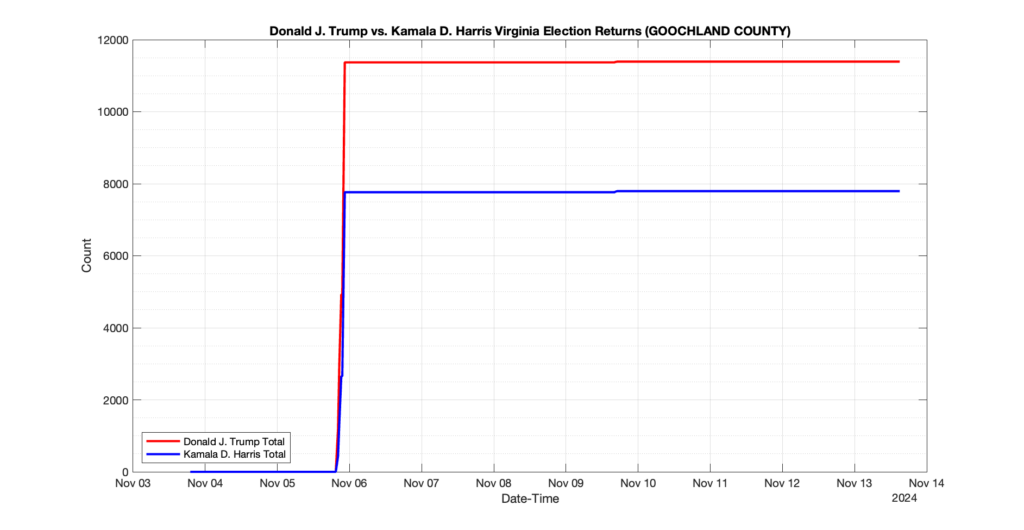
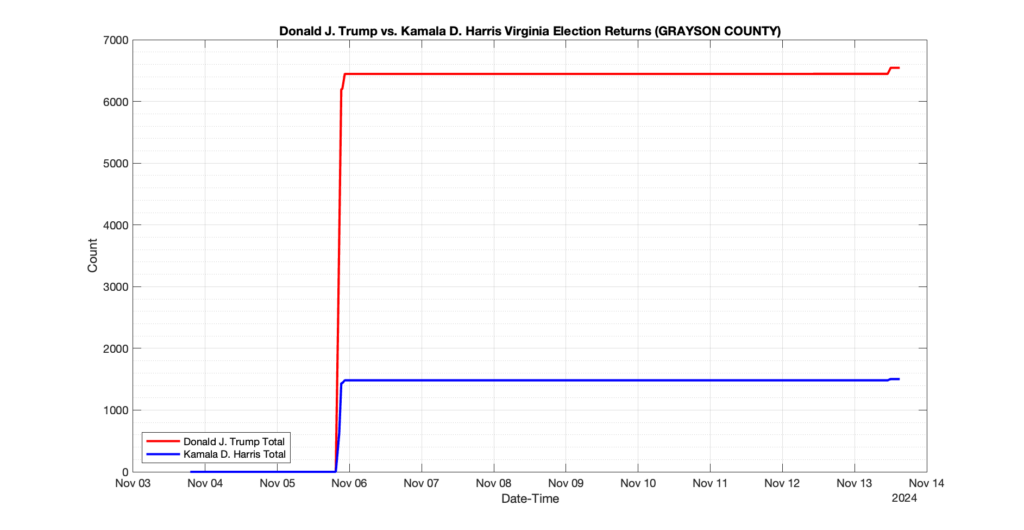
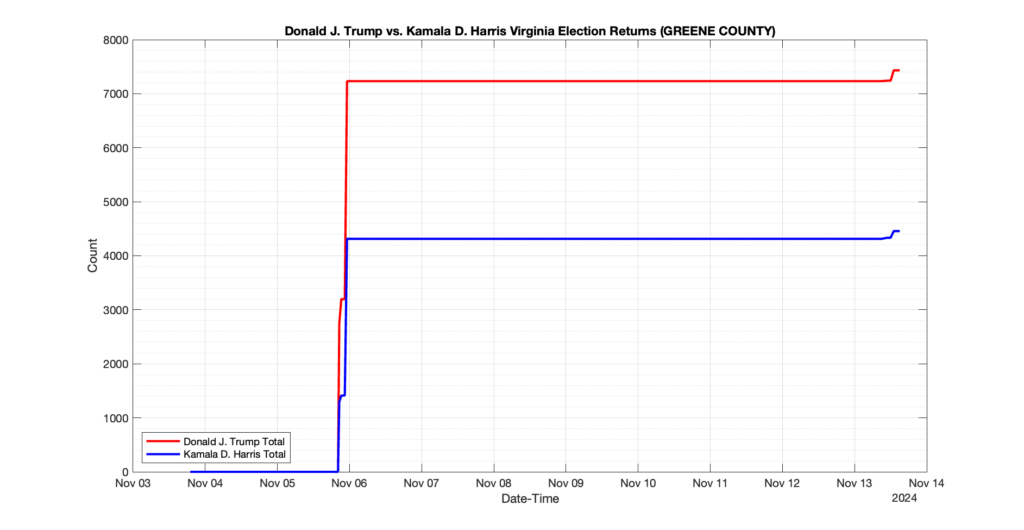
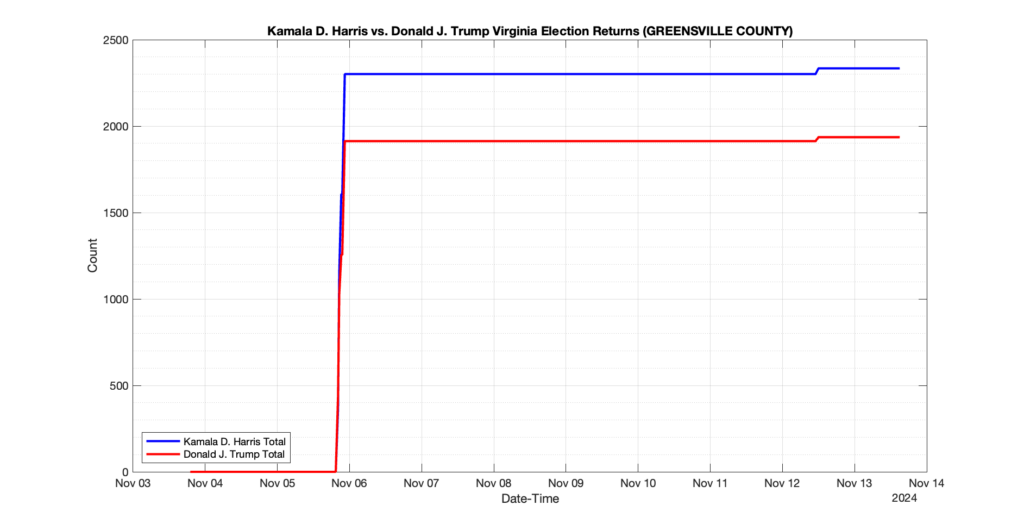
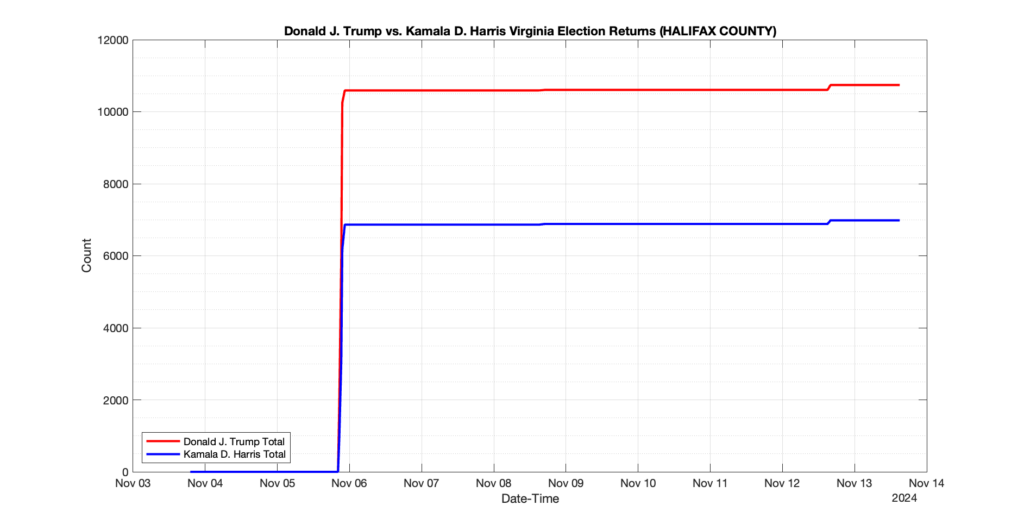
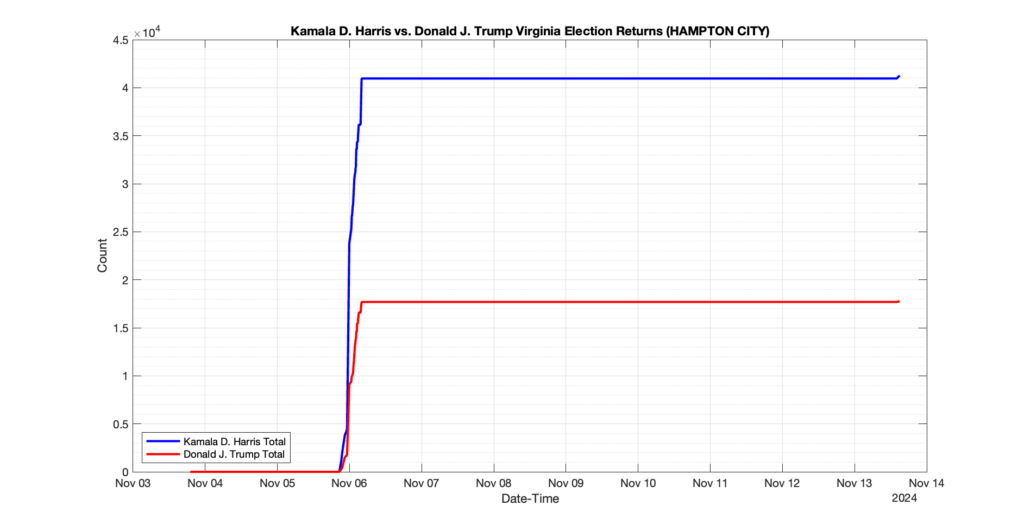
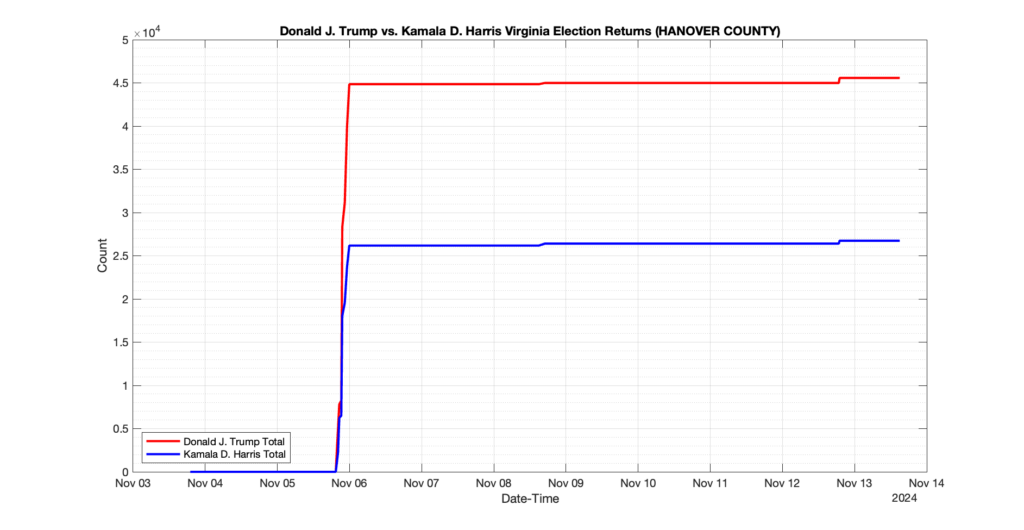
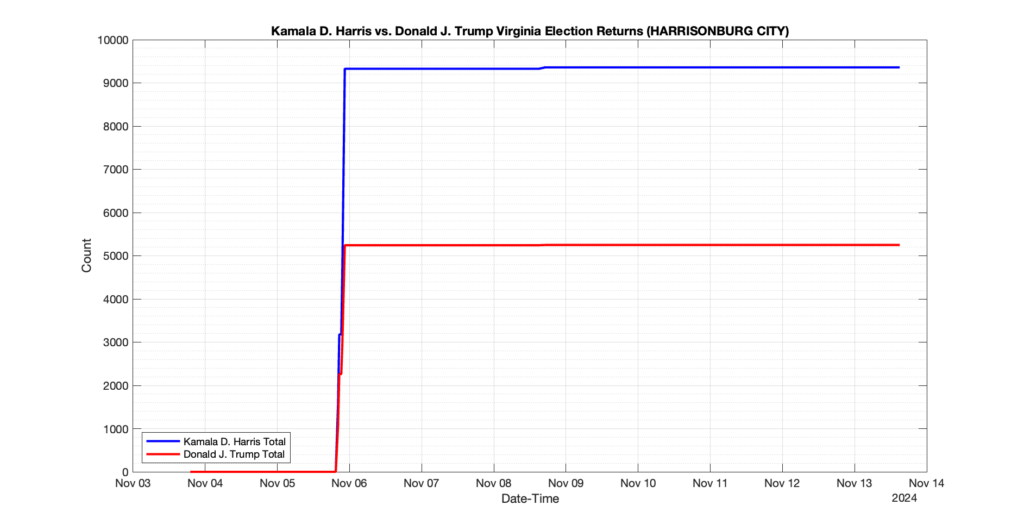
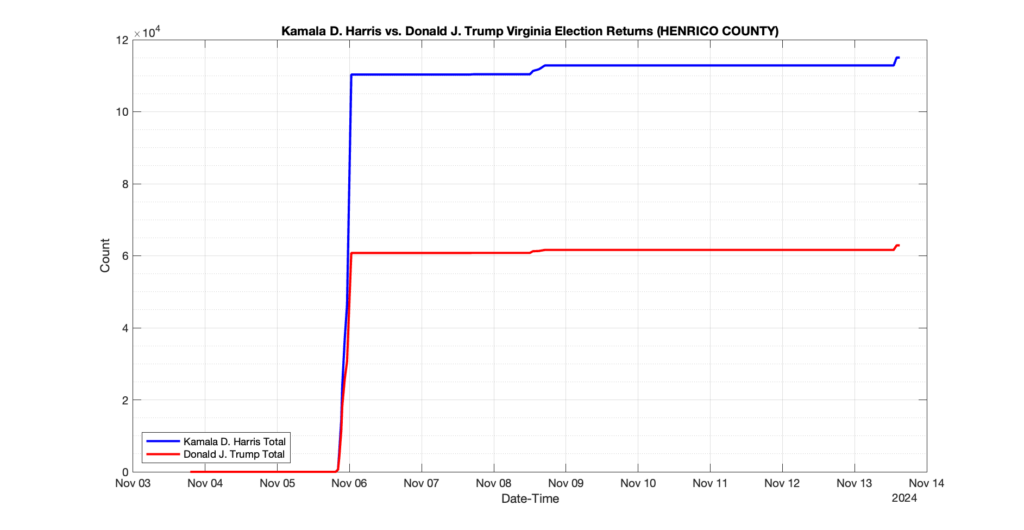
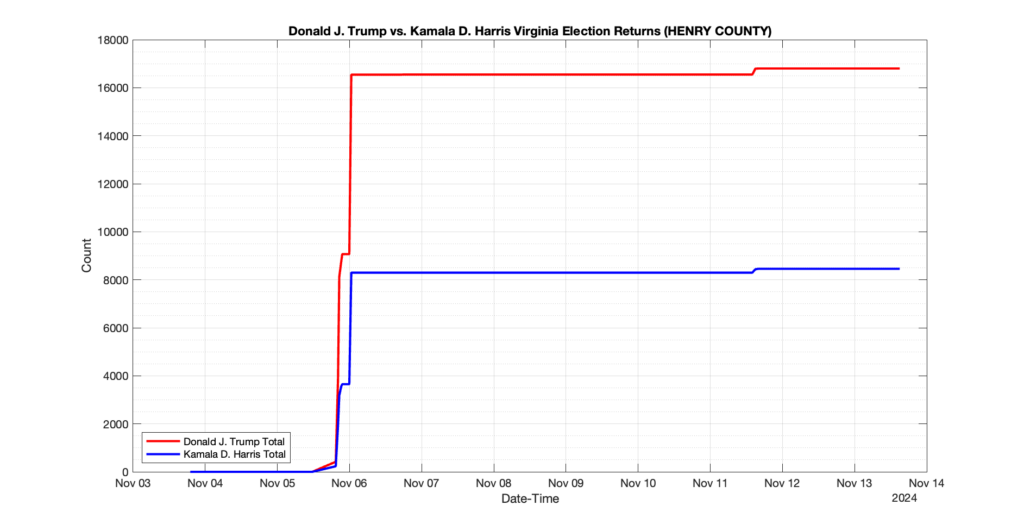
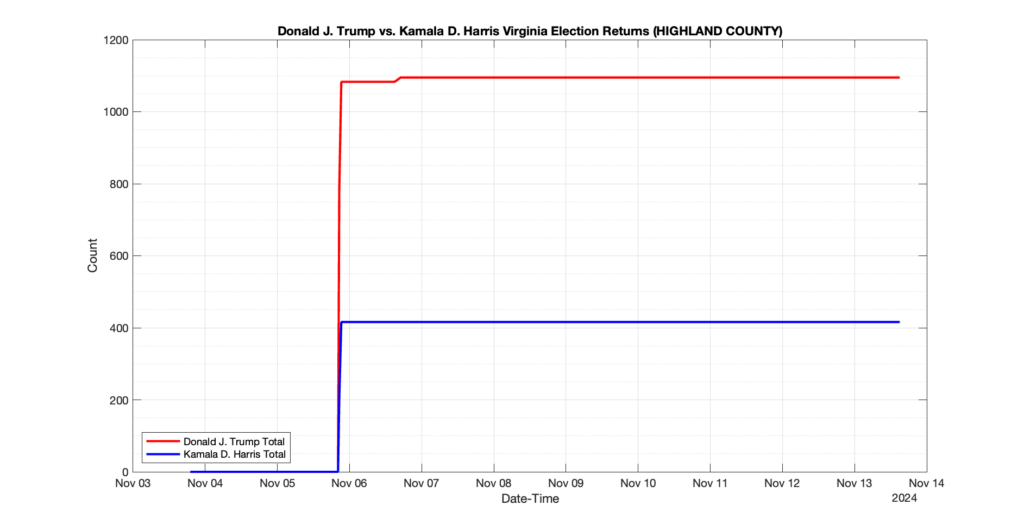
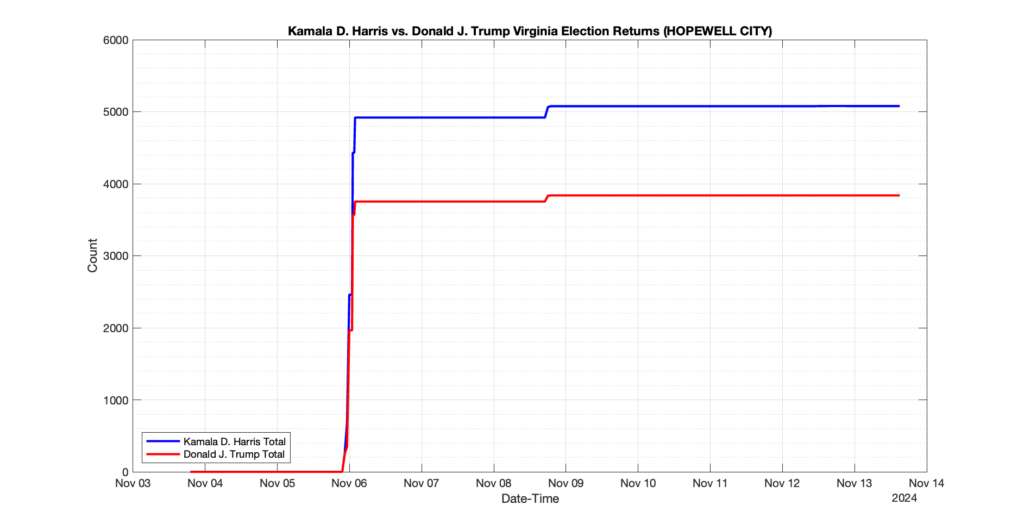
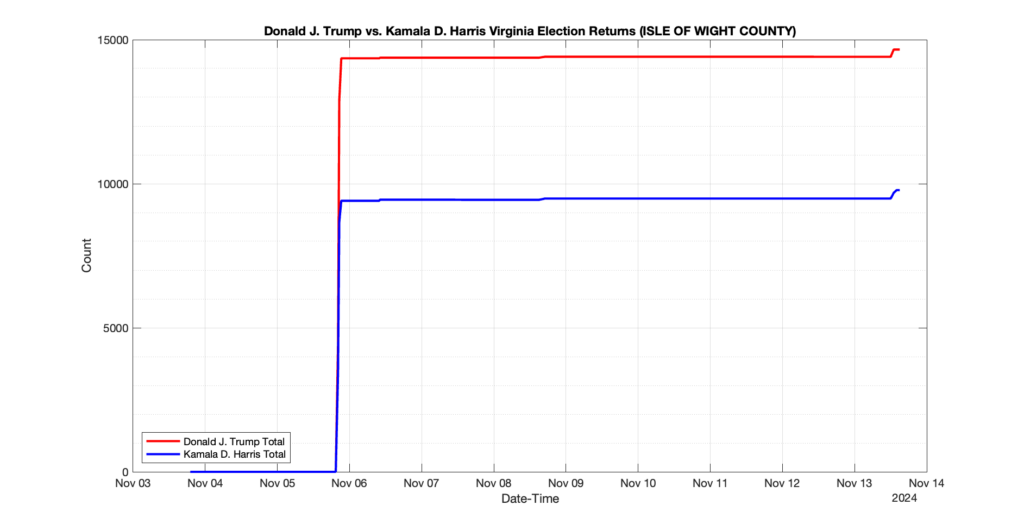
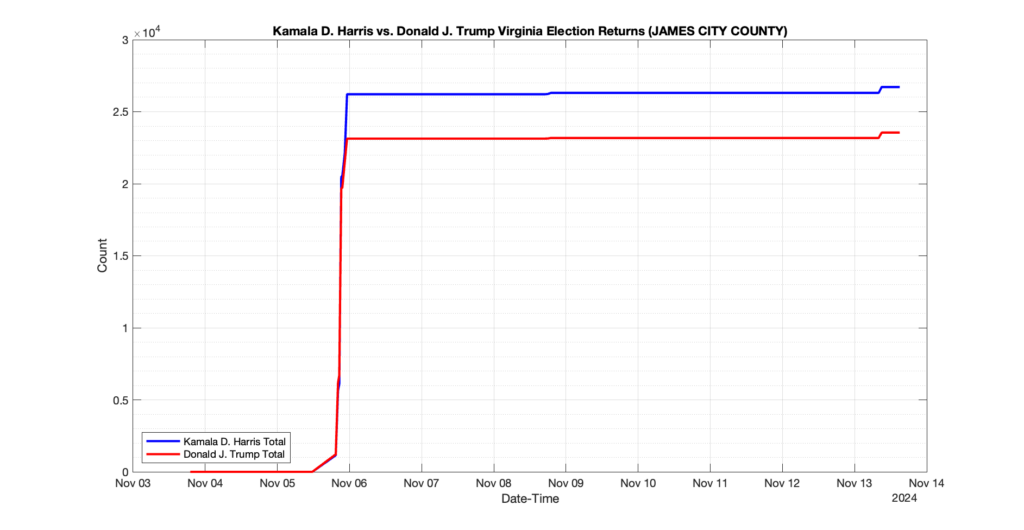
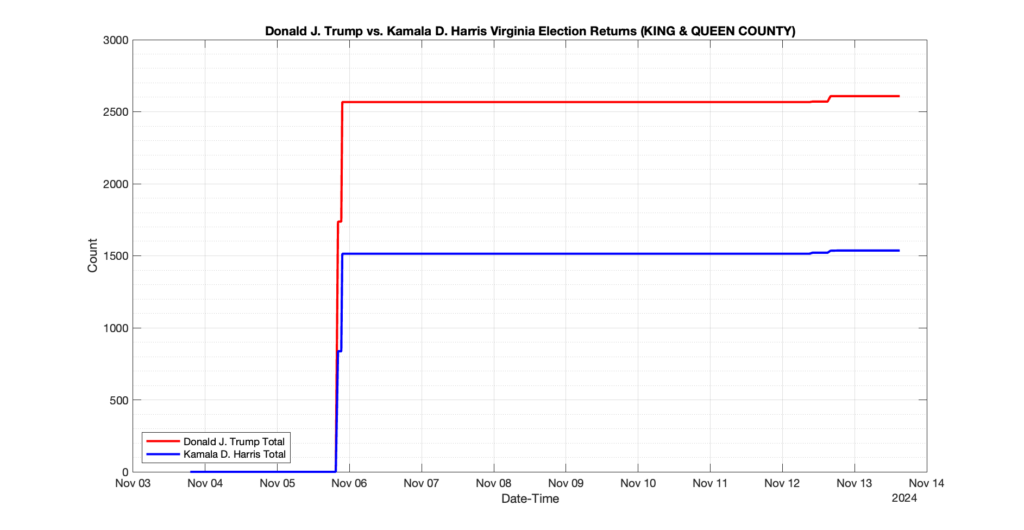
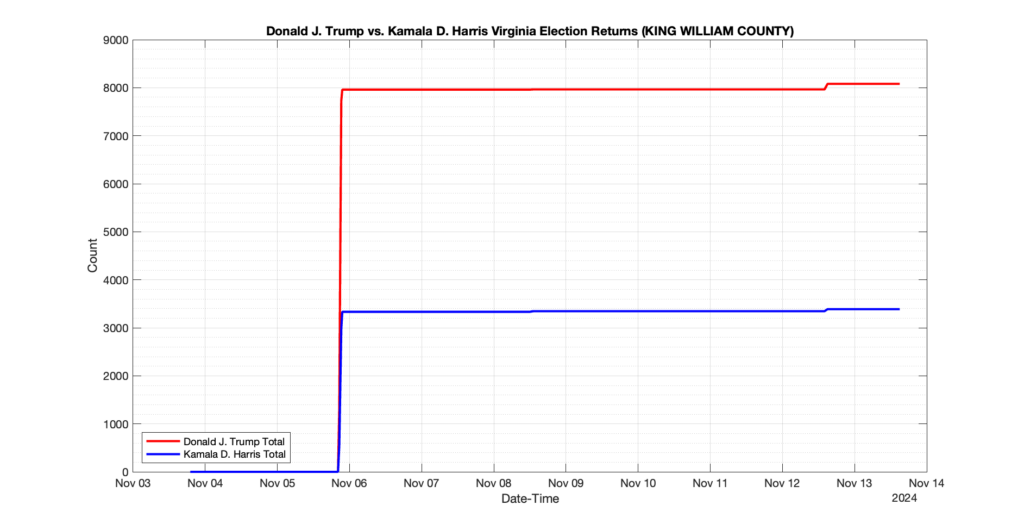
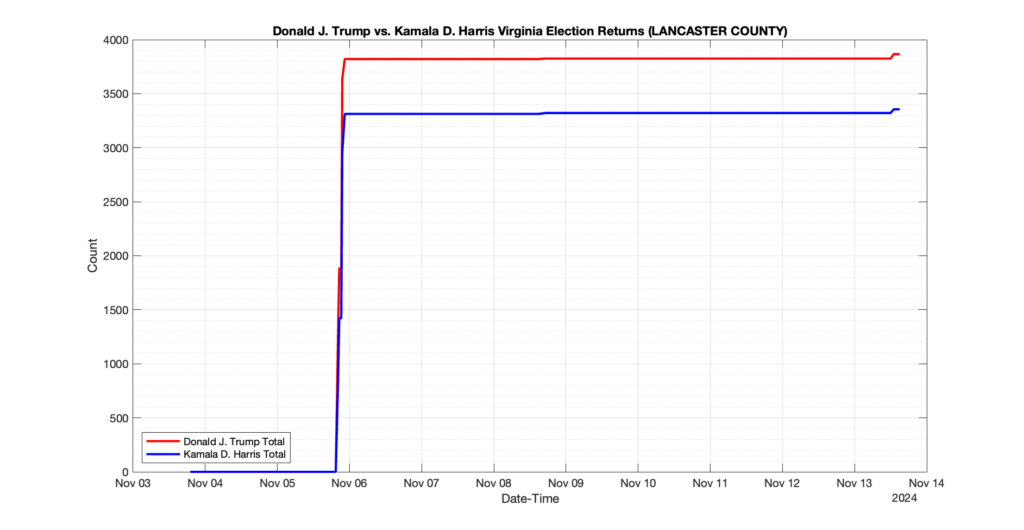
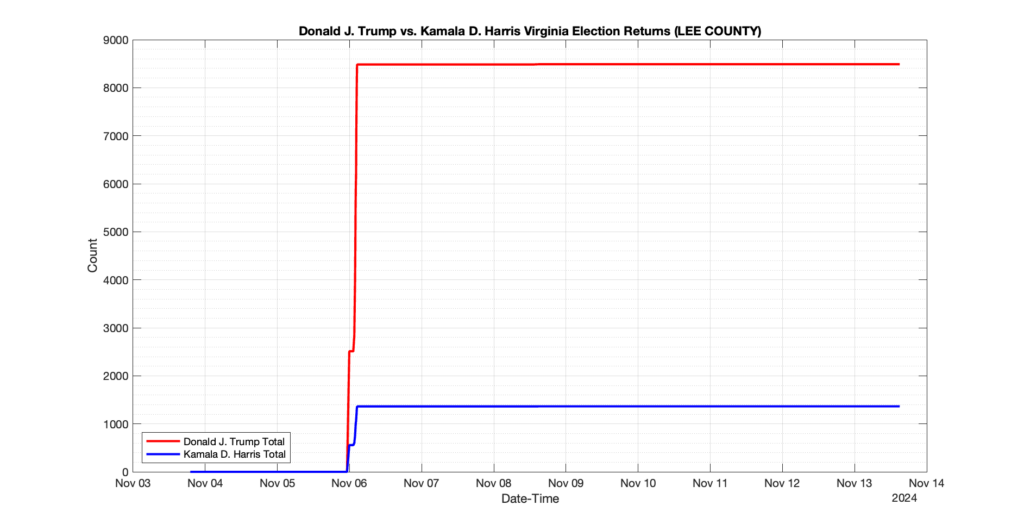
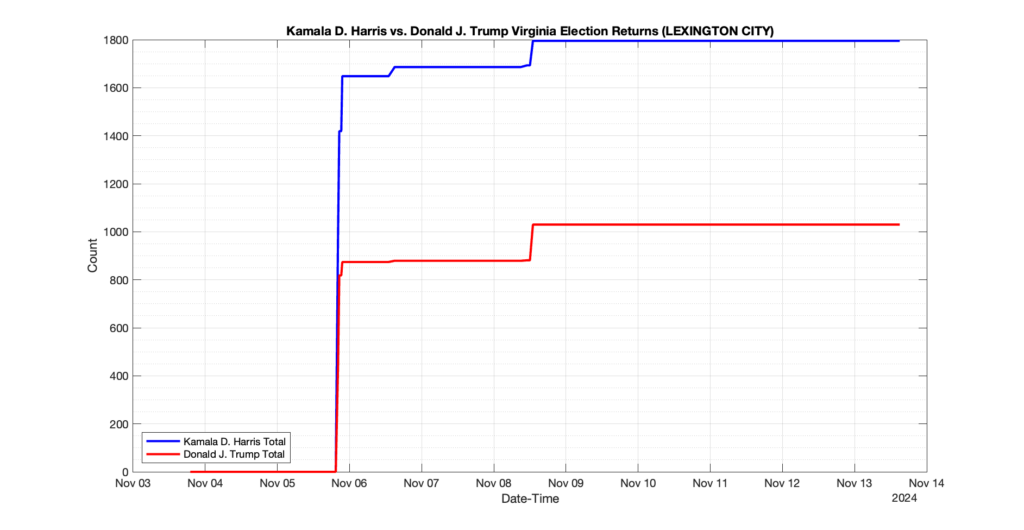
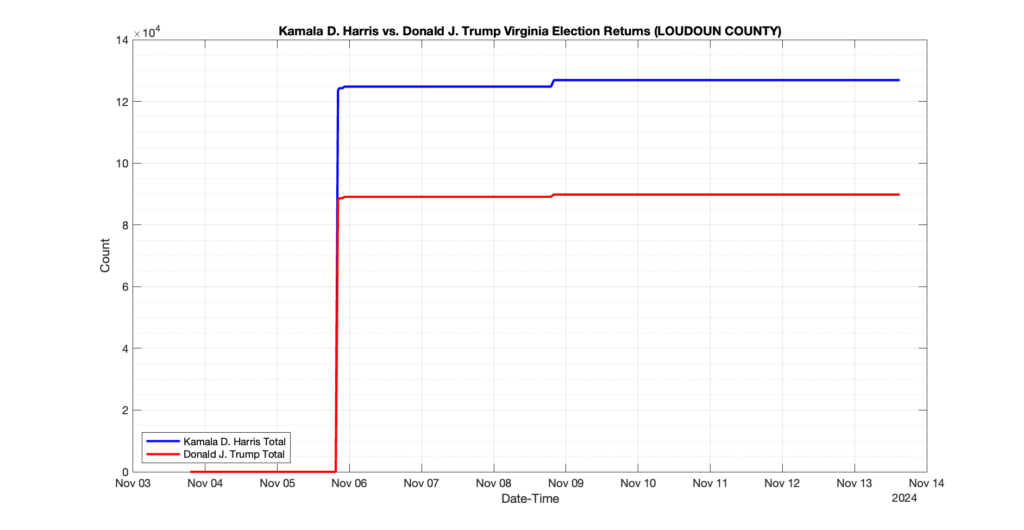
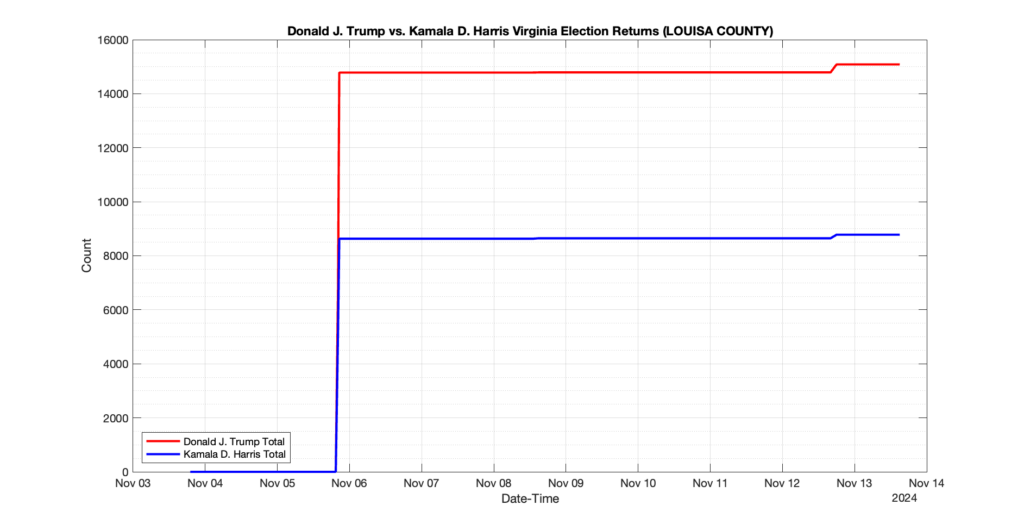
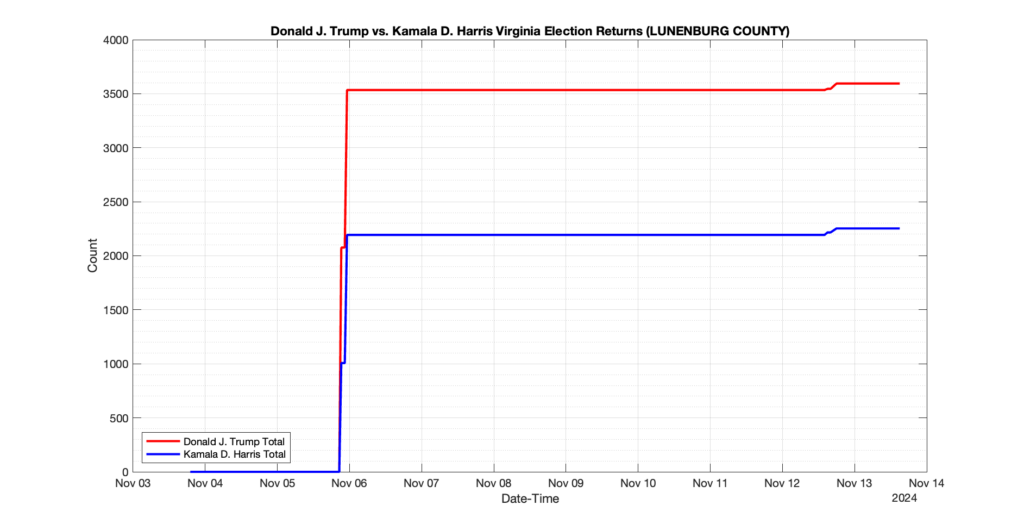
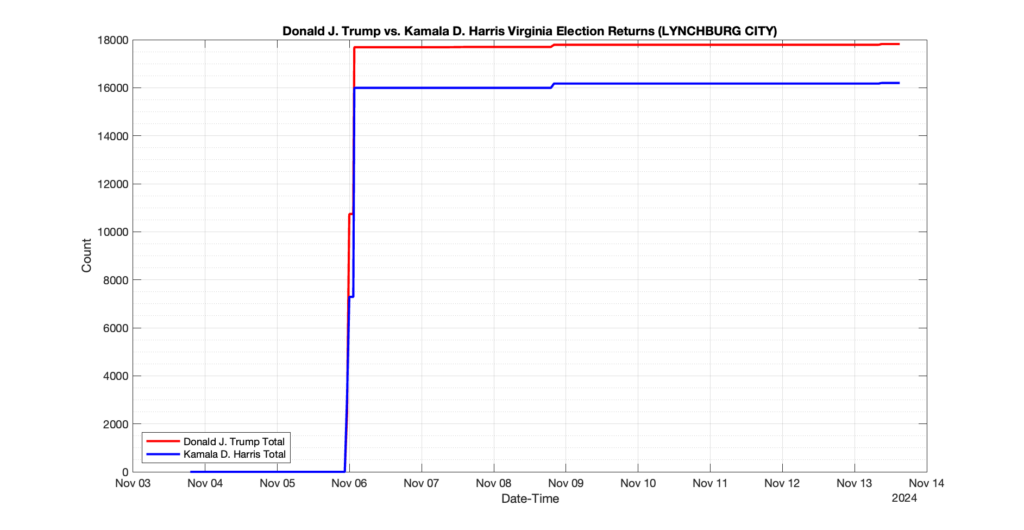
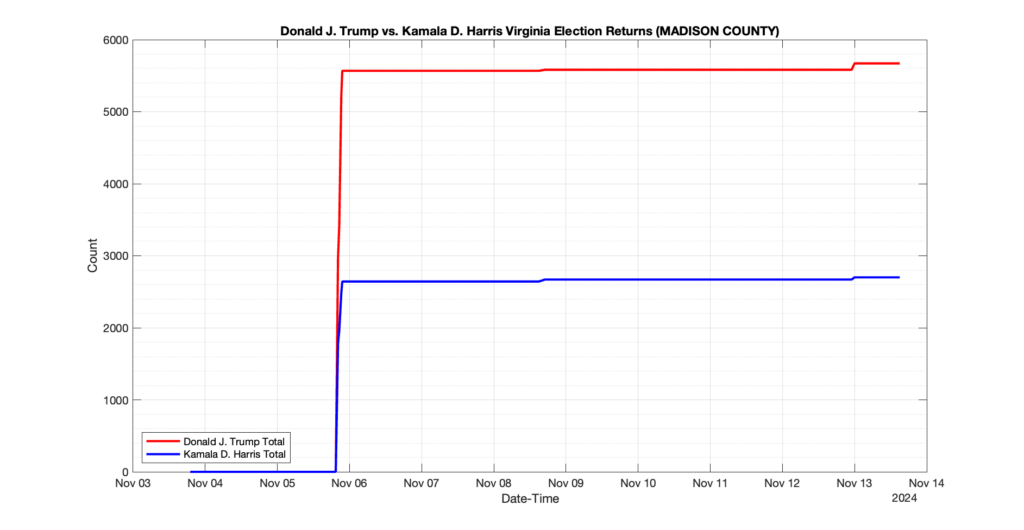
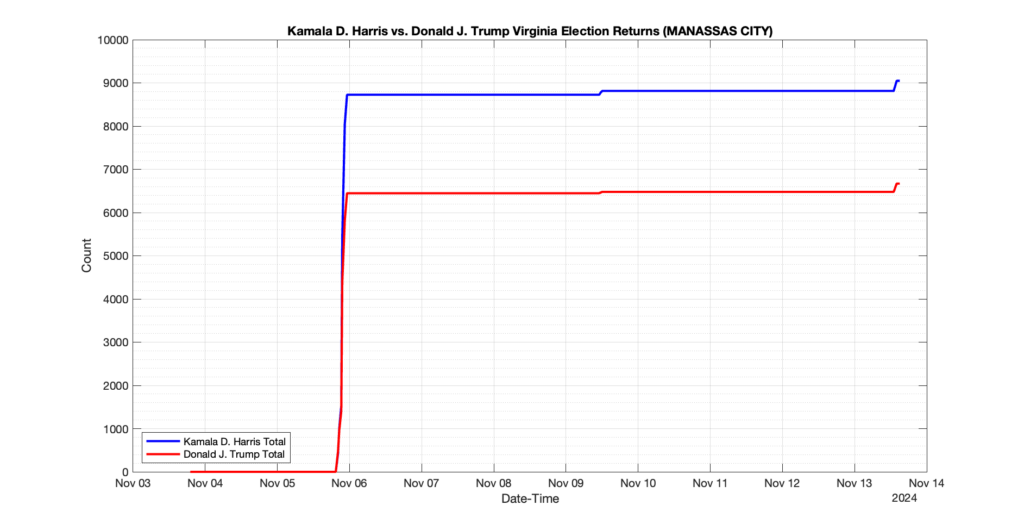
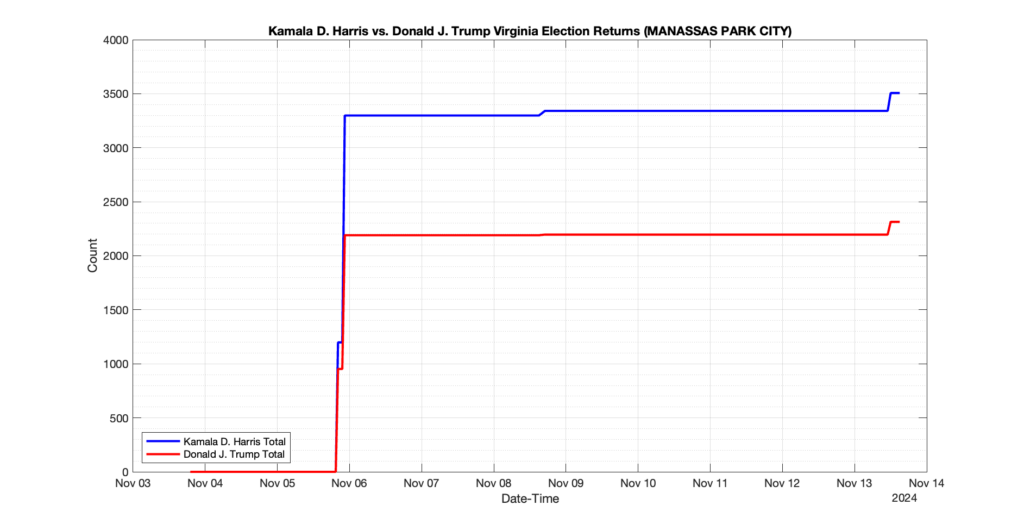
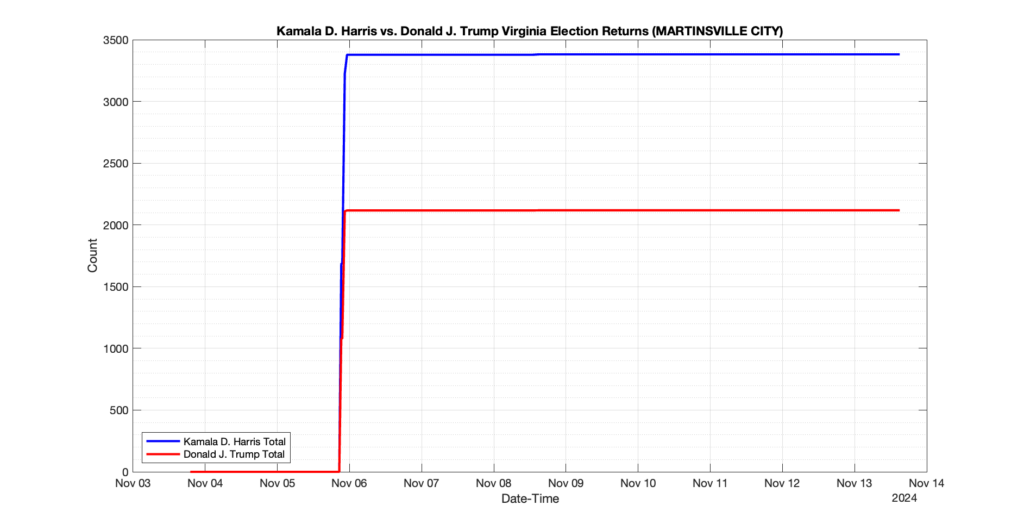
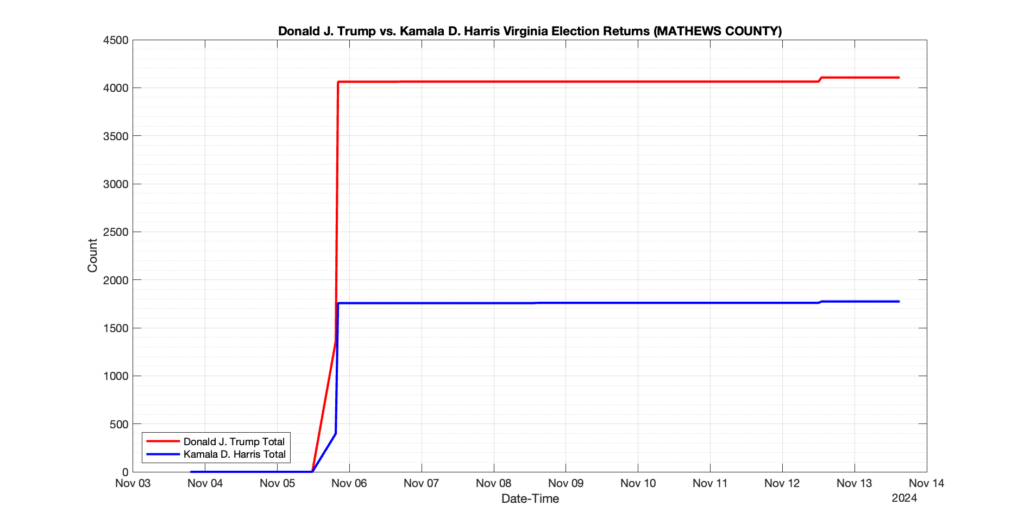
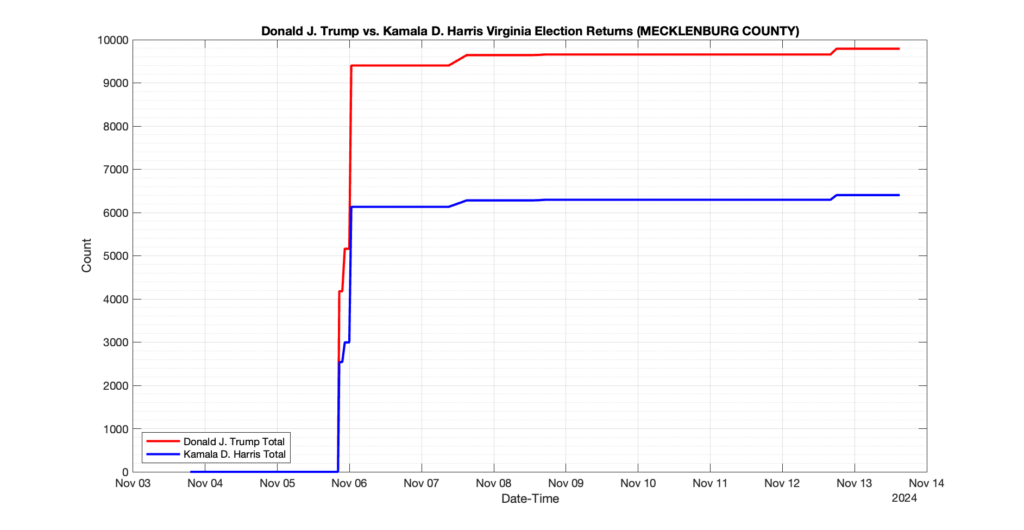
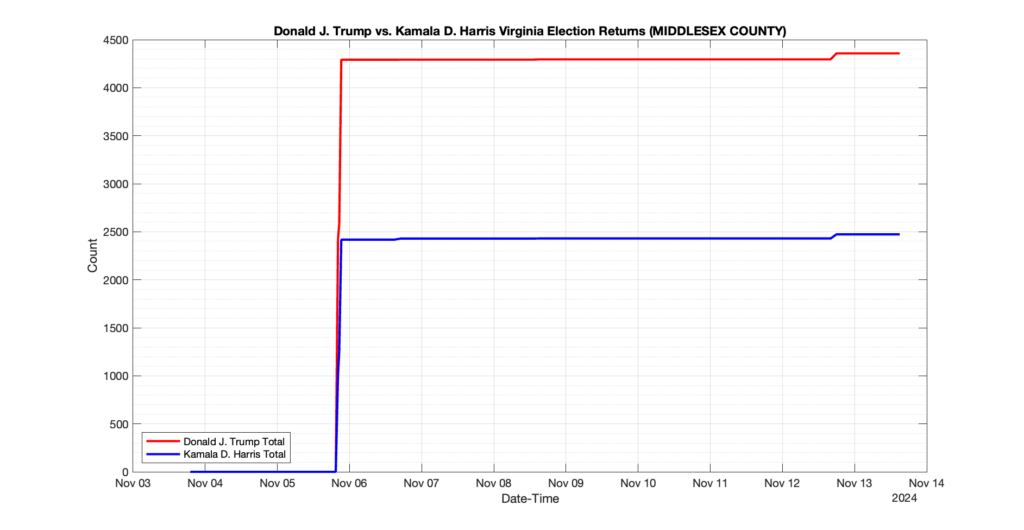
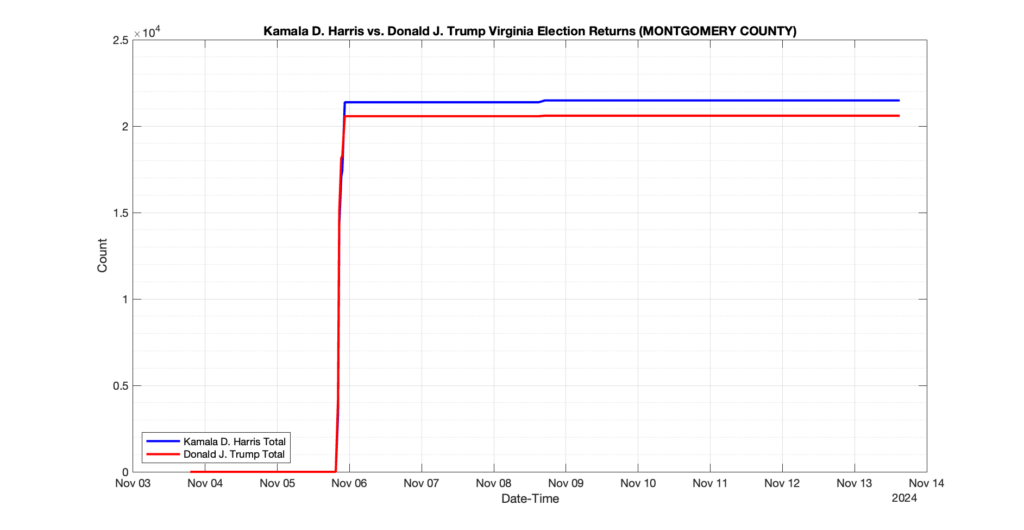
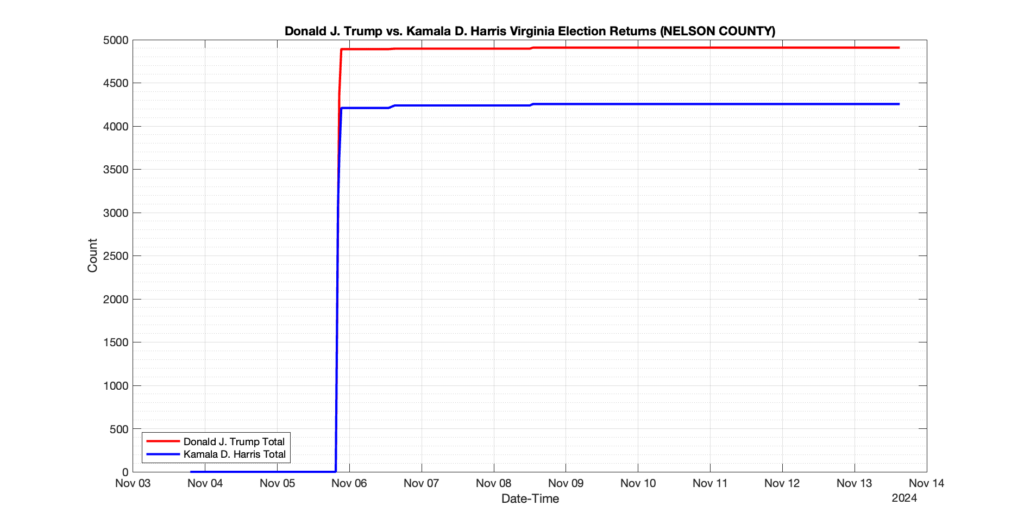
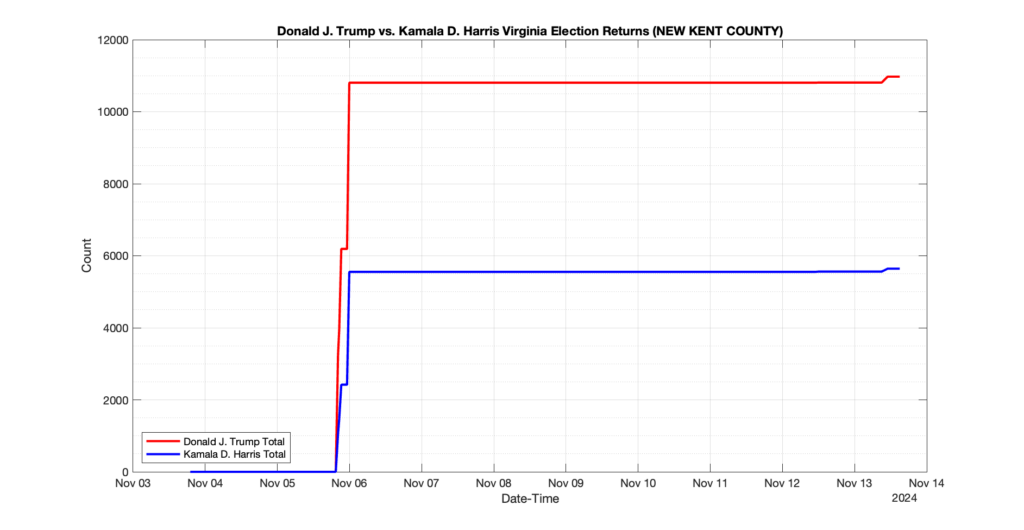
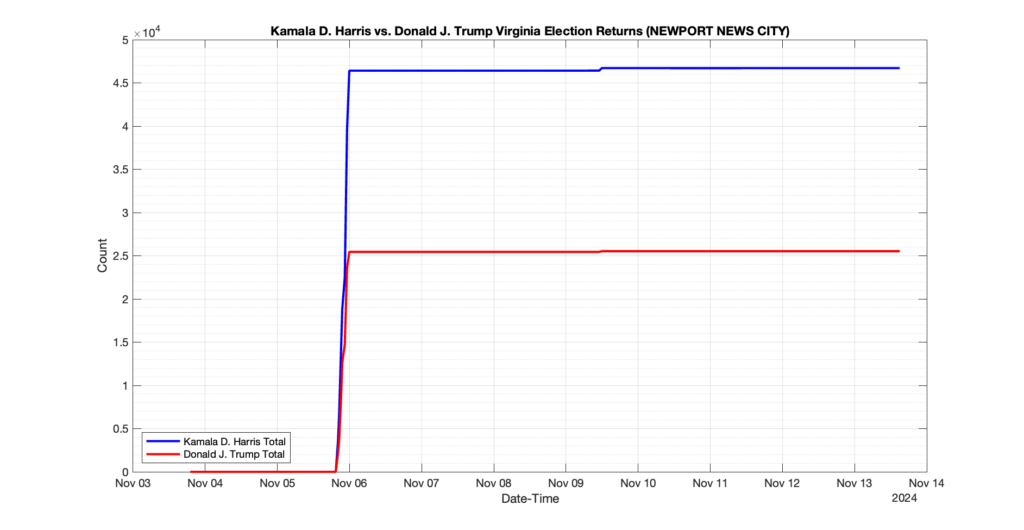
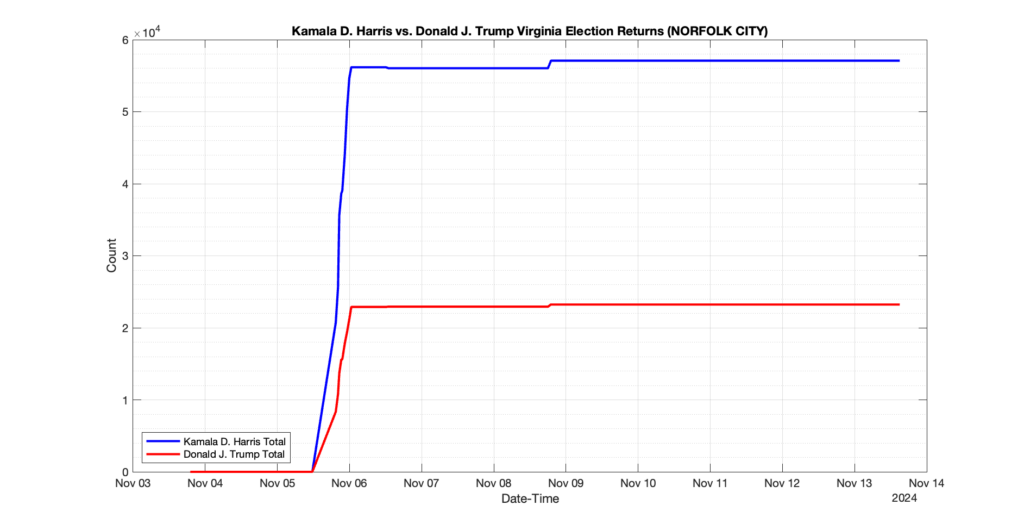
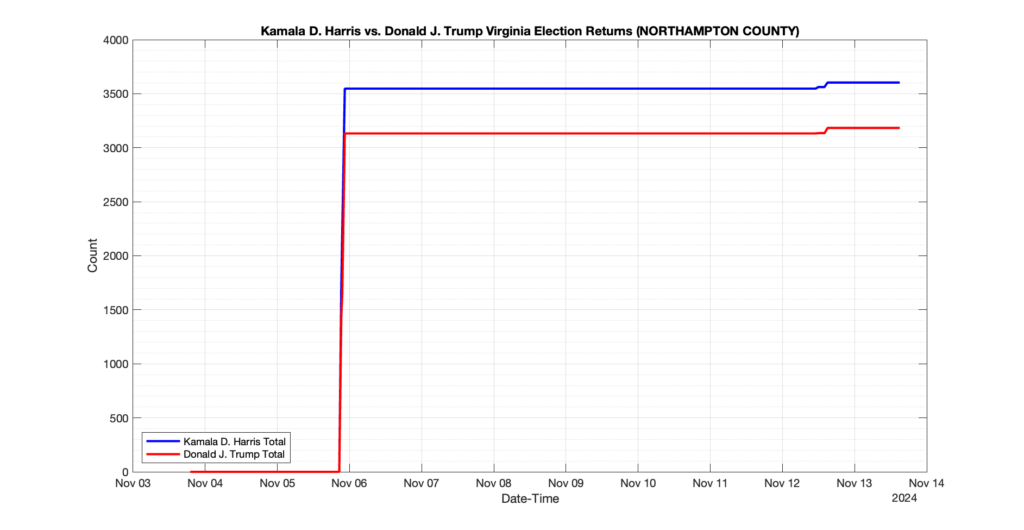
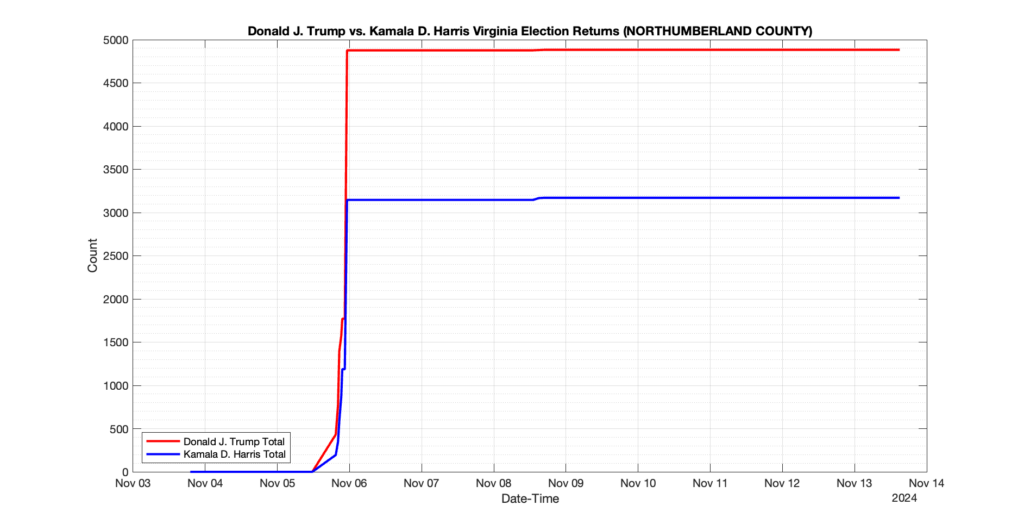
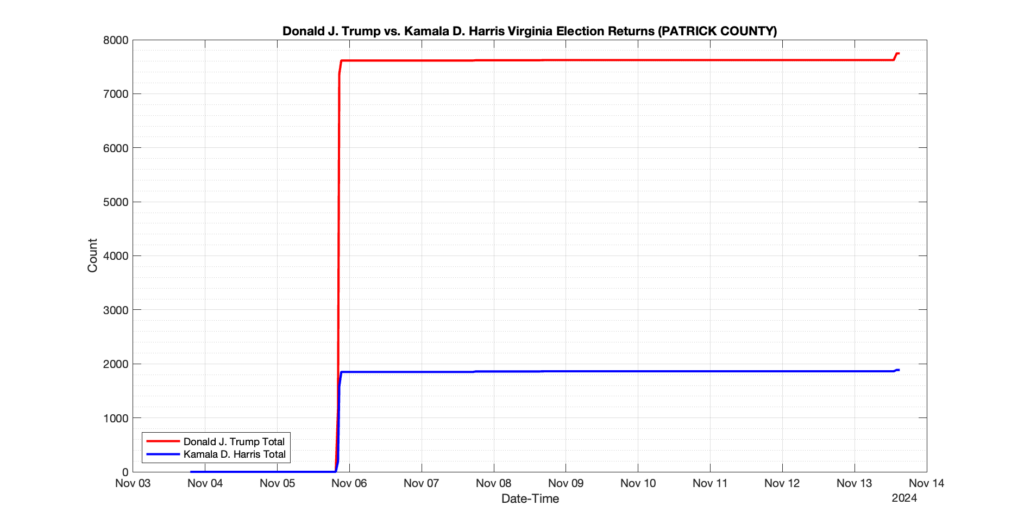
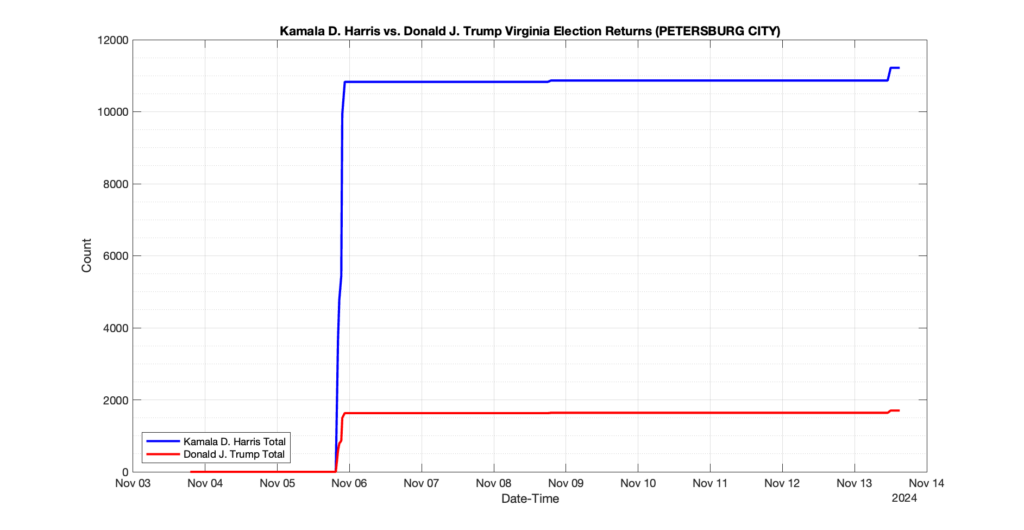
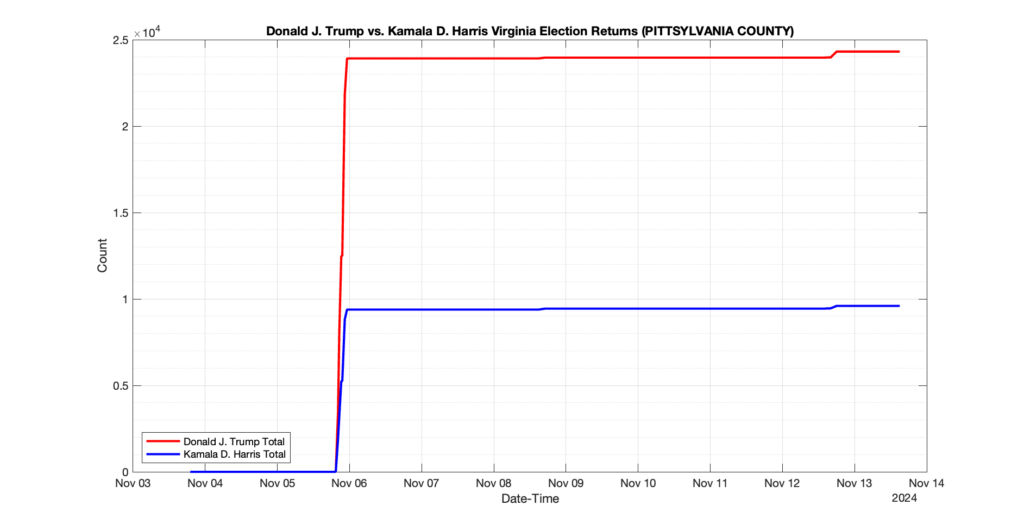
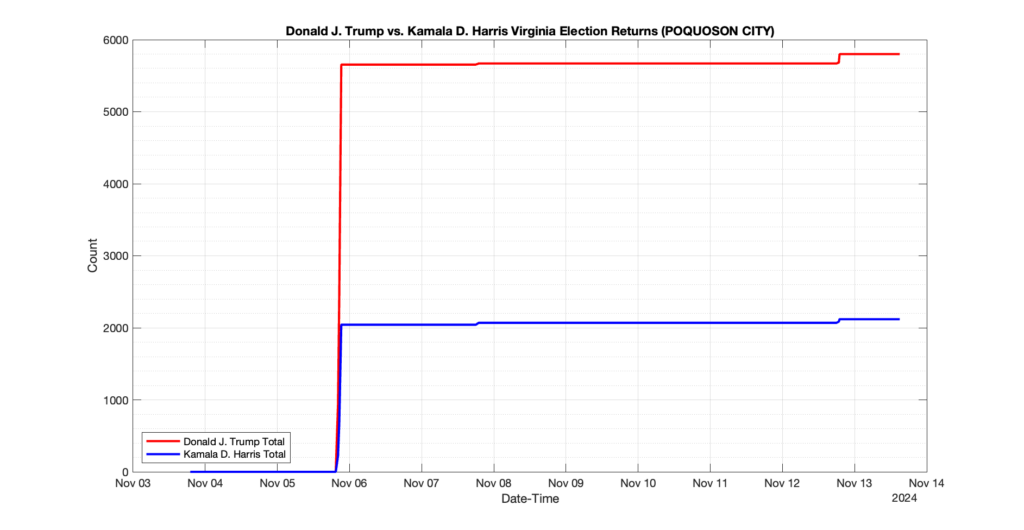
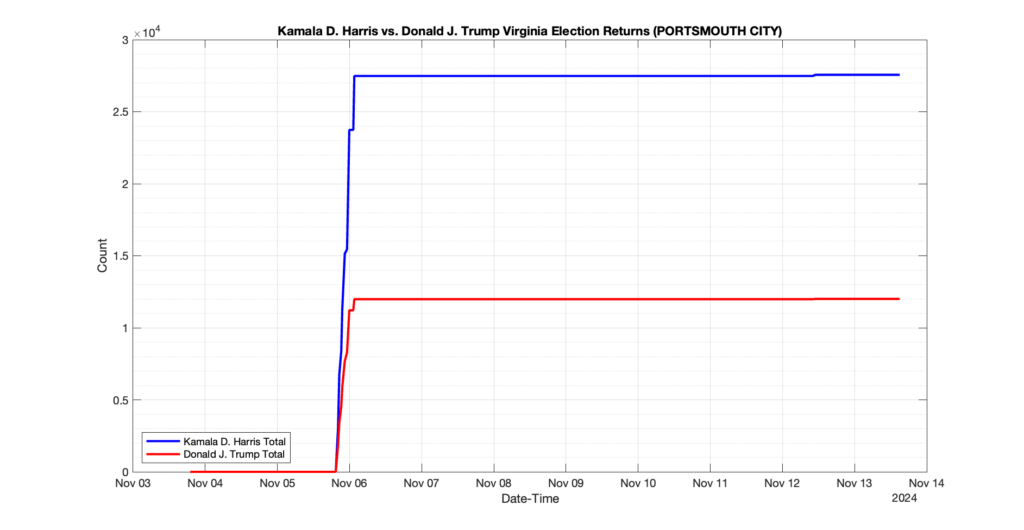
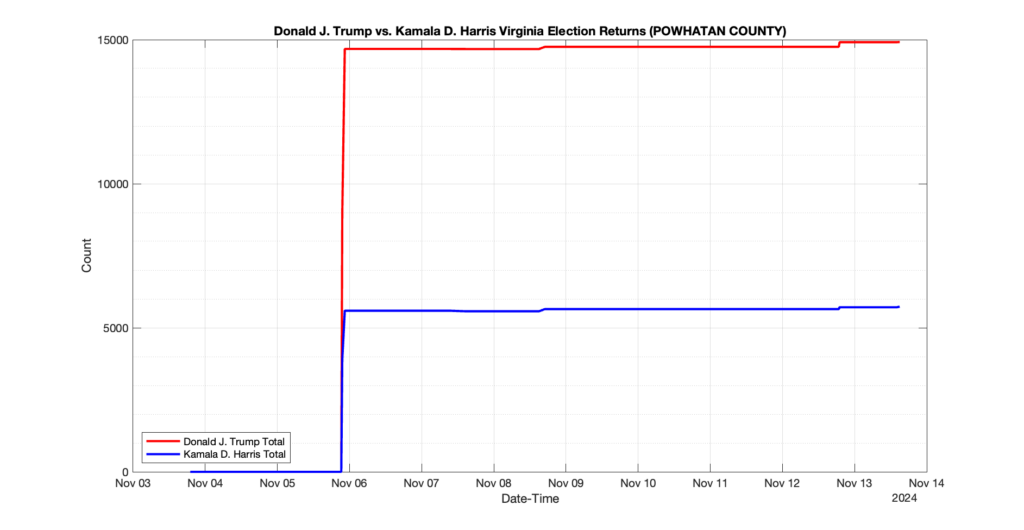
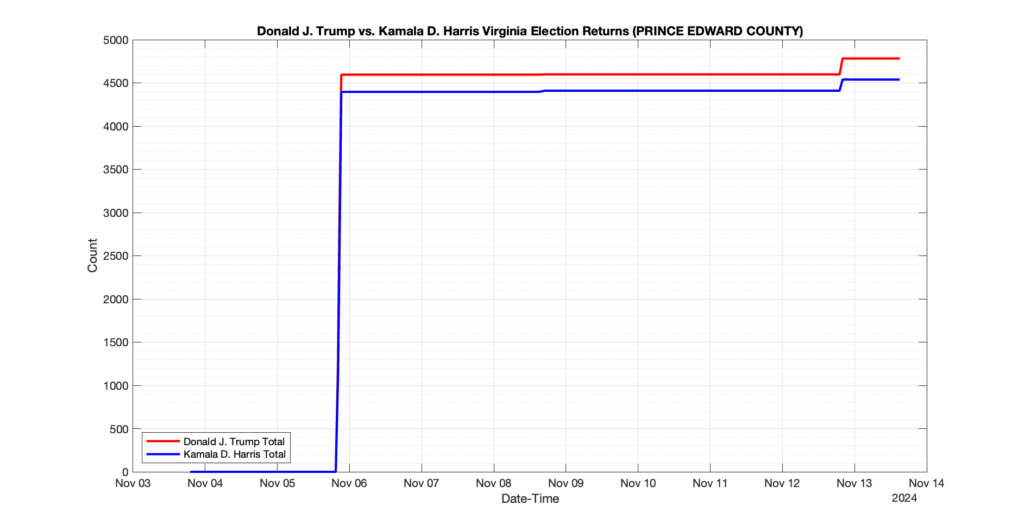
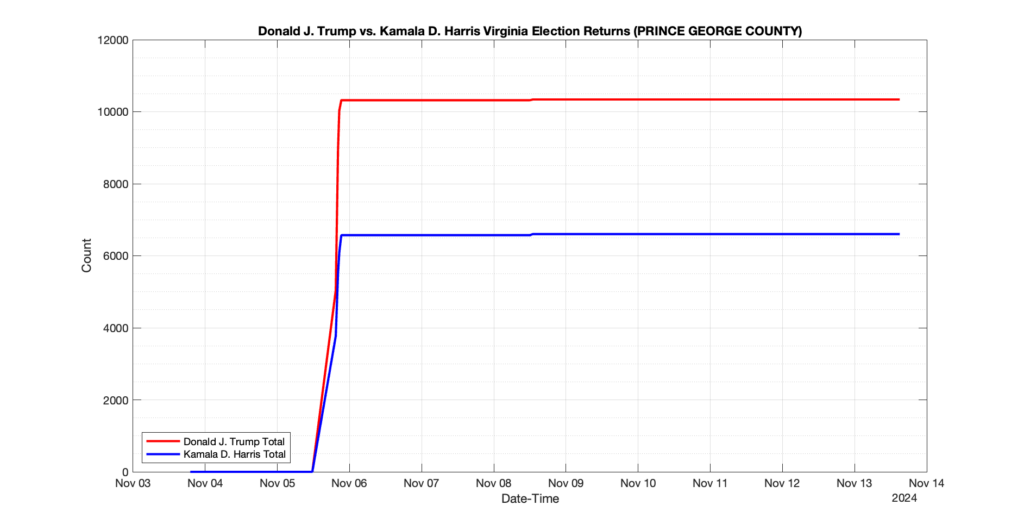
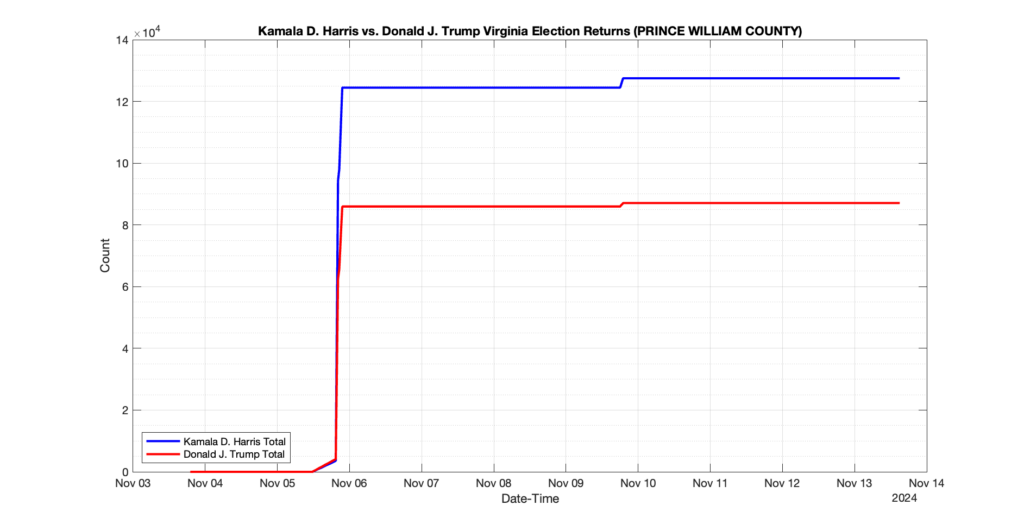
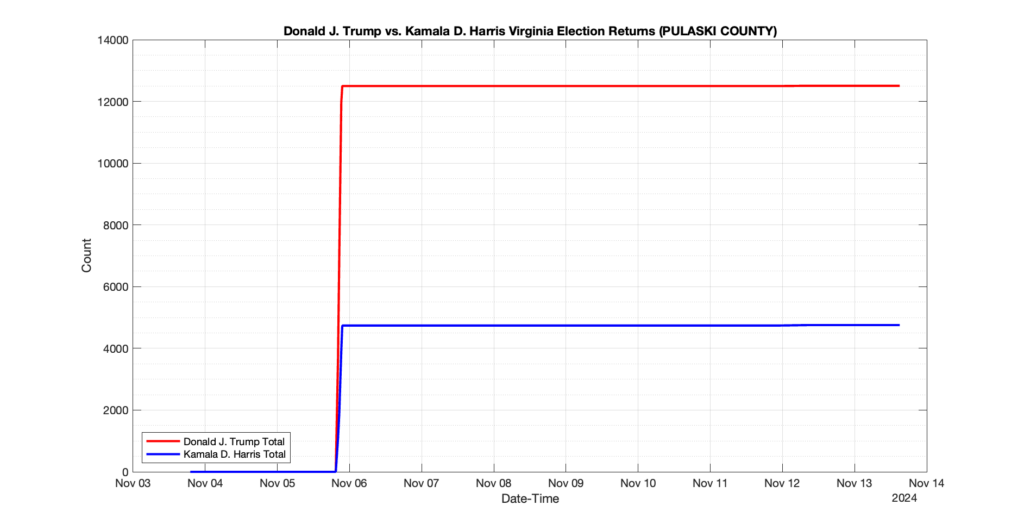
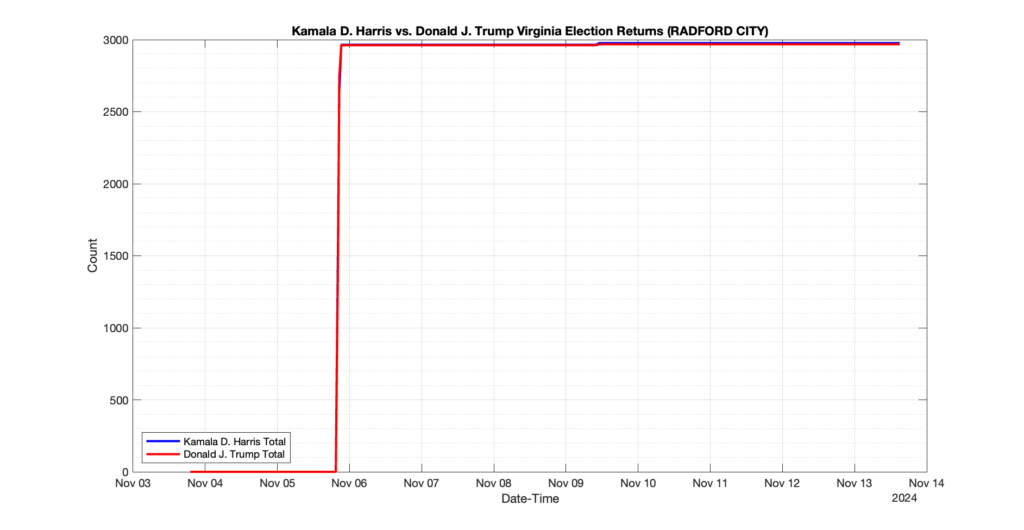
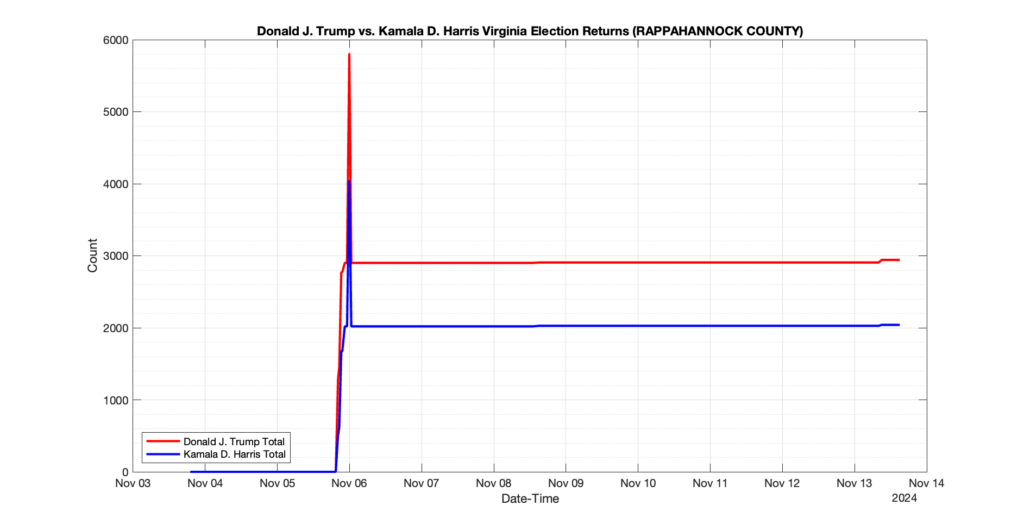
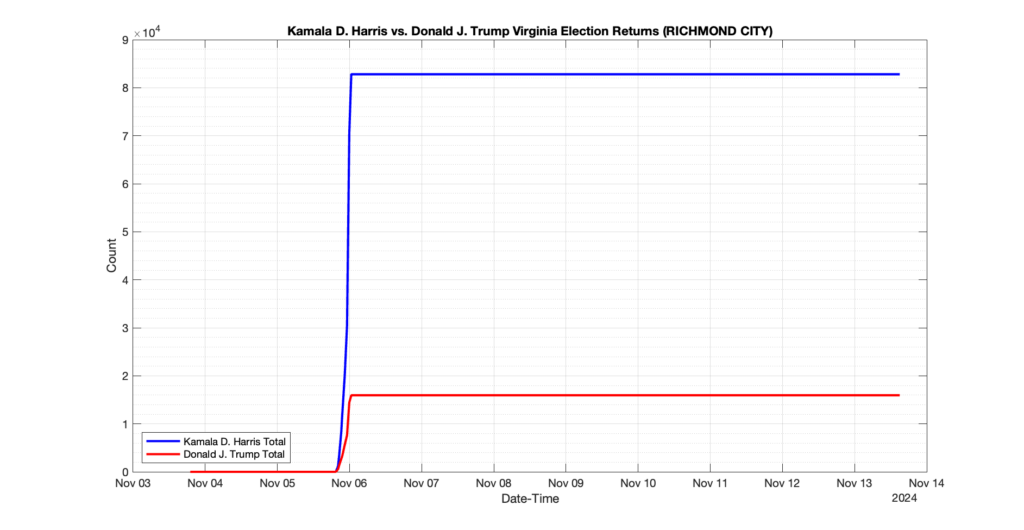
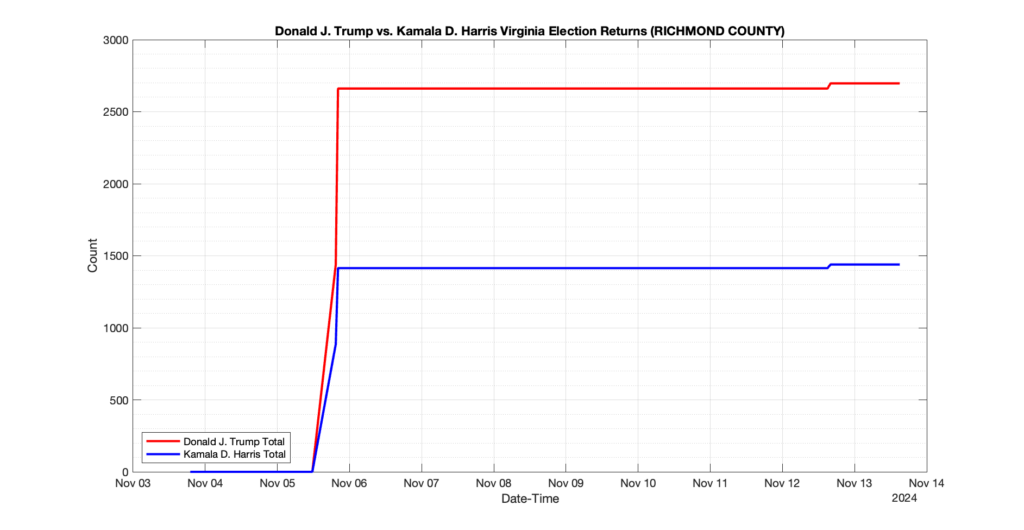
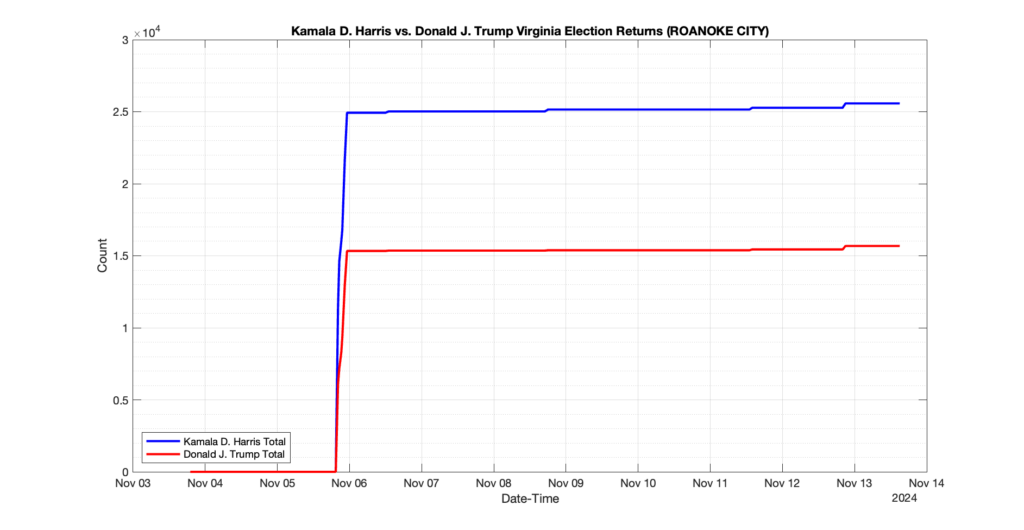
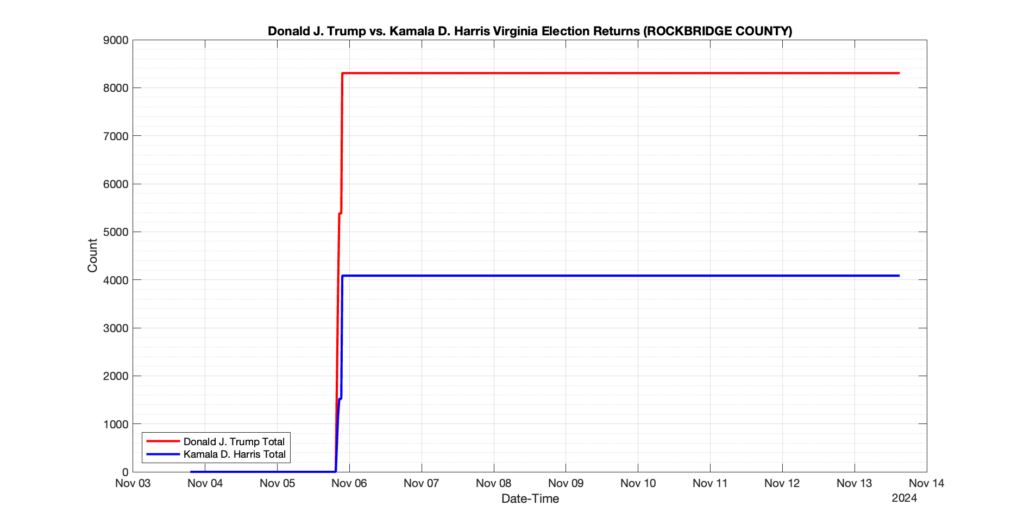
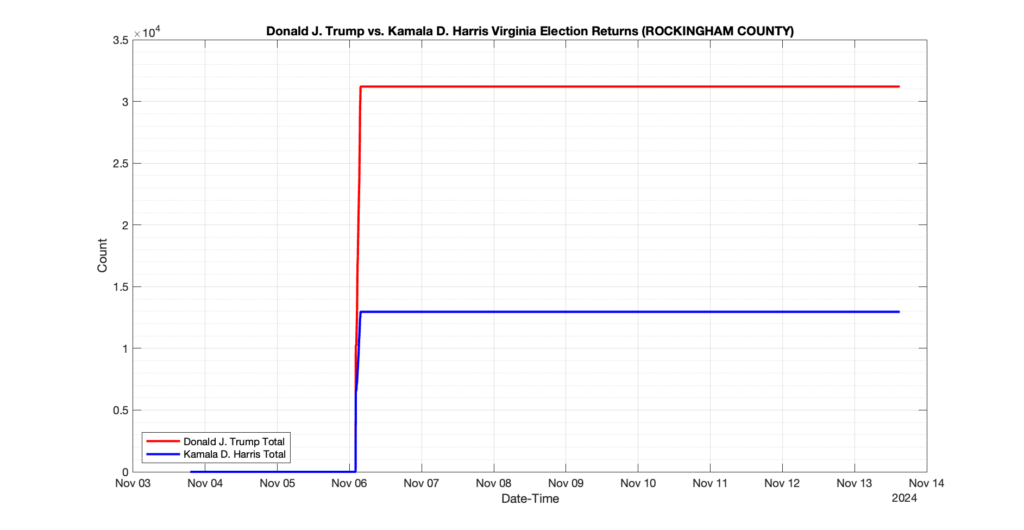
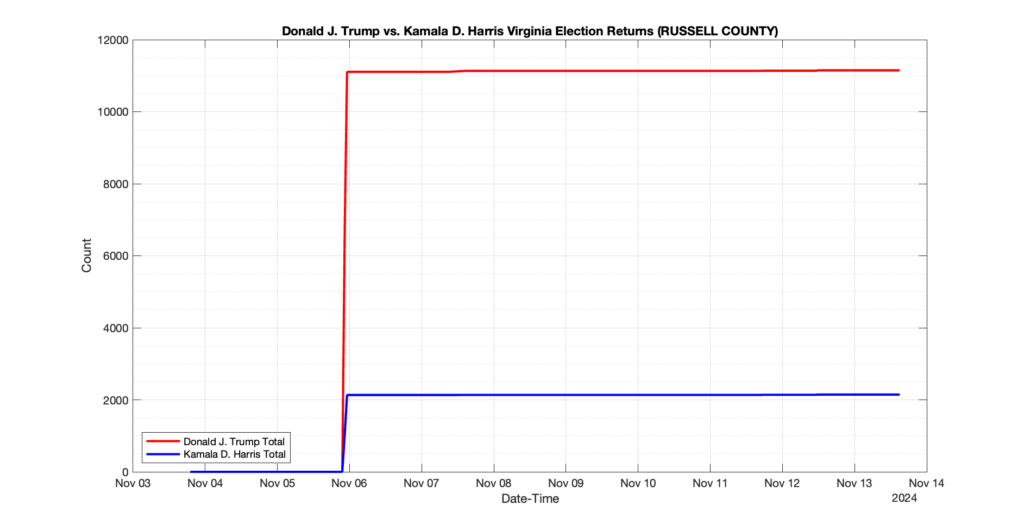
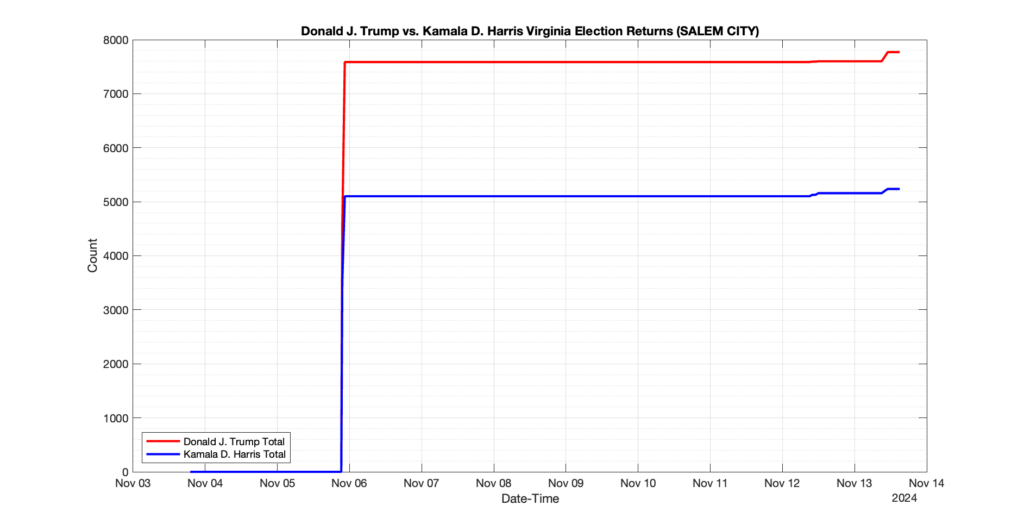
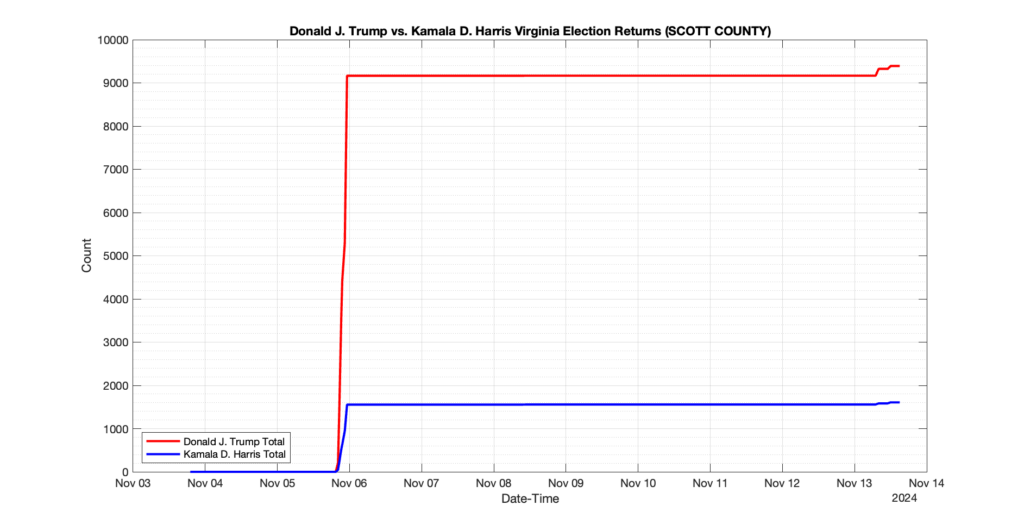
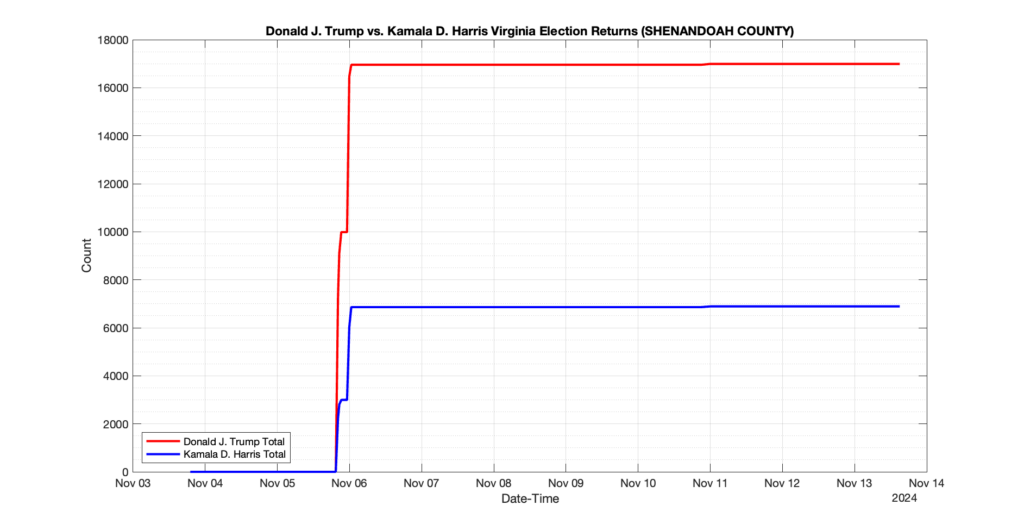
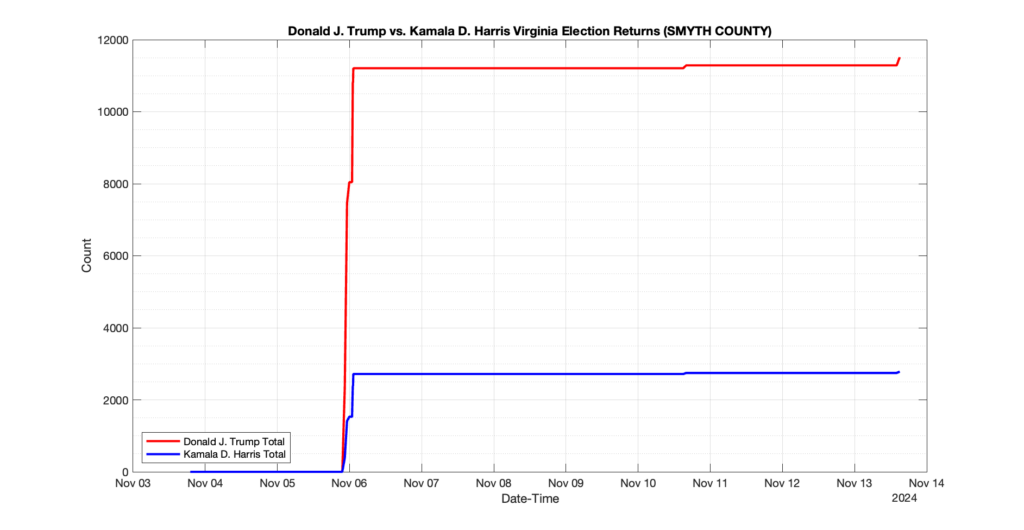
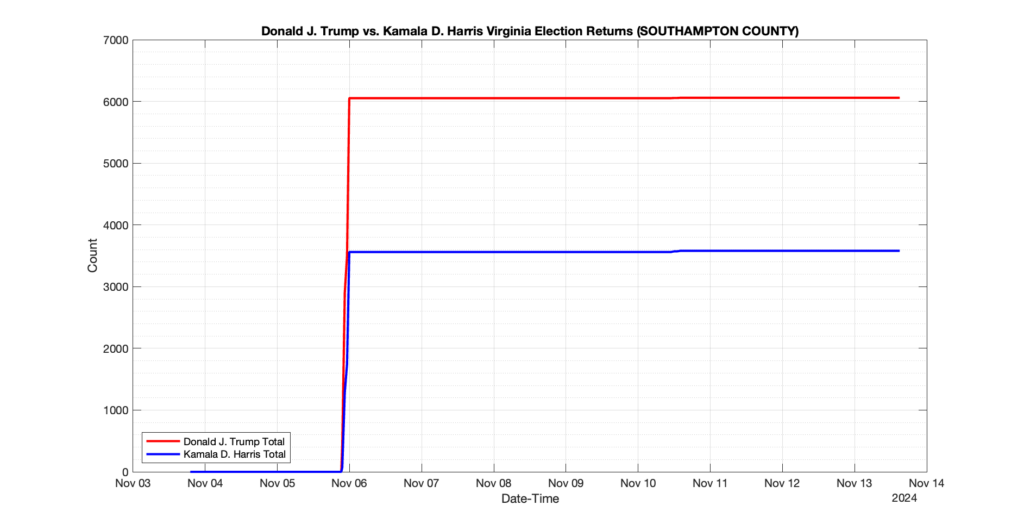
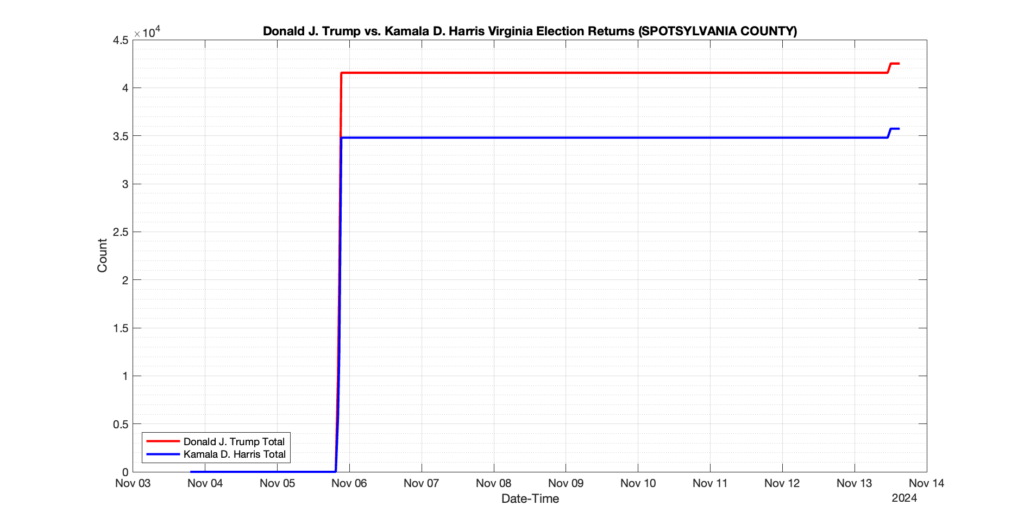
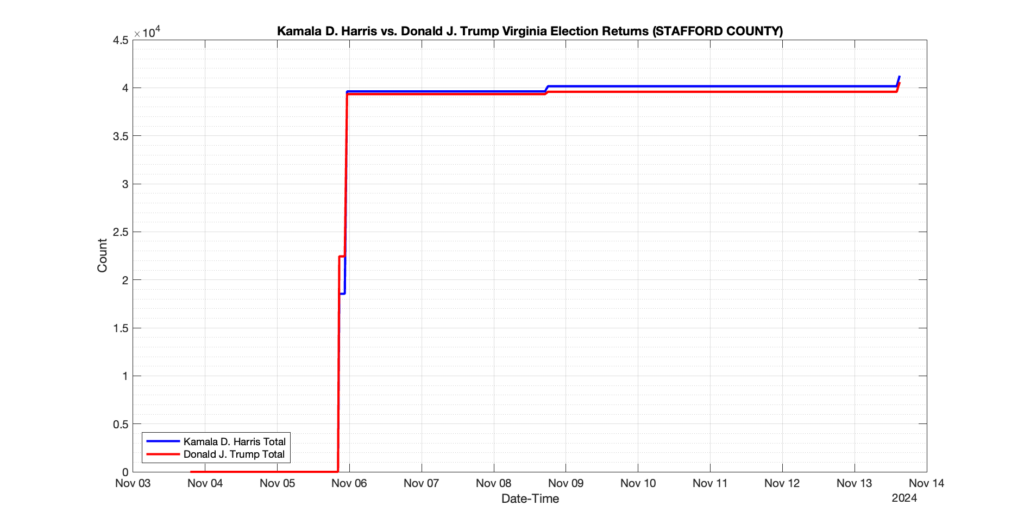
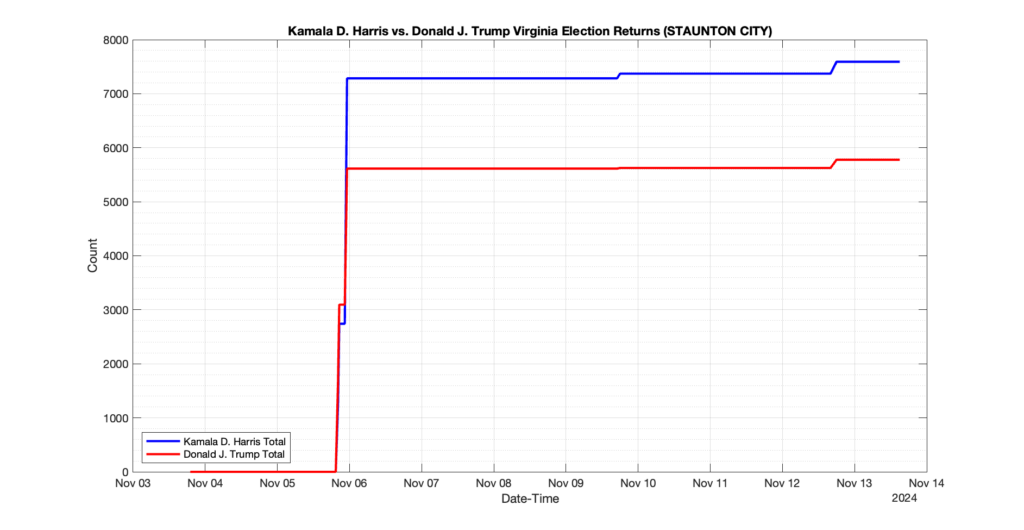
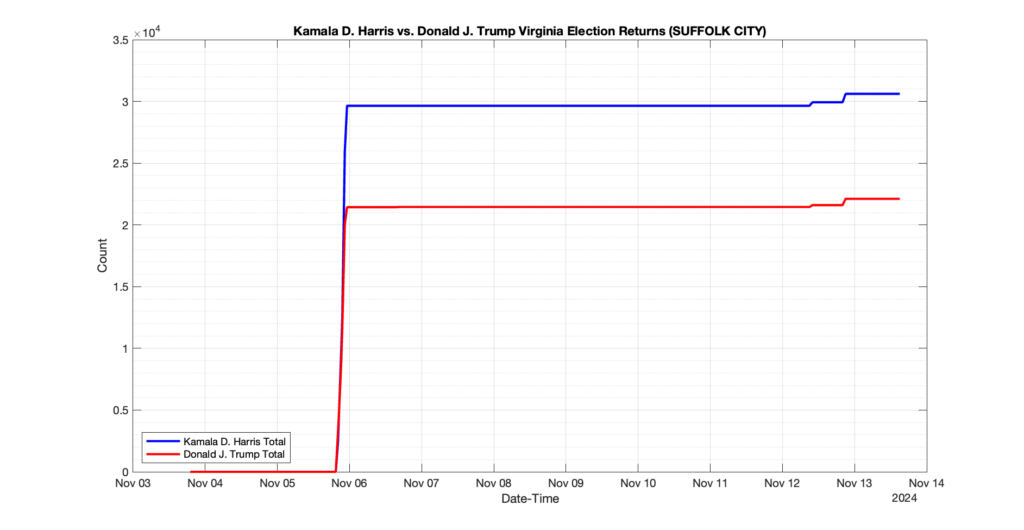
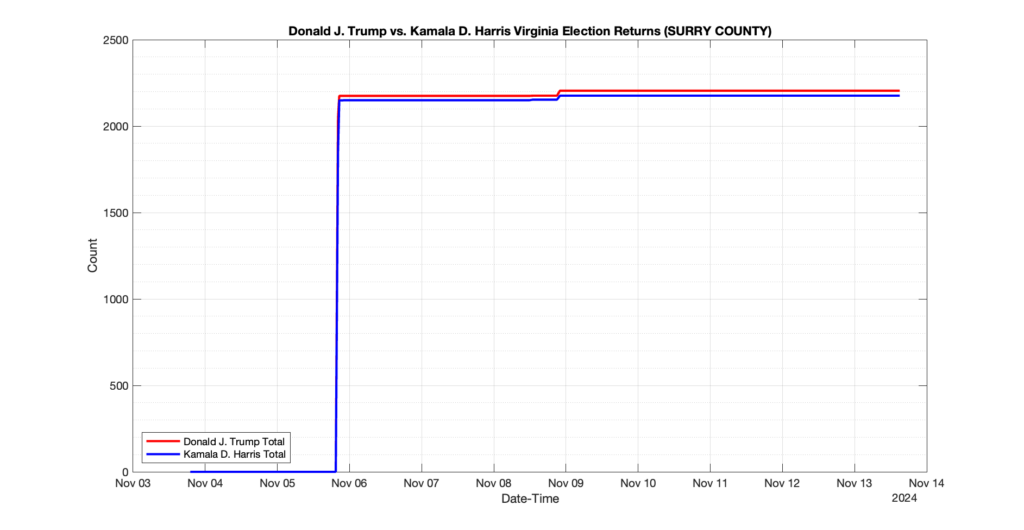
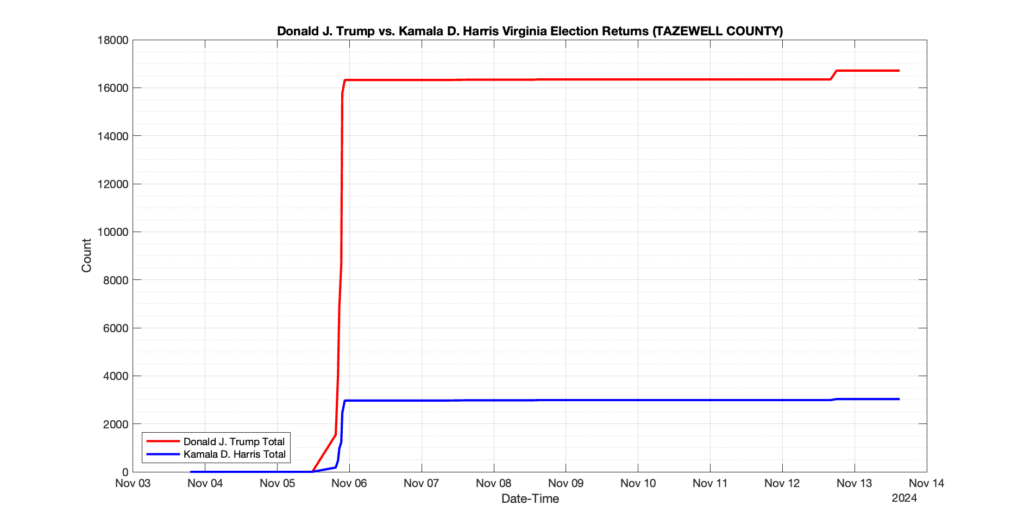
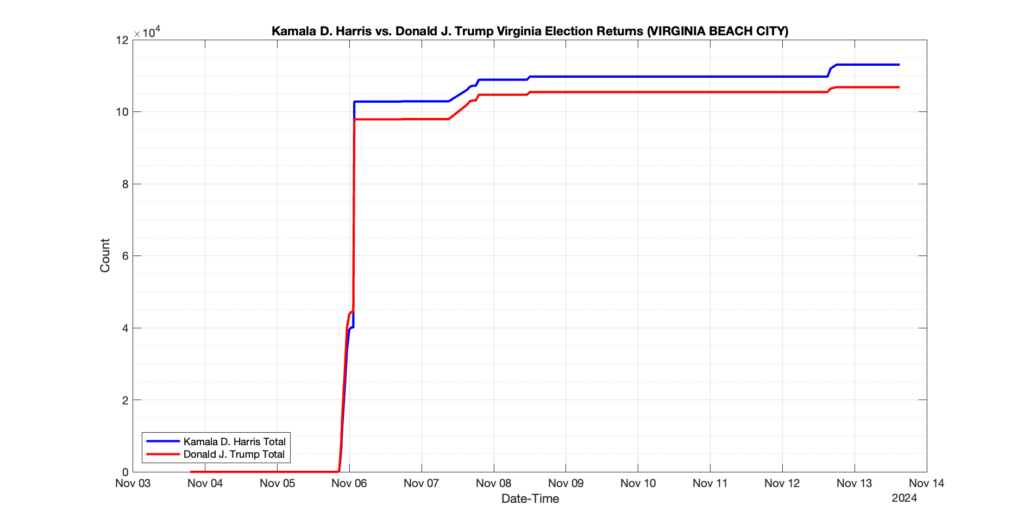
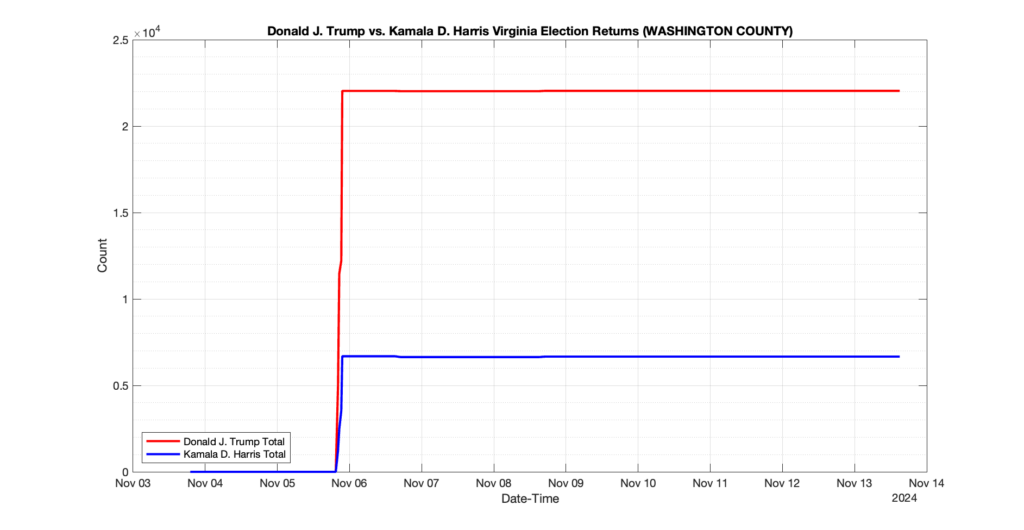
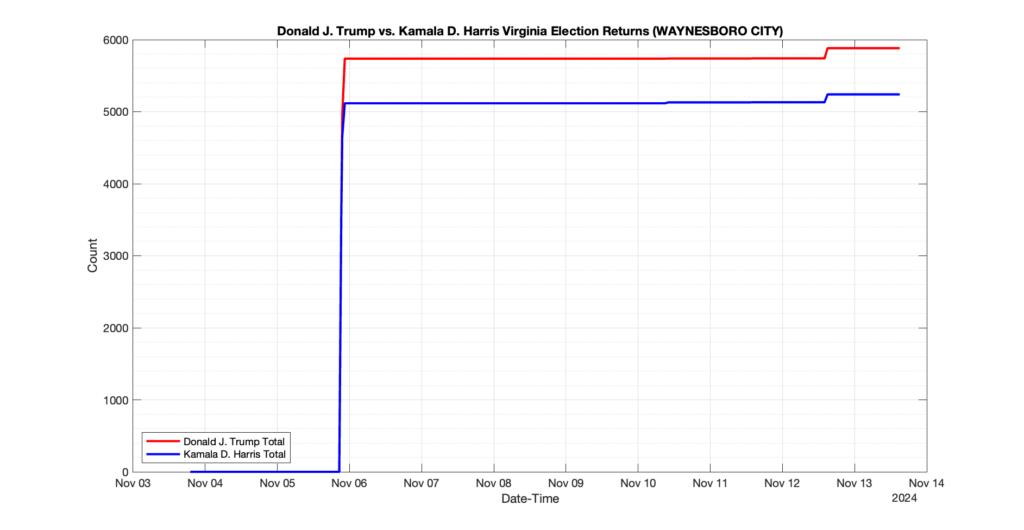
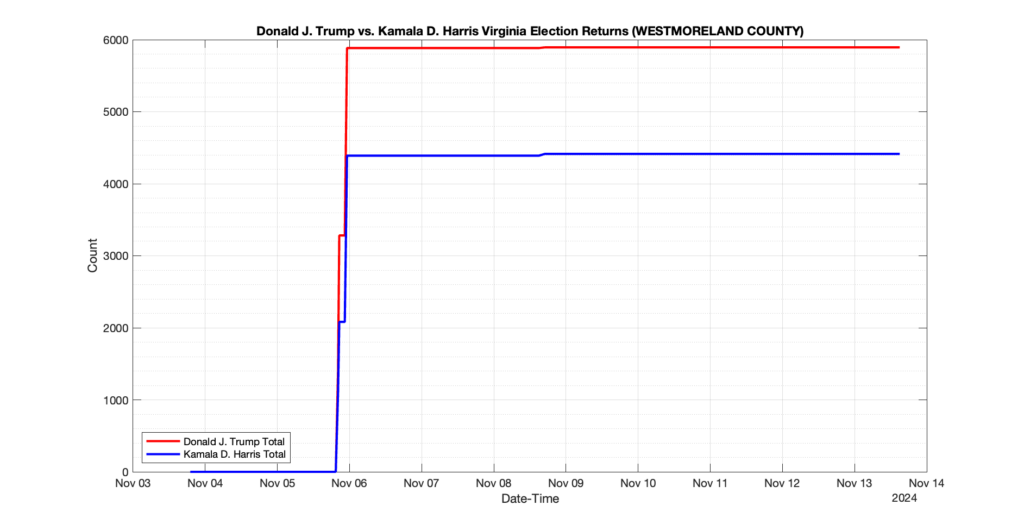
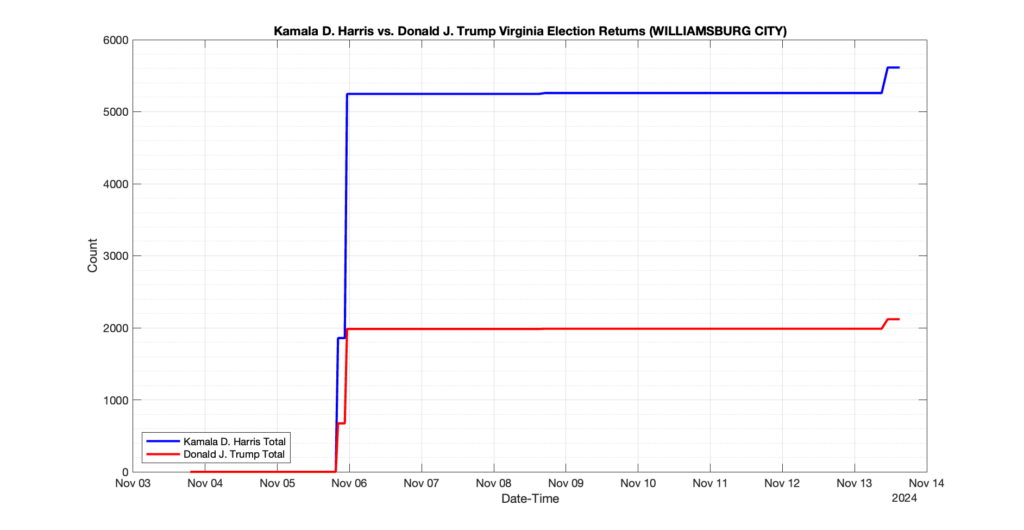
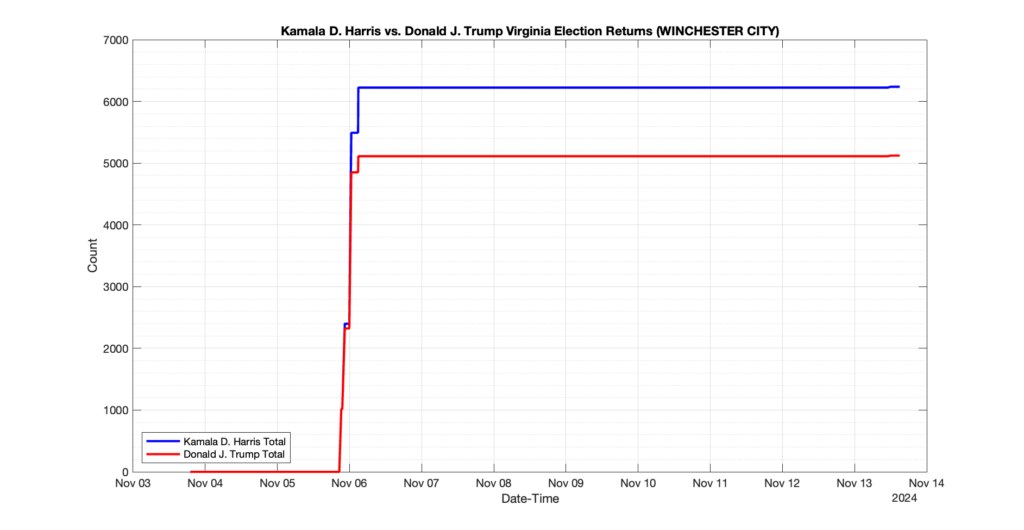
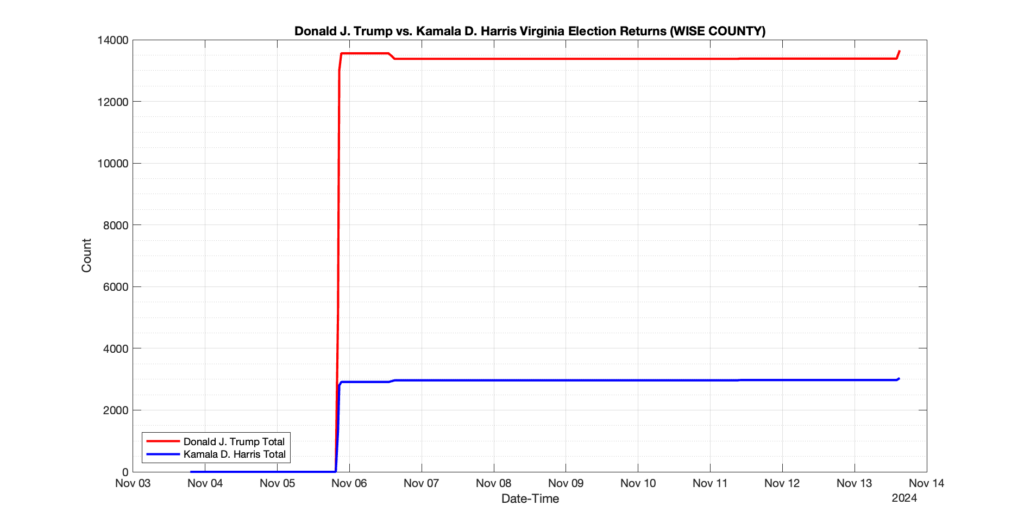
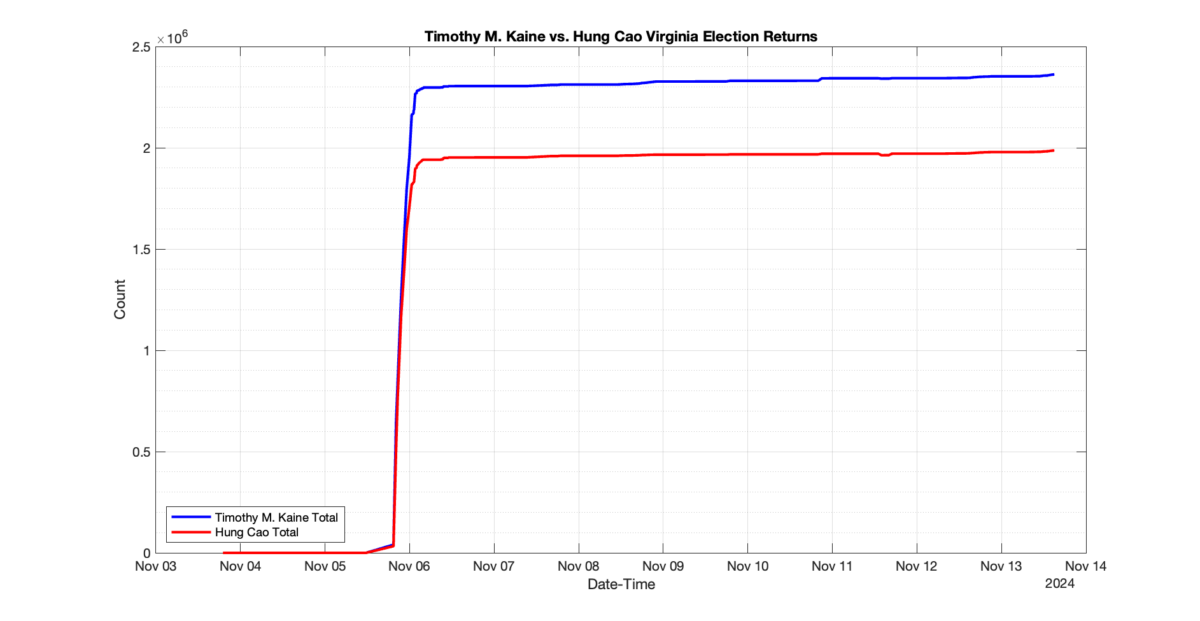
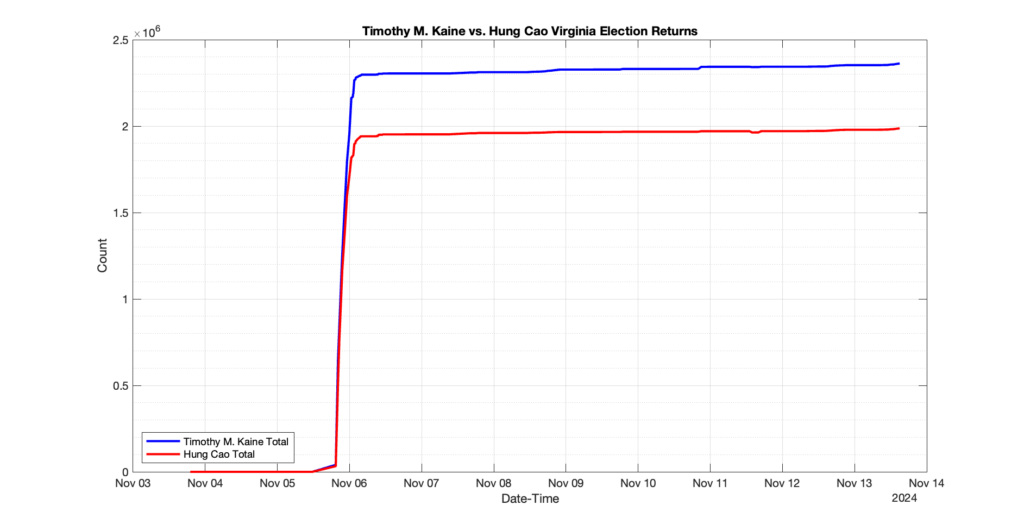
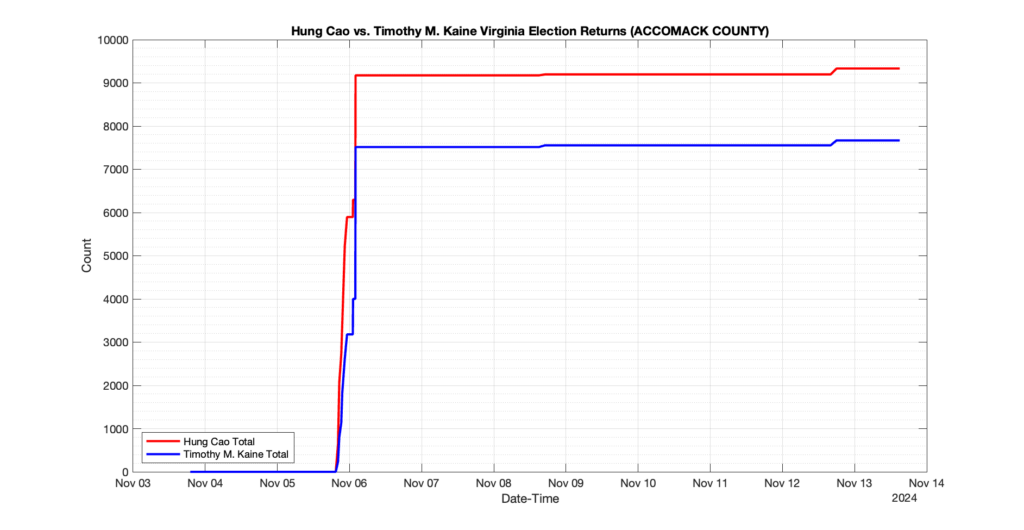
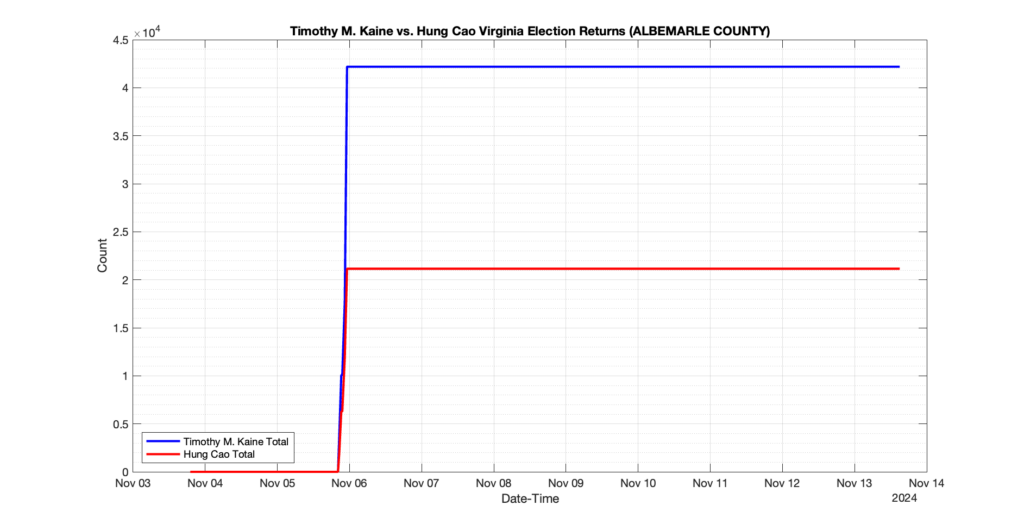
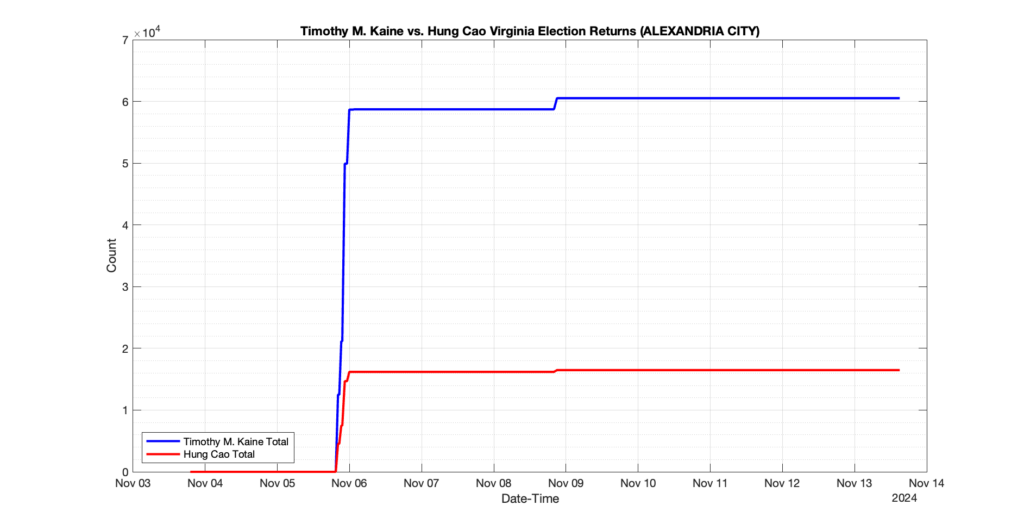
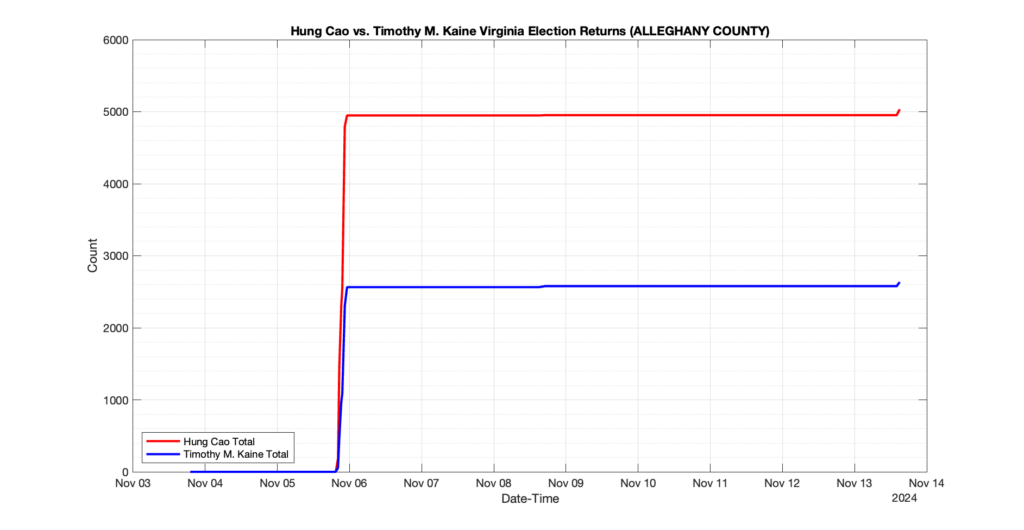
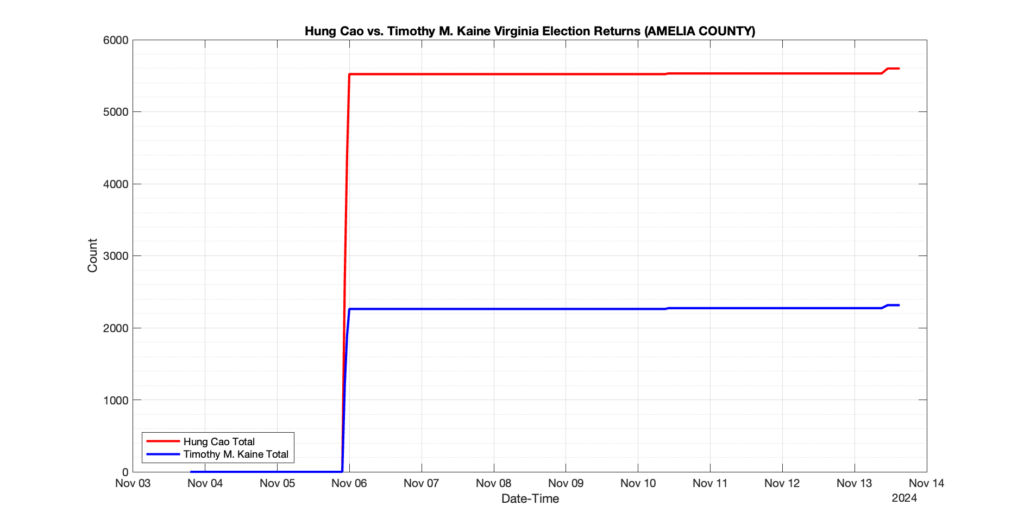
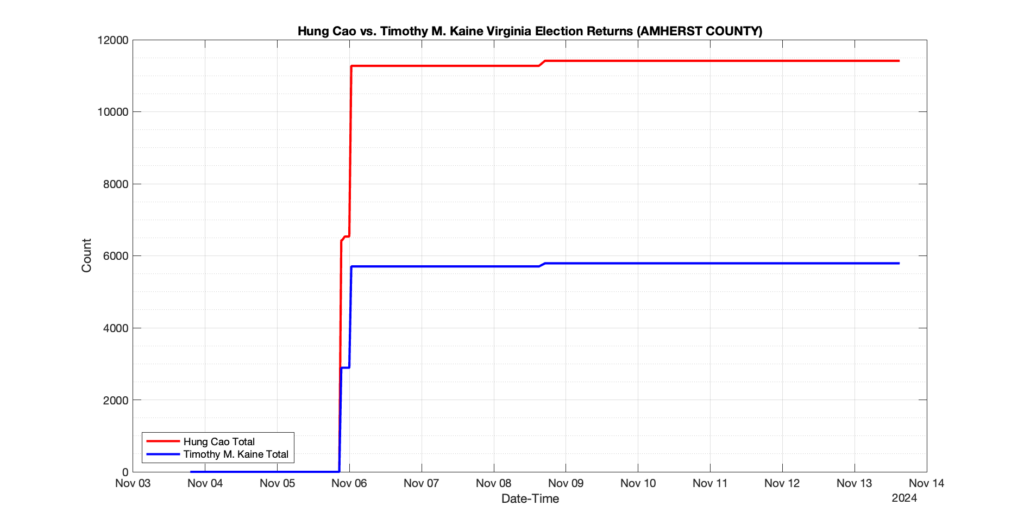
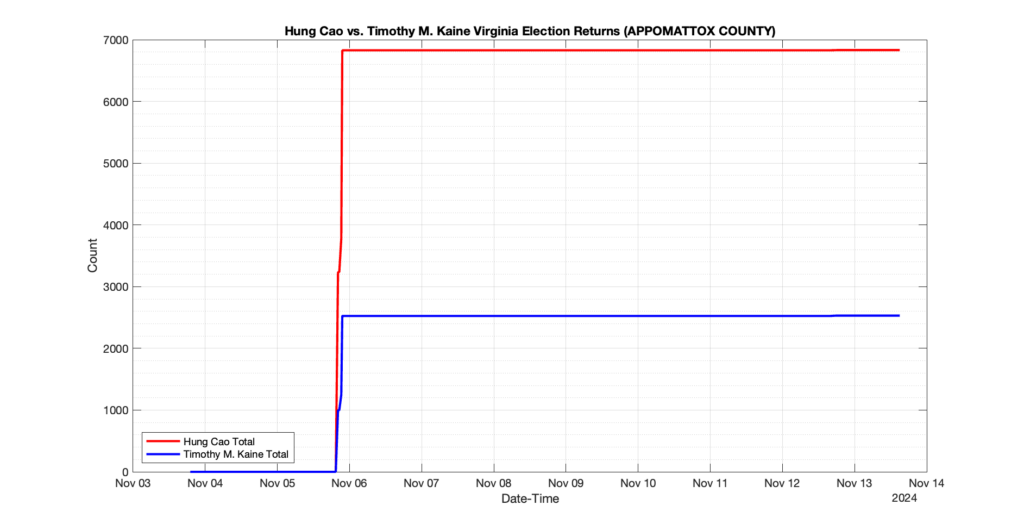
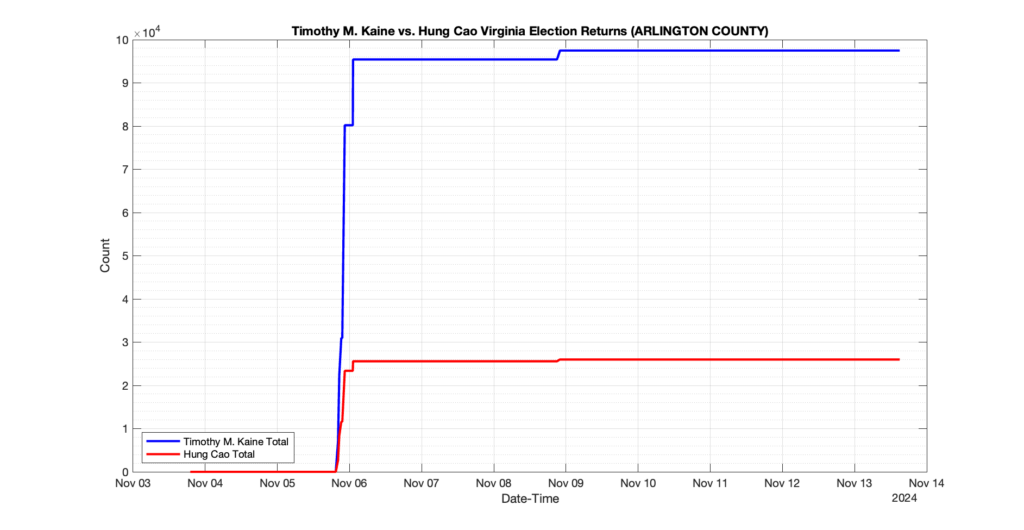
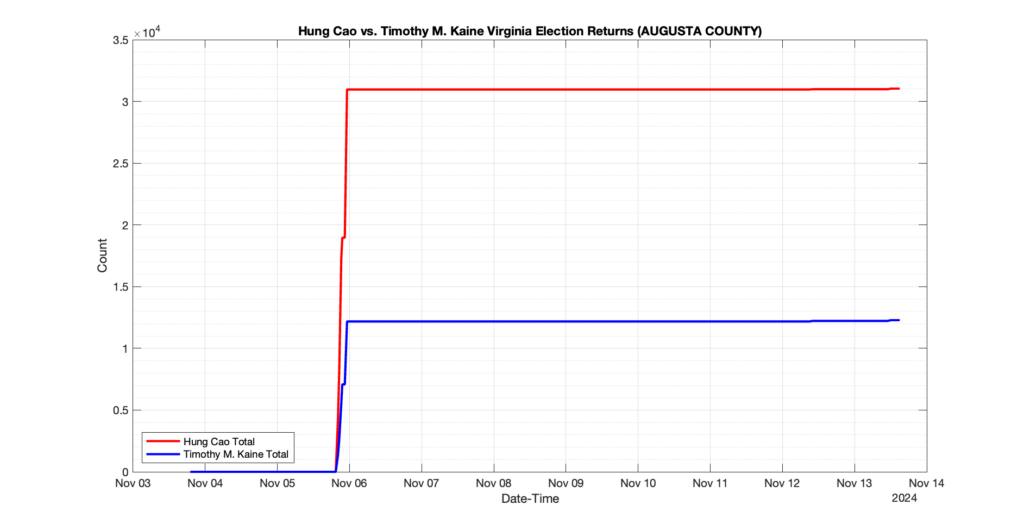
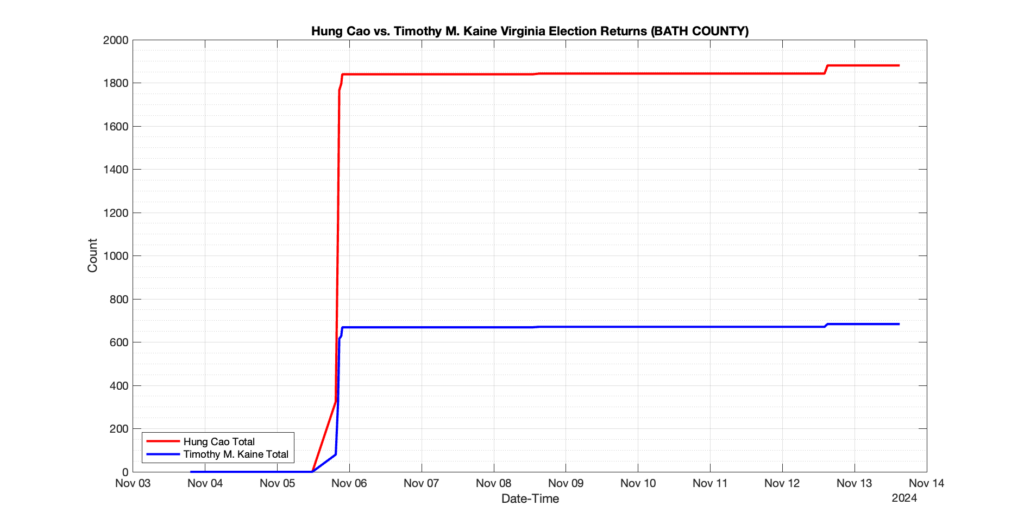
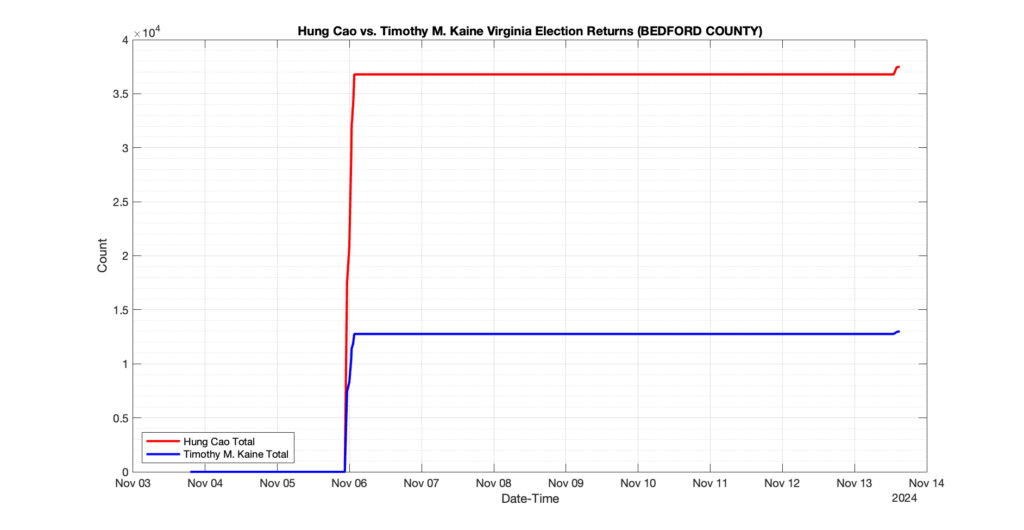
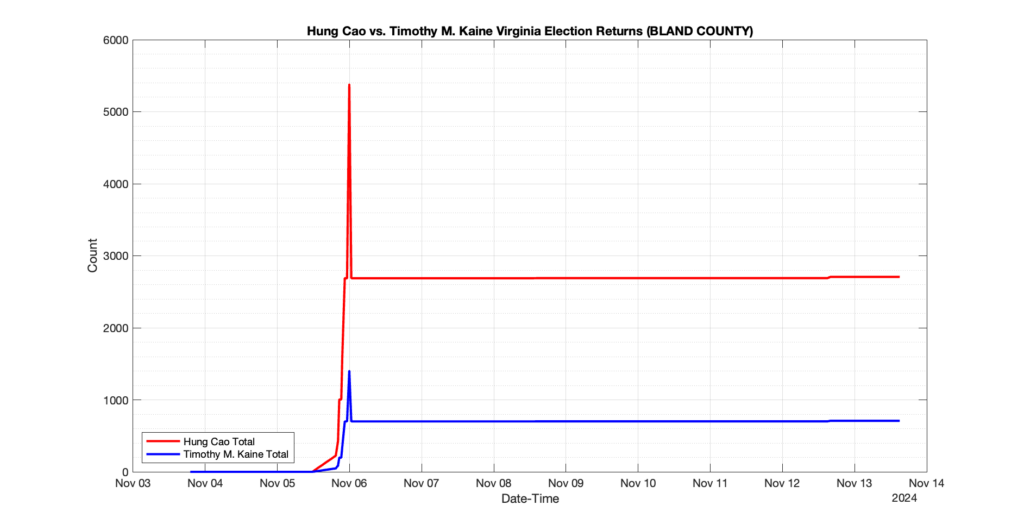
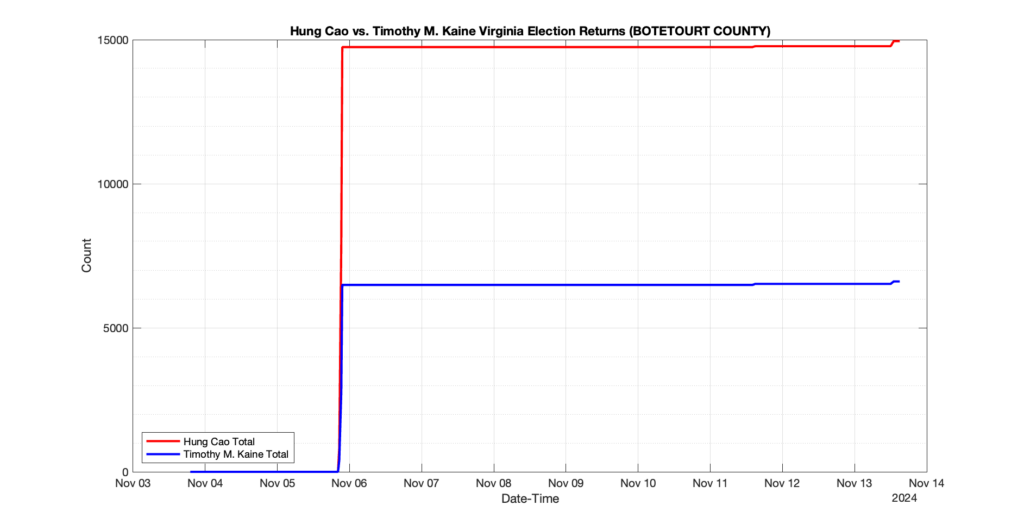
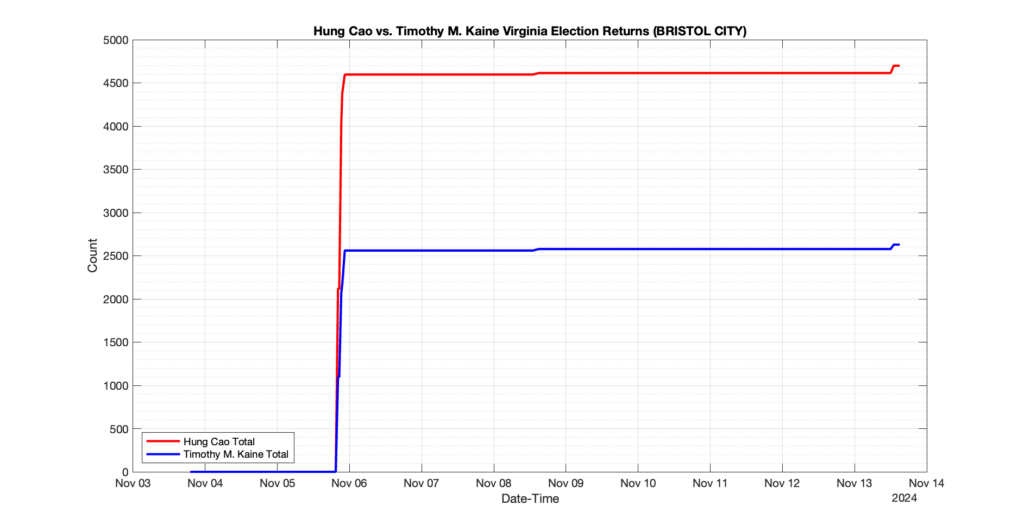
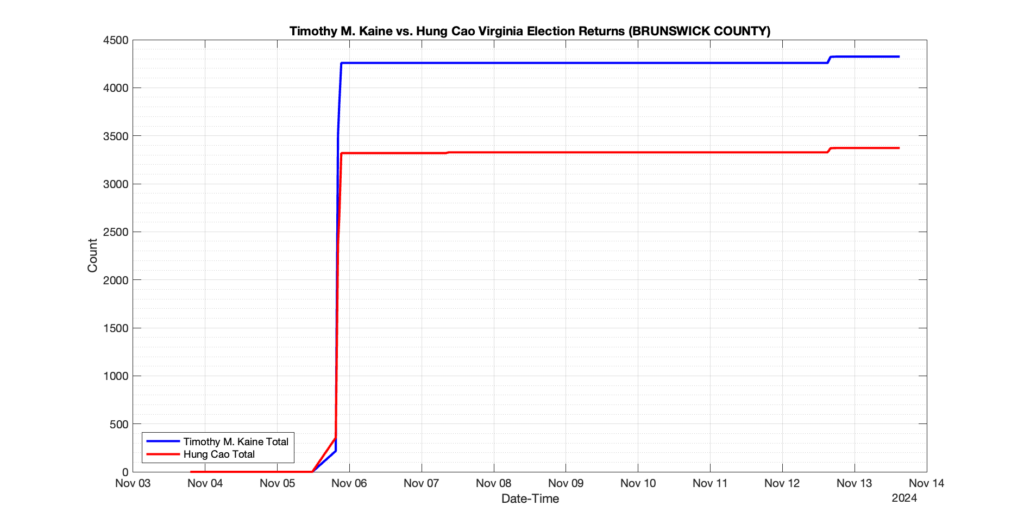
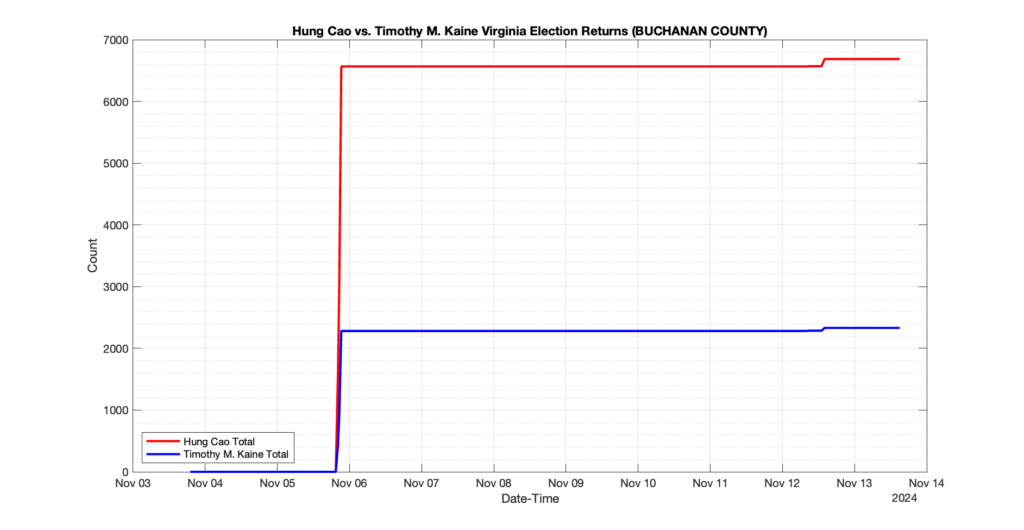
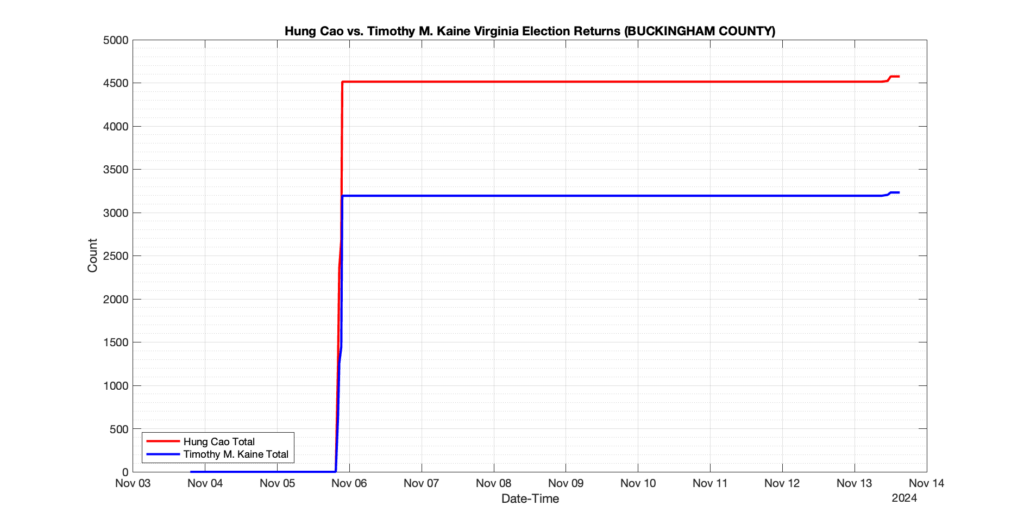
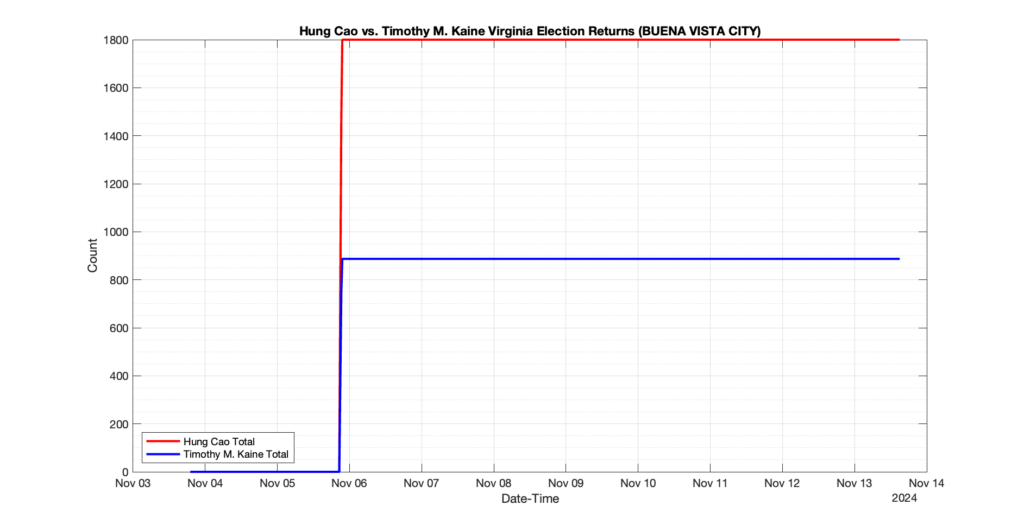
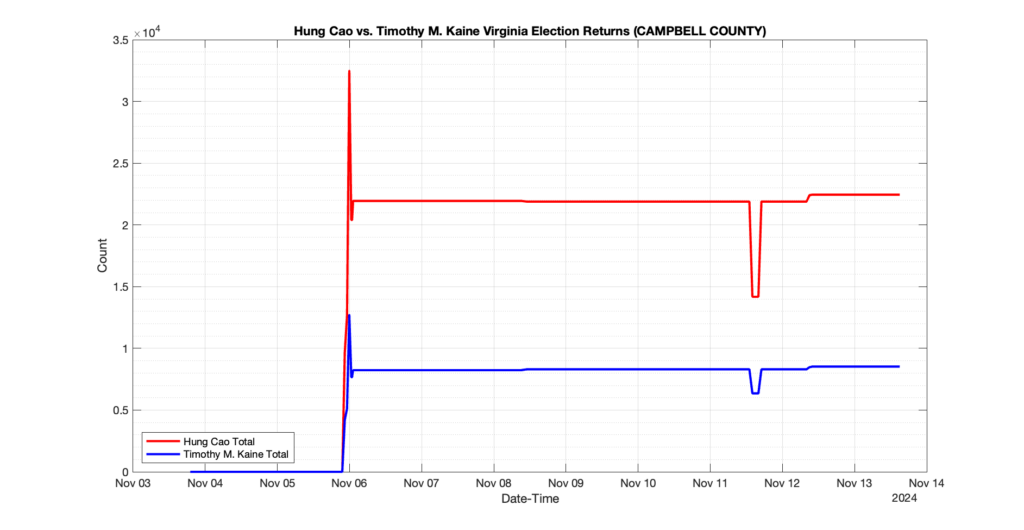
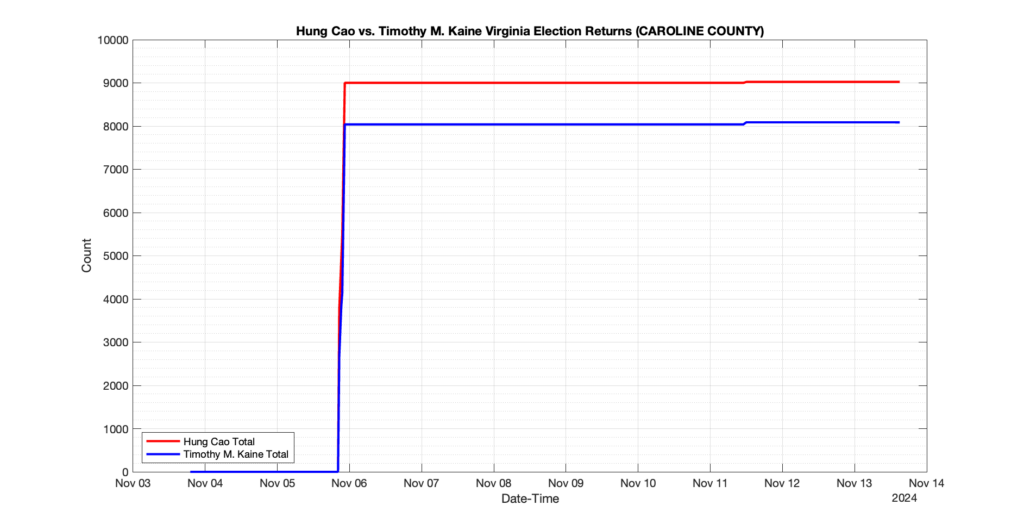
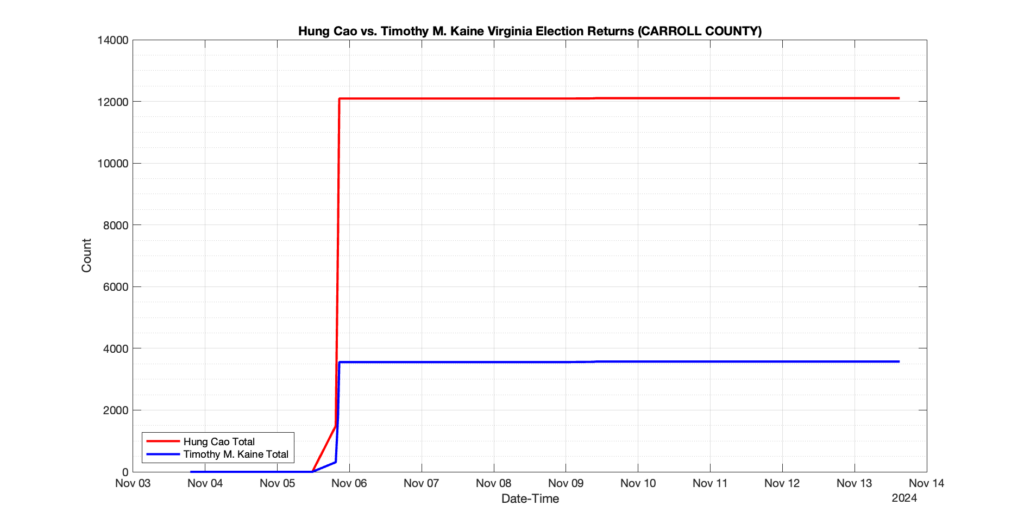
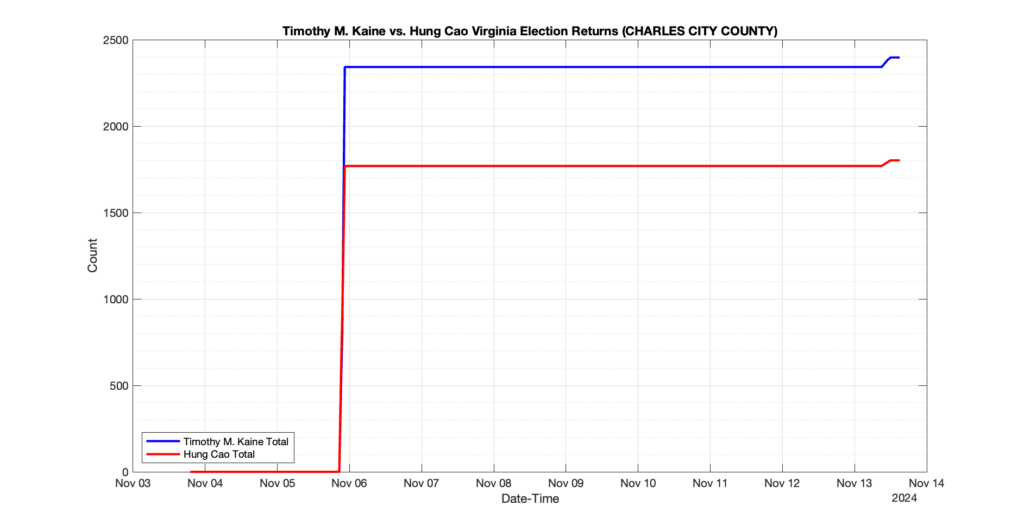
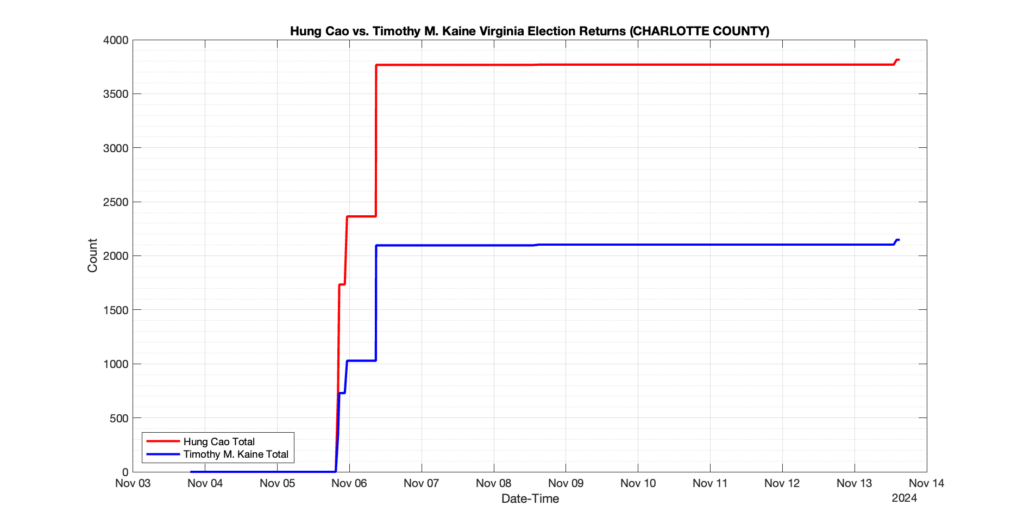
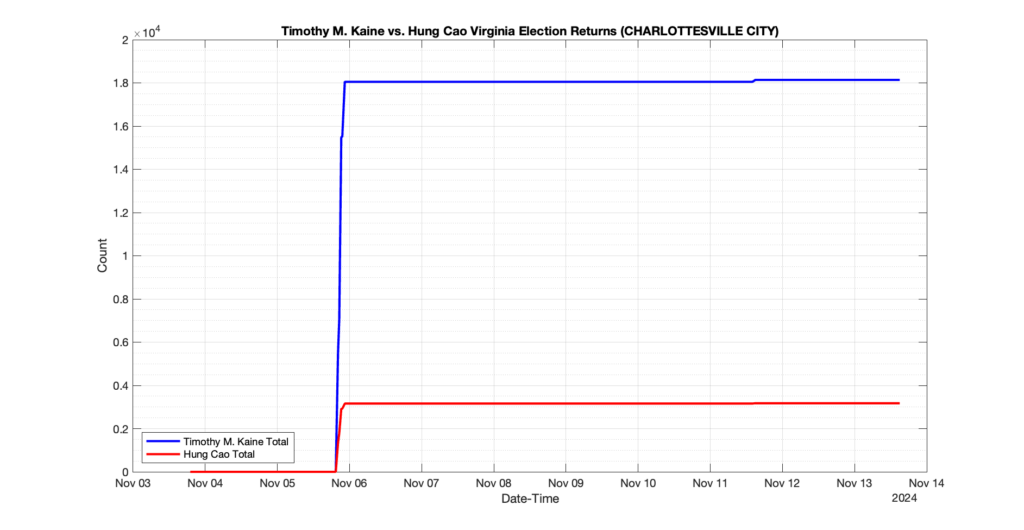
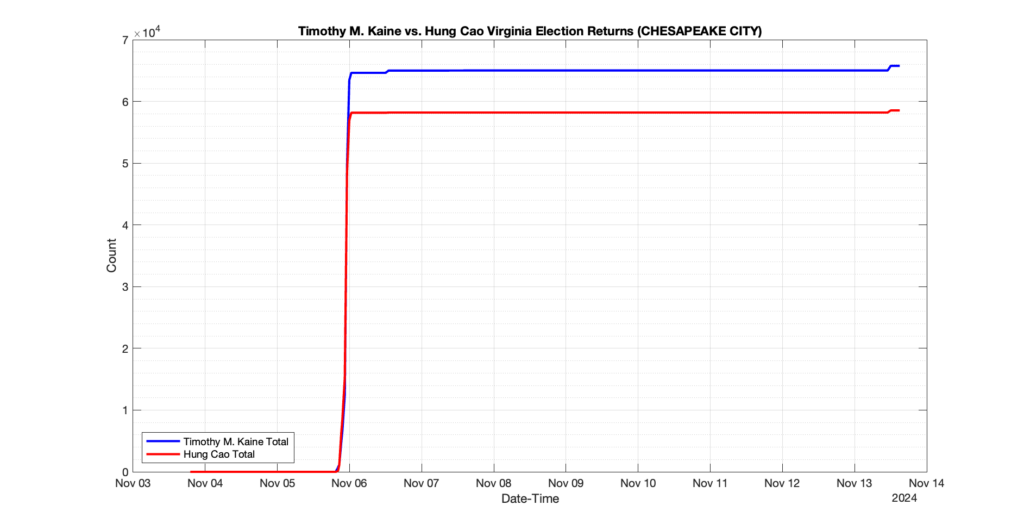
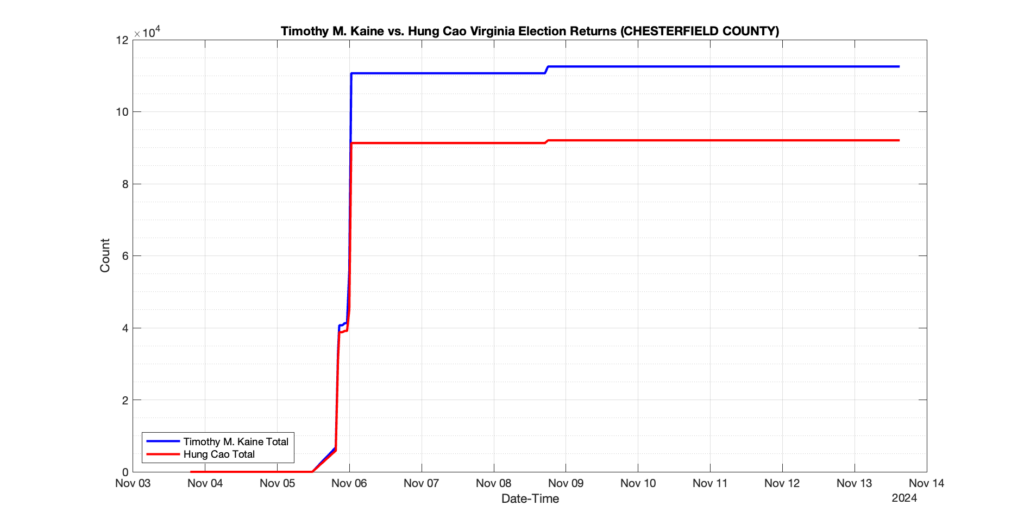
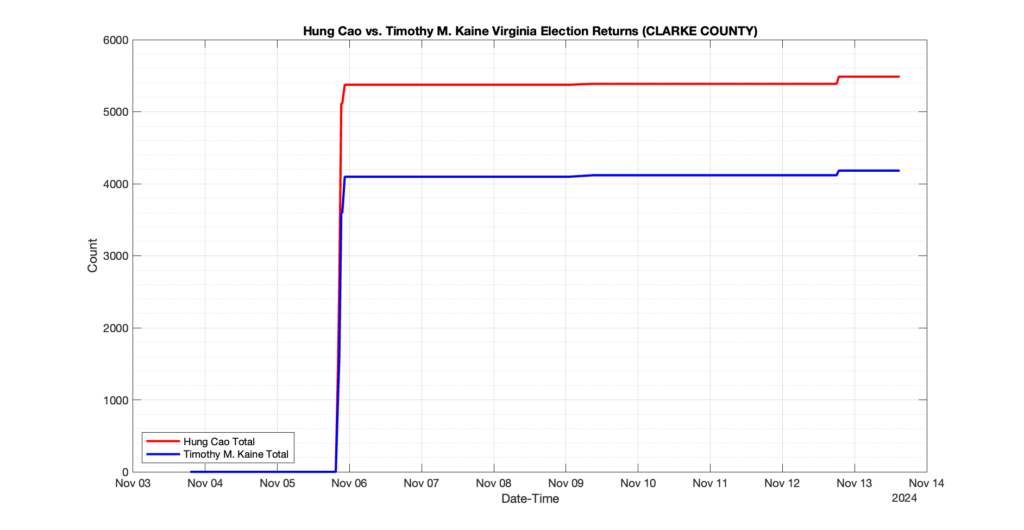
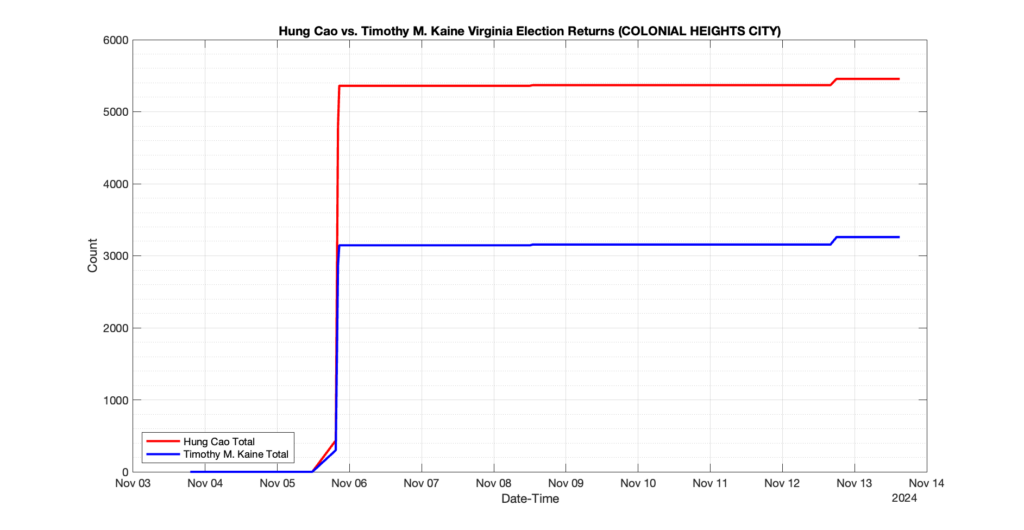
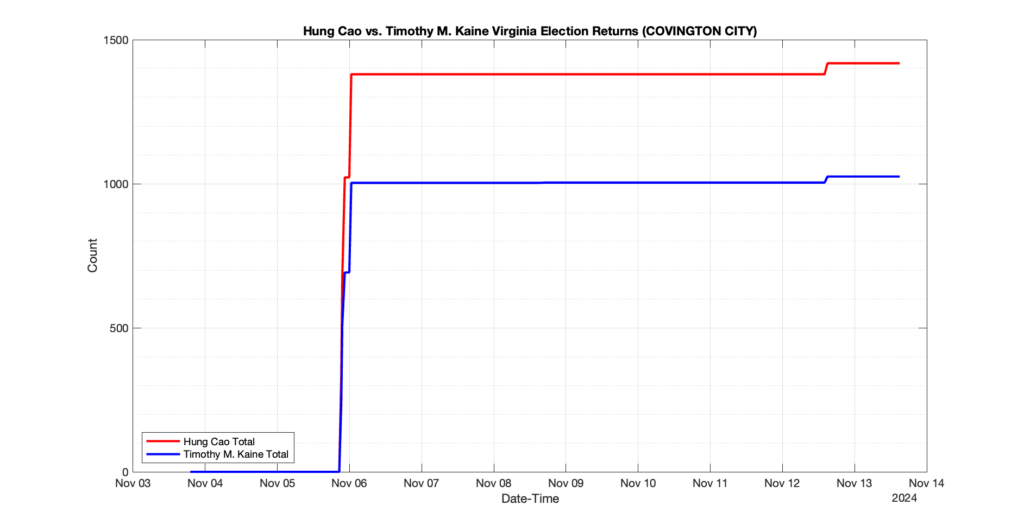
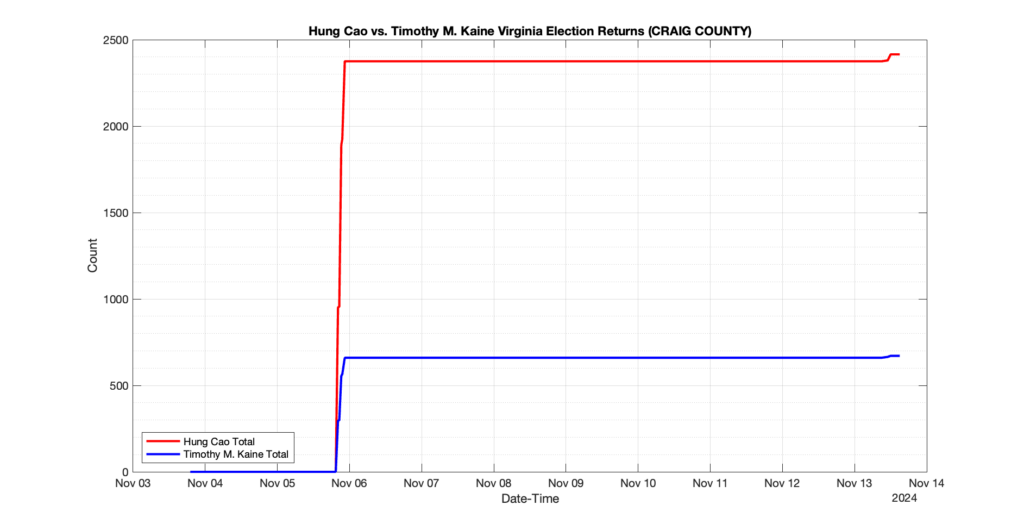
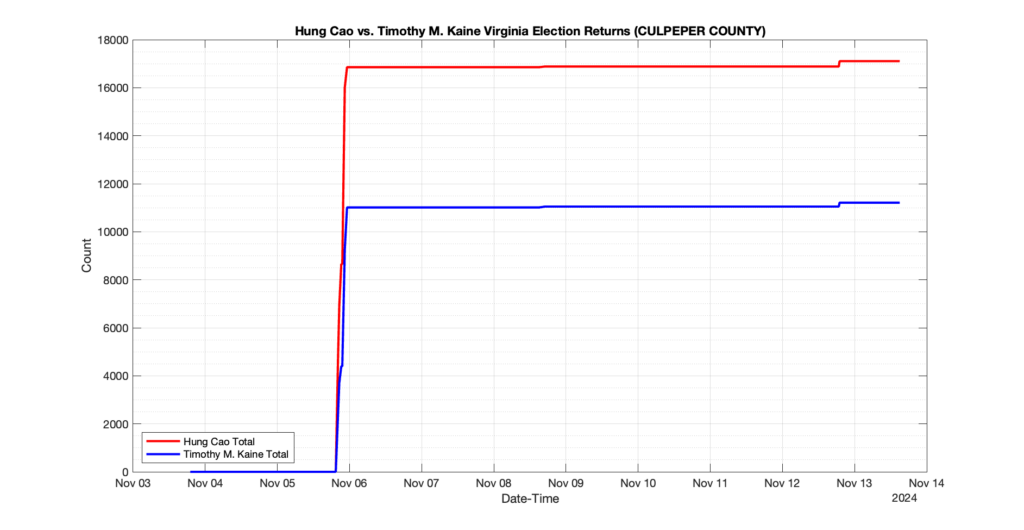
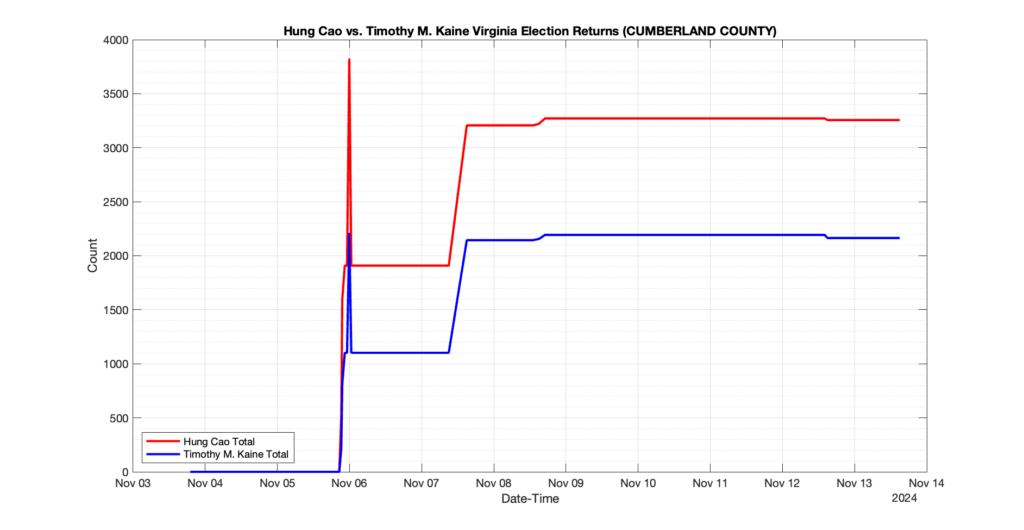
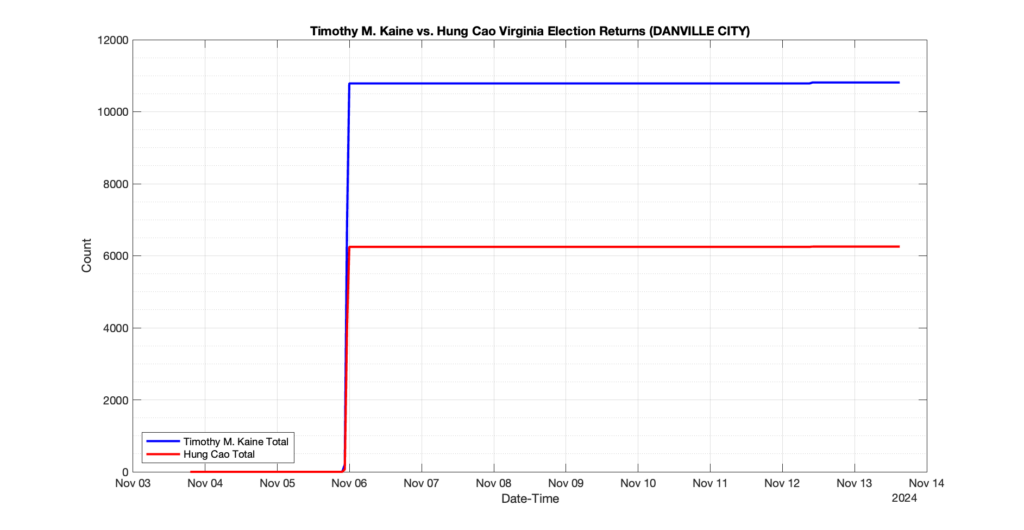
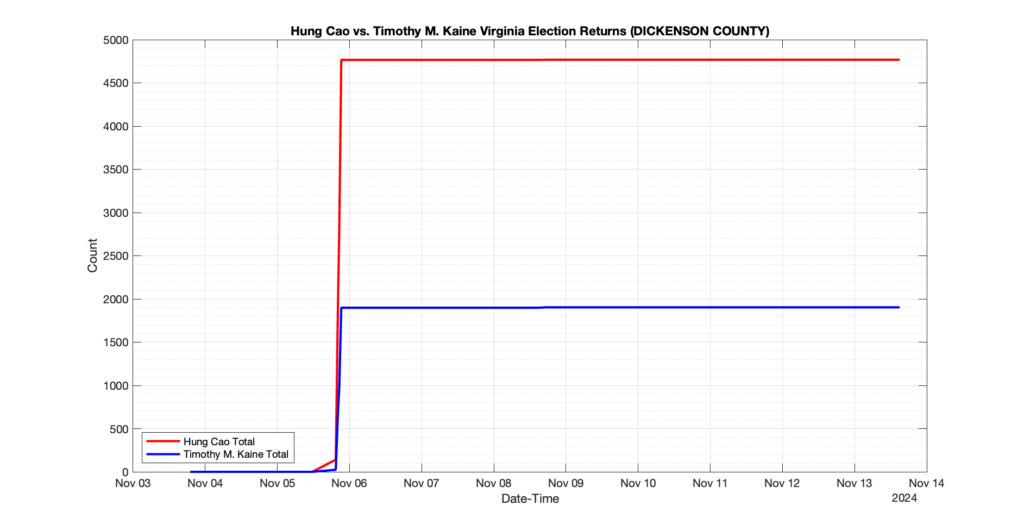
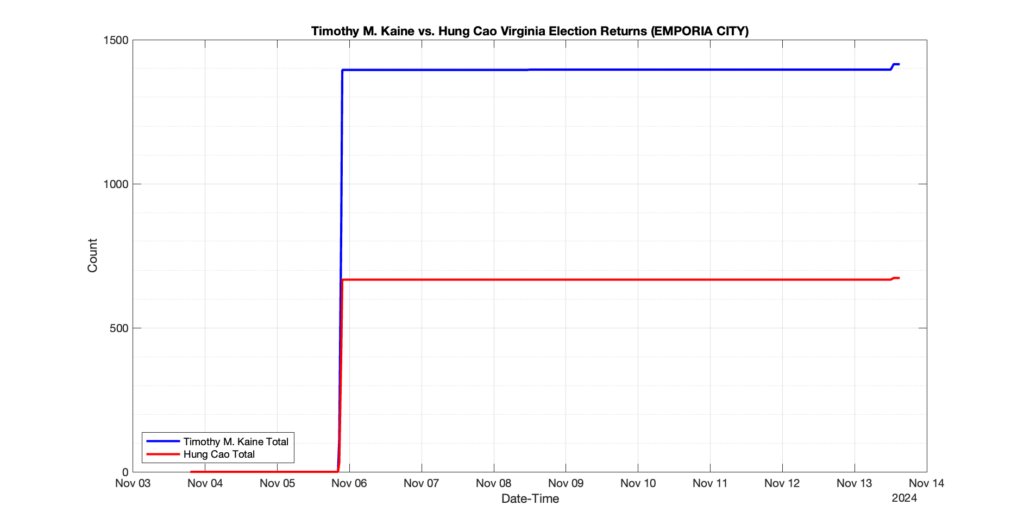
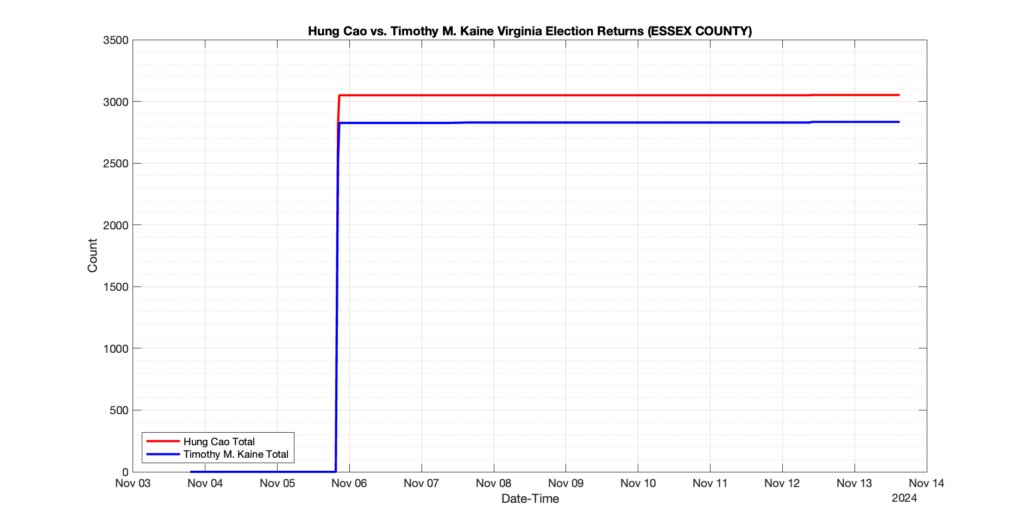
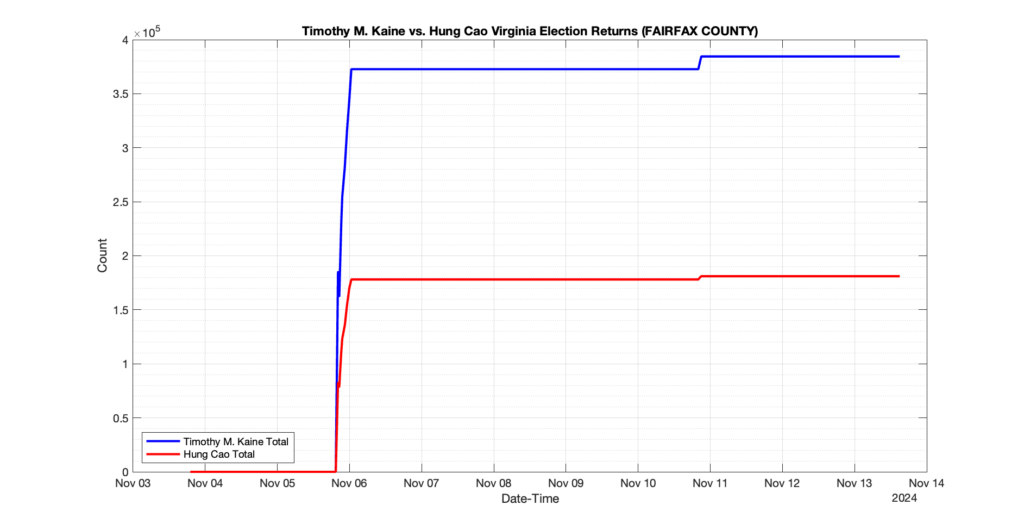
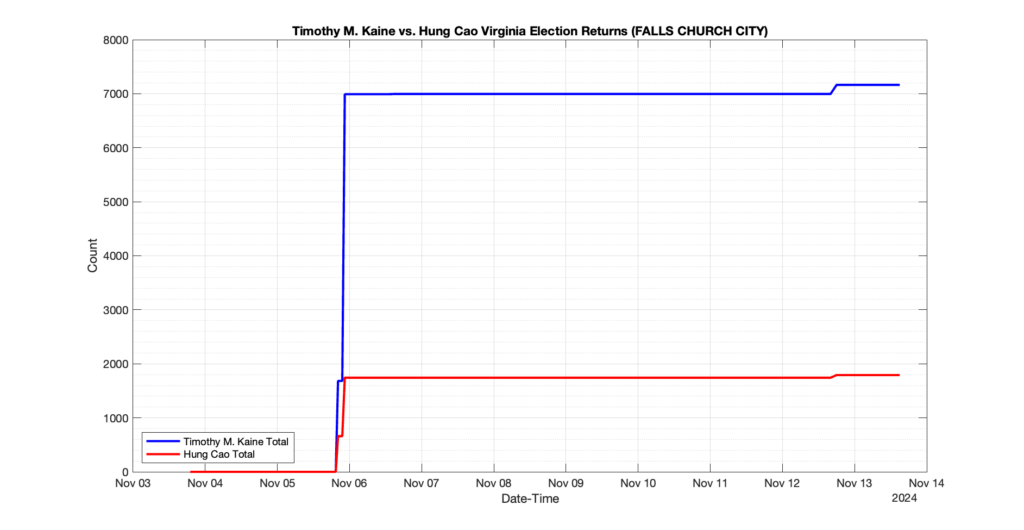
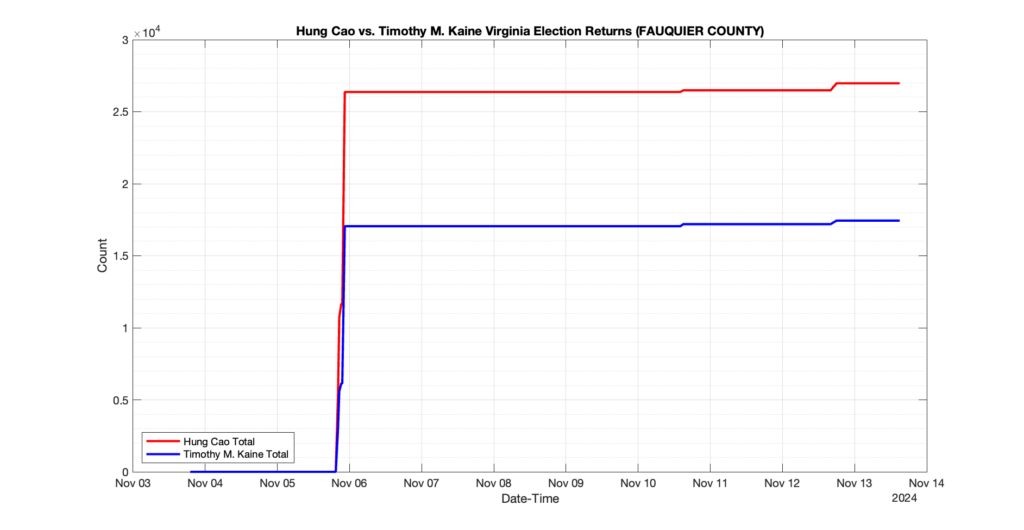
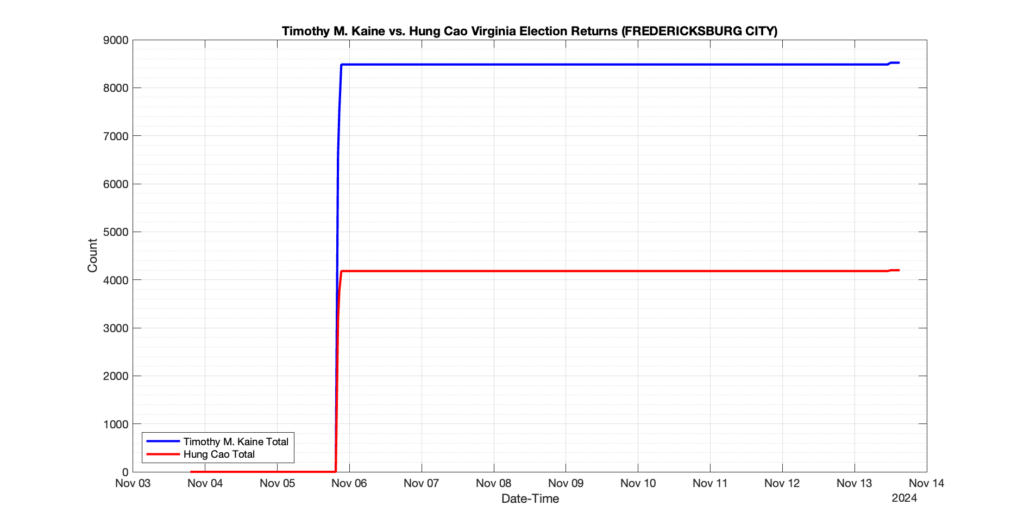
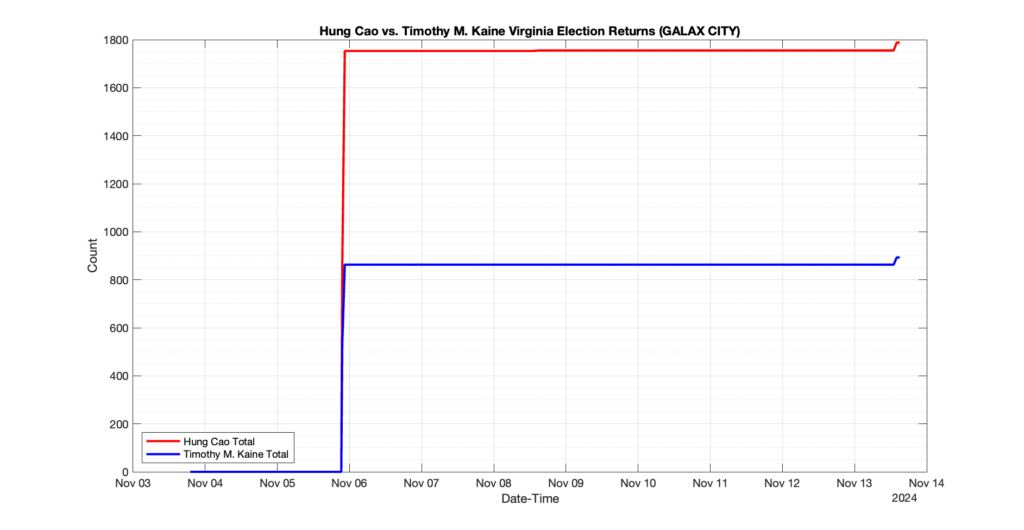
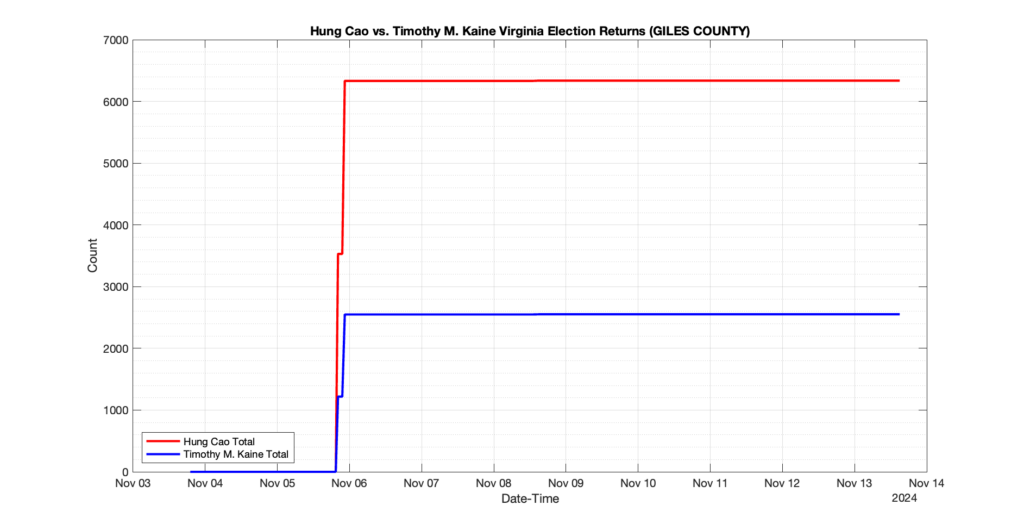
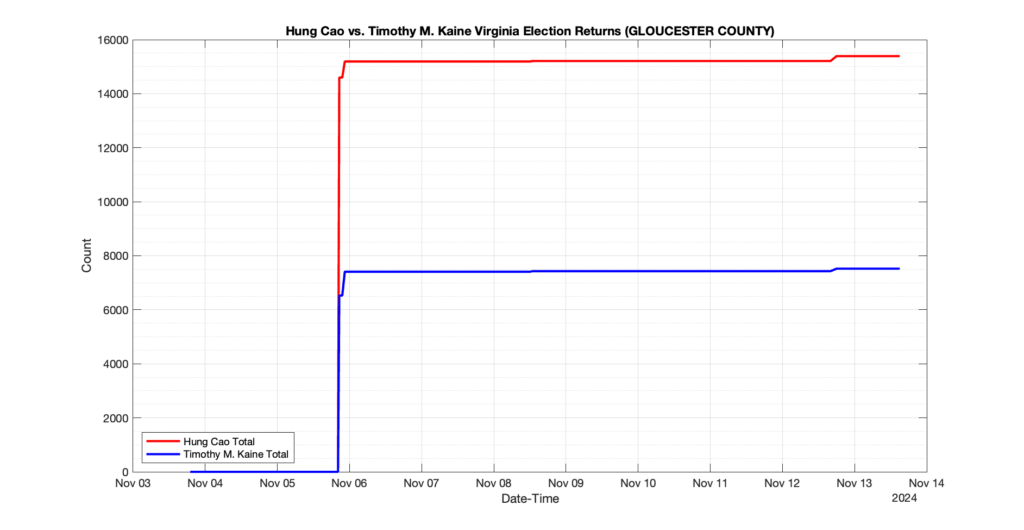
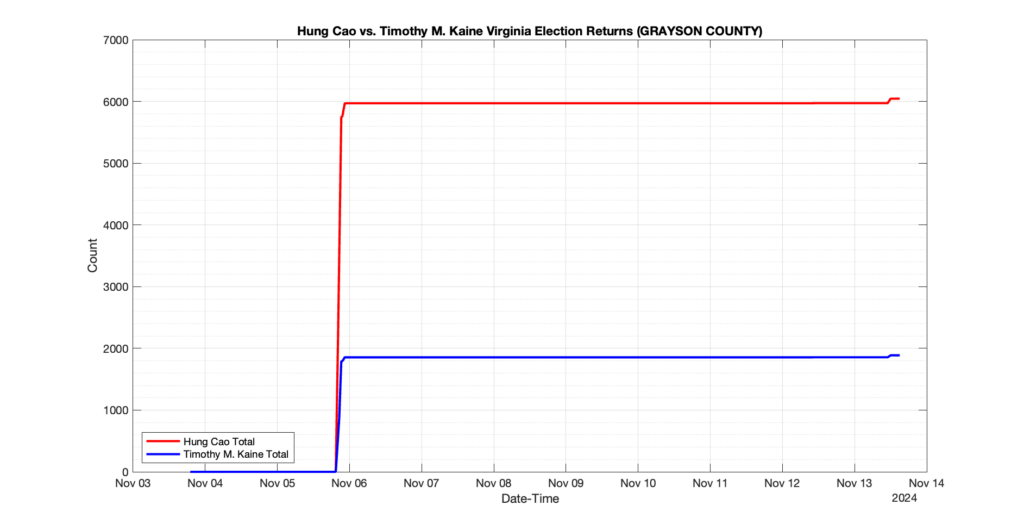
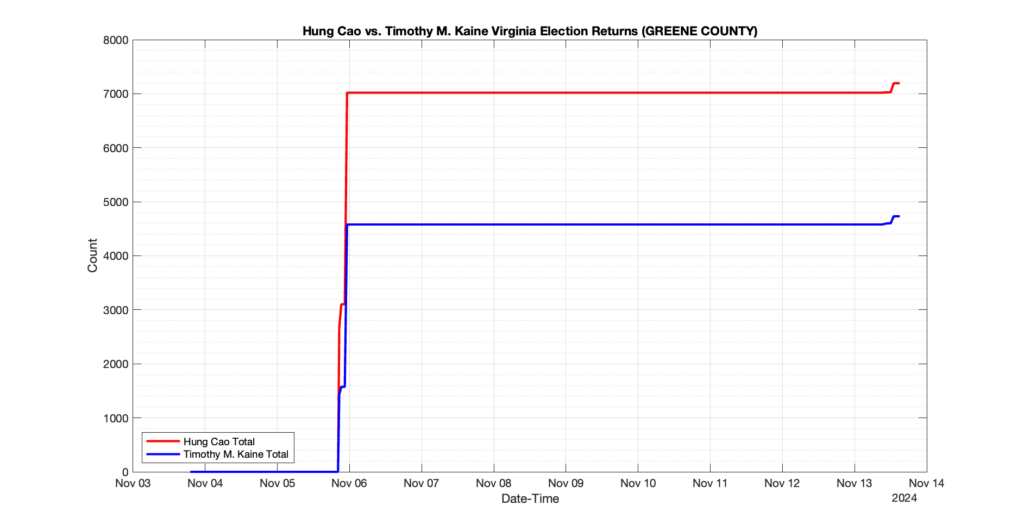
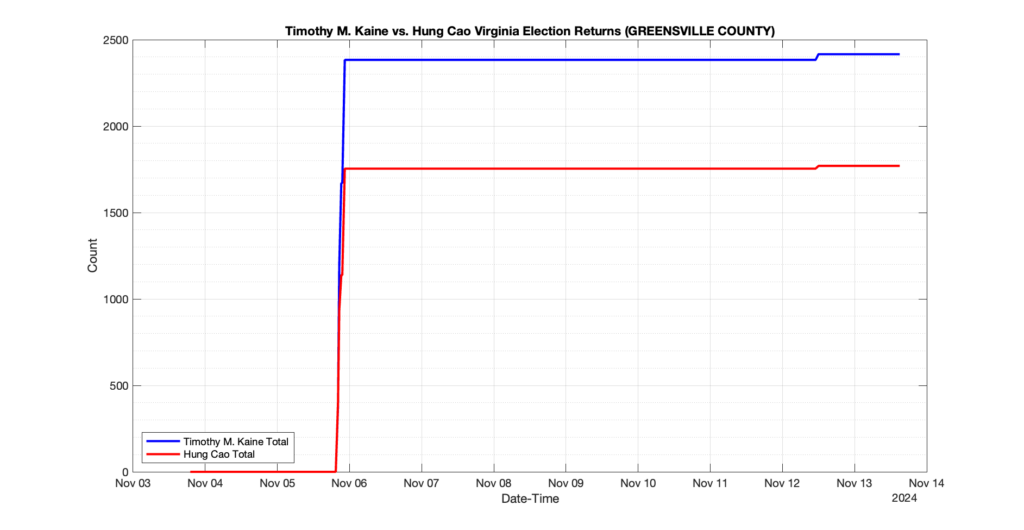
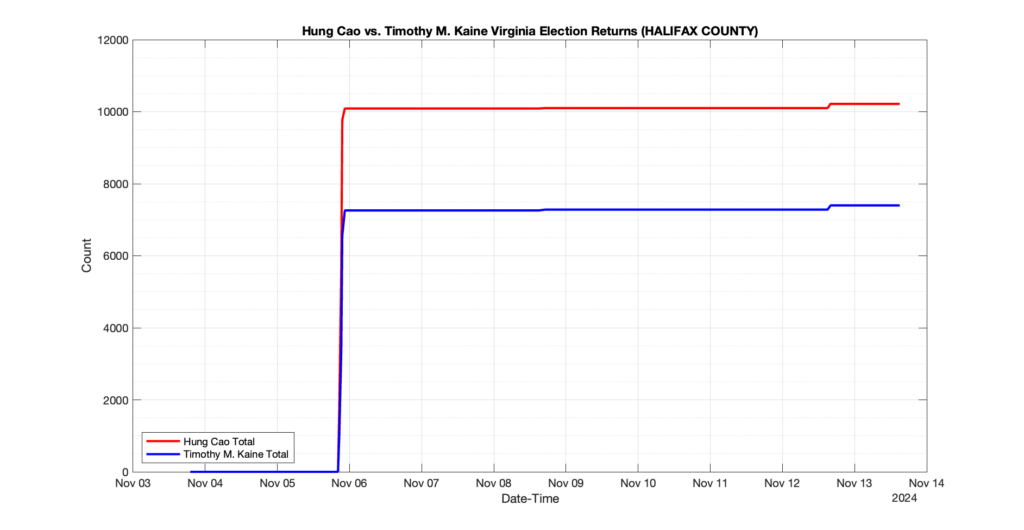
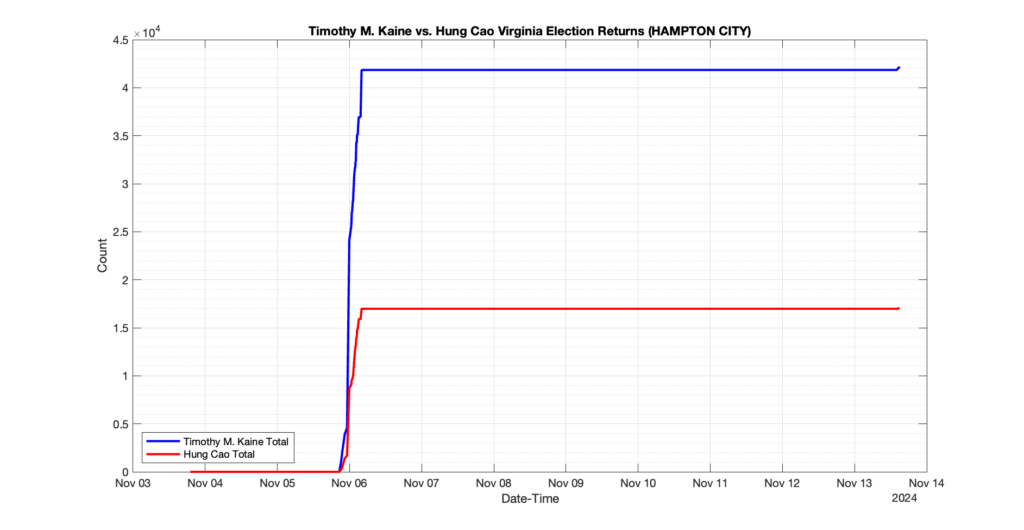
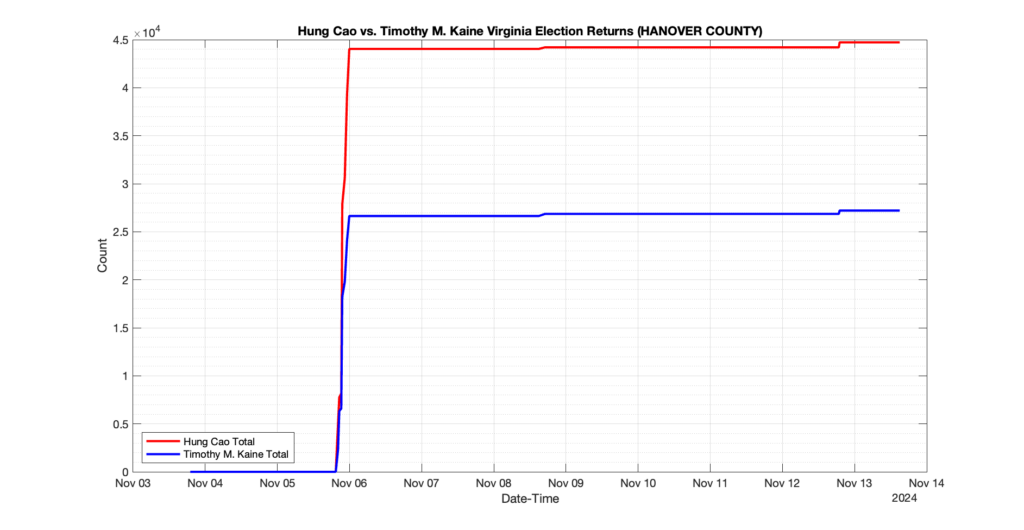
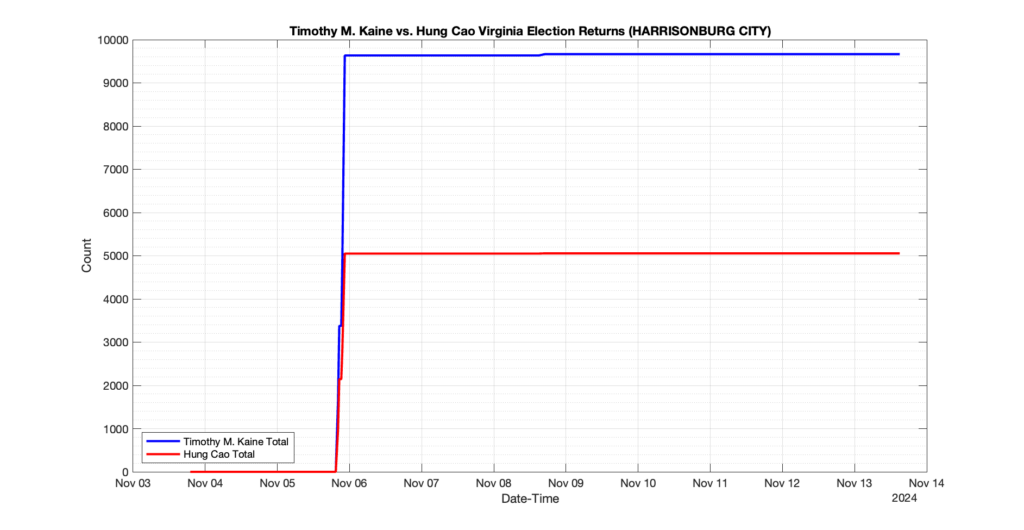
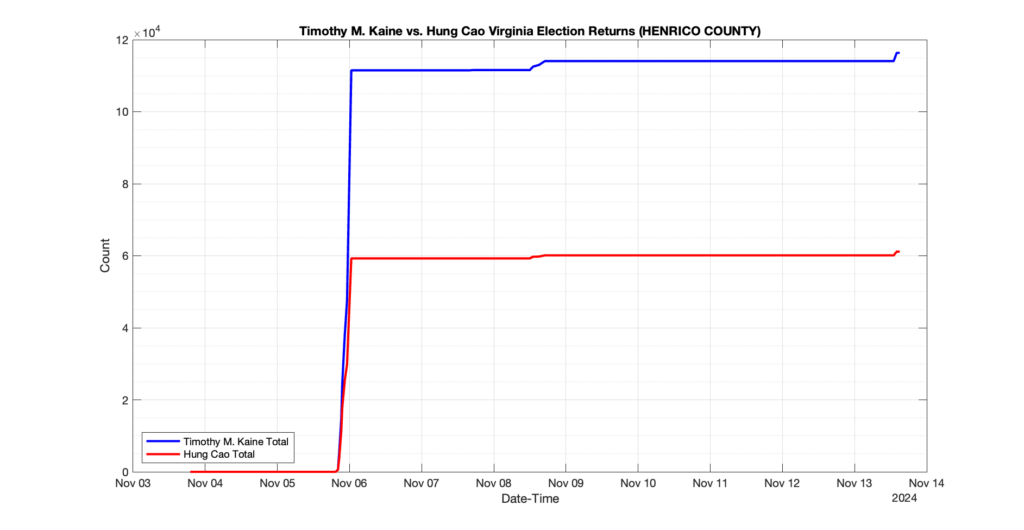
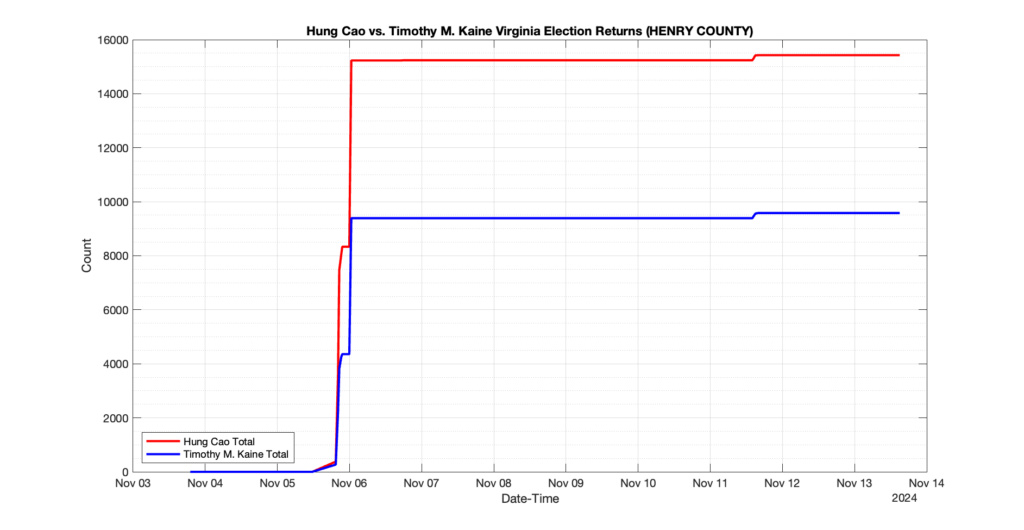
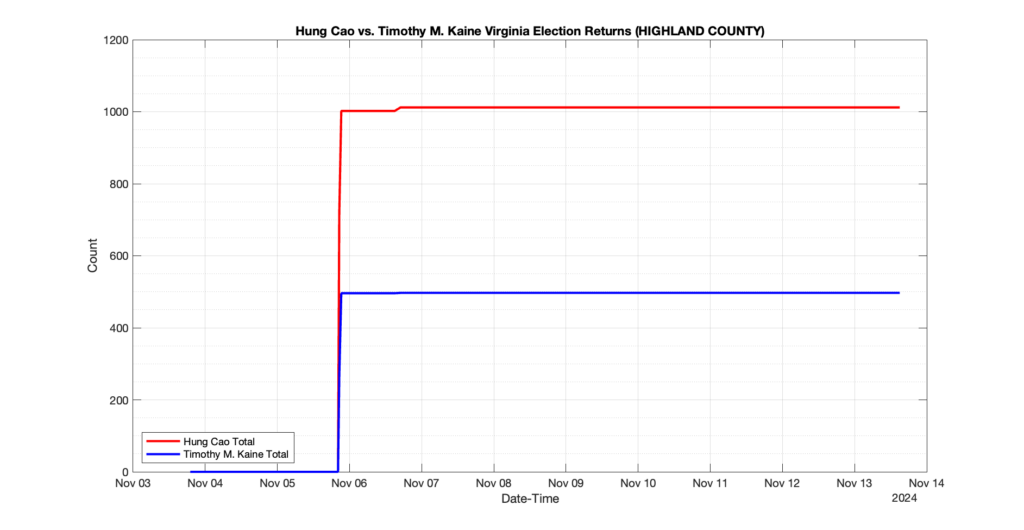
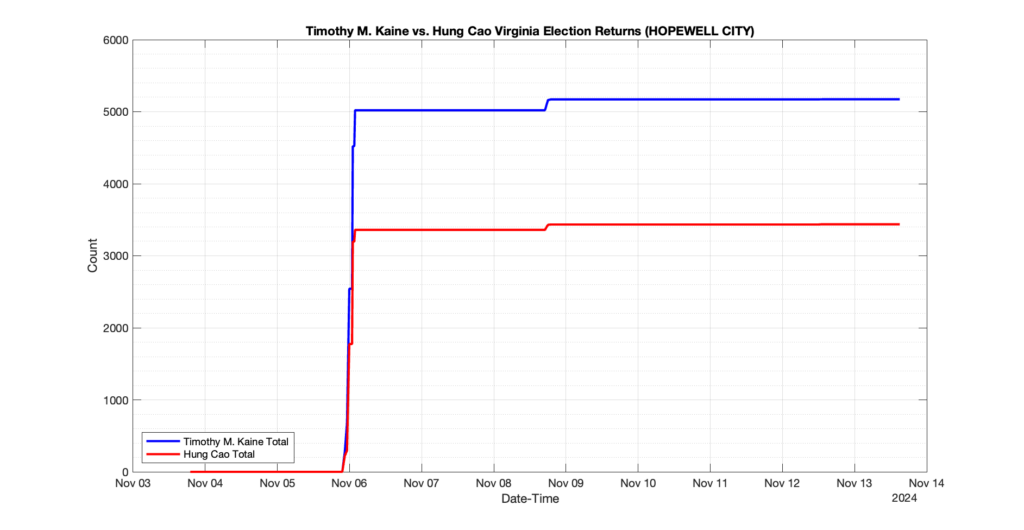
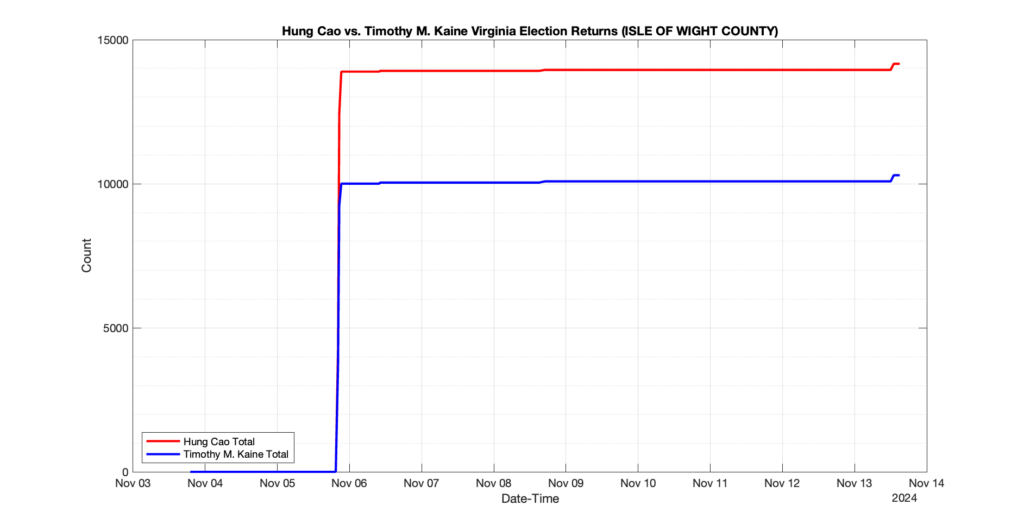
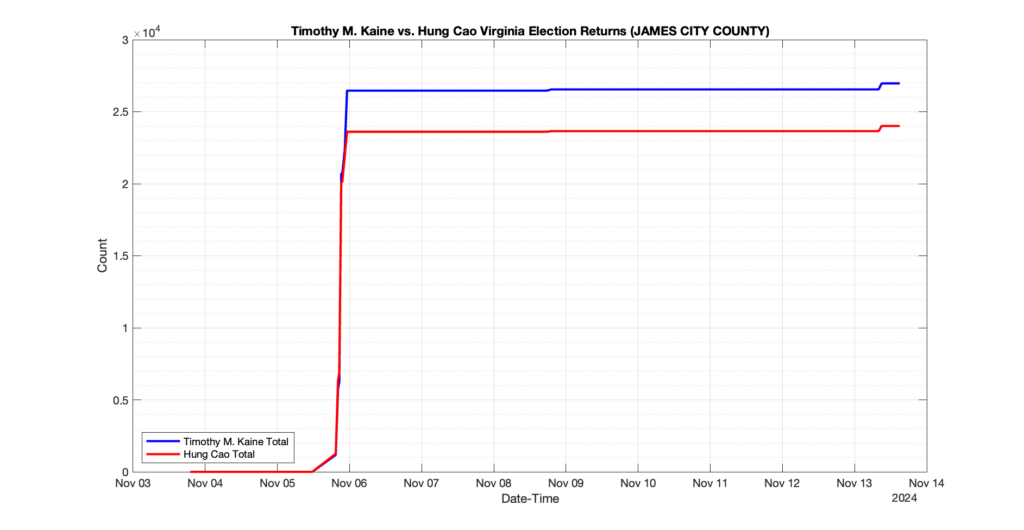
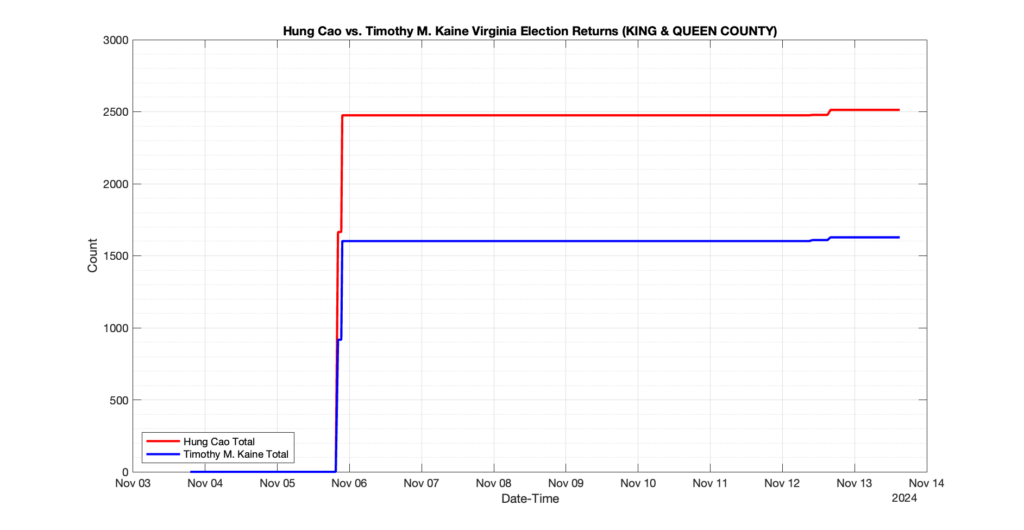
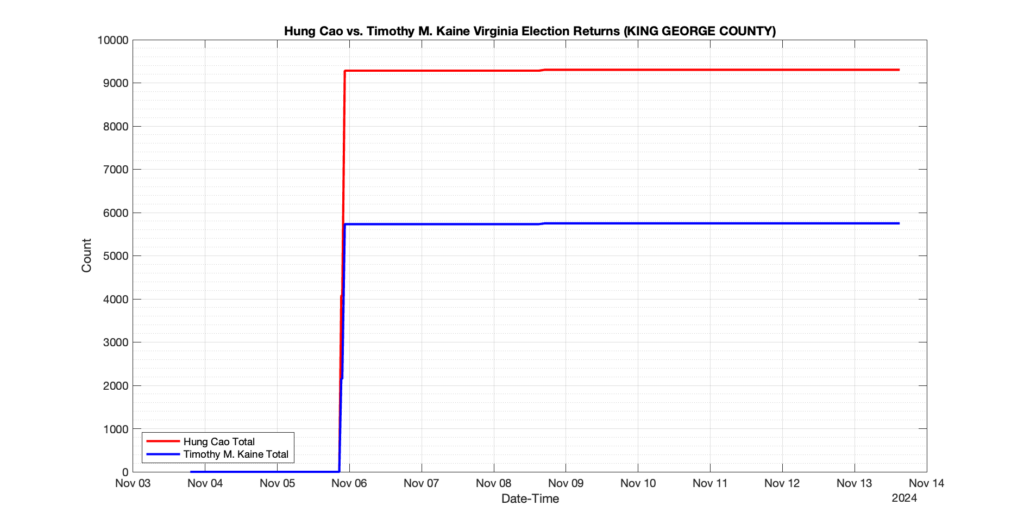
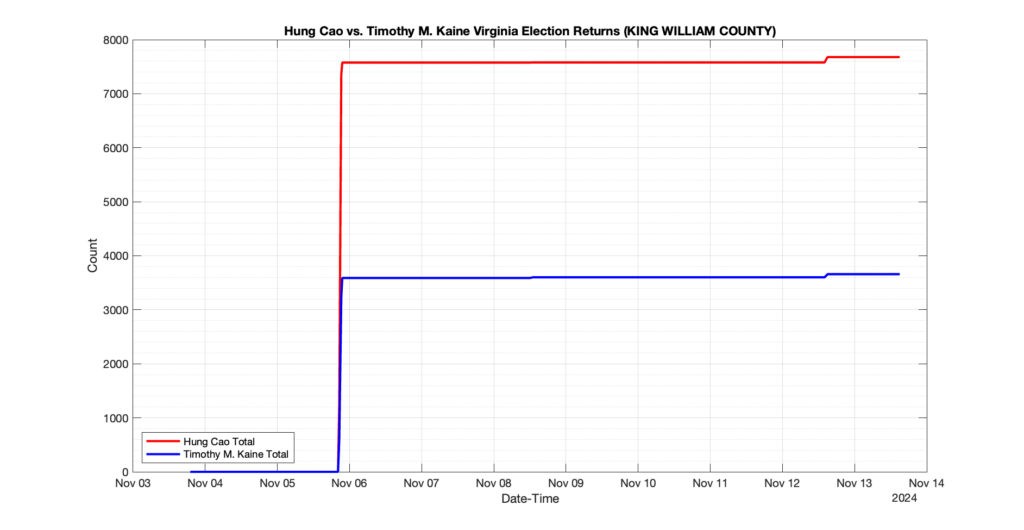
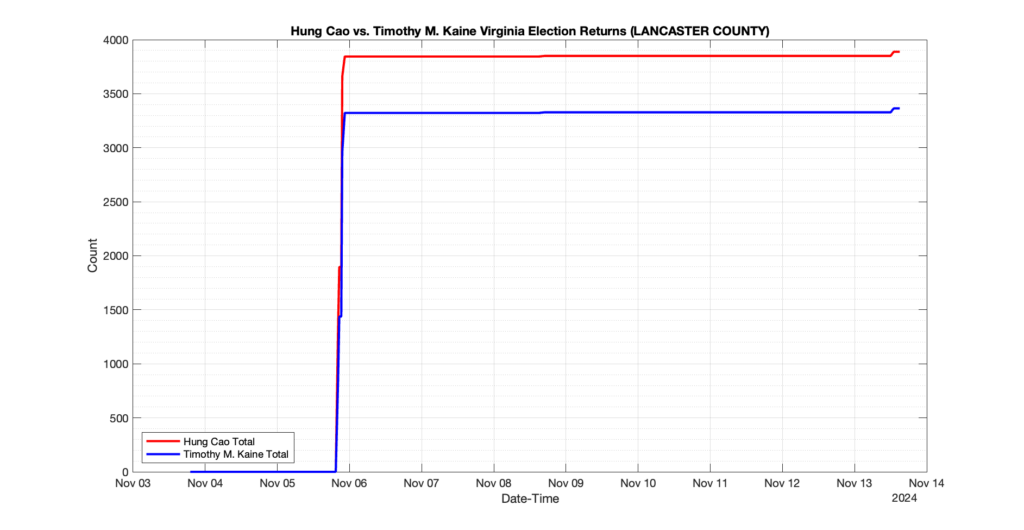
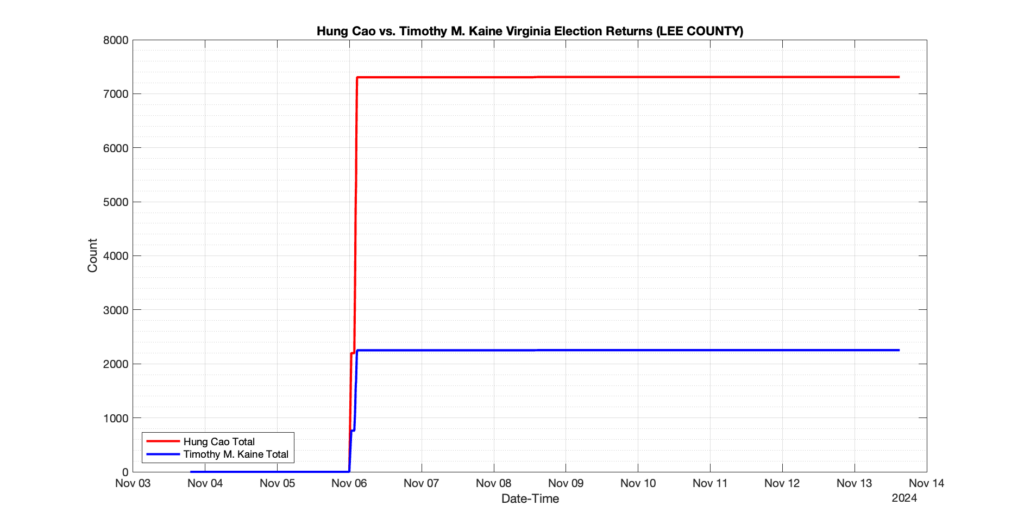
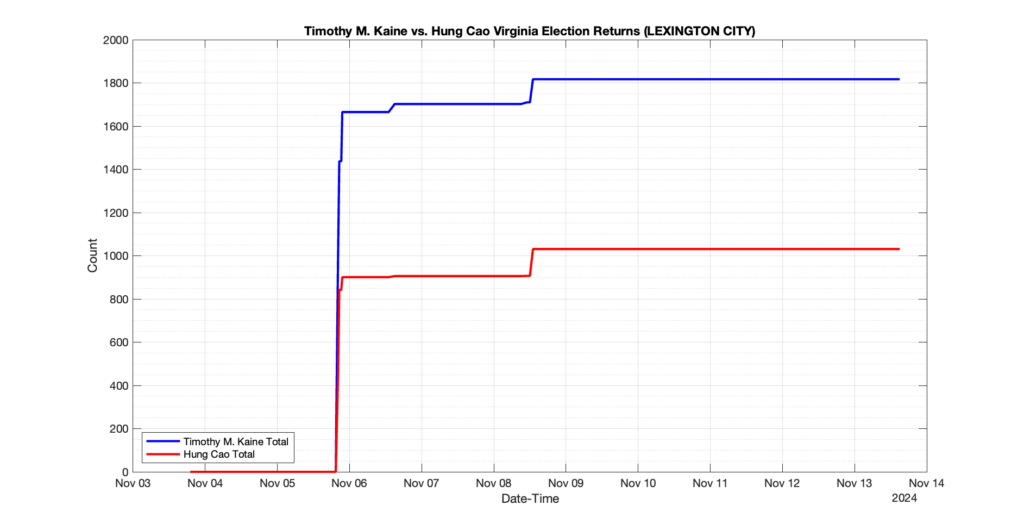
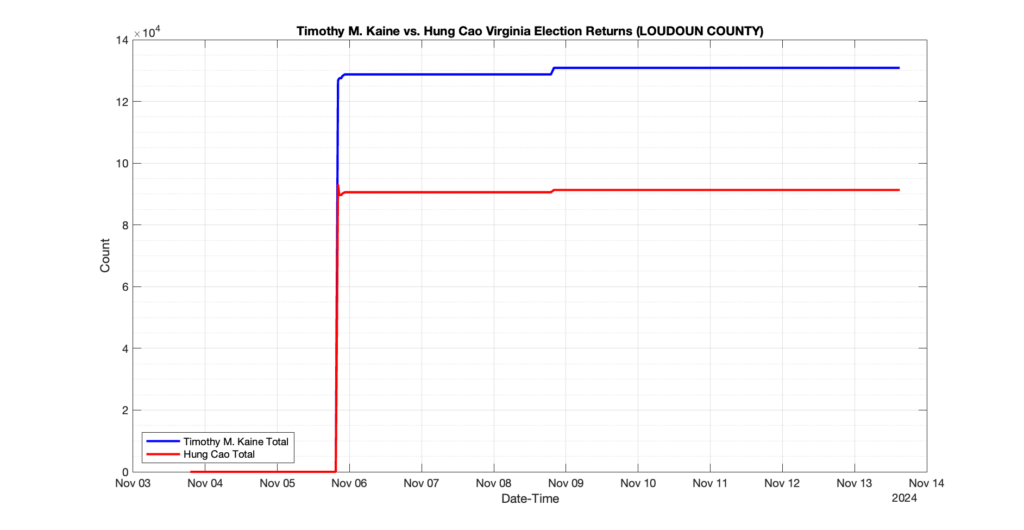
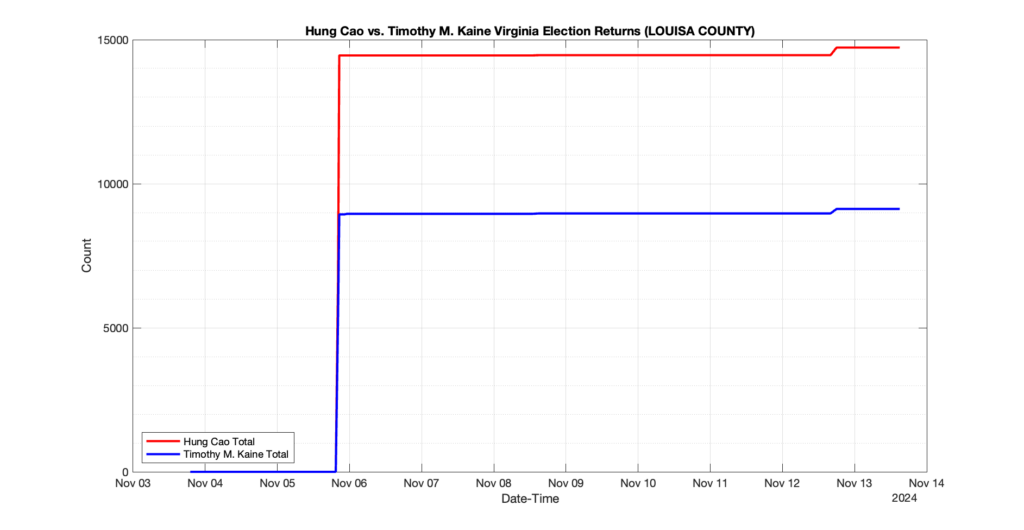
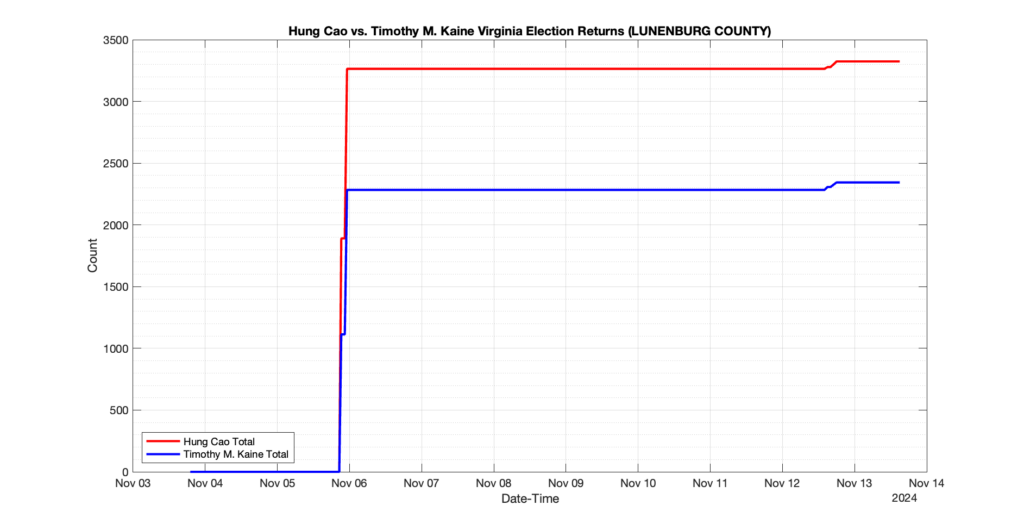
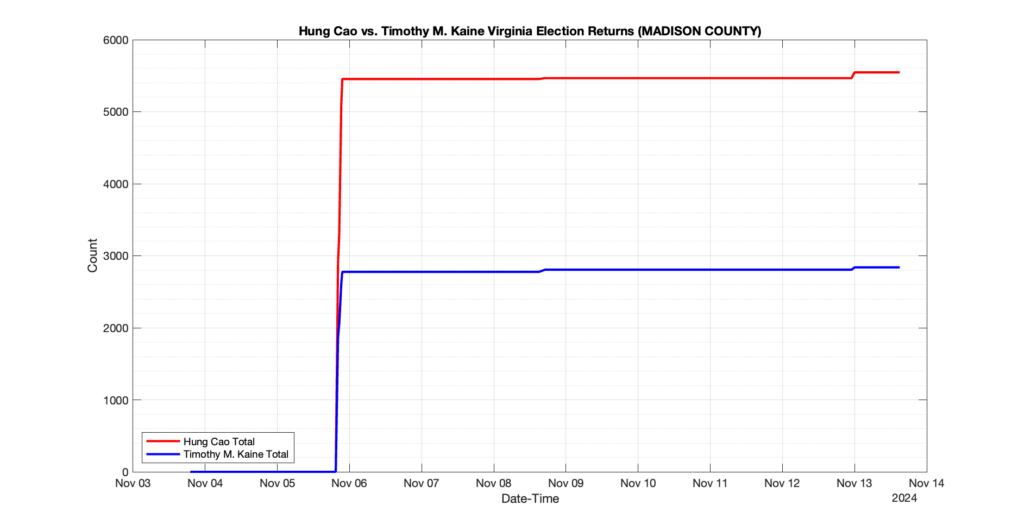
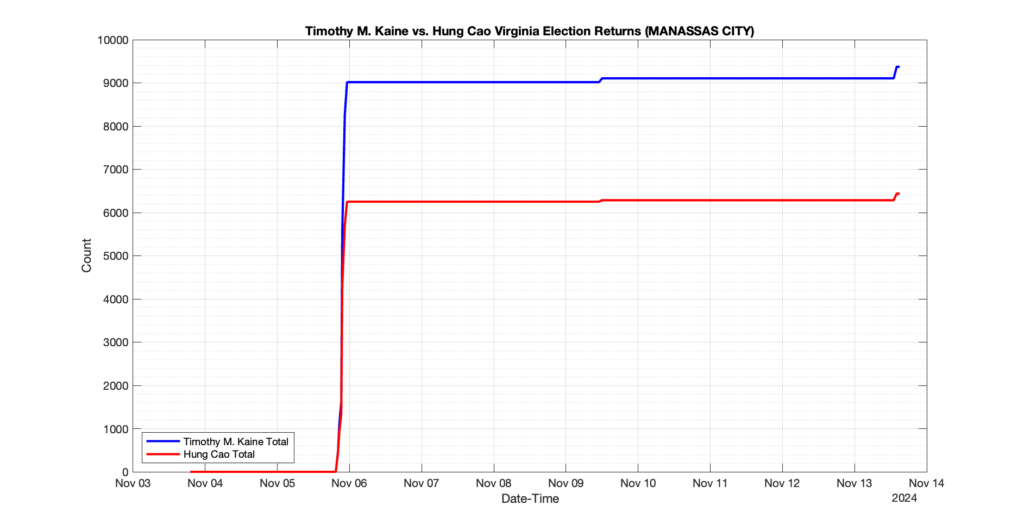
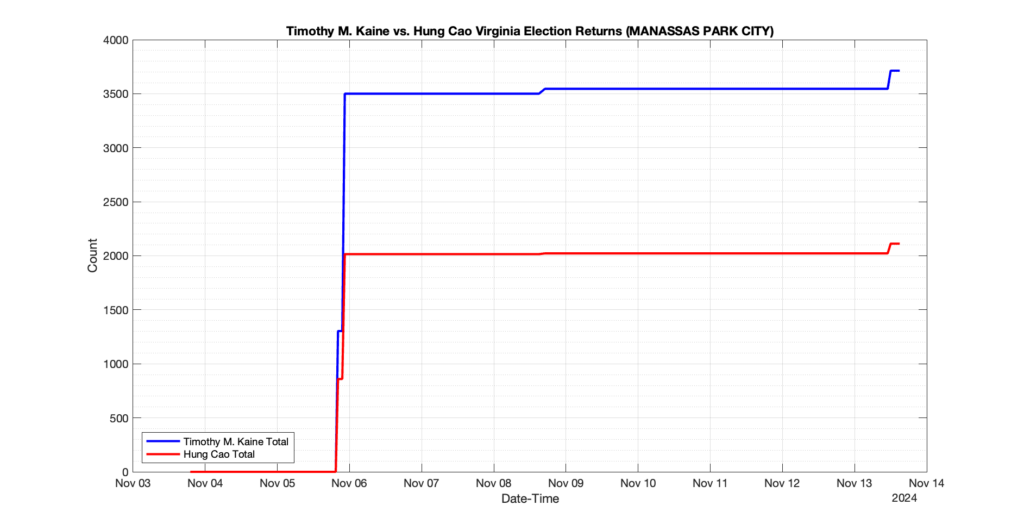
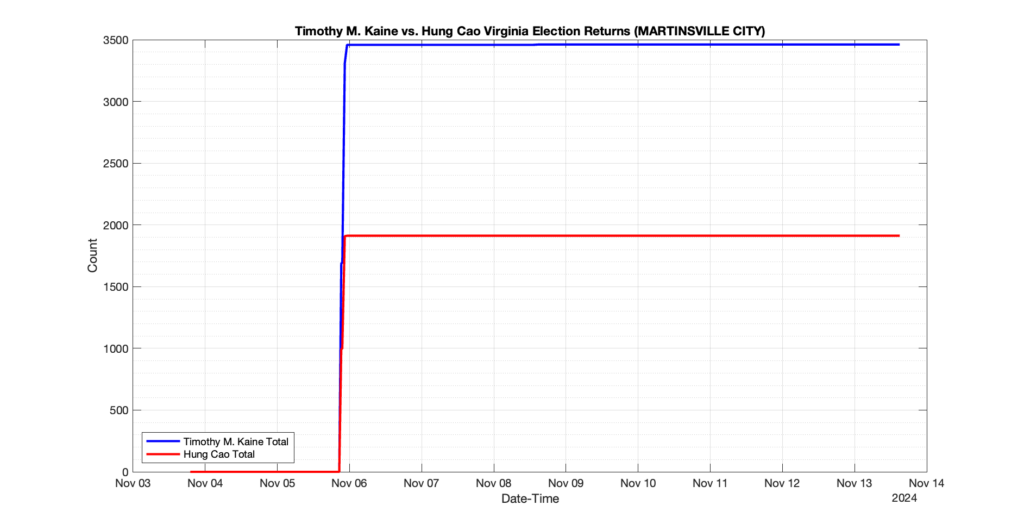
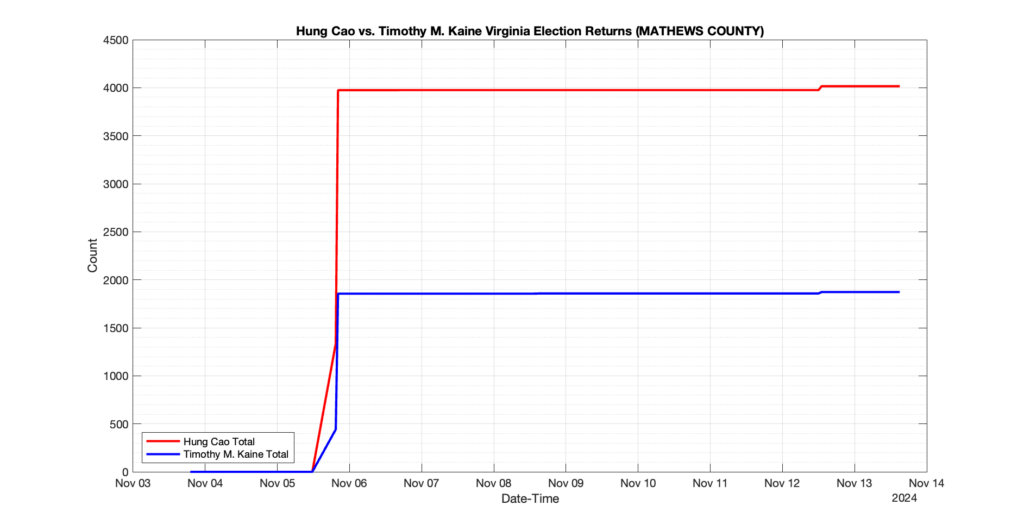
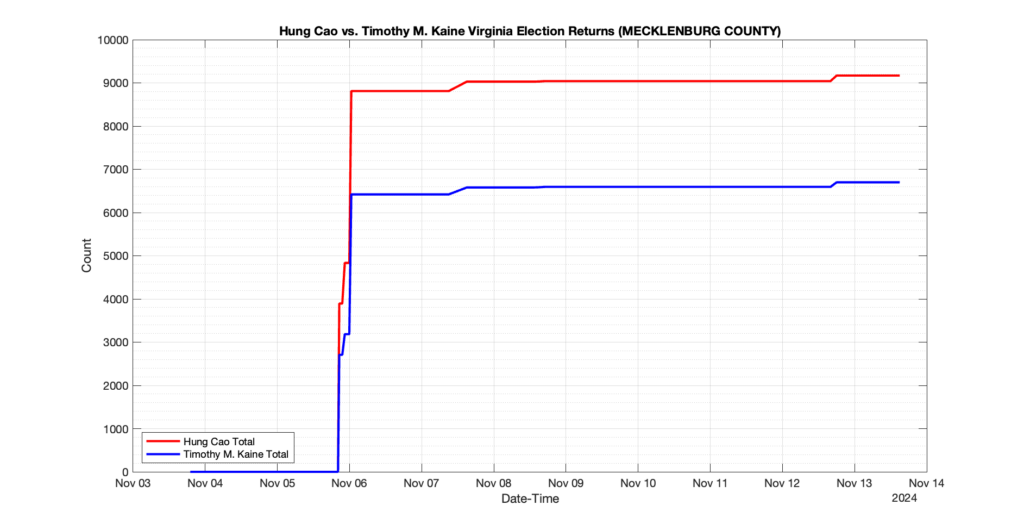
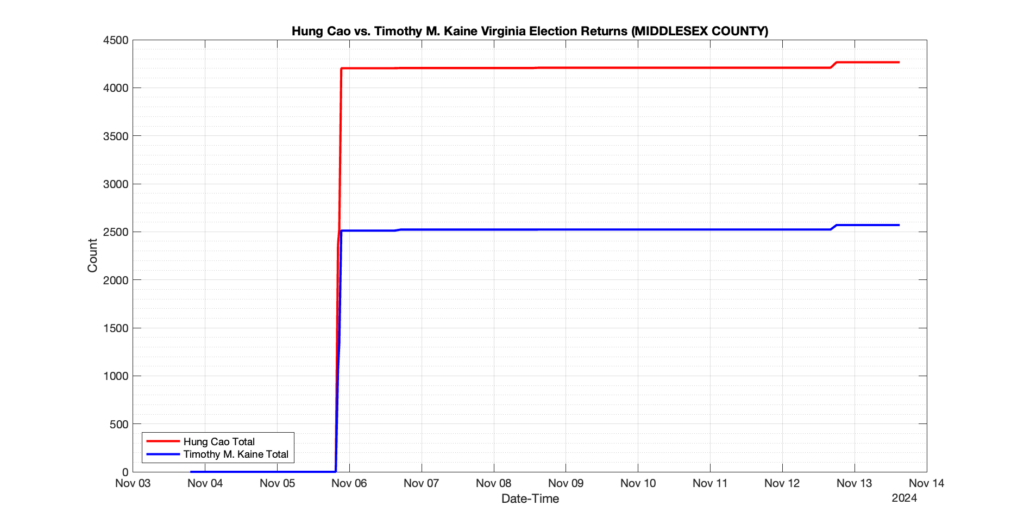
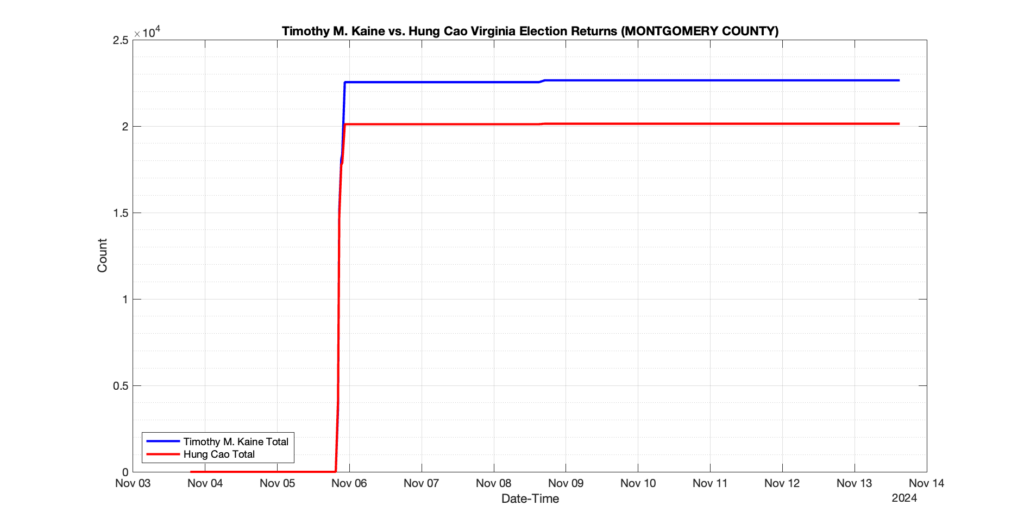
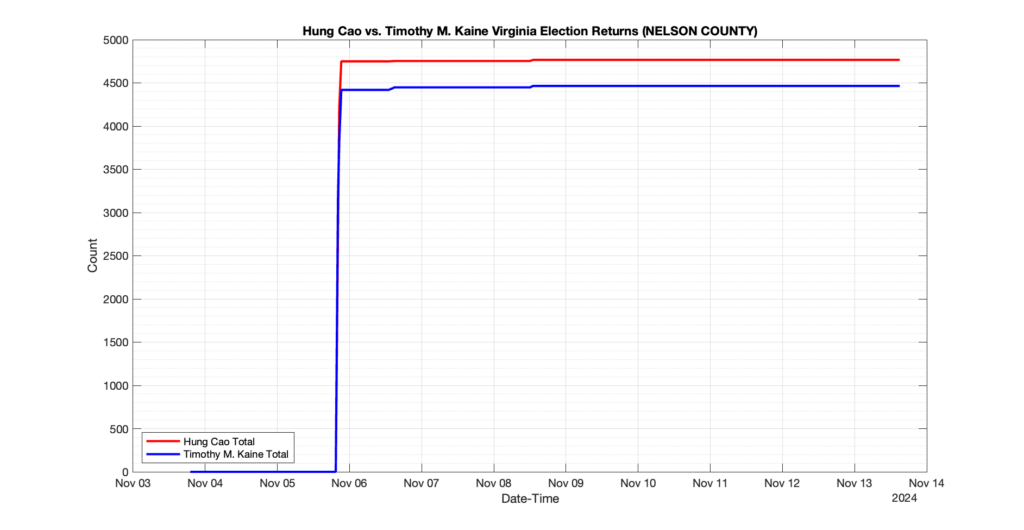
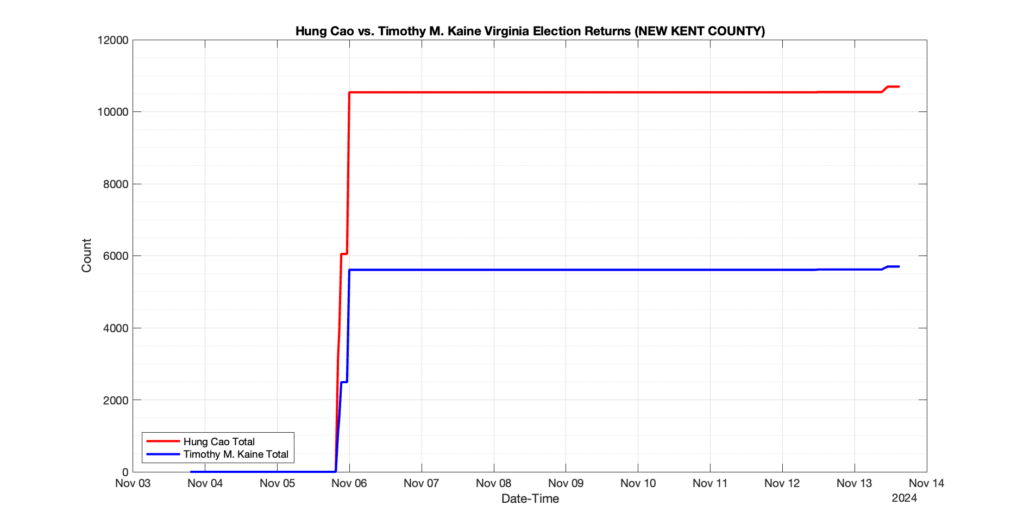
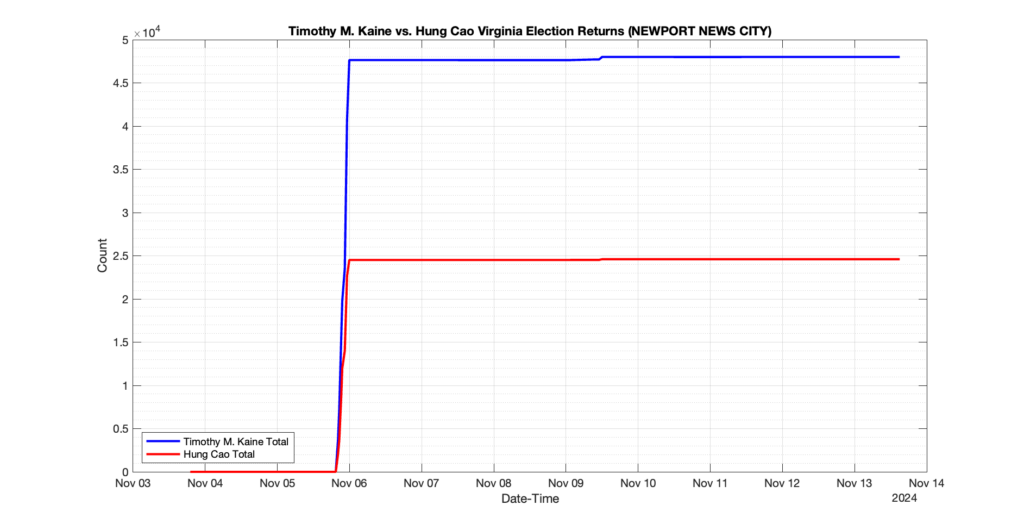
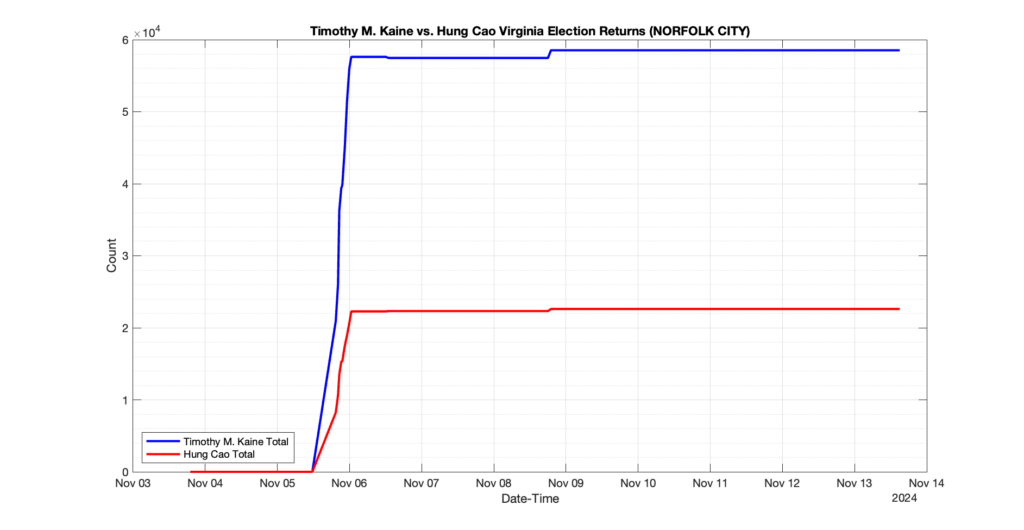
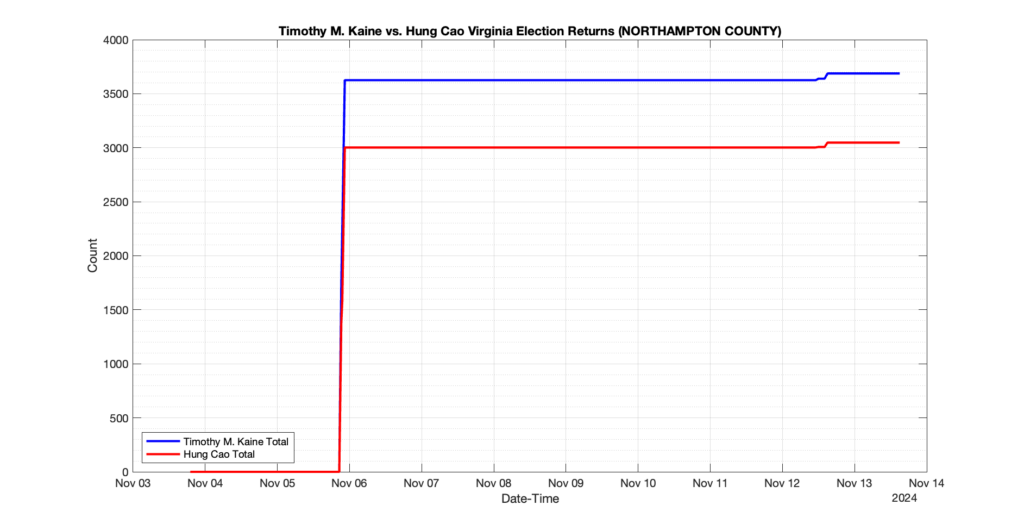
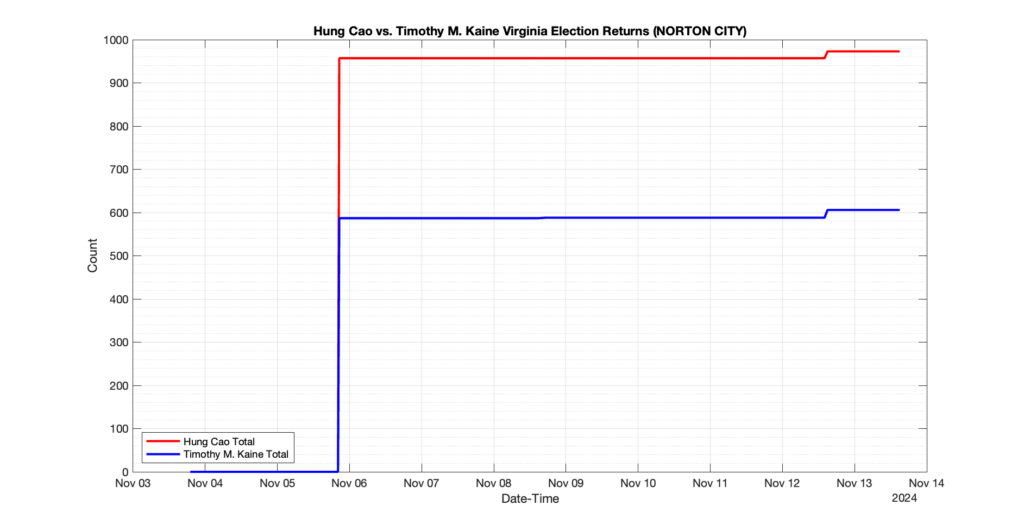
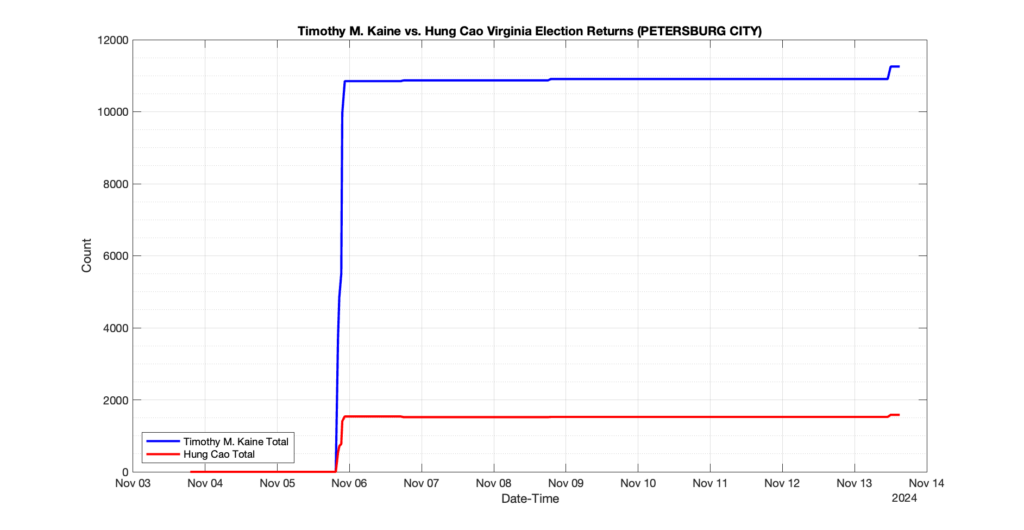
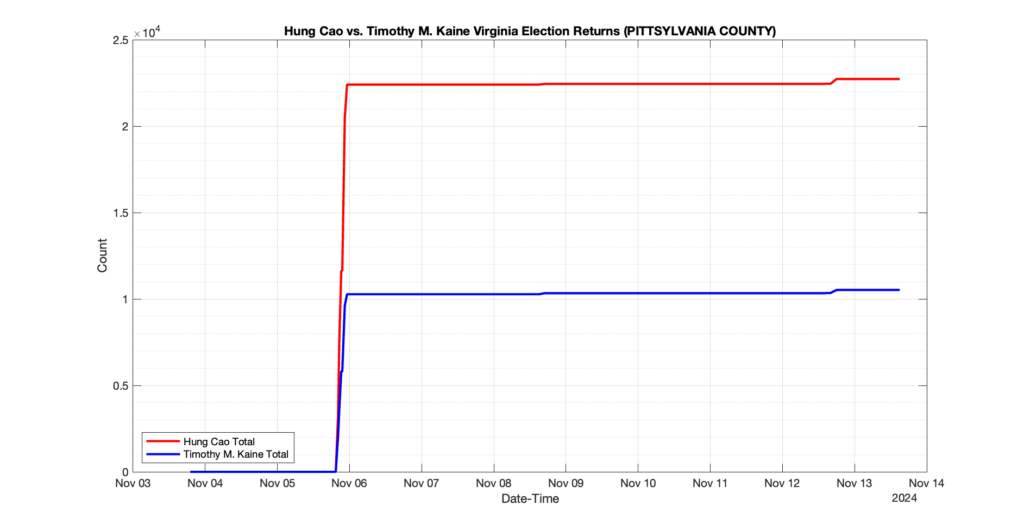
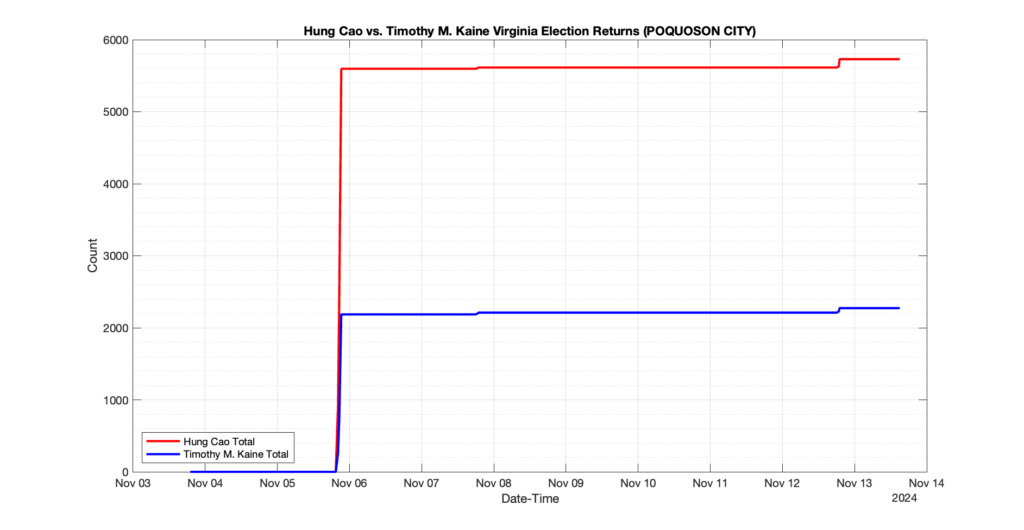
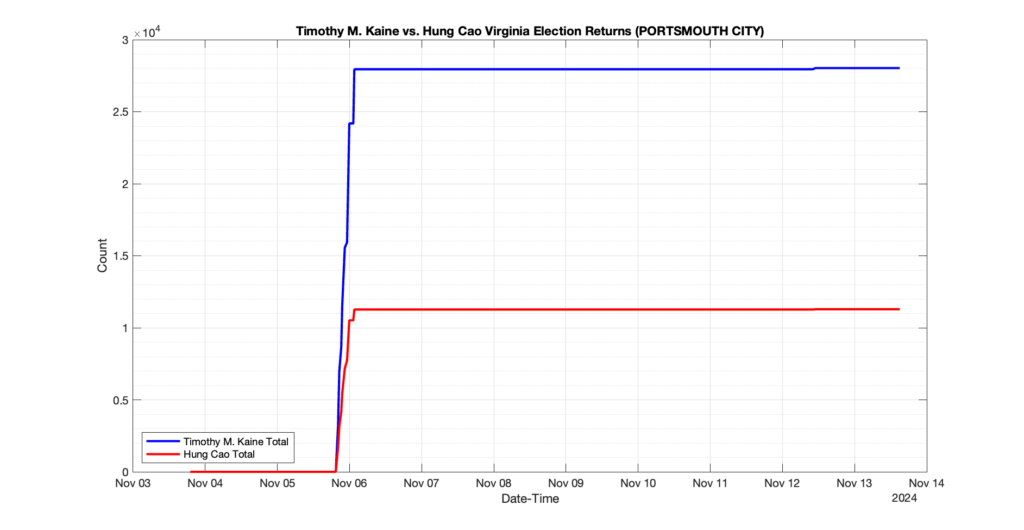
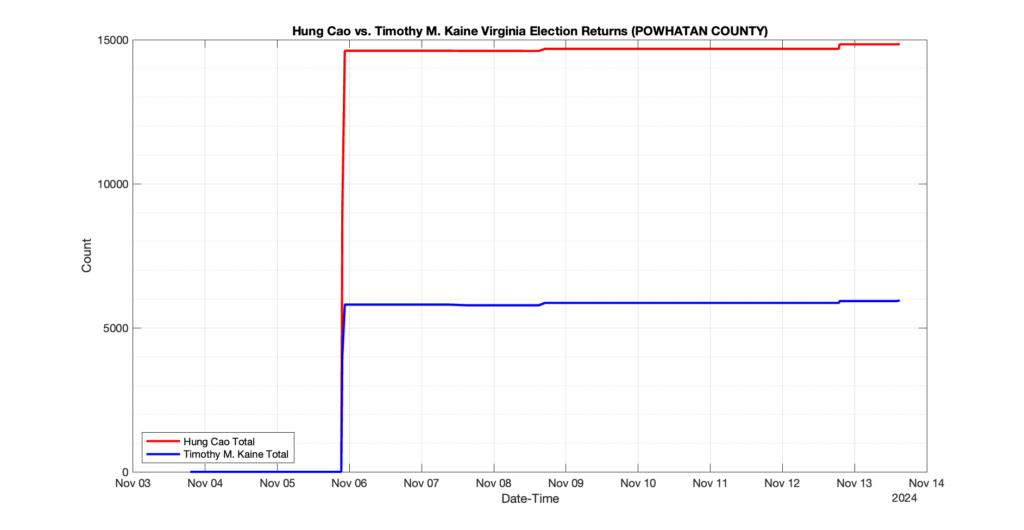
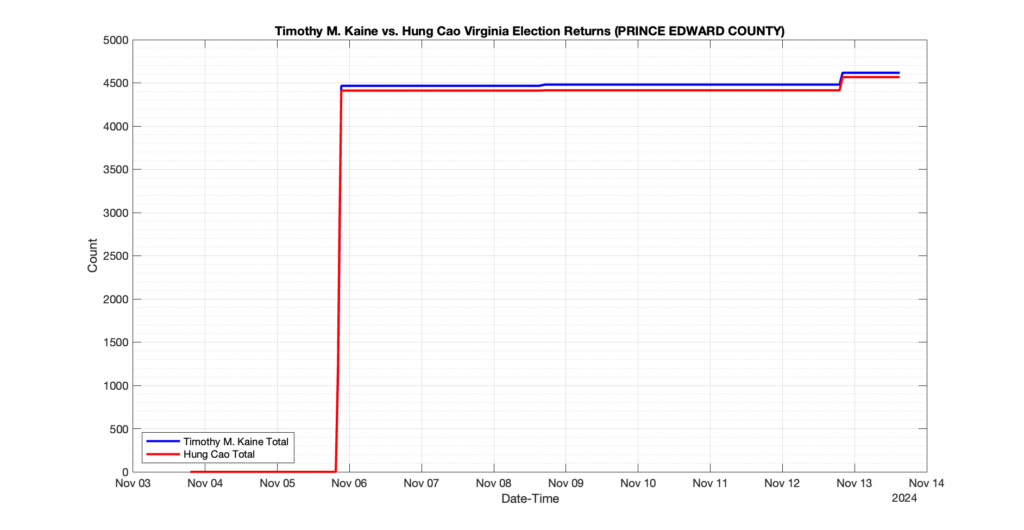
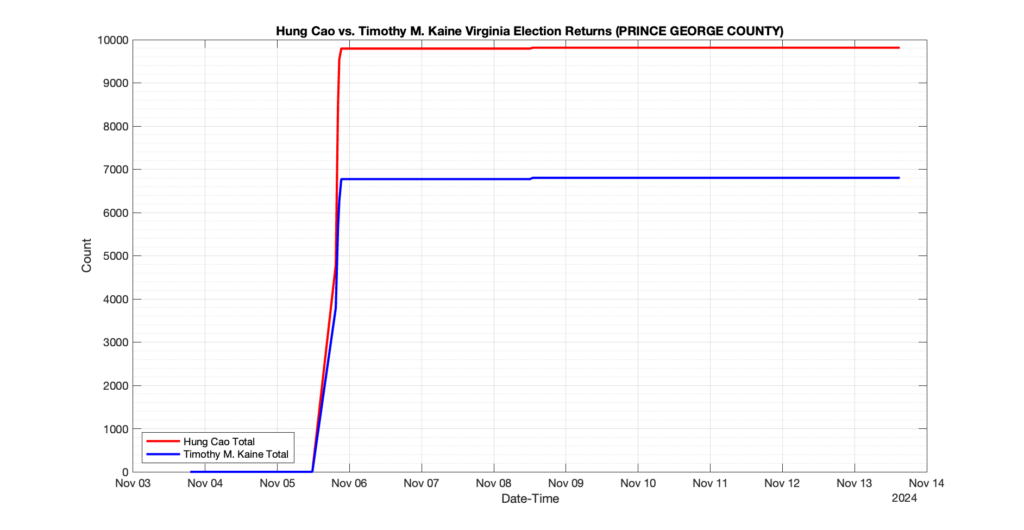
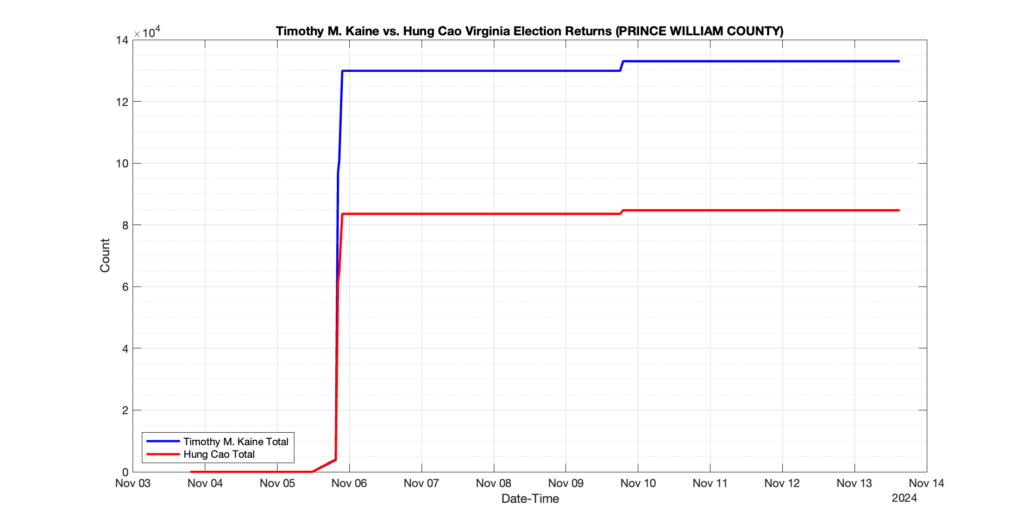
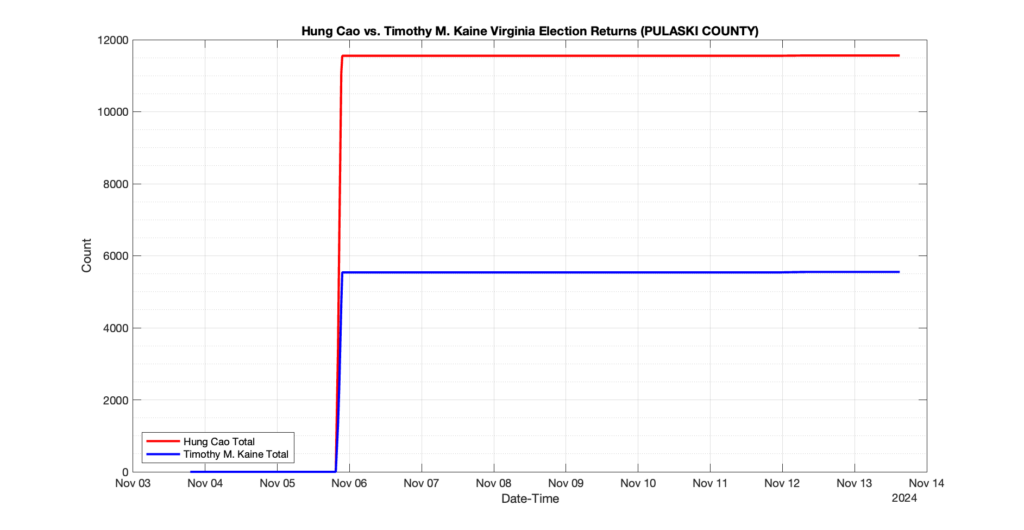
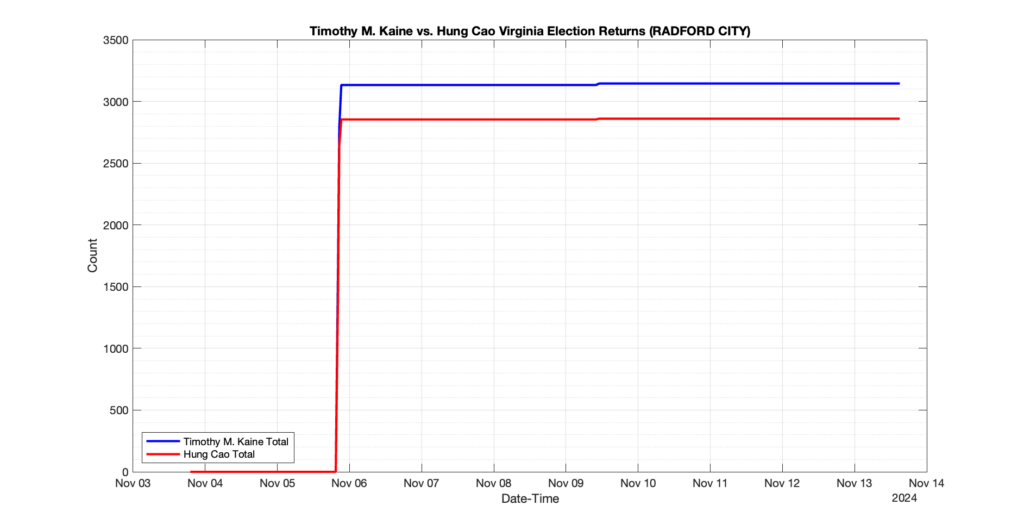
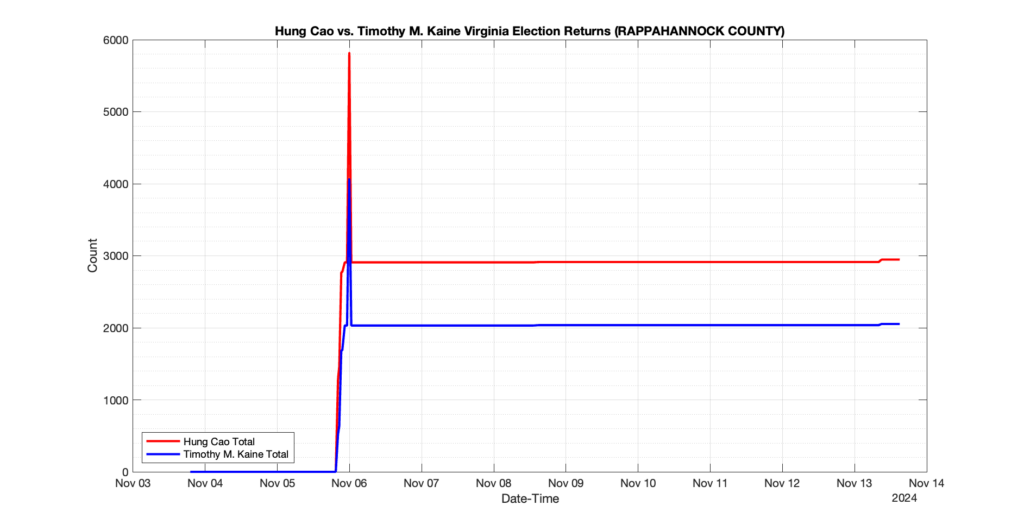
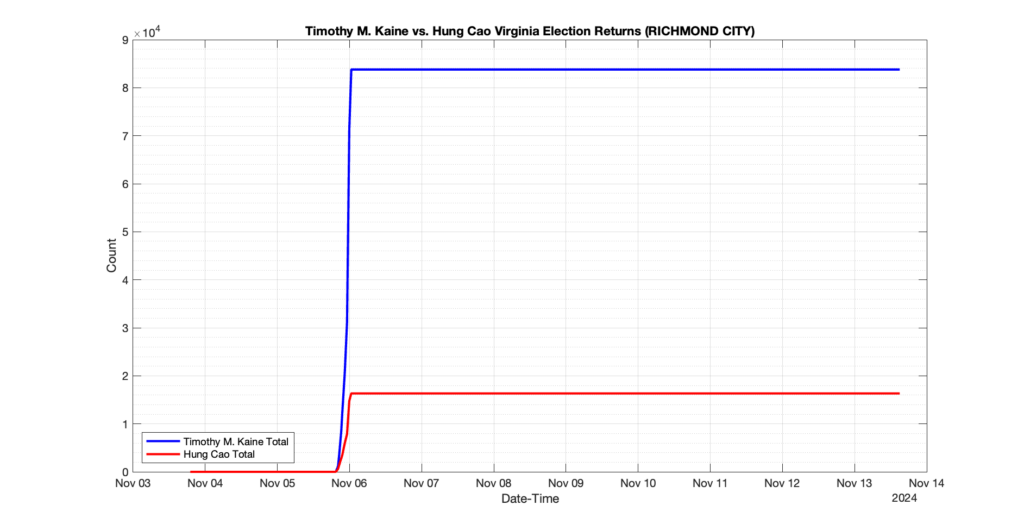
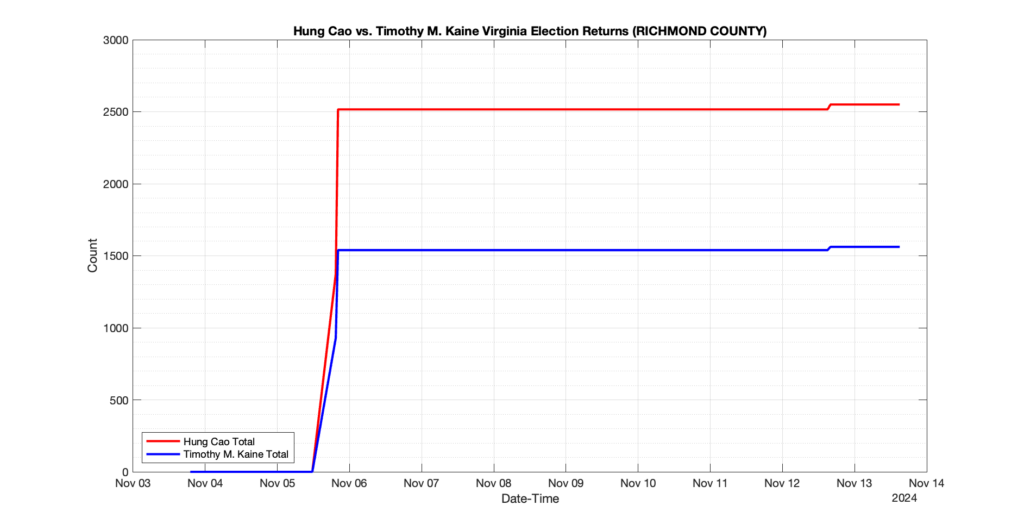
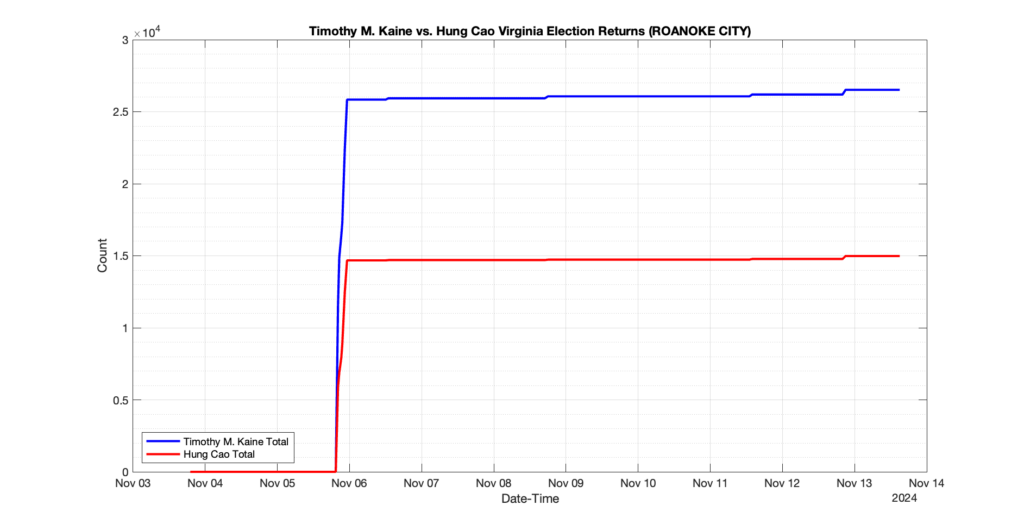
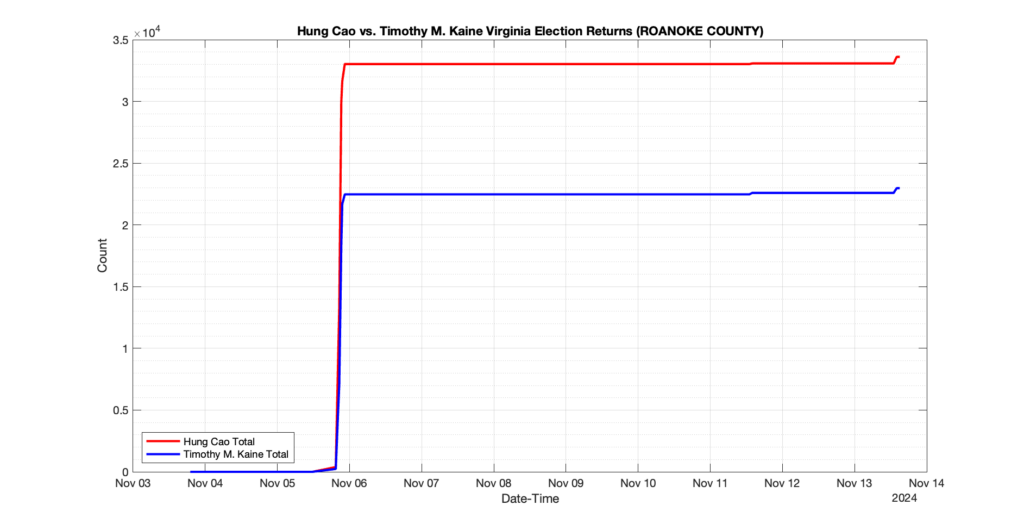
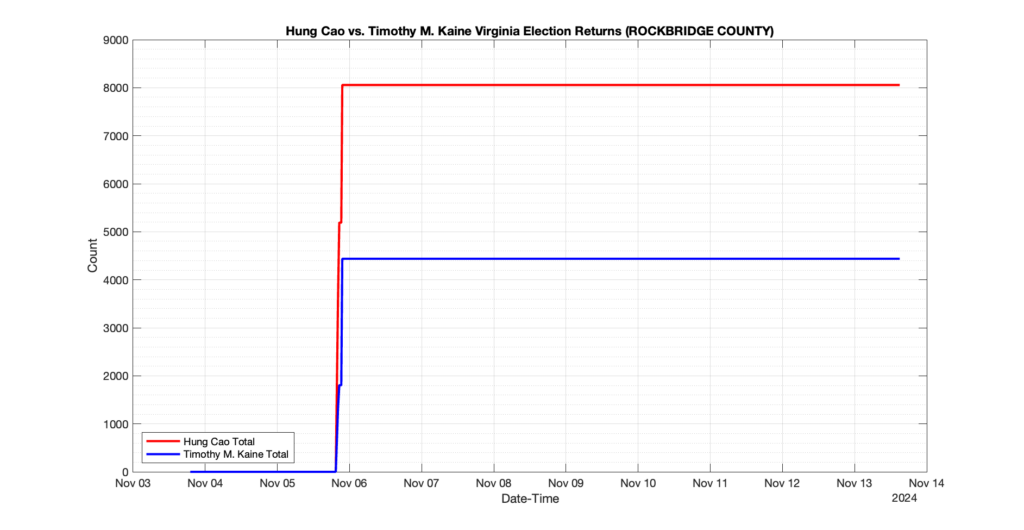
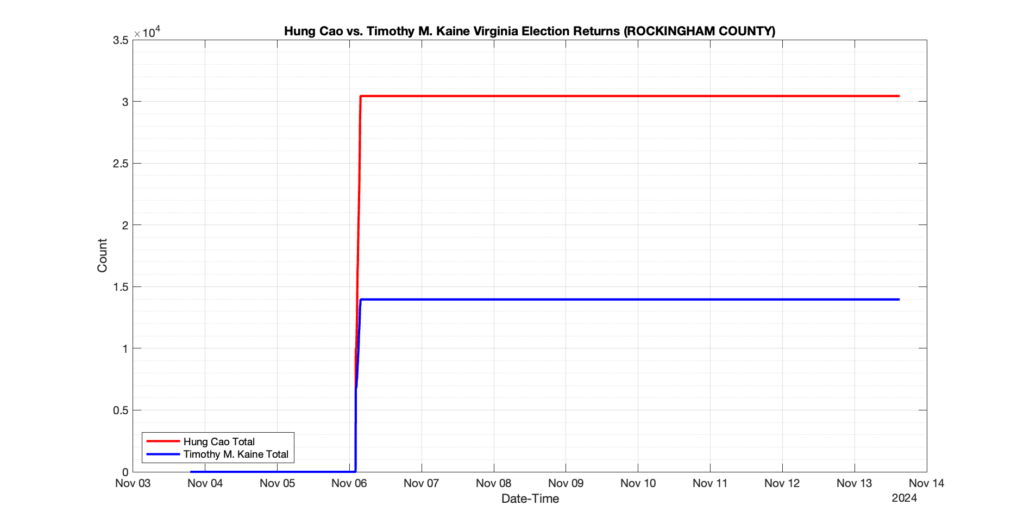
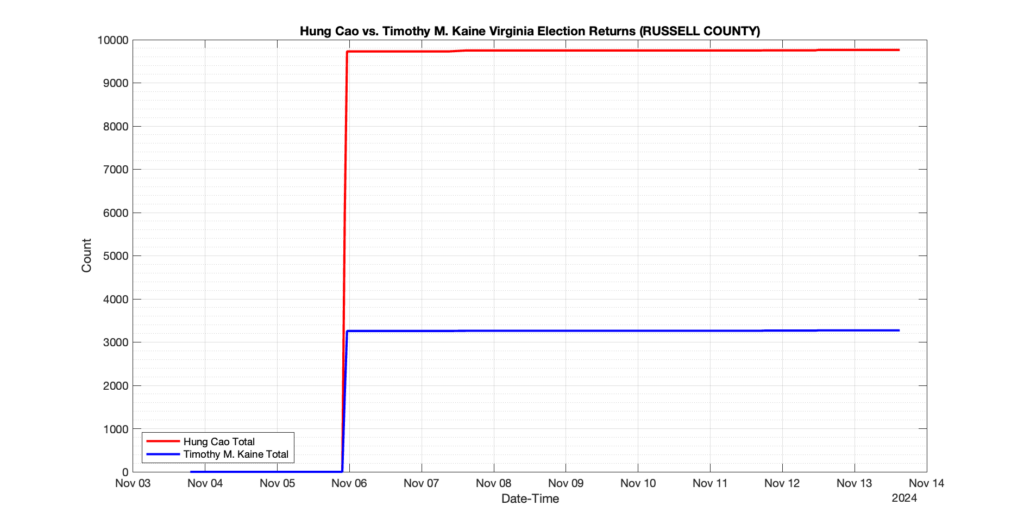
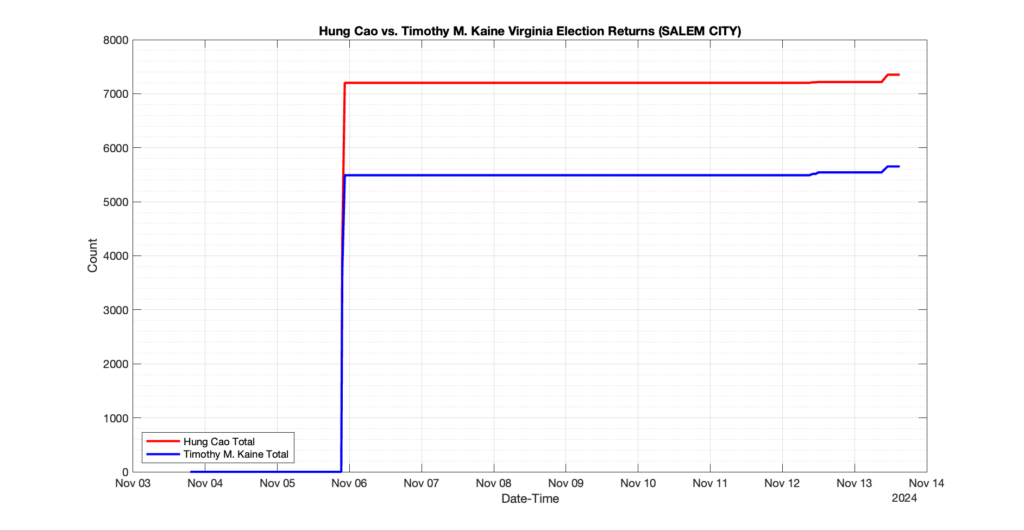
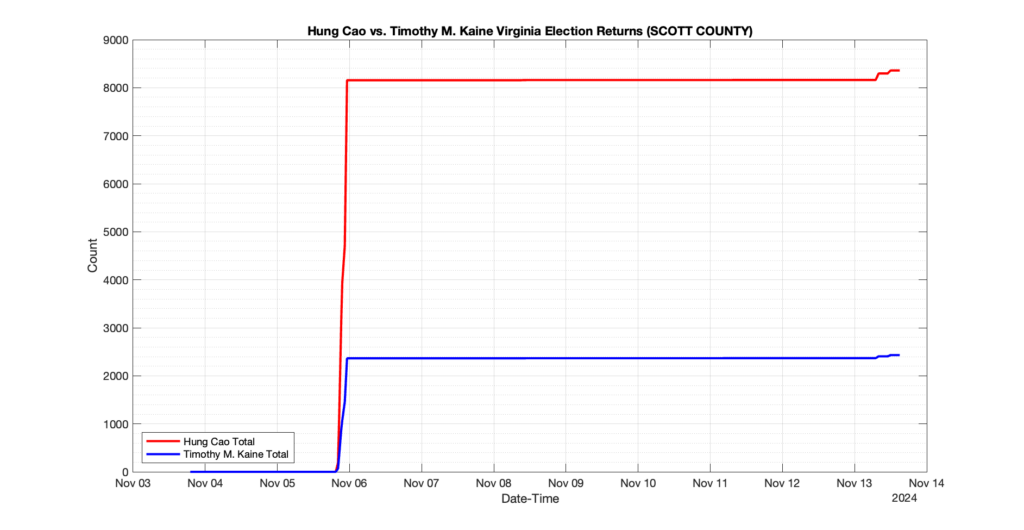
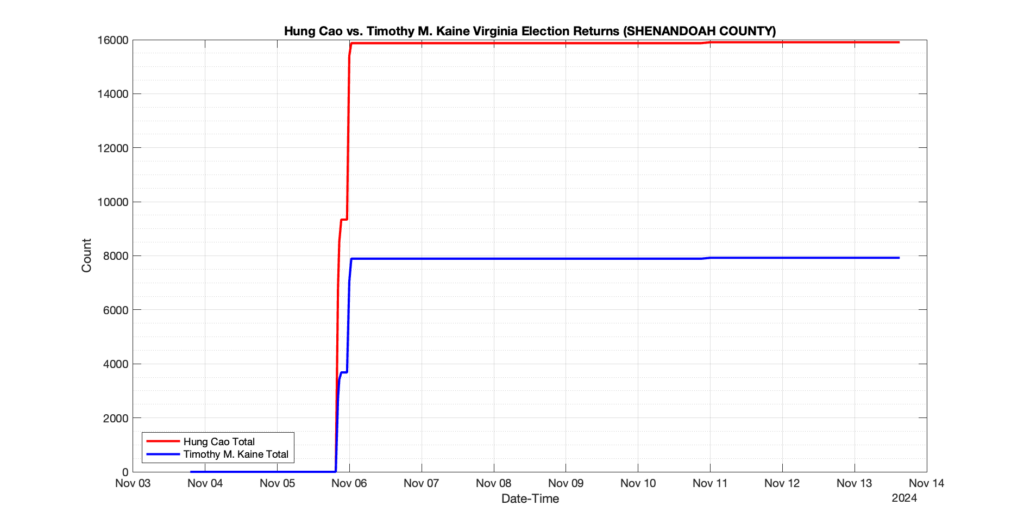
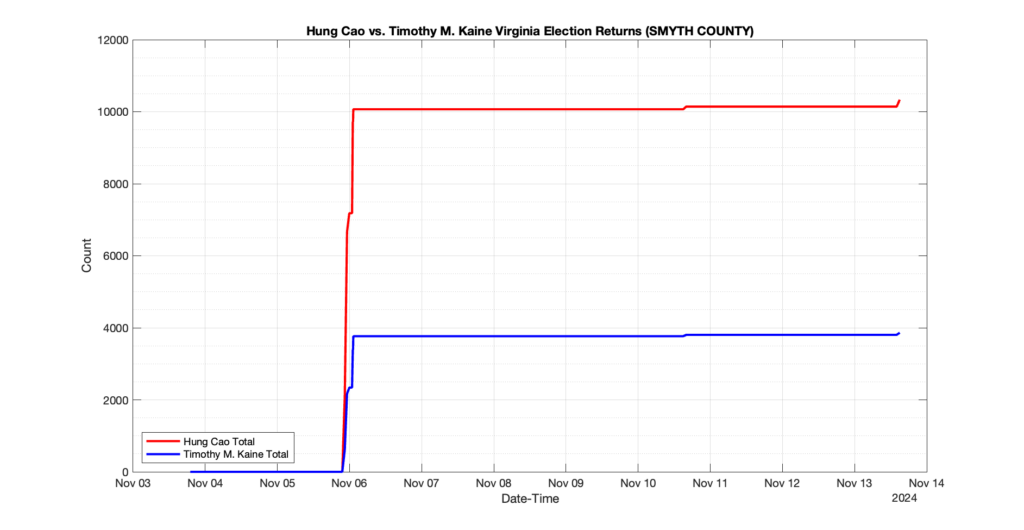
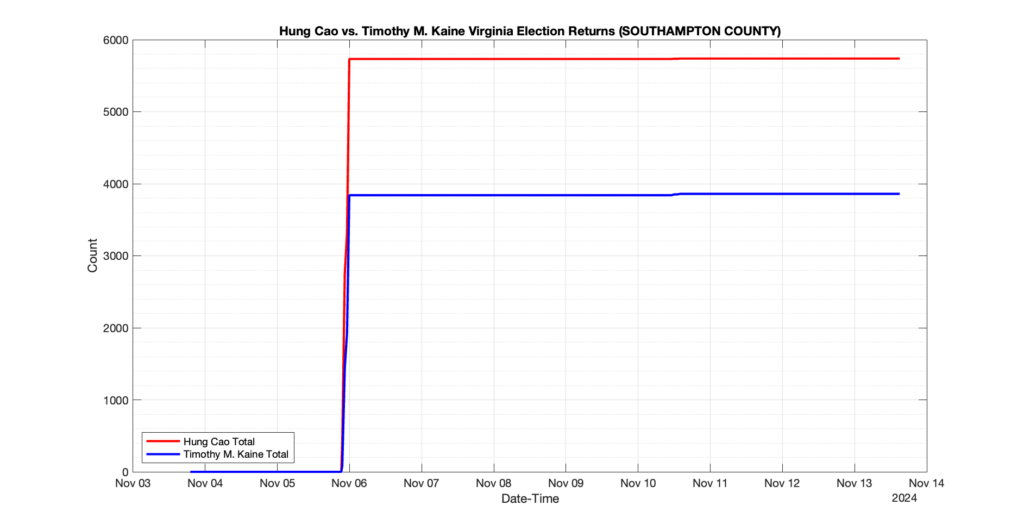
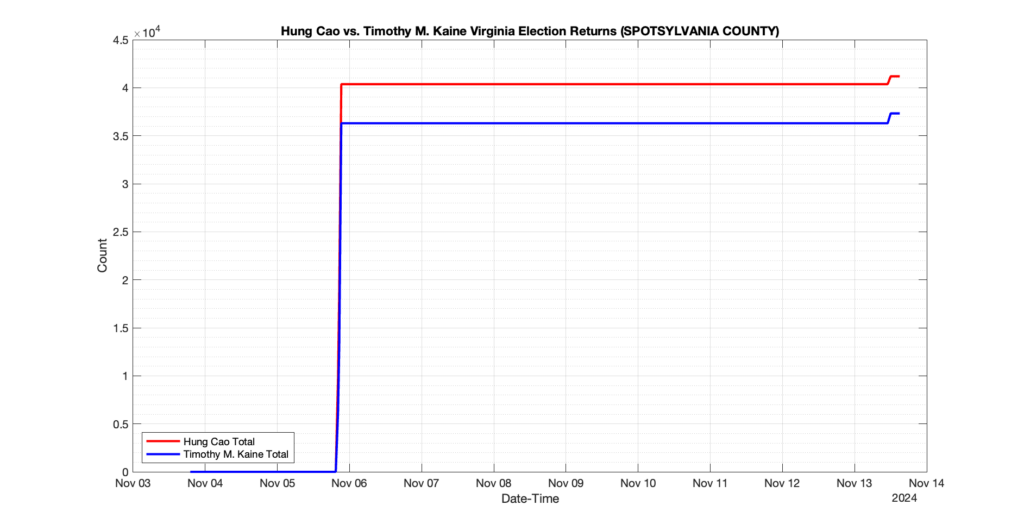
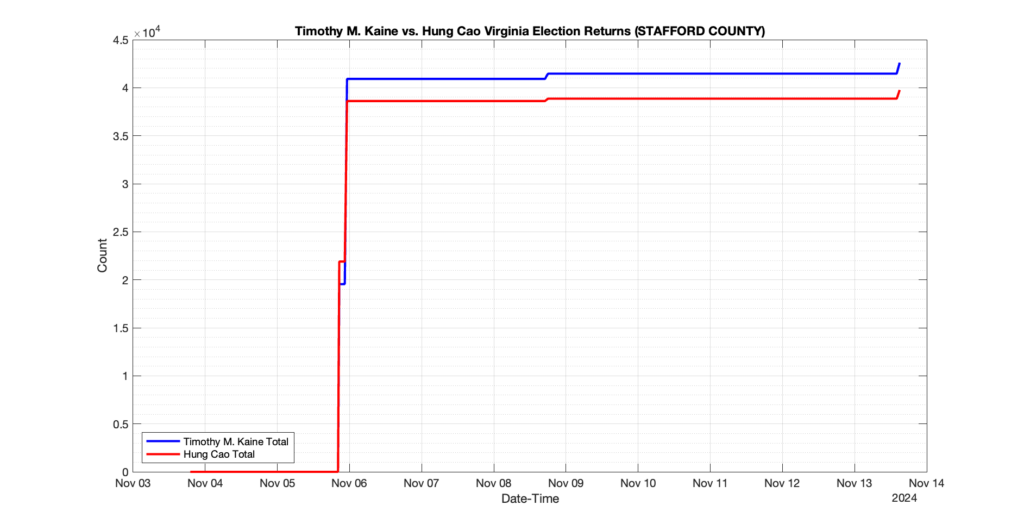
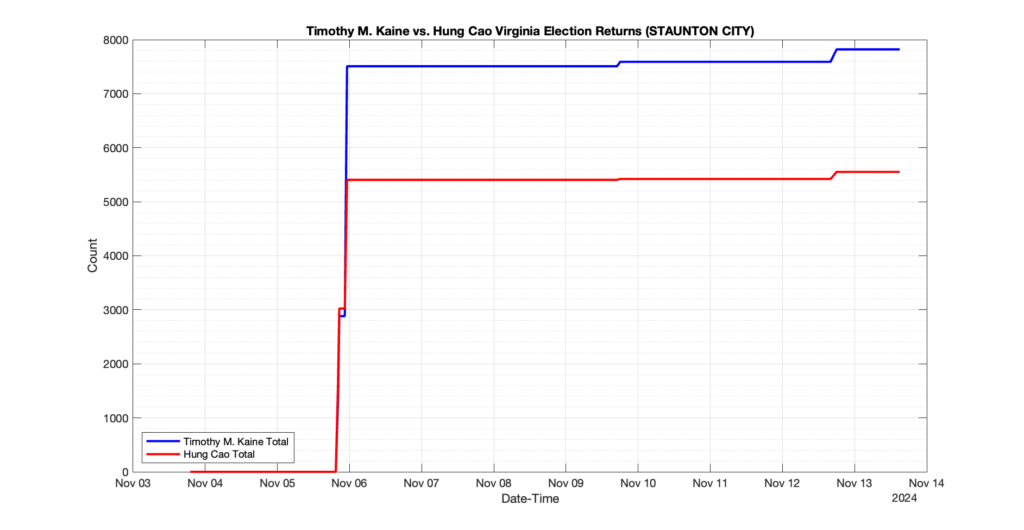
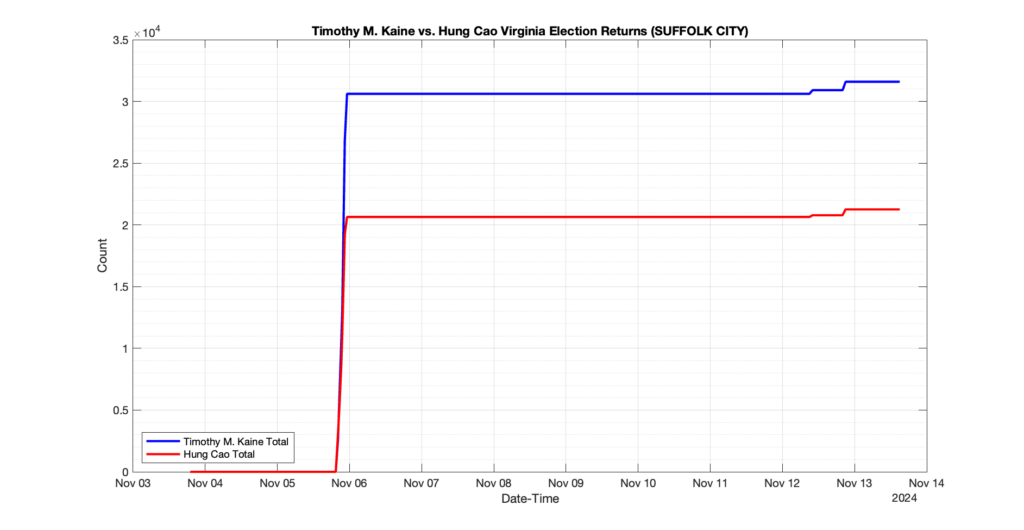
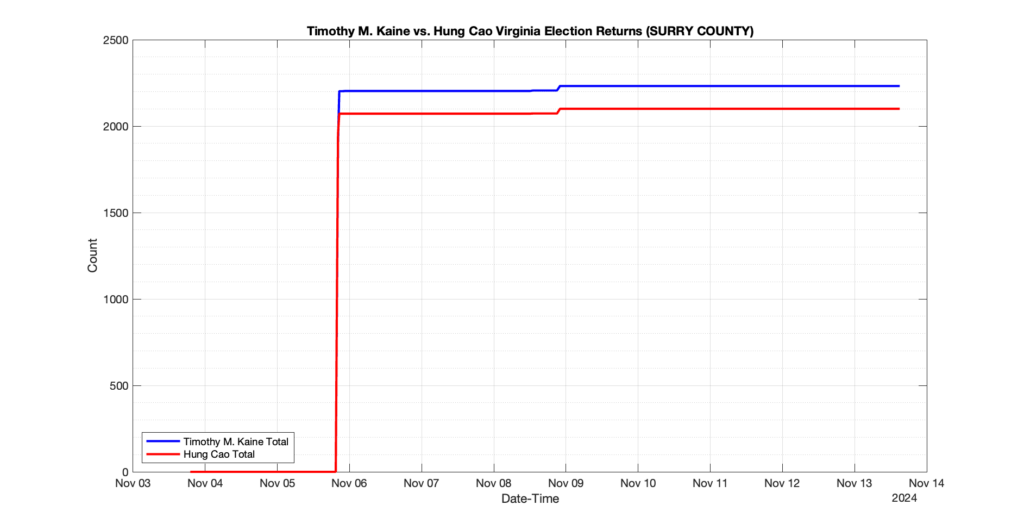
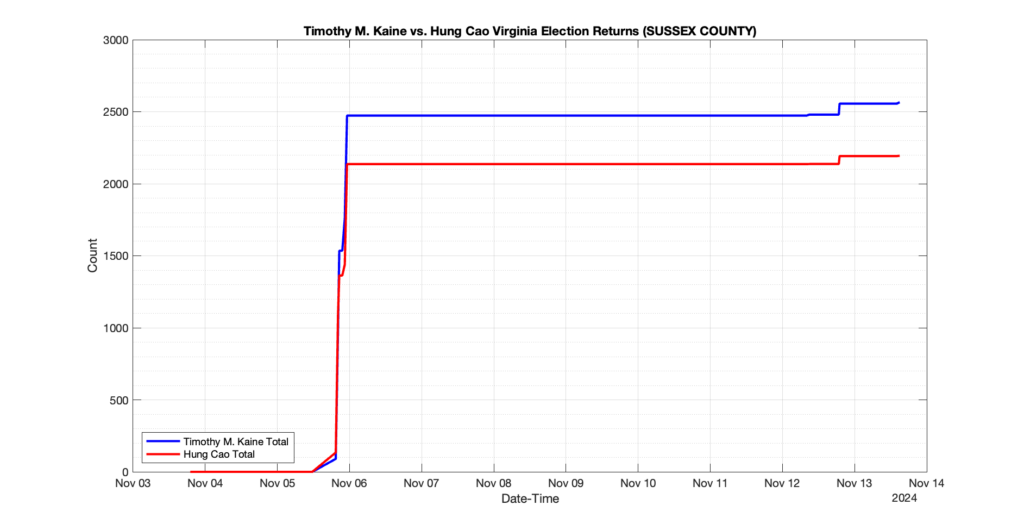
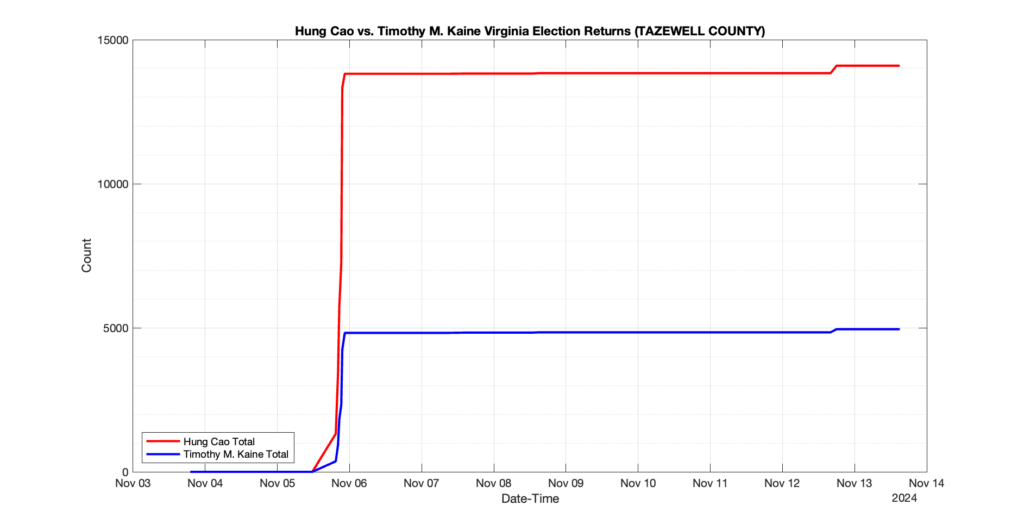
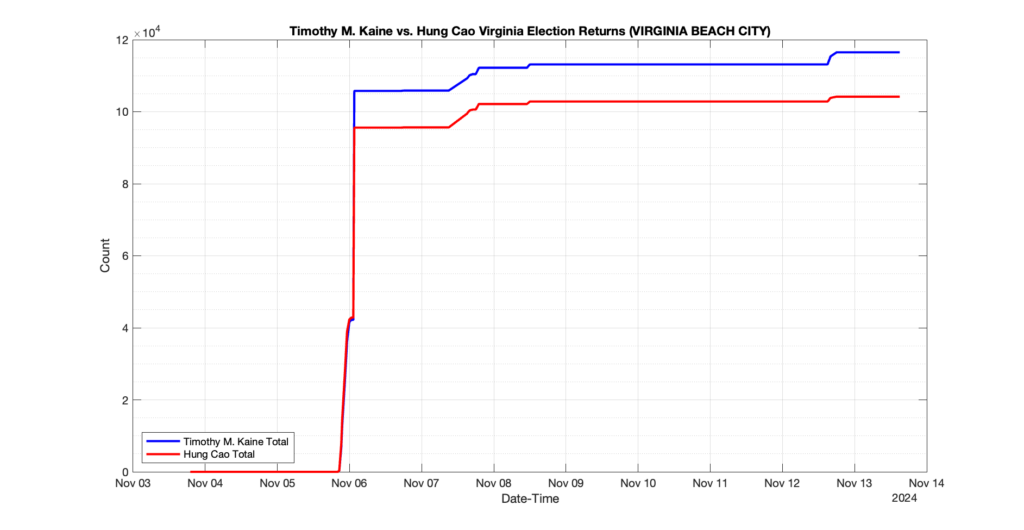
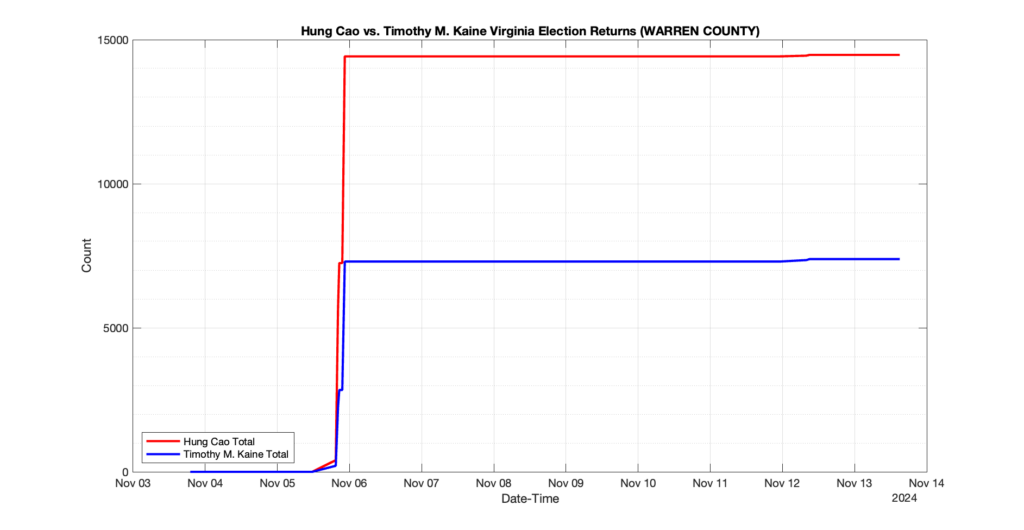
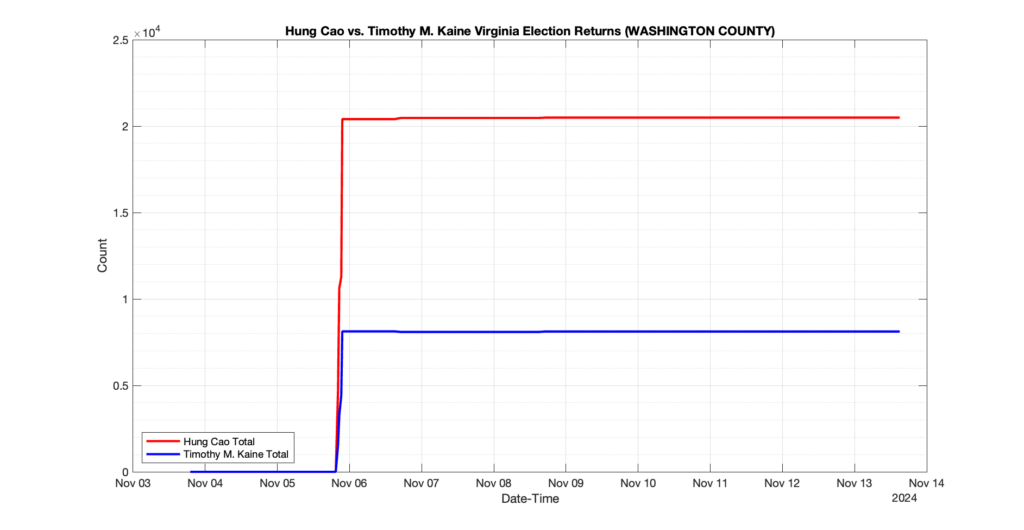
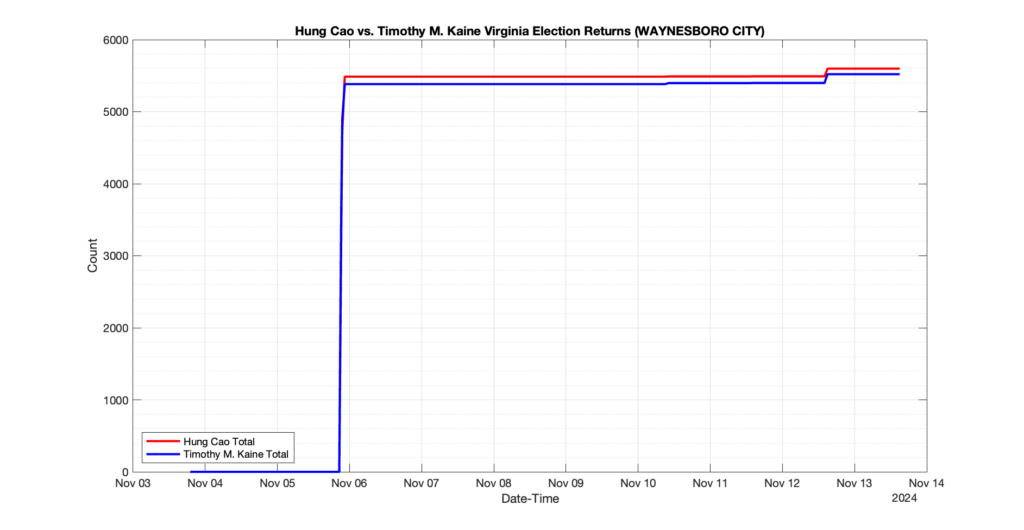
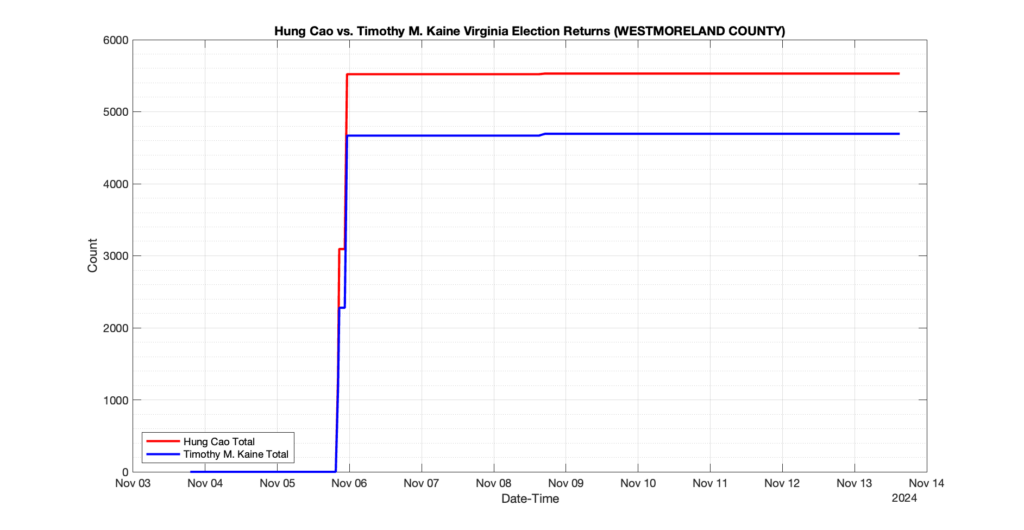
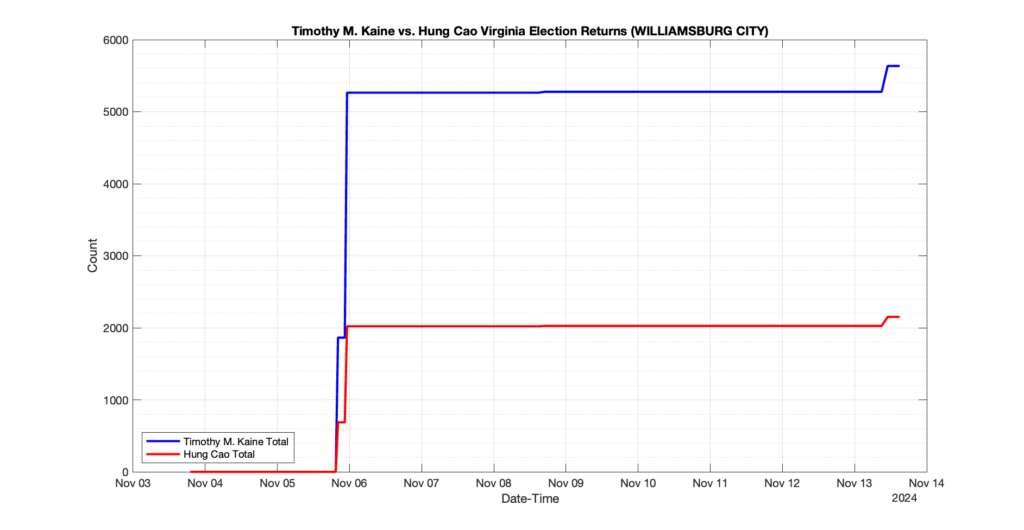
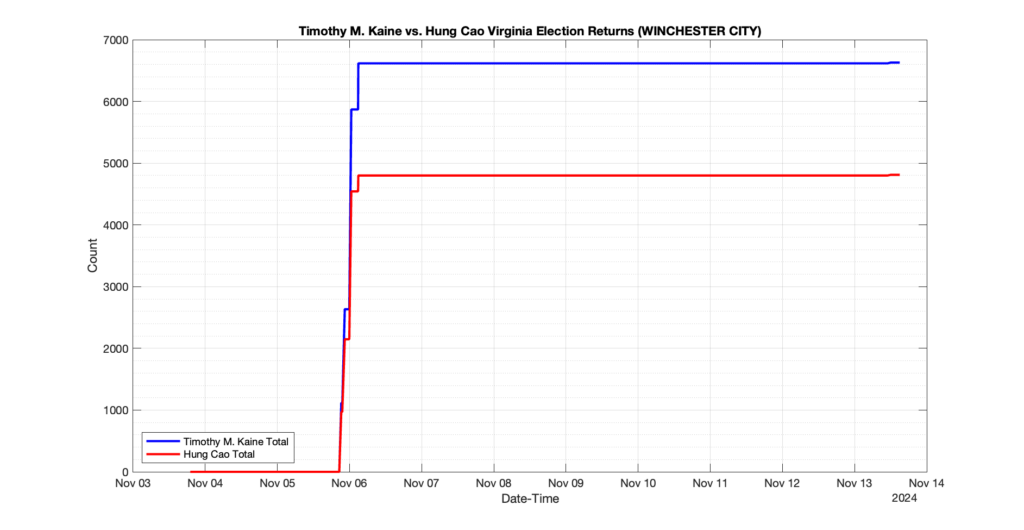
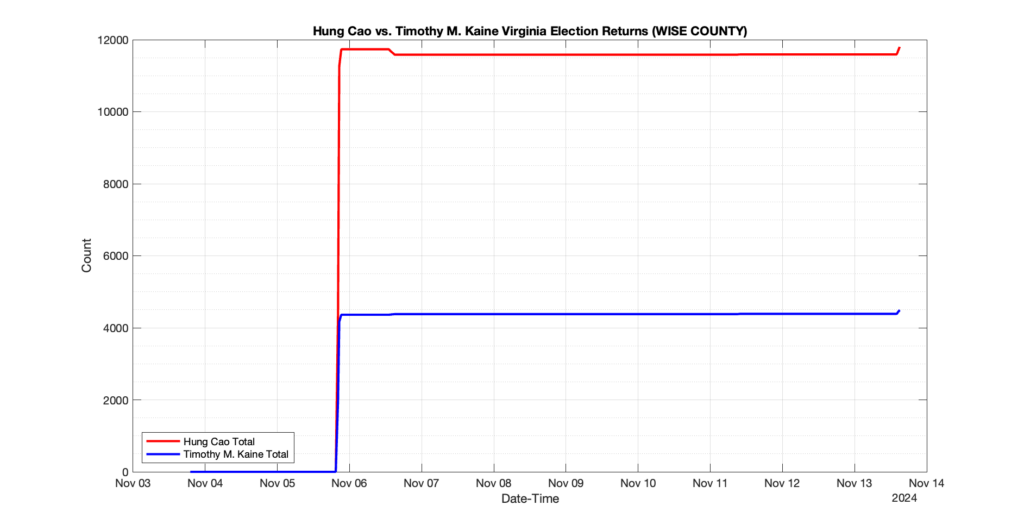
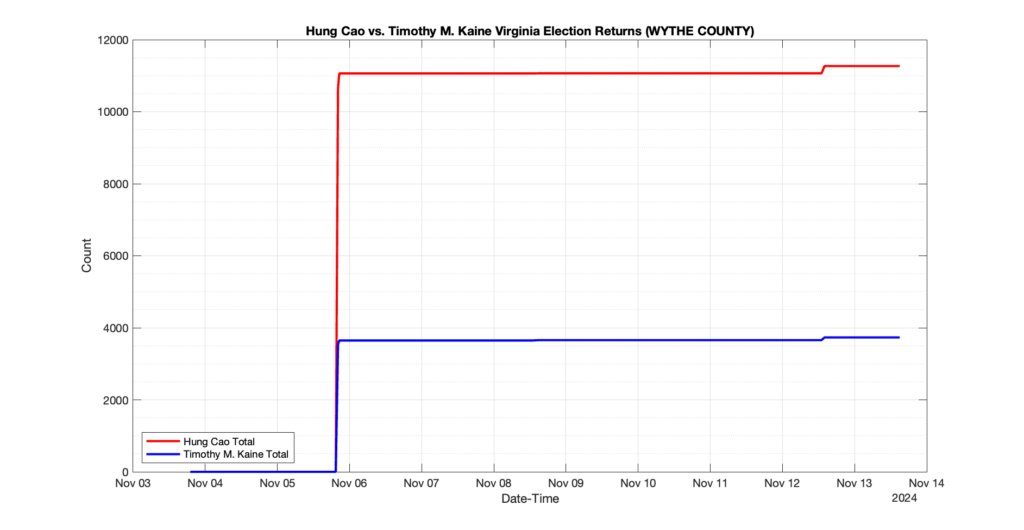
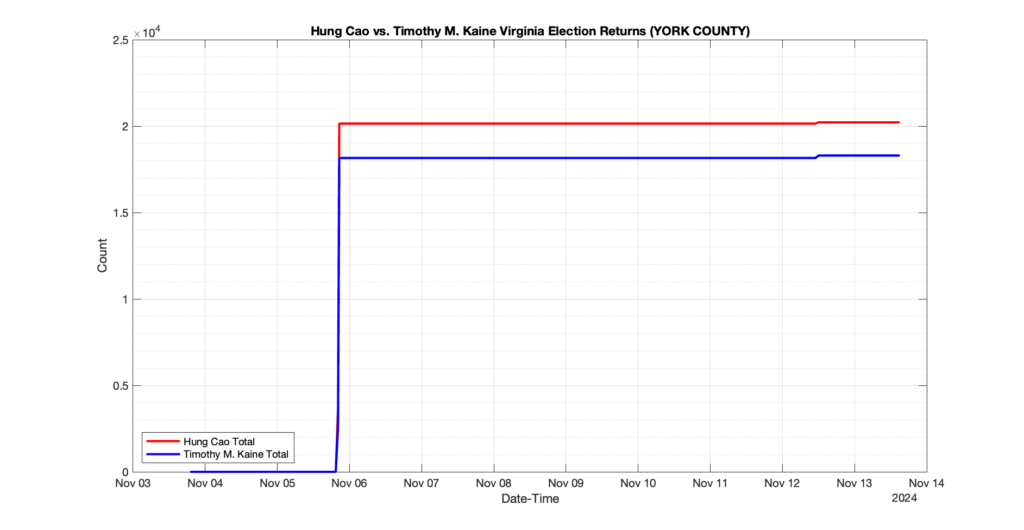
EPEC monitored and archived the election night reporting (“ENR”) files published by the VA Department of Elections (“ELECT”) for the 2024 General Election, using the “media export” link at the bottom of the page to periodically download a JSON file with the data. On this page you will find the plots of the Locality reported summary counts from the JSON files as they changed over time.
As we noted in our post discussing some of our observations on the reliability of the JSON data feed, there are a few “glitches” that can be notices in the data plots below. While we are unsure as to the cause of the “glitches” in the data, it does not appear that any of them affected the outcome of the election.
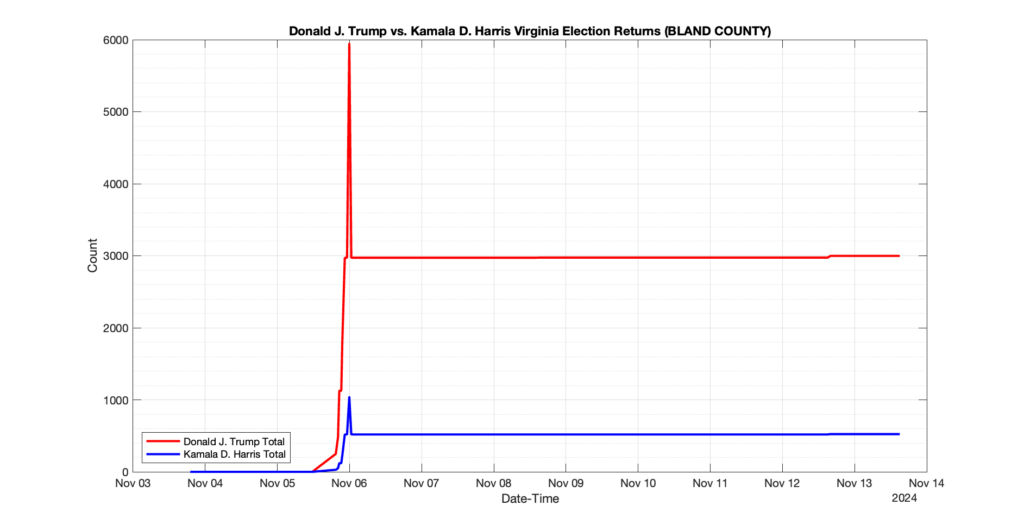
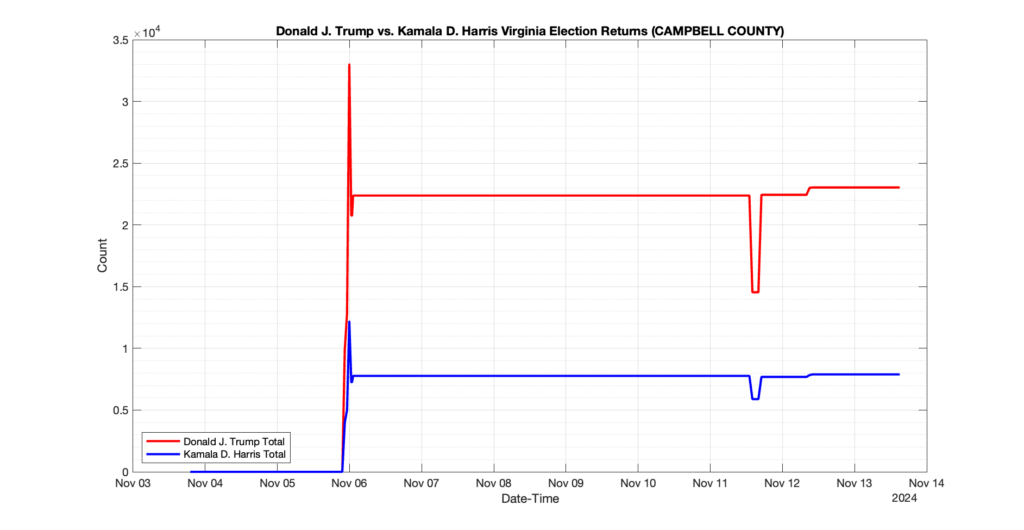
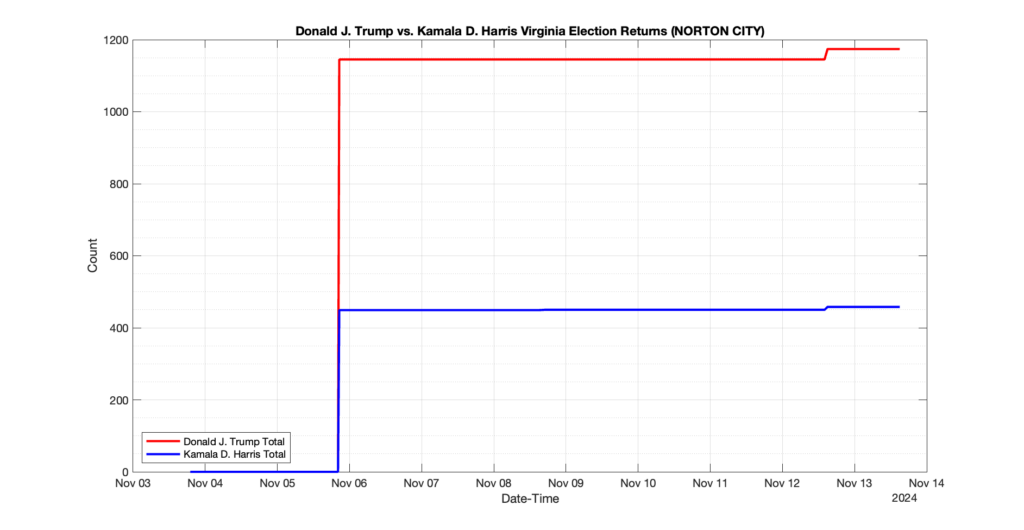
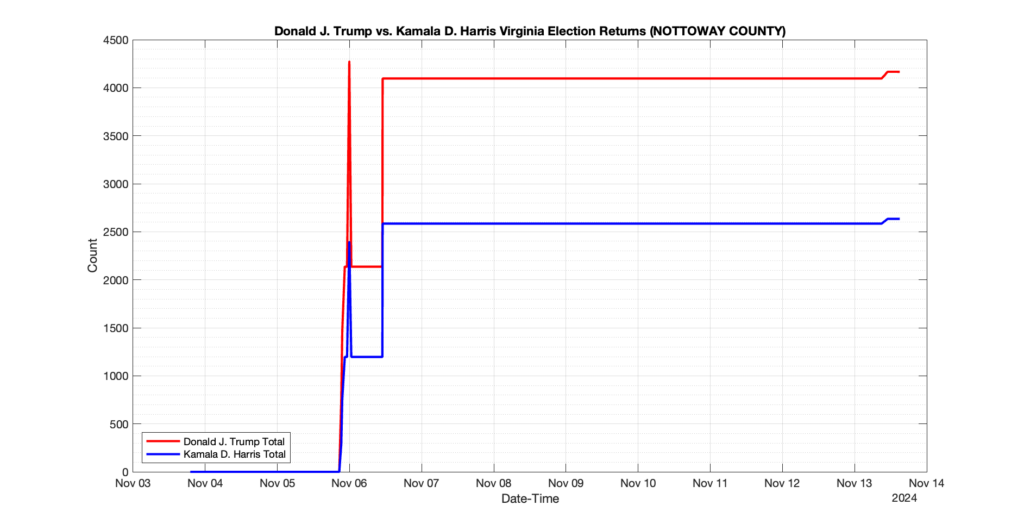
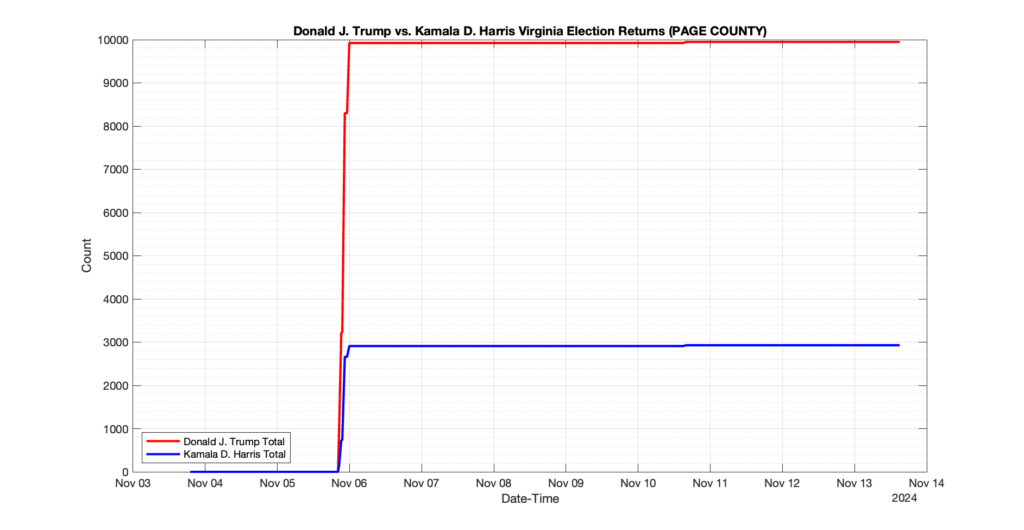
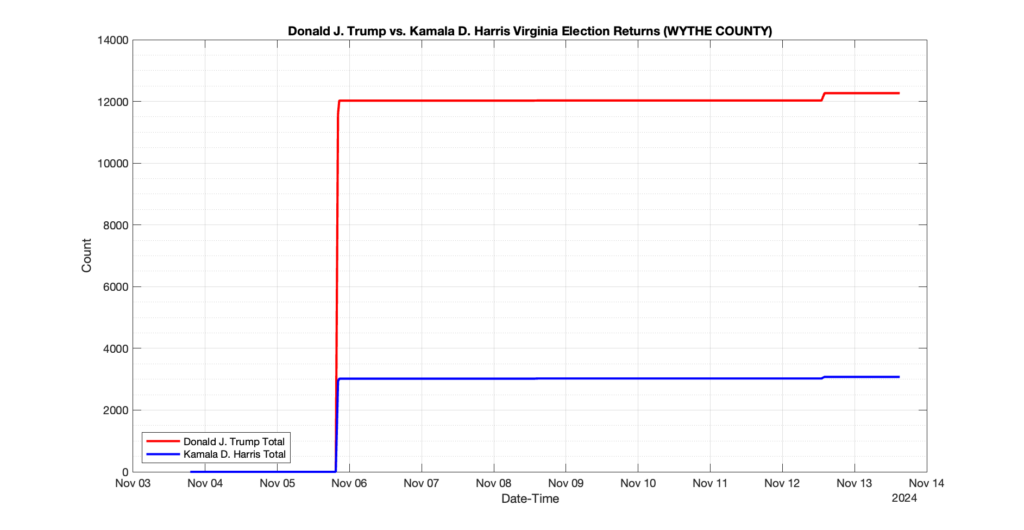
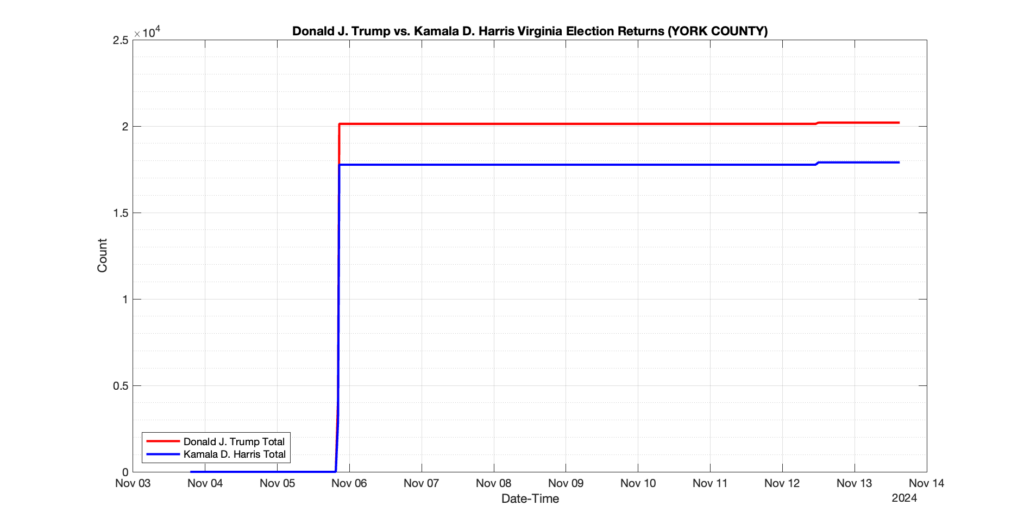
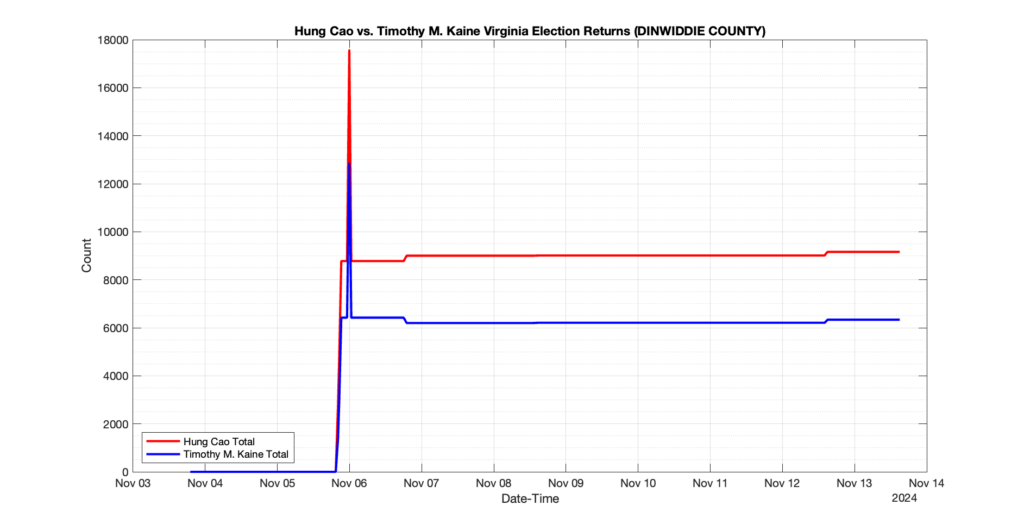
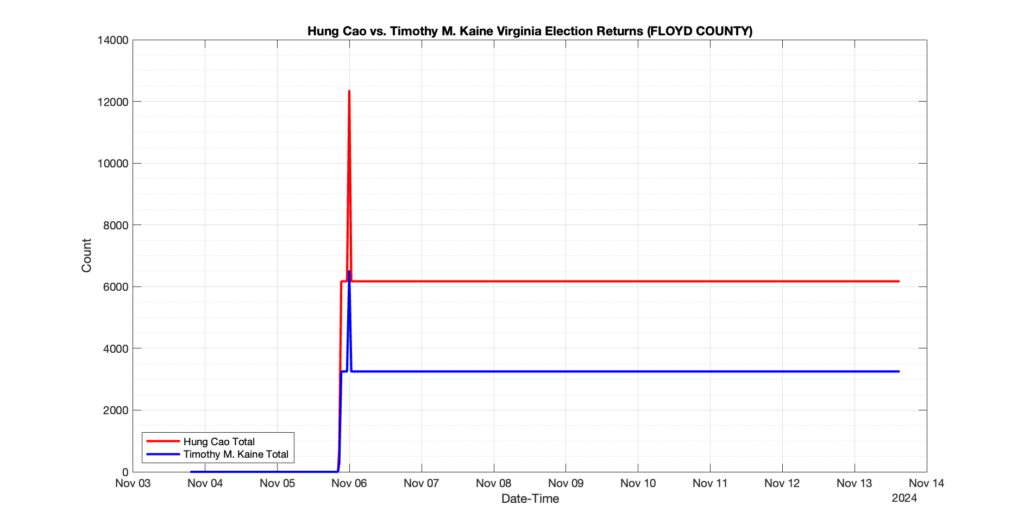
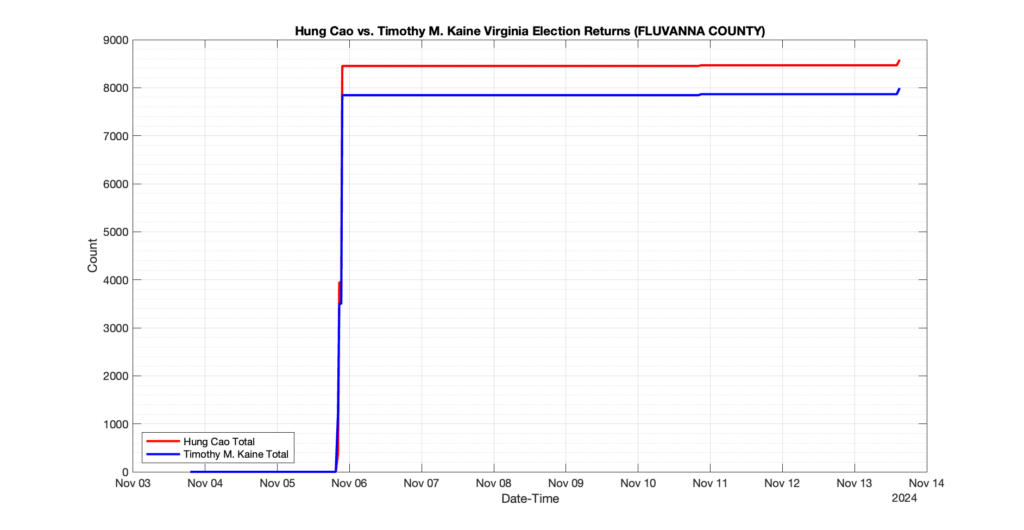
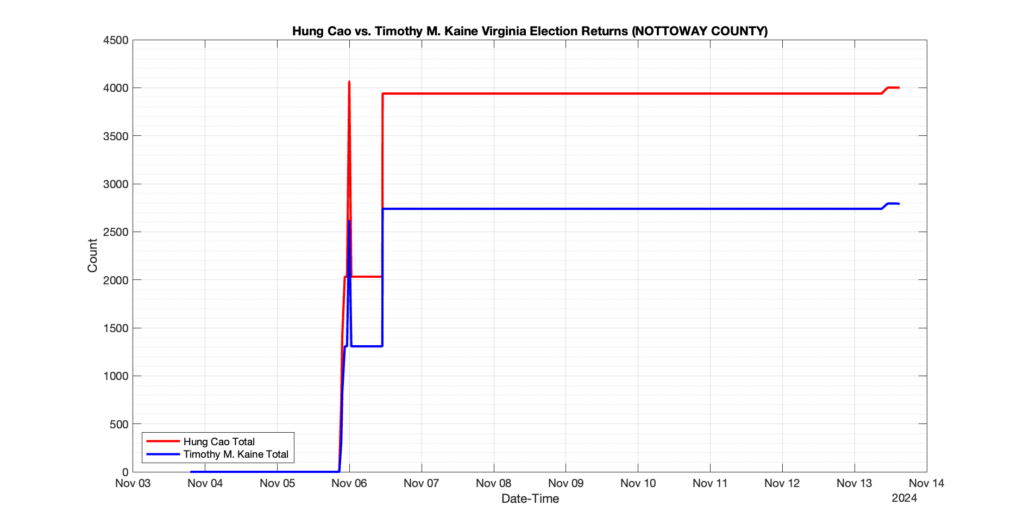
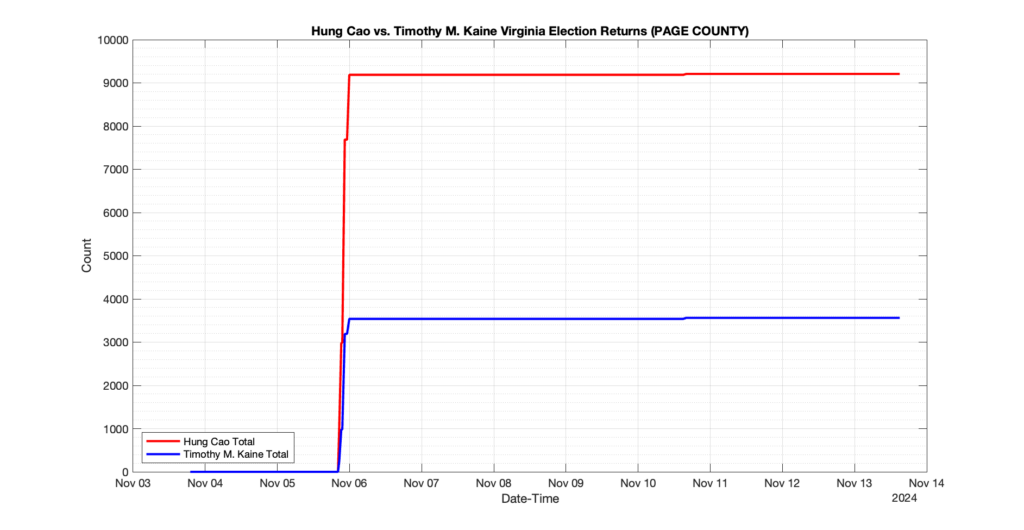
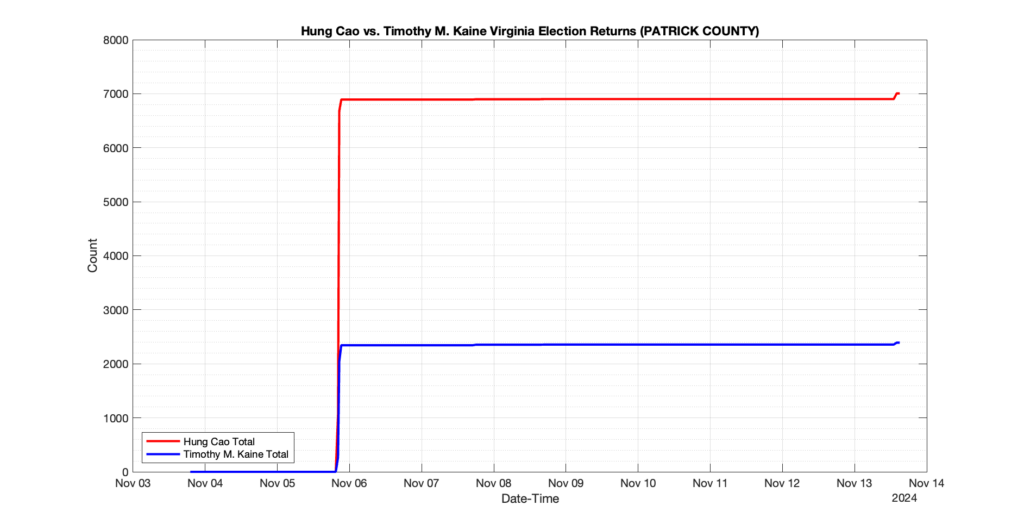
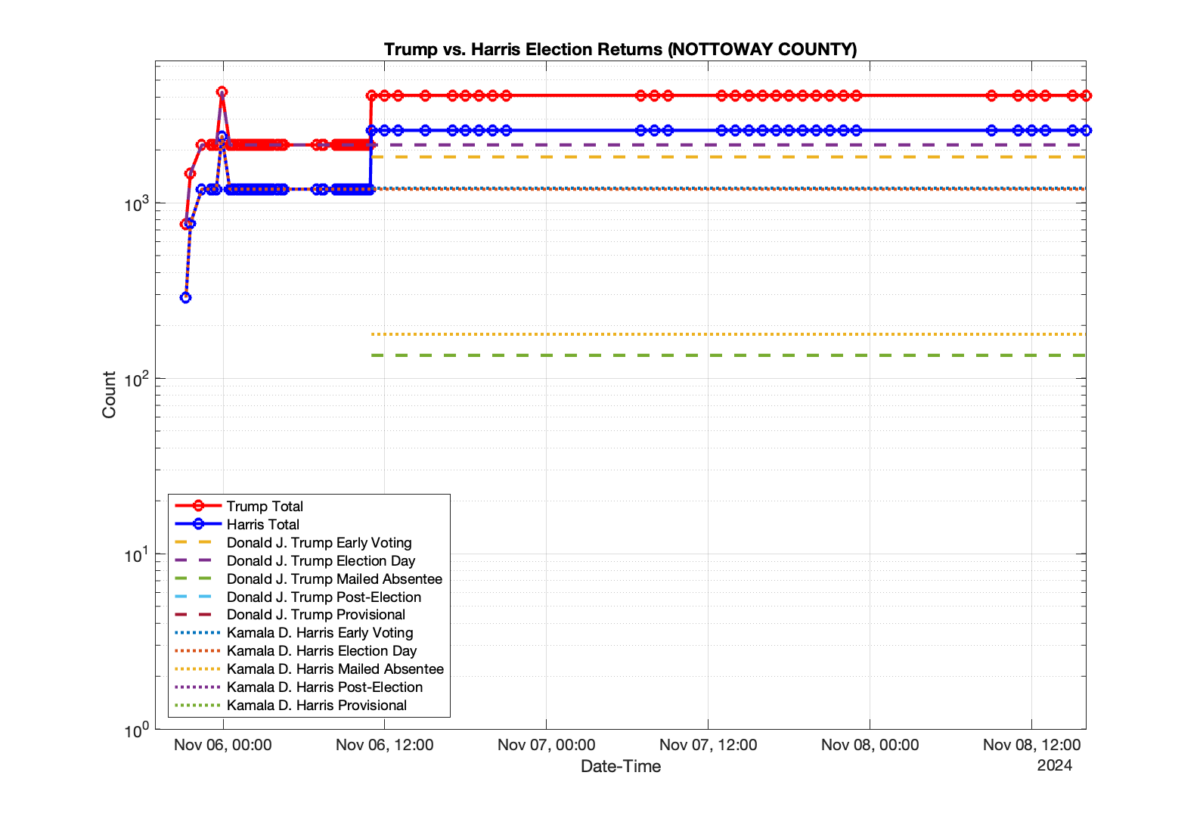
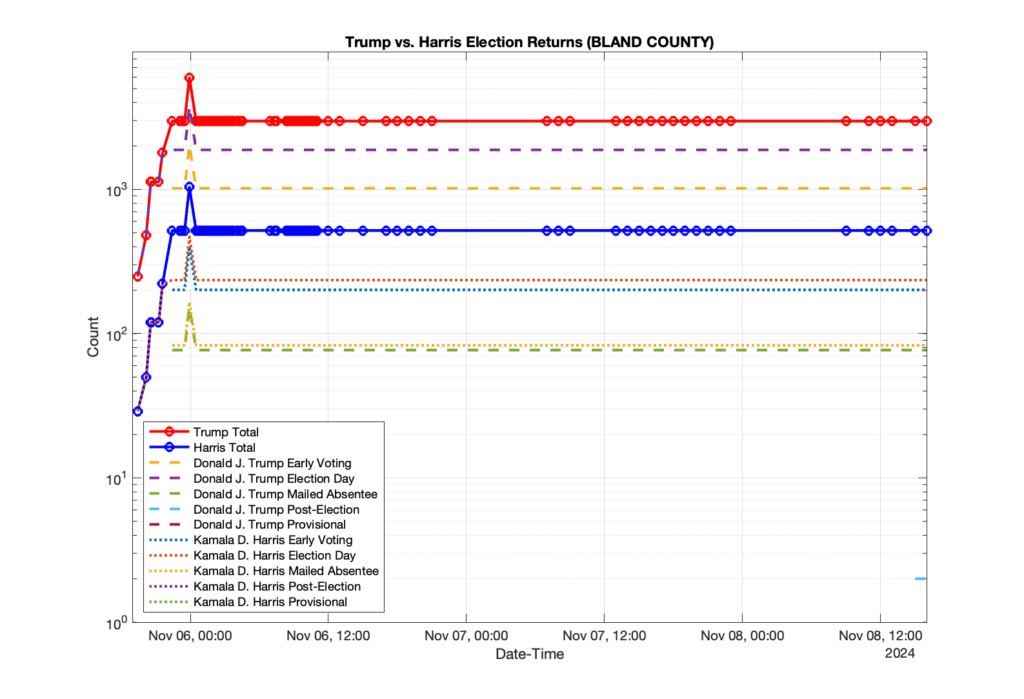
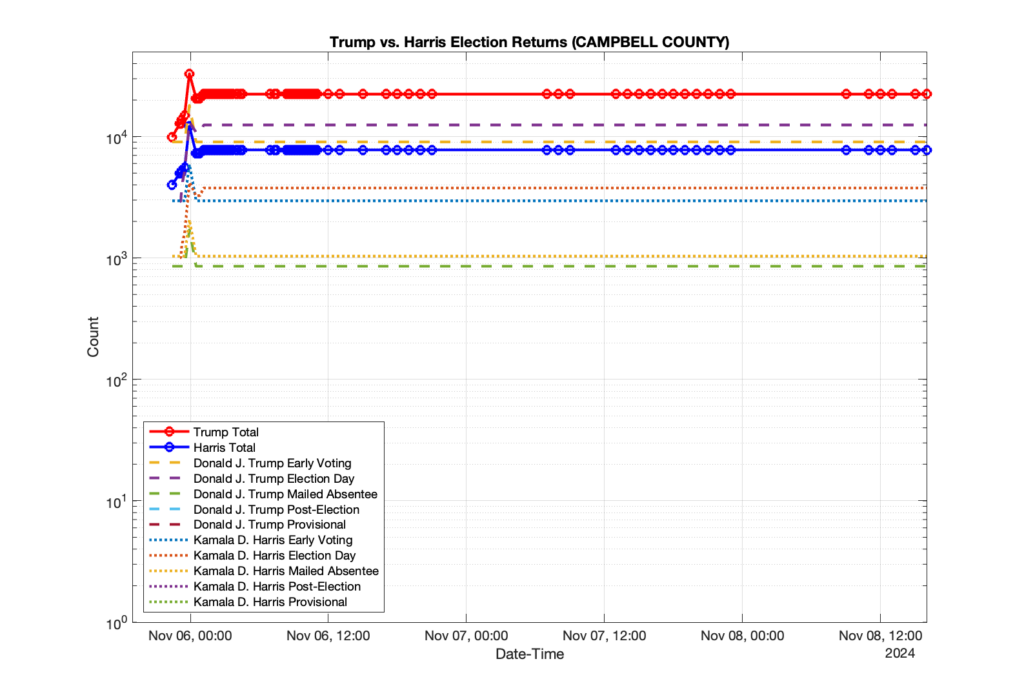
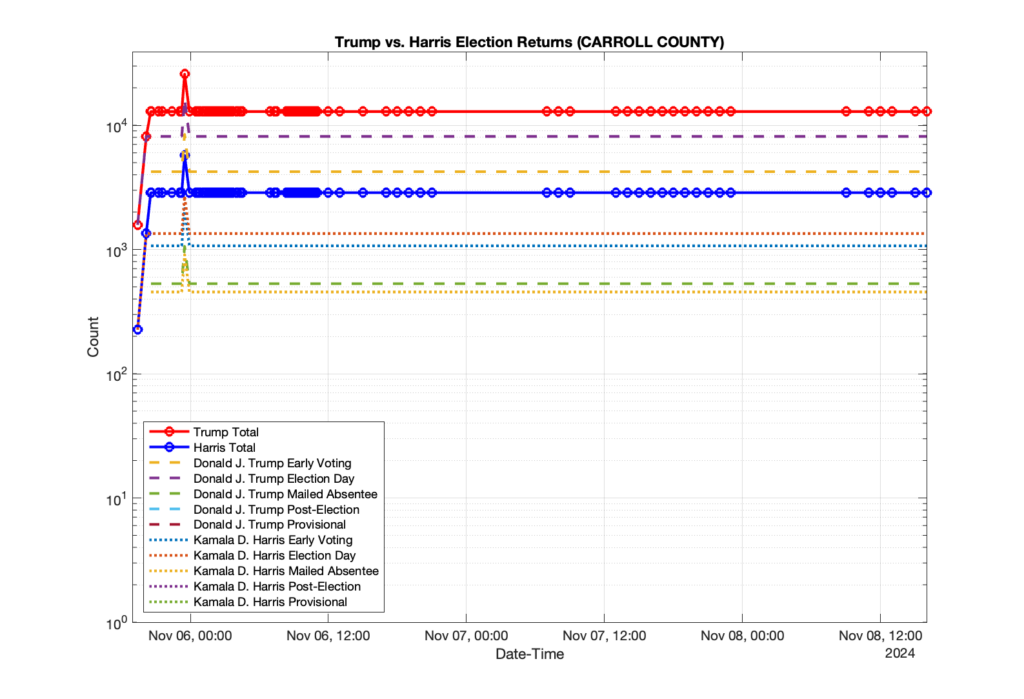
Our team at EPEC monitored the Election Night Reporting (ENR) data feed published by the VA Department of Elections (ELECT) during the 2024 General election. While we have not finished collecting or examining the election results, we have observed a few issues already that are presented below. (Note there is a TON more data analysis to do … these are just preliminary observations.)
There were three specific issues that we have noticed so far in our analysis of the ENR from ELECT. None of these issues look to have impacted the count, as far as we can tell, but these are system or procedural issues that should be documented, addressed and corrected going forward. We will continue to update on these issues as we find out more.
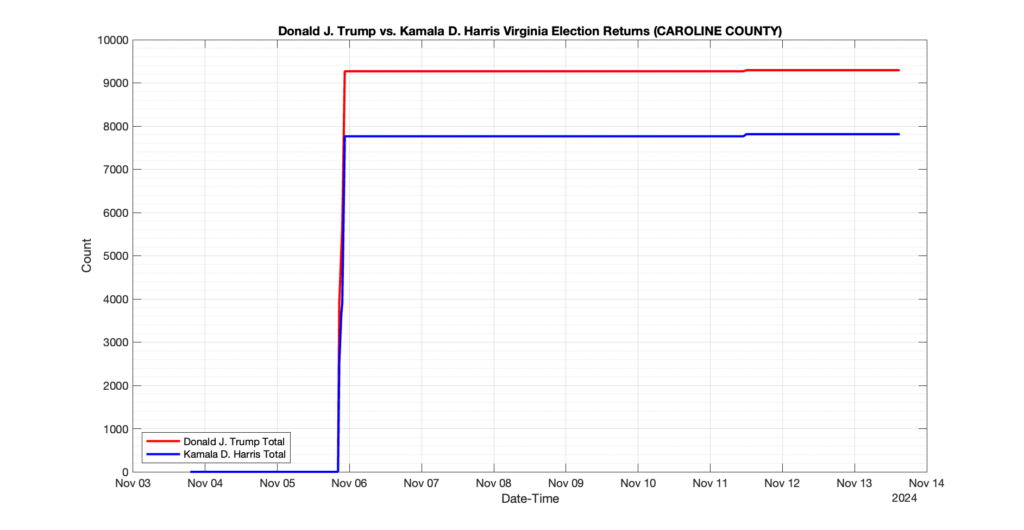
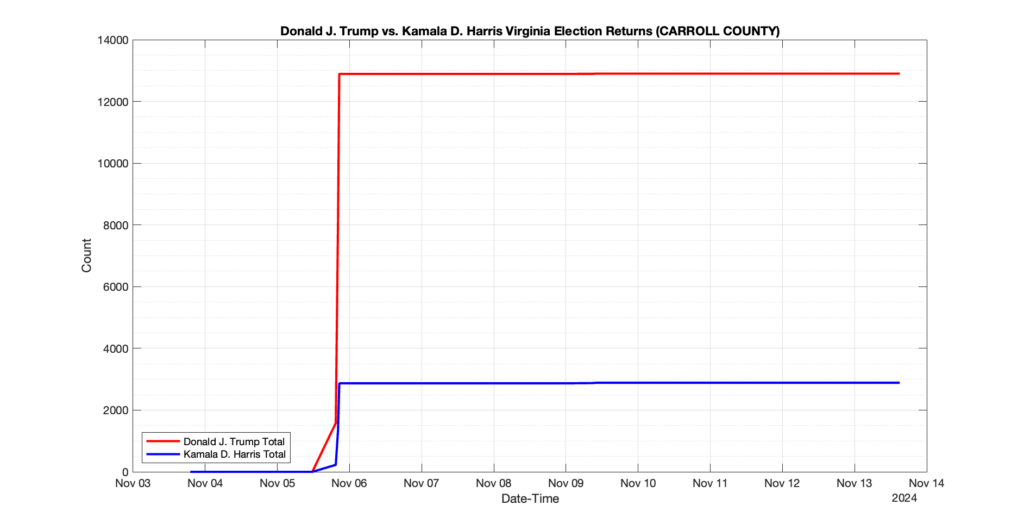
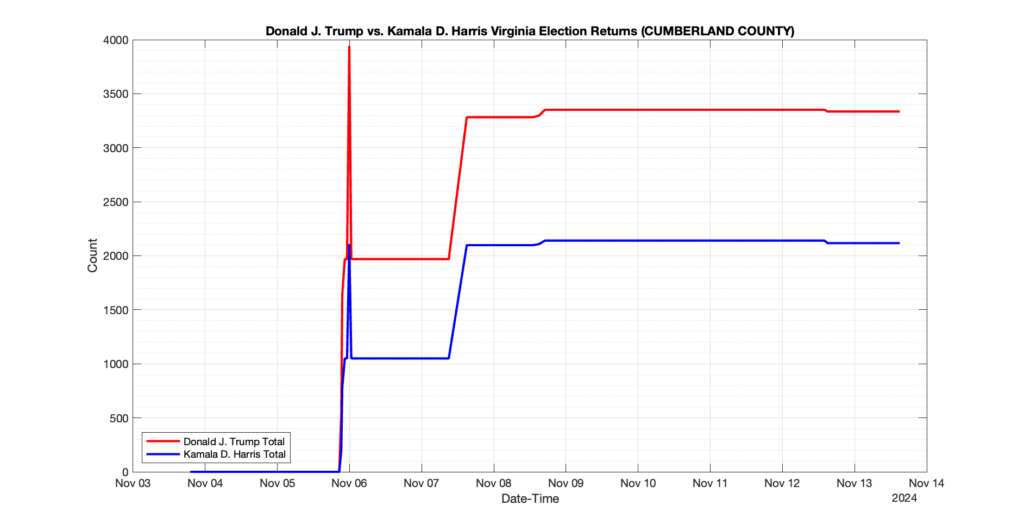
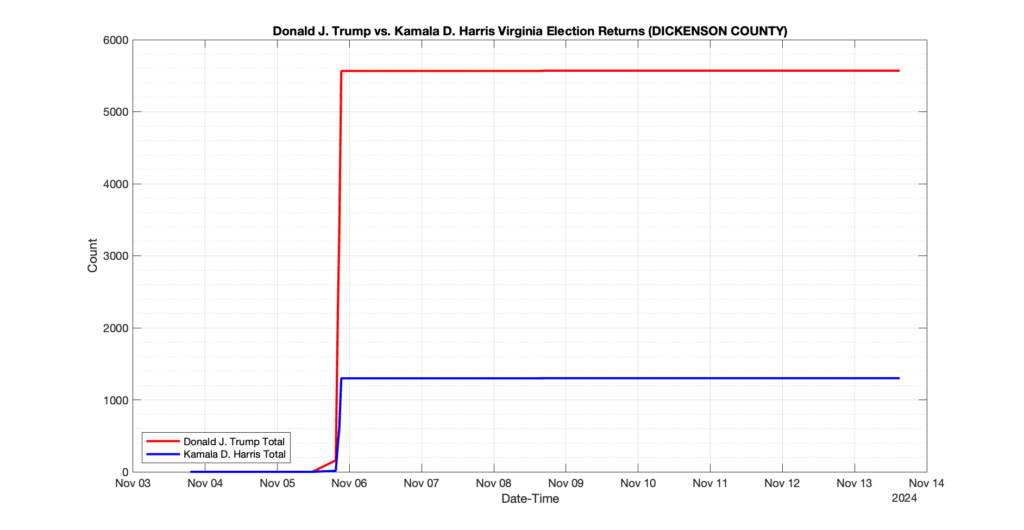
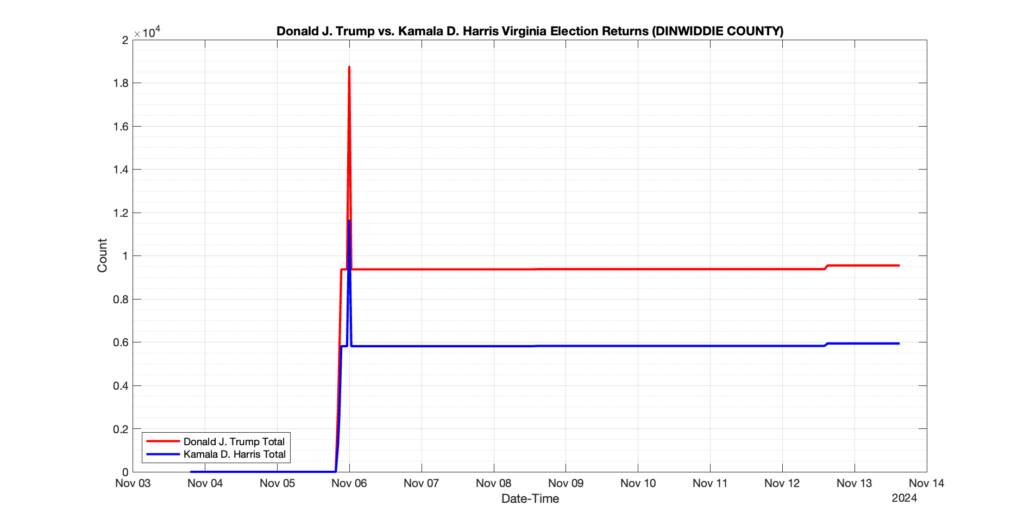
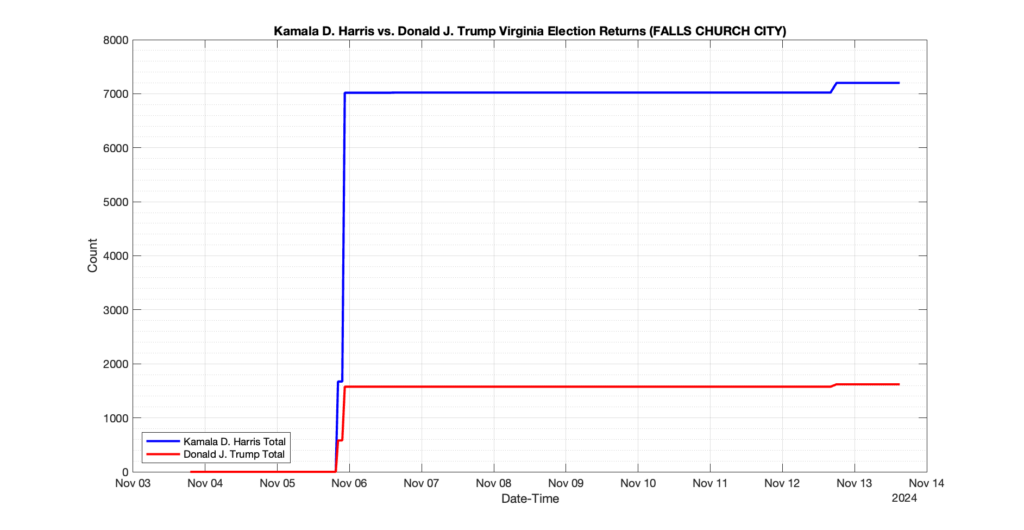
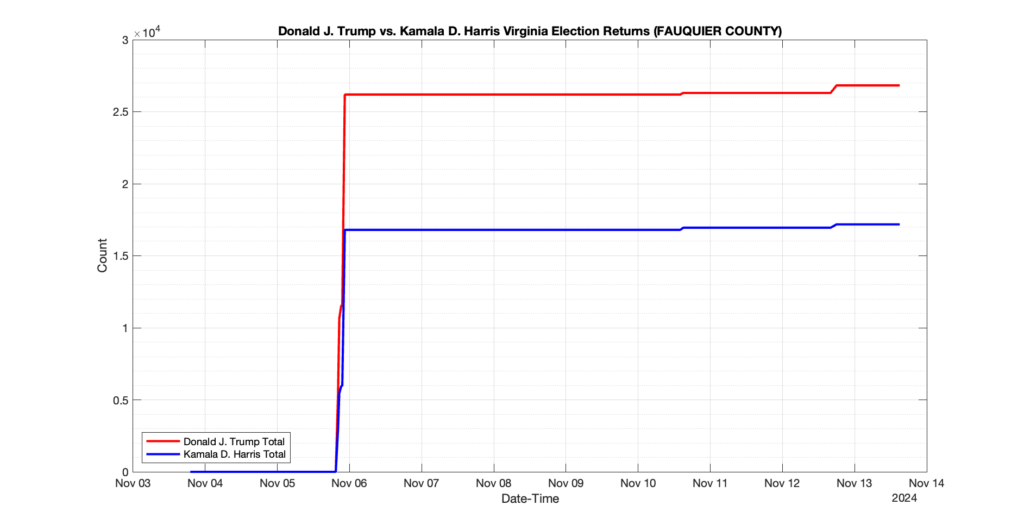
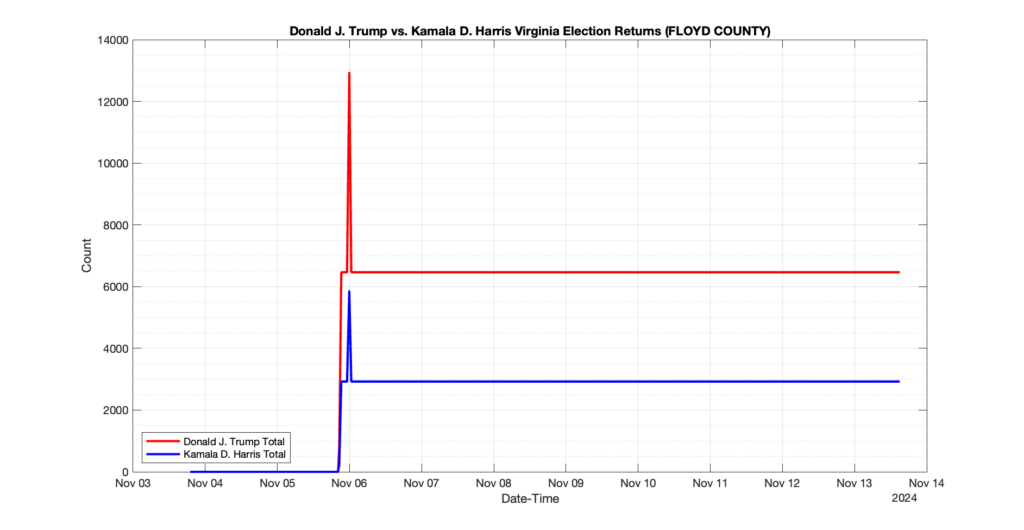
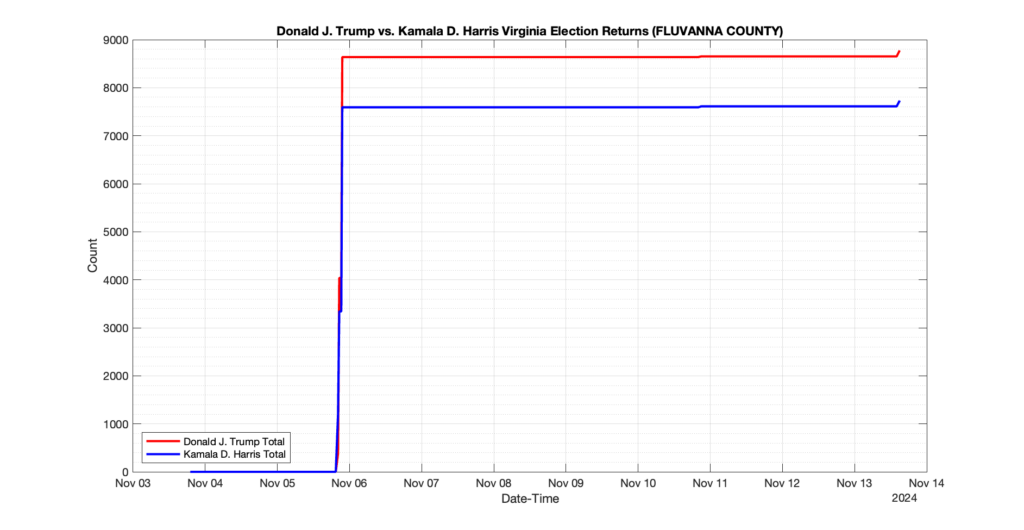
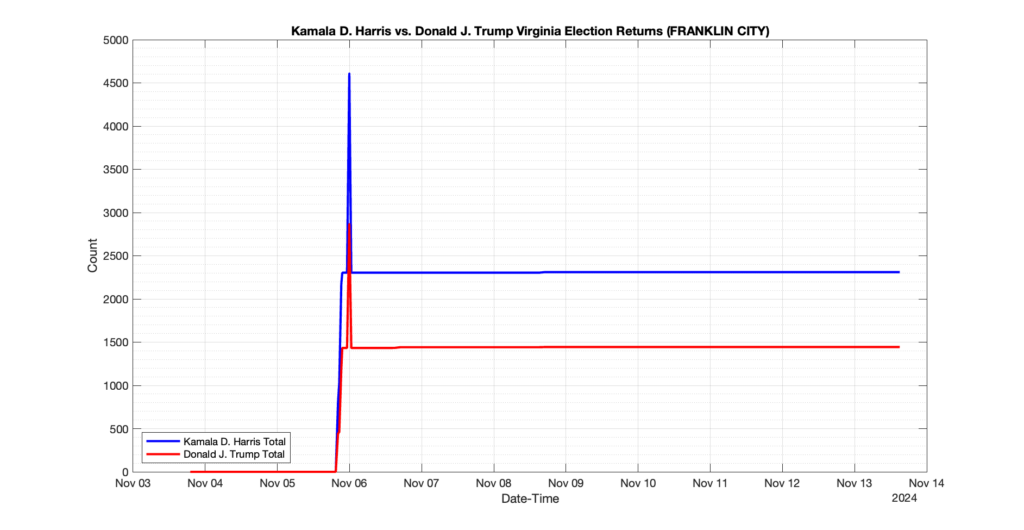
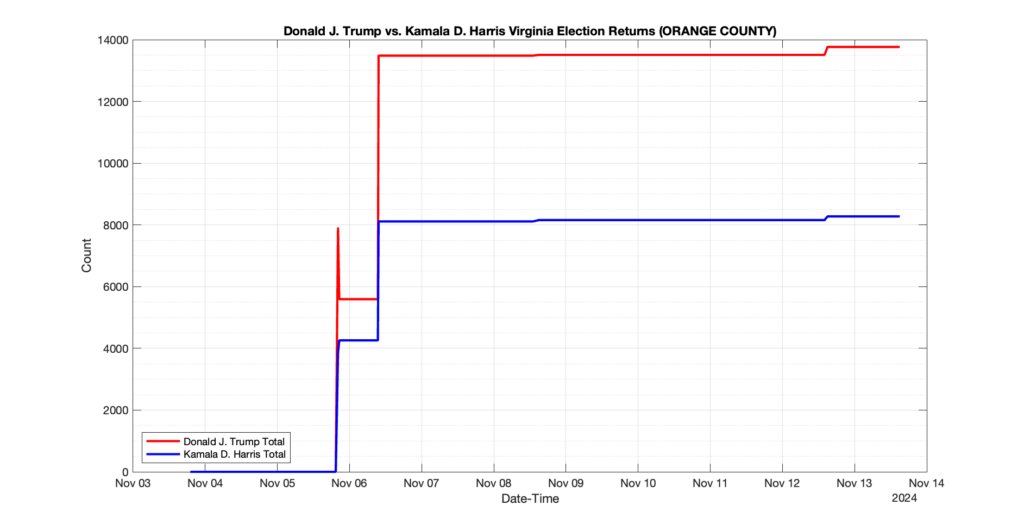
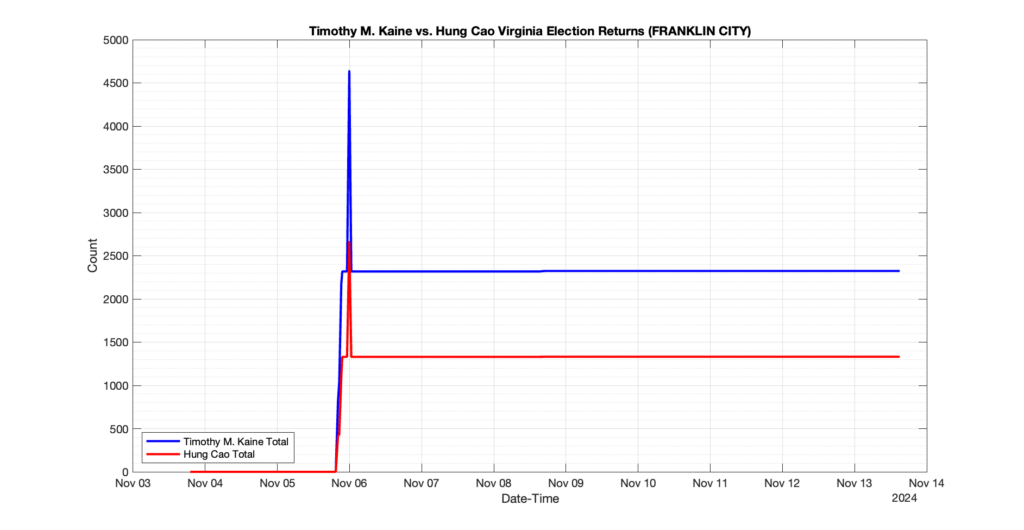
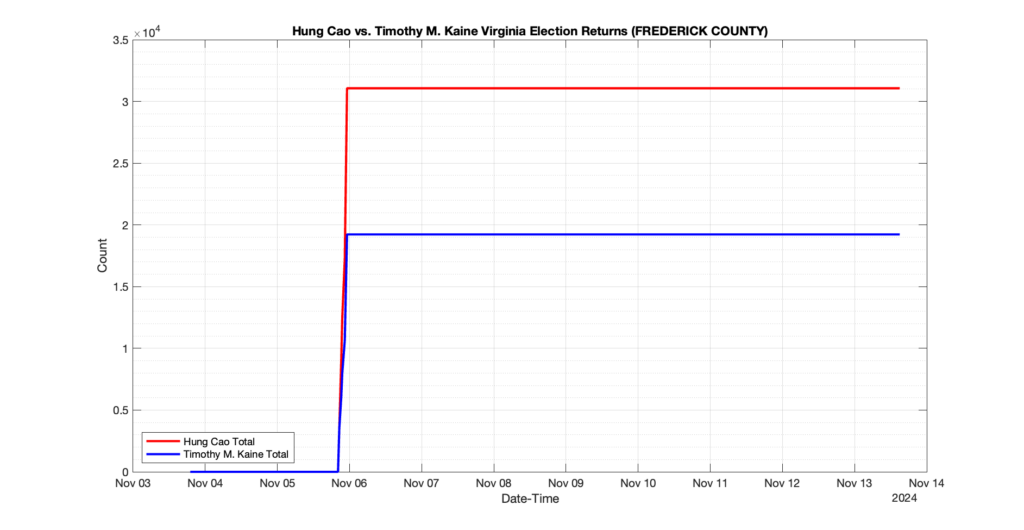
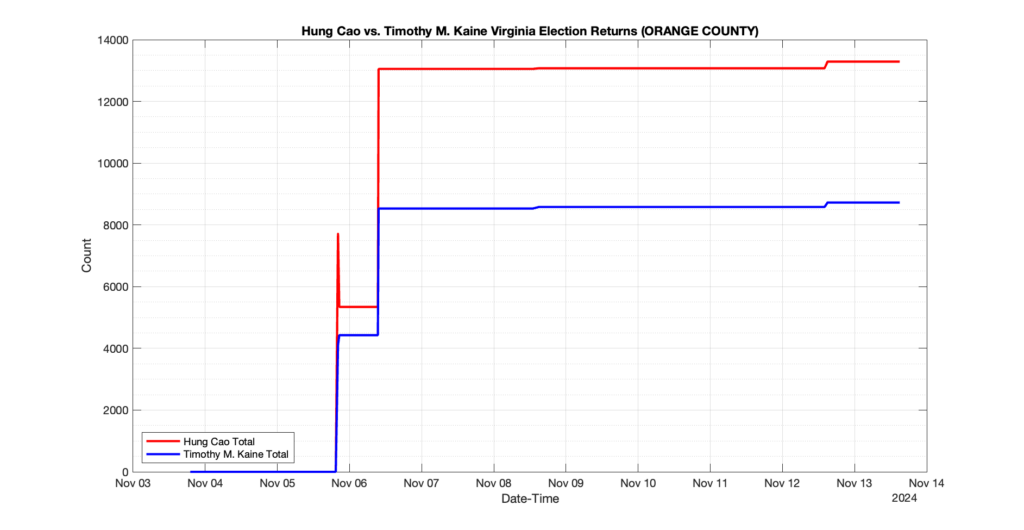
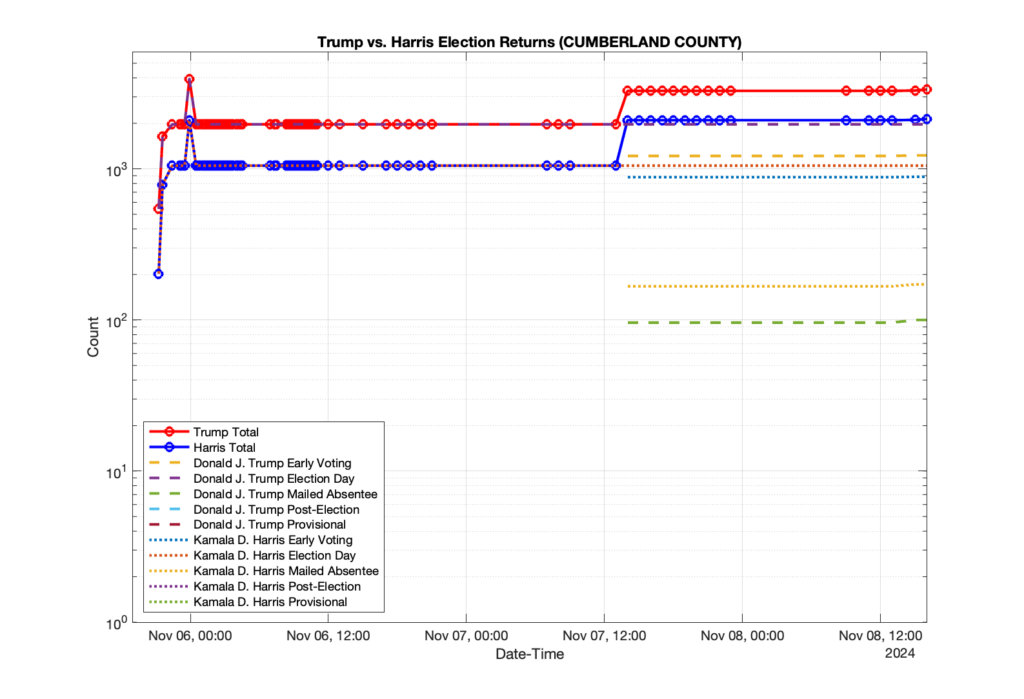
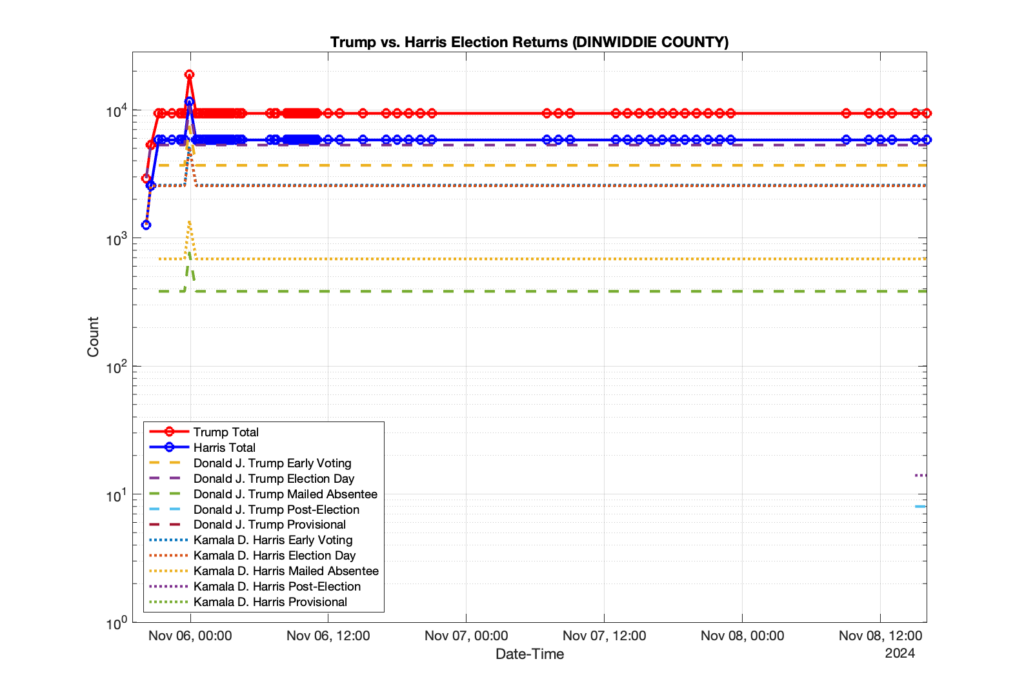
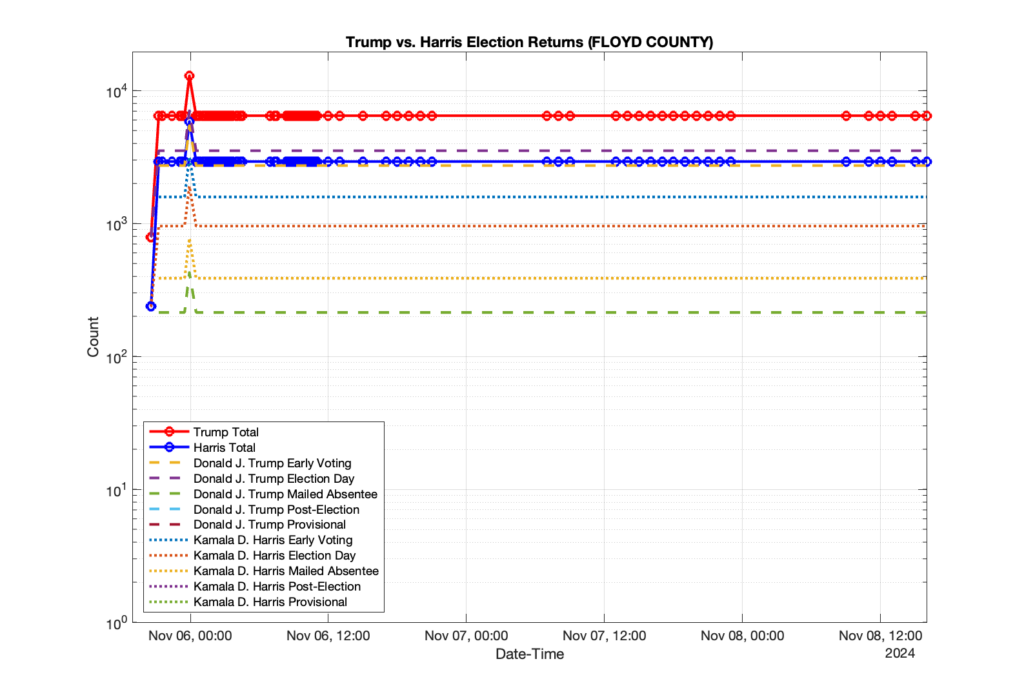
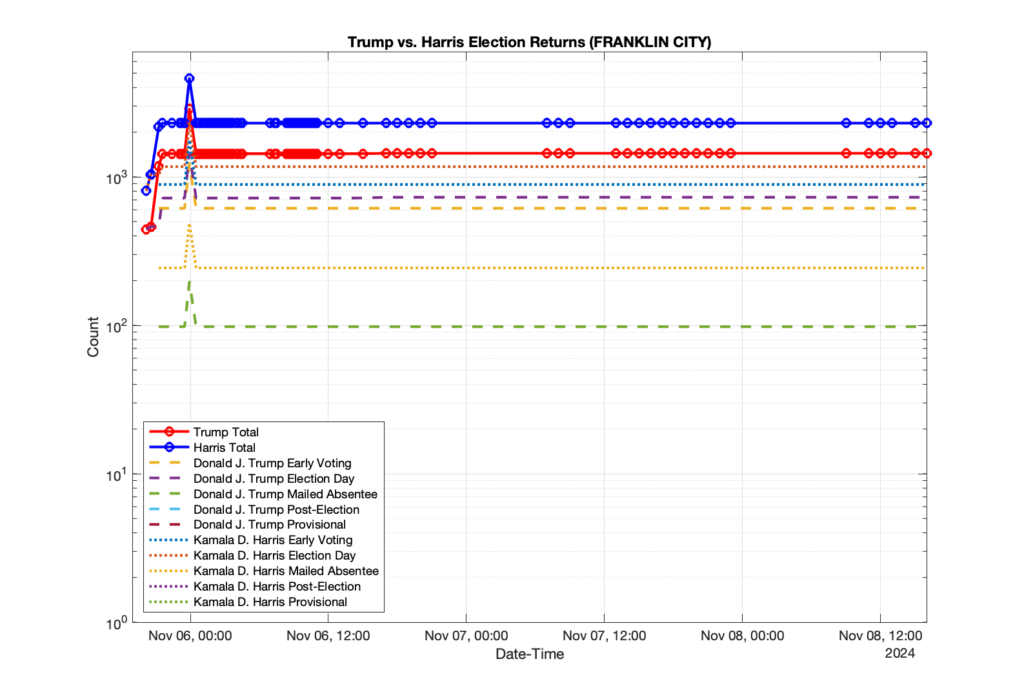
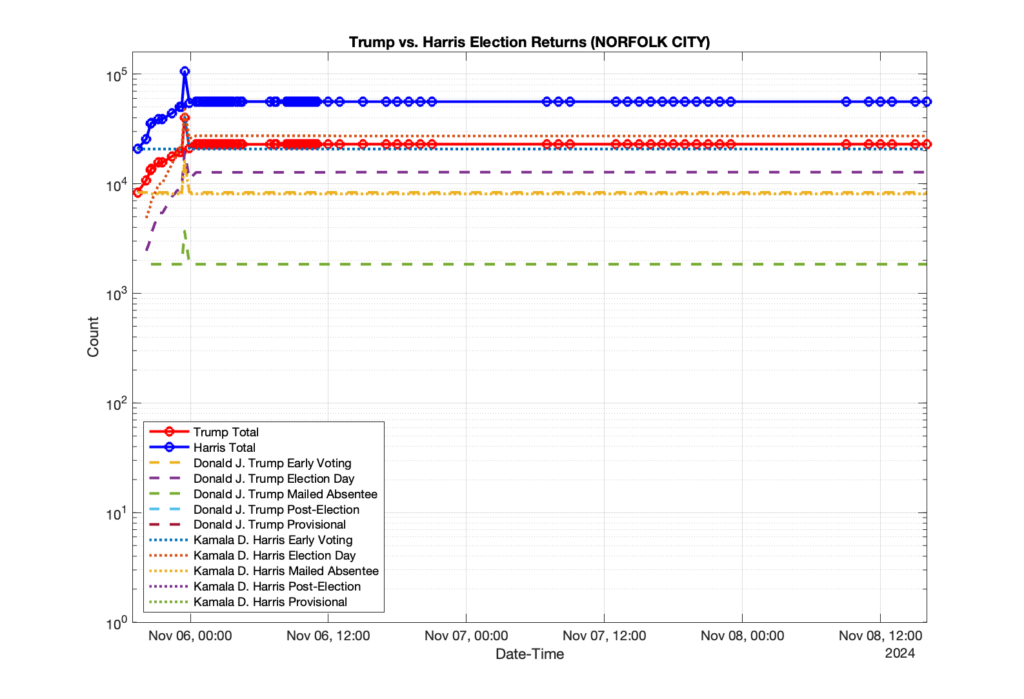
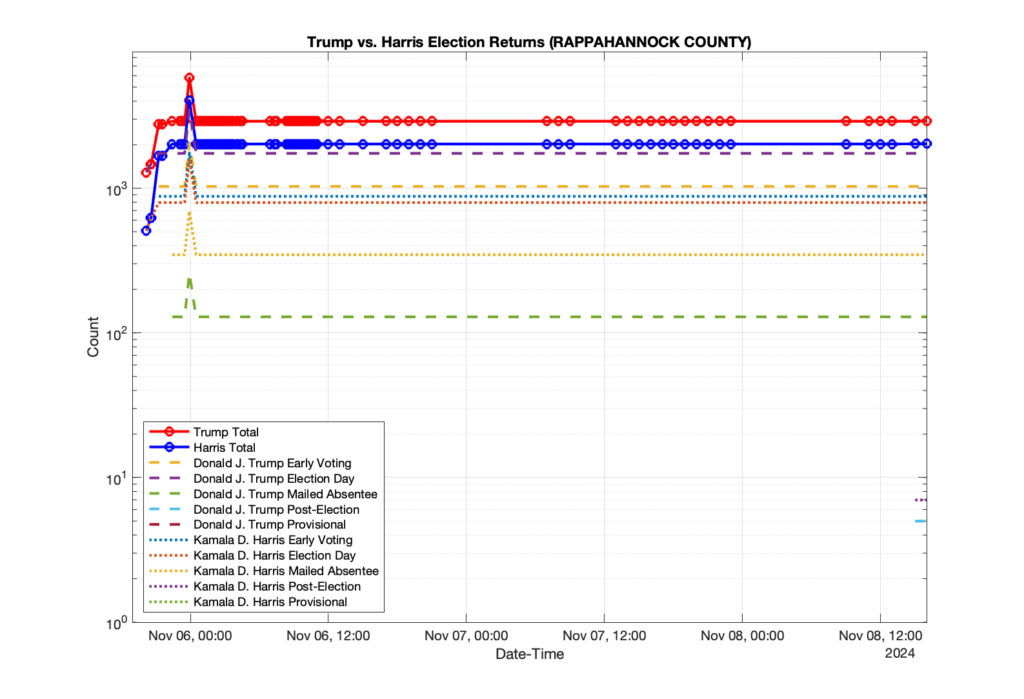
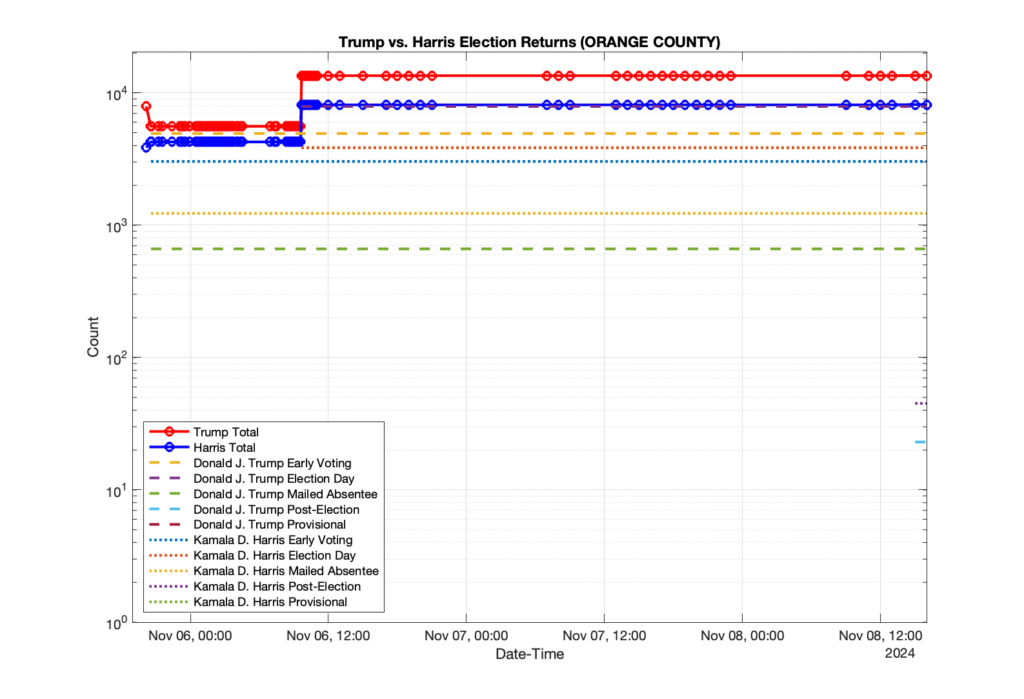
1. There was a distinct jump, and then immediate reversion, in 11 localities at 12am on Nov 6 in the ENR data feed. Bland County, Cambell County, Carrol county, Cumberland County, Dinwiddie County, Floyd County, Franklin City, Norfolk City, Nottaway County, Orange County and Rappahannock County all show the same “glitch”. The image galleries below show this “glitch” in the data feed all occurring at midnight. We have not (yet) reached out directly to ELECT or any of these counties yet to inquire as to the reason. We will update the blog if we find out anything as to the cause of this “glitch”.
2. The second issue we noticed was that Orange County had the first report of their totals at 10:10pm Nov 5 and initially reported the election day count for Donald Trump (7,891) and Kamala Harris (3,852). Then the data feed immediately removed the election day count information and began reporting the just the Early Voting and Mailed Absentee numbers (5,593 Trump, 4,259 Harris), only to add the same Election Day totals back in to the data feed at 9:06am Nov6.
3. Another interesting thing our team observed is that there were significant issues with the reliability public feed provided by VA ELECT over the course of the vote counting. Multiple team members were monitoring the feed from different locations around the state, and therefore had different endpoint internet connection configurations, yet we all noticed that the feed would routinely produce incorrectly formatted JSON data that could not be parsed by standard tools.
The errors seemed random and did not have a specific repeatable pattern when we tried to look at the data being returned. Sometimes it was simply a missing bracket, or quotation mark. Other times it appeared to be missing or malformed sections of the data. Python, MATLAB, Tableau and other standard JSON parser libraries were unable to parse these errant data files.
This might be an issue with IT infrastructure of bandwidth issues at ELECT causing dropped data packets? Or possibly an error in the server-side systems that respond to GET requests for the data? We do know that within the last few years, ELECT has partnered with “Enhanced Voting” to supply the ENR data feed. We hope this feedback is useful to help ELECT improve their ability to supply the public with reliable Election Night Reporting, and are happy to work with ELECT to help identify and correct these issues.
We have updated our previous analysis (from March, July, Sept and Oct) with the latest information from the VA Department of Elections data.
Abstract:
Using the data provided by the VA Department of Elections (ELECT), we have identified at least 3,761 unique registrations that were self-identified as “Declared Non-Citizen” and removed by ELECT from the voter rolls since May of 2023. Of those 3,761 removals there were 569 that also had corresponding records of recent ballots cast at some point in the official Voter History record that we could observe. There were 1,333 associated ballots cast identified since Feb of 2019. There were an additional 2 non-citizen registrations and ballots as per the Daily Absentee List (DAL) data, that were not contained in the Voter History data. The total number of identified non-citizen ballots cast is therefore 1,335 by 539 registrants when combining unique VHL and DAL identifications.
Note that there was a large spike (see Figure 1) in declared non-citizen removals in Sept that seems to have returned to the norm in October. We do not receive enough information from VA ELECT in order to determine if this spike is due to simply increased interactions and interest in the 2024 general election, or changes in the procedures by ELECT, etc. But we can observe this change in the data, even though we do not have enough information as to make a hypothesis as to why it is present.
After our March 2024 post on this topic, we submitted all of the relevant information that we had at the time to the VA AG’s office. We have not heard any response or update on the matter since that time, besides this being considered an active investigation. We subsequently sent our July results as well to the same contact at the AG’s office, but have had no response.
The Arlington County VA Electoral Board undertook their own investigation into this matter after our previous results were posted, and they recently (as of Sept 10 2024) voted 3-0 to send the information to the AG’s office as well. The Arlington County Commonwealths Attorney also is reported to have an ongoing investigation into the matter. Similar efforts are underway in multiple other counties, including Loudoun and Fairfax counties, to name a few.
In October the League of Women Voters along with the US DOJ sued VA over this issue and attempted to get an injunction to place ~1,600 of these removed registrations back on the Voter roll. After two lower courts granted the injunction, it was stayed by the US Supreme Court.
It is EPEC’s opinion that the State of VA is correctly applying the law in this matter, as I detailed in a X.com post on Oct 12, but we will be closely watching how this case continues to play out as we move forward.
Background:
The VA Department of Elections continuously tries to identify and remove invalid or out of date registration records from the voter rolls. One category used for removal is if a registrant has been determined to be a non-citizen. It is required by the VA Constitution that only citizens are allowed to vote in VA elections.
In elections by the people, the qualifications of voters shall be as follows: Each voter shall be a citizen of the United States, shall be eighteen years of age, shall fulfill the residence requirements set forth in this section, and shall be registered to vote pursuant to this article. …
Additionally, according to VA Code Section 24.2-1004, the act of knowingly casting a ballot by someone who is not eligible to vote is a Class 6 felony.
A. Any person who wrongfully deposits a ballot in the ballot container or casts a vote on any voting equipment, is guilty of a Class 1 misdemeanor.
B. Any person who intentionally (i) votes more than once in the same election, whether those votes are cast in Virginia or in Virginia and any other state or territory of the United States, (ii) procures, assists, or induces another to vote more than once in the same election, whether those votes are cast in Virginia or in Virginia and any other state or territory of the United States, (iii) votes knowing that he is not qualified to vote where and when the vote is to be given, or (iv) procures, assists, or induces another to vote knowing that such person is not qualified to vote where and when the vote is to be given is guilty of a Class 6 felony.
ELECT makes available for purchase by qualifying parties various different data sets, including the registered voter list (RVL) and the voter history list information file (VHL). Additionally, ELECT makes available a Monthly Update Service (MUS) subscription that is published at the beginning of each month and contains (almost) all of the Voter List changes and transactions for the previous period.
In the MUS data there is a “NVRAReasonCode” field that is associated with each transaction that gives the reason for the update or change in the voter record. This is in accordance with the disclosure and transparency requirements in the NVRA. One of the possible reason codes given for records that are removed is “Declared Non-Citizen.”
EPEC has been consistently purchasing and archiving all of these official records as part of our ongoing work to document and educate the public as to the ongoing operations of our elections. (If your interested in supporting this work, please head on over to our donation page, or to our give-send-go campaign to make a tax-deductible donation, as these data purchases are not cheap!)
EPEC looked at the number of records associated with unique voter identification numbers that had been identified for removal from the voter record due to non-citizenship status, per the entries in the MUS, and correlated those results with our accumulated voter history list information in order to determine how many non-citizen registrations had corresponding records of ballots cast in previous elections. We only considered those records that are currently in a non-active state as of the latest MUS transaction log, as some determinations of non-citizenship status in the historical MUS transaction log might have been due to error and subsequently corrected and reinstated to active status. That is, we are not considering those records that had a “Declared Non-Citizen” disqualification, but were then subsequently reinstated and reactivated by ELECT.
While EPEC has periodically purchased full copies of the Voter History List for our archive, there is a known issue with the way ELECT handles removals from the voter record that can cause sampling issues depending on the time the VHL file is purchased, and records of legitimately cast ballots to not be present in the VHL: Namely, when ELECT removes a voter from the voter list, they also remove all instances of that voter ID from voter history information and other data files provided to qualified organizations. (IMO … thats a terrible way to manage the data, but that is the way it is done.) In light of that, EPEC also used its archived versions of the Daily Absentee List (DAL) for recent elections in order to attempt to find records of votes cast that might otherwise be missing from the VHL.
Results:
There were 3,761 unique voter records marked for removal with the reason of “Declared Non-Citizen” and not subsequently reinstated in the accumulated MUS record that EPEC began collecting in mid-2023. Of those 3,761 there were 569 that also had corresponding records of recent ballots cast at some point in the official Voter History record that we could observe. There were 1,333 associated ballots cast identified since Feb of 2019. Figure 1 shows the distribution of non-citizen voters in the cumulative MUS file history. The blue trace represent the total identified and CANCELED non-citizen registrations, and the yellow trace represents the number of those records that also had corresponding records in the accumulated voter history data.
Figure 1: Distribution if the number of identified non-citizen records and ballots in the cumulative ELECT MUS file history. The x-axis is the date that a record was marked as CANCELED for the reason of “Declared Non-Citizen”.
Note that the data contained in the MUS updates often covers more than a single month period. In other words, the individual MUS files are oversampled. Subsequent MUS files can therefore also have repeated entries from previous versions, as their data may overlap. Our analysis used the first unique entry for a given voter ID marked as “Declared Non-Citizen” in the cumulative MUS record in order to build Figure 1. This data oversampling in the MUS helps explain the relative increase in the May 2023 bin.
As VHL information can be incomplete depending on the time the VHL data was purchased in relation to the time that registrants were removed from voter records, EPEC also checked these non-citizen removals against the archived history of Daily Absentee List (DAL) files that EPEC has accumulated. There were an additional 2 non-citizen registrations and ballots as per the Daily Absentee List (DAL) data, that were not contained in the Voter History data. The total number of identified non-citizen ballots cast is therefore 1,335 by 539 registrants when combining unique VHL and DAL identifications.
These identifications represent only the individuals who declared themselves as non-citizen status through official interactions with ELECT, DMV, or other agencies. Each removed registrant was then contacted by the registrar to confirm their non-citizen status.
The distribution of identified unique voter ID’s for the 569 identified non-citizen voters per VA locality is given below in Table 1. It should be noted that each ballot record has a specific locality associated with where the ballot was cast, whereas unique individuals might move between localities over time. The assignment of unique identified individuals to each locality in table 1 is therefore based on the locality listed in the specific MUS “Declared Non-Citizen” record for that individual, while the assignment of ballot cast to Localities is based on the individual VHL/DAL records. A person could have lived and voted multiple times in one county, then moved to another county and voted again before finally being determined as a non-citizen. The same person would have generated multiple VHL/DAL records for each ballot cast, and associated with potentially different localities. This should be kept in mind when attempting to interpret Table 1.
Removed
Voted per VHL
Votes per VHL
ACCOMACK COUNTY
7
ALBEMARLE COUNTY
45
8
14
ALEXANDRIA CITY
169
23
39
AMELIA COUNTY
2
1
3
AMHERST COUNTY
1
APPOMATTOX COUNTY
1
ARLINGTON COUNTY
113
19
52
AUGUSTA COUNTY
15
3
3
BEDFORD COUNTY
11
2
4
BOTETOURT COUNTY
2
BRISTOL CITY
1
BRUNSWICK COUNTY
2
1
2
BUCKINGHAM COUNTY
3
CAROLINE COUNTY
9
3
10
CARROLL COUNTY
8
2
5
CHARLES CITY COUNTY
2
1
3
CHARLOTTESVILLE CITY
25
2
7
CHESAPEAKE CITY
96
23
56
CHESTERFIELD COUNTY
237
26
54
CLARKE COUNTY
8
3
4
COLONIAL HEIGHTS CITY
12
1
3
COVINGTON CITY
2
CRAIG COUNTY
1
CULPEPER COUNTY
27
2
2
DANVILLE CITY
18
2
8
DICKENSON COUNTY
1
1
DINWIDDIE COUNTY
9
1
EMPORIA CITY
2
ESSEX COUNTY
3
1
3
FAIRFAX CITY
9
3
13
FAIRFAX COUNTY
678
104
229
FAUQUIER COUNTY
24
3
10
FLUVANNA COUNTY
3
2
2
FRANKLIN COUNTY
2
1
1
FREDERICK COUNTY
30
2
2
FREDERICKSBURG CITY
23
2
4
GALAX CITY
2
GILES COUNTY
2
GLOUCESTER COUNTY
2
1
1
GOOCHLAND COUNTY
5
GRAYSON COUNTY
1
GREENE COUNTY
6
1
2
HALIFAX COUNTY
1
HAMPTON CITY
59
11
13
HANOVER COUNTY
14
2
6
HARRISONBURG CITY
84
5
6
HENRICO COUNTY
79
3
14
HENRY COUNTY
2
ISLE OF WIGHT COUNTY
1
2
JAMES CITY COUNTY
31
4
13
KING GEORGE COUNTY
5
KING WILLIAM COUNTY
1
LOUDOUN COUNTY
235
52
114
LOUISA COUNTY
9
LYNCHBURG CITY
23
3
4
MANASSAS CITY
51
4
11
MANASSAS PARK CITY
18
1
5
MARTINSVILLE CITY
6
1
MECKLENBURG COUNTY
7
3
10
MIDDLESEX COUNTY
2
MONTGOMERY COUNTY
3
NELSON COUNTY
2
NEW KENT COUNTY
3
1
NEWPORT NEWS CITY
110
23
51
NORFOLK CITY
94
13
33
NORTHAMPTON COUNTY
1
1
NORTHUMBERLAND COUNTY
3
2
5
NORTON CITY
1
NOTTOWAY COUNTY
4
ORANGE COUNTY
3
1
3
PATRICK COUNTY
1
PETERSBURG CITY
28
3
9
PITTSYLVANIA COUNTY
7
2
4
PORTSMOUTH CITY
44
13
38
POWHATAN COUNTY
3
1
PRINCE EDWARD COUNTY
10
3
11
PRINCE GEORGE COUNTY
12
PRINCE WILLIAM COUNTY
414
61
139
PULASKI COUNTY
6
1
2
RAPPAHANNOCK COUNTY
2
RICHMOND CITY
172
25
66
ROANOKE CITY
73
4
2
ROANOKE COUNTY
19
2
3
1
ROCKINGHAM COUNTY
22
5
13
RUSSELL COUNTY
3
1
1
SALEM CITY
3
SCOTT COUNTY
1
1
4
SHENANDOAH COUNTY
19
2
6
SMYTH COUNTY
2
SPOTSYLVANIA COUNTY
65
4
10
STAFFORD COUNTY
92
14
29
STAUNTON CITY
4
SUFFOLK CITY
39
14
31
SURRY COUNTY
1
SUSSEX COUNTY
2
1
3
TAZEWELL COUNTY
4
1
1
VIRGINIA BEACH CITY
164
21
70
WARREN COUNTY
14
2
5
WASHINGTON COUNTY
5
2
6
WAYNESBORO CITY
3
WESTMORELAND COUNTY
1
WILLIAMSBURG CITY
10
1
WINCHESTER CITY
23
2
2
WISE COUNTY
2
1
2
WYTHE COUNTY
3
YORK COUNTY
22
11
41
3761
569
1333
The distribution of the 1,333 ballots that were identified as being cast by non-citizen voters (the yellow trace in Figure 1) in previous elections is shown in Figure 2. The most significant spikes are in the 2019, 2020, 2021 and 2022 November General elections, as well as the 2020 March Democratic presidential primary. Figure 3, which shows this distribution as a percentage of votes cast. Please note the scale of the Y-axis on the percent plot in Figure 3 is in percent of total ballots cast in each election. These graphs were only produced for the VHL data, and do not include the DAL identified records.
Figure 2: Distribution of identified non-citizen ballots cast in previous elections.
Figure 3: Distribution of identified non-citizen ballots cast in previous elections as percent of total ballots cast, according to entries in the VHL/DAL data files.
Figures 4 and 5 show the distribution of the registration dates of the identified non-citizen records. The same data is plotted in figure 4 and 5, with the only difference being the scale of the Y-axis in order to better observe the dynamic range of the values. When we look at the registration date of these identified records, we see that there is a distinct relative increase starting around 1996, and then again around 2012.
Figure 4: Registration dates of the identified non-citizen records. Absolute count on y-axis.
Figure 5: Registration dates of the identified non-citizen records. Logarithmic Y-axis scale.
EPEC made a FOIA request to the VA Attorney General’s office on March 11, 2024 inquiring for any records regarding how many prosecutions for non-citizen voting had occurred since June of 2023. We received a response that the AG had no such relevant records.
EPEC subsequently submitted our March analysis dataset to the VA AG’s office upon their request. We have heard no updates or status as to any action taken by the AG’s office since that time, except that it is being considered an ongoing investigation.
Discussion
It appears from the MUS data, that the VA Department of Elections (ELECT) is doing routine identification, cleanup and removal of non-citizen registrations, which is a good thing and we commend them for their continued efforts to maintain clean voter registration lists.
Given the current court cases filed by LWV and DOJ against the state of VA on the matter, it is important to note that the records identified in the MUS are only those resulting from individuals self-identifying as a non-citizen via interactions with DMV, ELECT, or other official avenues.
The fact that a small number of these identified non-citizen registrations are also associated with (presumably … if the data from ELECT is accurate) illegally cast ballots in previous elections does raise a number of questions that citizens should be (politely) asking and discussing with their legislators, elected and appointed government officials. Each act of non-citizen voting is a de-facto disenfranchisement of legal voters rights, and is a punishable offense under VA law.
Q: How did these registrants get placed onto the voter rolls in the first place?
Q: What method and/or data sources are used by the state to identify non-citizen registrations for removal? If that process is exhaustive, and covers all registrations, then these numbers might be considered to represent a statistical complete picture of the problem. If that process is not exhaustive, in that it only uses serendipitous corroborating data sources, then these results likely under-represent the scale of the issues.
Q: As noted above, we are only considering here those individuals who have not had their records re-instated or reactivated after a determination of non-citizen status. We do not have enough information to determine how or why some records were first determined to be non-citizen, canceled and then subsequently re-instated. One potential area of concern is determining whether or not registrants might be falsely or errantly claiming to not be a citizen on official documents in order to be excused from jury duty, for example, and then work to re-instate their voting status once those documents percolate through the system to ELECT and are flagged for removal. This is a wholly separate but serious issue, as making false claims on official documents is itself a punishable offense.
Q: What procedures, processes and technical solutions are in place to prevent current or future registration and casting of ballots by non-citizens? This is especially pertinent given the current state of the flow of illegal immigrants crossing our national borders. According to a recent report by Yahoo Finance, VA is one of the top 30 destinations for illegal migrants, with both Loudoun County and Fairfax making the list.
Q: Why have none of the identified non-citizens who also cast ballots been investigated or prosecuted under VA Code 24.2-1004? As the identification of these ballots comes directly from looking at the official records produced by ELECT, it seems prudent for these to be forwarded by ELECT to the AG’s office with a recommendation to investigate and prosecute. Yet our FOIA request to the VA AG’s office inquiring as to any records associated with these types of investigations or prosecutions produced a “no relevant records exist” response. And since we submitted this information to the AG’s office, there has been no follow up.
Additionally, this evidence which is derived from only official state records, directly contradicts multiple news media reports and attestations that non-citizen voting is a “Myth”, and that non-citizen voting happens “almost never”. If the data from ELECT is accurate, then there are at least 1,335 ballots that have been cast by non-citizen voters just since 2019. Now, that is still very infrequent, but it is not “almost never.” It is a legitimate concern … and these discoveries are only the registrations that have been found and removed from the voter roles by ELECT and that we can observe in the data. We do not know how many exist that we do not know about.
It should be reiterated that these are only the records that we can observe given our data repository, and how often we can realistically purchase and acquire voter history and voter registration information. It is therefore likely that this represents a significant undercount of the occurrences of non-citizen voters and non-citizen voting.
It costs us (EPEC) approximately ~$5K for each purchase of the statewide voter history list, and approximately $15K/year to maintain RVL records using a single baseline full purchase + 2 purchases of the 6mo MUS subscription. Due to the infrequent nature of these data purchases, it is very likely that some individuals have had their voter history or voter registration information completely removed from the record in between our purchases. Additionally, we know that the MUS data does not entirely encompass all transactions performed on the RVL by the department of elections, so there may be yet other unknown transactions that we are missing.
For information that is supposed to be publicly available (according to federal NVRA laws), the state has put up significant hurdles in order for citizens and organizations to acquire it for use it for ensuring transparency and integrity of our electoral process. If we are to have elections that are transparent and accountable to the public, then we must insist that the data be made available and accessible.
We have had a lot of interest in the work we’ve done following the numbers of non-citizen registrant removals by the VA department of election (ELECT). I recently got asked a follow up question as to how those numbers broke out with respect to estimated party leaning for each of the 435 identified non-citizen voters. The method for performing this calculation is presented below. The majority (~77%) could not be associated with either party as they either did not have Primary Election voting history or the computation resulted in a neutral score. There were approximately ~21% with DEM party leaning and only ~2% with REP party leaning.
Method:
VA does not have registration by party, so there is no direct method for knowing a registrants party affiliation. However, for the subset of voters that have voted in party primaries, we can calculate a “leaning” score in a couple of different ways:
Leaning_v1 : This method uses the weighted average of the elections each voter has participated in, with Democratic primaries weighted as +1, and Republican primaries weighted as -1, and all other elections weighted as 0.
Leaning_v2: This method computes the voter leaning as the difference in the ratios of how often a voter participates in either a Dem or Rep primary, with a positive result meaning higher Dem, and a negative result meaning a higher Rep score.
Using the results that we presented previously, we have computed the Leaning scores for each identified non-citizen voter and computed the percentage of the non-citizen voters that fall into each category of Republican, Democrat or Unknown. Both methods of computing the leaning give slightly different, but consistent, results.
Results:
Leaning_v1 of Distinct Identified Non-Citizen Voters:
We have updated our previous analysis (from March, and July) with the latest information from the VA Department of Elections data.
Corrections (09/21/2024): After initial publication there were two errors discovered in generating the correlated entries from the VHL and DAL file archives.
Due to the Department of Elections recent (08/28/2024) change to the DOB data, VHL entries that should have been removed as duplicate entries in our combined VHL history were not being correctly handled.
Due to a variable naming typo in our processing scripts, the supplemental entries found in the DAL were not being de-duplicated against the entries already found in the VHL, as was reported.
Abstract:
Using the data provided by the VA Department of Elections (ELECT), we have identified at least 2,299 unique registrations that were identified as “Declared Non-Citizen” and removed by ELECT from the voter rolls since May of 2023. Of those 2,299 there were 438 (revised from 453) that also had corresponding records of recent ballots cast at some point in the official Voter History record that we could observe. There were 1,034 (revised from 1,117) associated ballots cast identified since Feb of 2019. There were an additional 164 non-citizen registrations that had at least 1 vote cast as per the Daily Absentee List (DAL) data, with a total of 204 ballots identified, however only two of those DAL identified voters and two ballots were not already identified in the VHL. The total number of identified non-citizen ballots cast is therefore 1,036 (revised from 1,321) by 440 (revised from 617) registrants when combining unique VHL and DAL identifications.
After our March 2024 post on this topic, we submitted all of the relevant information that we had at the time to the VA AG’s office. We have not heard any response or update on the matter since that time, besides this being considered an active investigation. We subsequently sent our July results as well to the same contact at the AG’s office, but have had no response.
The Arlington County VA Electoral Board undertook their own investigation into this matter after our previous results were posted, and they recently (as of Sept 10 2024) voted 3-0 to send the information to the AG’s office as well. The Arlington County Commonwealths Attorney also is reported to have an ongoing investigation into the matter.
The VA Department of Elections continuously tries to identify and remove invalid or out of date registration records from the voter rolls. One category used for removal is if a registrant has been determined to be a non-citizen. It is required by the VA Constitution that only citizens are allowed to vote in VA elections.
In elections by the people, the qualifications of voters shall be as follows: Each voter shall be a citizen of the United States, shall be eighteen years of age, shall fulfill the residence requirements set forth in this section, and shall be registered to vote pursuant to this article. …
Additionally, according to VA Code Section 24.2-1004, the act of knowingly casting a ballot by someone who is not eligible to vote is a Class 6 felony.
A. Any person who wrongfully deposits a ballot in the ballot container or casts a vote on any voting equipment, is guilty of a Class 1 misdemeanor.
B. Any person who intentionally (i) votes more than once in the same election, whether those votes are cast in Virginia or in Virginia and any other state or territory of the United States, (ii) procures, assists, or induces another to vote more than once in the same election, whether those votes are cast in Virginia or in Virginia and any other state or territory of the United States, (iii) votes knowing that he is not qualified to vote where and when the vote is to be given, or (iv) procures, assists, or induces another to vote knowing that such person is not qualified to vote where and when the vote is to be given is guilty of a Class 6 felony.
ELECT makes available for purchase by qualifying parties various different data sets, including the registered voter list (RVL) and the voter history list information file (VHL). Additionally, ELECT makes available a Monthly Update Service (MUS) subscription that is published at the beginning of each month and contains (almost) all of the Voter List changes and transactions for the previous period.
In the MUS data there is a “NVRAReasonCode” field that is associated with each transaction that gives the reason for the update or change in the voter record. This is in accordance with the disclosure and transparency requirements in the NVRA. One of the possible reason codes given for records that are removed is “Declared Non-Citizen.”
EPEC has been consistently purchasing and archiving all of these official records as part of our ongoing work to document and educate the public as to the ongoing operations of our elections. (If your interested in supporting this work, please head on over to our donation page, or to our give-send-go campaign to make a tax-deductible donation, as these data purchases are not cheap!)
EPEC looked at the number of records associated with unique voter identification numbers that had been identified for removal from the voter record due to non-citizenship status, per the entries in the MUS, and correlated those results with our accumulated voter history list information in order to determine how many non-citizen registrations had corresponding records of ballots cast in previous elections. We only considered those records that are currently in a non-active state as of the latest MUS transaction log, as some determinations of non-citizenship status in the historical MUS transaction log might have been due to error and subsequently corrected and reinstated to active status. That is, we are not considering those records that had a “Declared Non-Citizen” disqualification, but were then subsequently reinstated and reactivated by ELECT.
While EPEC has periodically purchased full copies of the Voter History List for our archive, there is a known issue with the way ELECT handles removals from the voter record that can cause sampling issues depending on the time the VHL file is purchased, and records of legitimately cast ballots to not be present in the VHL: Namely, when ELECT removes a voter from the voter list, they also remove all instances of that voter ID from voter history information and other data files provided to qualified organizations. (IMO … thats a terrible way to manage the data, but that is the way it is done.) In light of that, EPEC also used its archived versions of the Daily Absentee List (DAL) for recent elections in order to attempt to find records of votes cast that might otherwise be missing from the VHL.
Results:
There were 2,299 unique voter records marked for removal with the reason of “Declared Non-Citizen” and not subsequently reinstated in the accumulated MUS record that EPEC began collecting in mid-2023. Of those 2,299 there were 438 (revised from 453) that also had corresponding records of recent ballots cast at some point in the official Voter History record that we could observe. There were 1,034 (revised from 1,117) associated ballots cast identified since Feb of 2019. Figure 1 shows the distribution of non-citizen voters in the cumulative MUS file history. The blue trace represent the total identified and CANCELED non-citizen registrations, and the yellow trace represents the number of those records that also had corresponding records in the accumulated voter history data.
Figure 1: Distribution if the number of identified non-citizen records and ballots in the cumulative ELECT MUS file history. The x-axis is the date that a record was marked as CANCELED for the reason of “Declared Non-Citizen”.
Note that the data contained in the MUS updates often covers more than a single month period. In other words, the individual MUS files are oversampled. Subsequent MUS files can therefore also have repeated entries from previous versions, as their data may overlap. Our analysis used the first unique entry for a given voter ID marked as “Declared Non-Citizen” in the cumulative MUS record in order to build Figure 1. This data oversampling in the MUS helps explain the relative increase in the May 2023 bin.
As VHL information can be incomplete depending on the time the VHL data was purchased in relation to the time that registrants were removed from voter records, EPEC also checked these non-citizen removals against the archived history of Daily Absentee List (DAL) files that EPEC has accumulated. There were an additional 164 non-citizen registrations that had at least 1 vote cast as per the Daily Absentee List (DAL) data, with a total of 204 ballots identified, however only two of those DAL identified voters and two ballots were not already identified in the VHL. The total number of identified non-citizen ballots cast is therefore 1,036 (revised from 1,321) by 440 (revised from 617) registrants when combining unique VHL and DAL identifications.
These identifications represent only the individuals who declared themselves as non-citizen status through official interactions with ELECT, DMV, or other agencies.
The distribution of identified unique voter ID’s for the 440 identified non-citizen voters per VA locality is given below in Table 1. It should be noted that each ballot record has a specific locality associated with where the ballot was cast, whereas unique individuals might move between localities over time. The assignment of unique identified individuals to each locality in table 1 is therefore based on the locality listed in the specific MUS “Declared Non-Citizen” record for that individual, while the assignment of ballot cast to Localities is based on the individual VHL/DAL records. A person could have lived and voted multiple times in one county, then moved to another county and voted again before finally being determined as a non-citizen. The same person would have generated multiple VHL/DAL records for each ballot cast, and associated with potentially different localities. This should be kept in mind when attempting to interpret Table 1.
MUS Removals
Voted (VHL)
Voted (DAL)
Total Voted
Votes (VHL)
Voted (DAL)
Total Votes
ACCOMACK COUNTY
1
0
0
ALBEMARLE COUNTY
22
4
4
6
6
ALEXANDRIA CITY
109
21
21
36
36
AMELIA COUNTY
2
1
1
3
3
APPOMATTOX COUNTY
1
0
0
ARLINGTON COUNTY
69
15
15
43
43
AUGUSTA COUNTY
6
1
1
1
1
BEDFORD COUNTY
9
2
2
3
3
BOTETOURT COUNTY
2
0
0
BRUNSWICK COUNTY
1
1
1
2
2
BUCKINGHAM COUNTY
3
0
0
CAROLINE COUNTY
5
1
1
5
5
CARROLL COUNTY
6
2
2
0
CHARLES CITY COUNTY
2
1
1
3
3
CHARLOTTESVILLE CITY
15
2
2
7
7
CHESAPEAKE CITY
59
16
16
33
33
CHESTERFIELD COUNTY
212
22
22
51
51
CLARKE COUNTY
6
3
3
4
4
COLONIAL HEIGHTS CITY
5
1
1
3
3
CULPEPER COUNTY
16
1
1
1
1
DANVILLE CITY
14
2
2
8
8
DINWIDDIE COUNTY
7
1
1
1
1
EMPORIA CITY
2
0
0
ESSEX COUNTY
1
0
0
FAIRFAX CITY
9
3
3
11
1
12
FAIRFAX COUNTY
401
78
1
79
175
175
FAUQUIER COUNTY
13
2
2
9
9
FLUVANNA COUNTY
1
1
1
1
1
FRANKLIN COUNTY
3
2
2
4
4
FREDERICK COUNTY
19
2
2
2
2
FREDERICKSBURG CITY
15
1
1
1
1
GALAX CITY
1
0
0
GILES COUNTY
2
0
0
GLOUCESTER COUNTY
1
1
1
1
1
GOOCHLAND COUNTY
4
0
0
GRAYSON COUNTY
1
0
0
GREENE COUNTY
4
1
1
2
2
HALIFAX COUNTY
1
0
0
HAMPTON CITY
40
9
9
15
15
HANOVER COUNTY
8
1
1
4
4
HARRISONBURG CITY
39
2
2
3
3
HENRICO COUNTY
29
3
3
10
10
HENRY COUNTY
2
2
ISLE OF WIGHT COUNTY
1
0
1
1
JAMES CITY COUNTY
23
4
4
11
11
KING GEORGE COUNTY
1
0
0
KING WILLIAM COUNTY
1
0
0
LOUDOUN COUNTY
135
42
42
89
89
LOUISA COUNTY
7
0
0
LYNCHBURG CITY
16
2
2
2
2
MANASSAS CITY
25
3
3
9
9
MANASSAS PARK CITY
11
0
0
MARTINSVILLE CITY
4
1
1
0
MECKLENBURG COUNTY
6
3
3
10
10
MIDDLESEX COUNTY
2
0
0
NELSON COUNTY
2
0
0
NEW KENT COUNTY
2
1
1
0
NEWPORT NEWS CITY
67
19
19
45
45
NORFOLK CITY
58
12
12
29
29
NORTHUMBERLAND COUNTY
3
2
2
5
5
NOTTOWAY COUNTY
2
0
0
ORANGE COUNTY
2
1
1
3
3
PETERSBURG CITY
17
3
3
5
5
PITTSYLVANIA COUNTY
4
1
1
1
1
PORTSMOUTH CITY
33
11
11
35
35
POWHATAN COUNTY
3
0
1
1
PRINCE EDWARD COUNTY
10
3
3
11
11
PRINCE GEORGE COUNTY
10
1
1
1
1
PRINCE WILLIAM COUNTY
220
43
43
103
103
PULASKI COUNTY
5
1
1
2
2
RAPPAHANNOCK COUNTY
1
0
0
RICHMOND CITY
112
20
1
21
59
1
60
ROANOKE CITY
43
2
2
0
ROANOKE COUNTY
4
0
1
1
ROCKINGHAM COUNTY
21
5
5
13
13
RUSSELL COUNTY
2
1
1
1
1
SALEM CITY
3
0
0
SHENANDOAH COUNTY
7
1
1
1
1
SMYTH COUNTY
2
0
0
SPOTSYLVANIA COUNTY
35
3
3
8
8
STAFFORD COUNTY
41
7
7
21
21
STAUNTON CITY
3
0
0
SUFFOLK CITY
27
11
11
20
20
SUSSEX COUNTY
2
1
1
3
3
TAZEWELL COUNTY
3
1
1
1
1
VIRGINIA BEACH CITY
106
15
15
45
45
WARREN COUNTY
8
2
2
5
5
WASHINGTON COUNTY
4
2
2
6
6
WAYNESBORO CITY
3
0
0
WESTMORELAND COUNTY
1
0
0
WILLIAMSBURG CITY
3
0
0
WINCHESTER CITY
15
2
2
2
2
WYTHE COUNTY
2
0
0
YORK COUNTY
15
9
9
35
35
2299
438
2
440
1034
2
1036
The distribution of the 1,034 ballots that were identified as being cast by non-citizen voters (yellow trace in Figure 1) in previous elections is shown in Figure 2. The most significant spikes are in the 2019, 2020, 2021 and 2022 November General elections, as well as the 2020 March Democratic presidential primary. Figure 3, which shows this distribution as a percentage of votes cast. Please note the scale of the Y-axis on the percent plot in Figure 3 is in units of 10^-3 percent. These graphs were only produced for the VHL data, and do not include the DAL identified records.
Figure 2: Distribution of identified non-citizen ballots cast in previous elections.
Figure 3: Distribution of identified non-citizen ballots cast in previous elections as percent of total ballots cast, according to entries in the VHL/DAL data files.
Figures 4 and 5 show the distribution of the registration dates of the identified non-citizen records. The same data is plotted in figure 4 and 5, with the only difference being the scale of the Y-axis in order to better observe the dynamic range of the values. When we look at the registration date of these identified records, we see that there is a distinct relative increase starting around 1996, and then again around 2012.
Figure 4: Registration dates of the identified non-citizen records. Absolute count on y-axis.
Figure 5: Registration dates of the identified non-citizen records. Logarithmic Y-axis scale.
EPEC made a FOIA request to the VA Attorney General’s office on March 11, 2024 inquiring for any records regarding how many prosecutions for non-citizen voting had occurred since June of 2023. We received a response that the AG had no such relevant records.
EPEC subsequently submitted our March analysis dataset to the VA AG’s office upon their request. We have heard no updates or status as to any action taken by the AG’s office since that time, except that it is being considered an ongoing investigation.
Discussion
It appears from the MUS data, that the VA Department of Elections (ELECT) is doing routine identification, cleanup and removal of non-citizen registrations, which is a good thing and we commend them for their continued efforts to maintain clean voter registration lists.
However, the fact that a small number of these identified non-citizen registrations are also associated with (presumably … if the data from ELECT is accurate) illegally cast ballots in previous elections does raise a number of questions that citizens should be (politely) asking and discussing with their legislators, elected and appointed government officials. Each act of non-citizen voting is a de-facto disenfranchisement of legal voters rights, and is a punishable offense under VA law.
Q: How did these registrants get placed onto the voter rolls in the first place?
Q: What method and/or data sources are used by the state to identify non-citizen registrations for removal? If that process is exhaustive, and covers all registrations, then these numbers might be considered to represent a statistical complete picture of the problem. If that process is not exhaustive, in that it only uses serendipitous corroborating data sources, then these results likely under-represent the scale of the issues.
Q: As noted above, we are only considering here those individuals who have not had their records re-instated or reactivated after a determination of non-citizen status. We do not have enough information to determine how or why some records were first determined to be non-citizen, canceled and then subsequently re-instated. One potential area of concern is determining whether or not registrants might be falsely or errantly claiming to not be a citizen on official documents in order to be excused from jury duty, for example, and then work to re-instate their voting status once those documents percolate through the system to ELECT and are flagged for removal. This is a wholly separate but serious issue, as making false claims on official documents is itself a punishable offense.
Q: What procedures, processes and technical solutions are in place to prevent current or future registration and casting of ballots by non-citizens? This is especially pertinent given the current state of the flow of illegal immigrants crossing our national borders. According to a recent report by Yahoo Finance, VA is one of the top 30 destinations for illegal migrants, with both Loudoun County and Fairfax making the list.
Q: Why have none of the identified non-citizens who also cast ballots been investigated or prosecuted under VA Code 24.2-1004? As the identification of these ballots comes directly from looking at the official records produced by ELECT, it seems prudent for these to be forwarded by ELECT to the AG’s office with a recommendation to investigate and prosecute. Yet our FOIA request to the VA AG’s office inquiring as to any records associated with these types of investigations or prosecutions produced a “no relevant records exist” response. And since we submitted this information to the AG’s office, there has been no follow up.
Additionally, this evidence which is derived from only official state records, directly contradicts multiple news media reports and attestations that non-citizen voting is a “Myth”, and that non-citizen voting happens “almost never”. If the data from ELECT is accurate, then there are at least 1,117 ballots that have been cast by non-citizen voters just since 2019. Now, that is still very infrequent, but it is not “almost never.” It is a legitimate concern … and these discoveries are only the registrations that have been found and removed from the voter roles by ELECT and that we can observe in the data. We do not know how many exist that we do not know about.
It should be reiterated that these are only the records that we can observe given our data repository, and how often we can realistically purchase and acquire voter history and voter registration information. It is therefore likely that this represents a significant undercount of the occurrences of non-citizen voters and non-citizen voting.
It costs us (EPEC) approximately ~$5K for each purchase of the statewide voter history list, and approximately $15K/year to maintain RVL records using a single baseline full purchase + 2 purchases of the 6mo MUS subscription. Due to the infrequent nature of these data purchases, it is very likely that some individuals have had their voter history or voter registration information completely removed from the record in between our purchases. Additionally, we know that the MUS data does not entirely encompass all transactions performed on the RVL by the department of elections, so there may be yet other unknown transactions that we are missing.
For information that is supposed to be publicly available (according to federal NVRA laws), the state has put up significant hurdles in order for citizens and organizations to acquire it for use it for ensuring transparency and integrity of our electoral process. If we are to have elections that are transparent and accountable to the public, then we must insist that the data be made available and accessible.
EPEC has compared the changes to two purchased full versions of the VA Registered Voter List (RVL) to the content of the Monthly Update Service (MUS) data covering the same temporal period. Of the ID numbers that were added to the RVL, 3,613 (or 1.0589% of total additions) never appear anywhere in the MUS files covering the same temporal period. Of the ID numbers that were removed from the RVL, 3,355 (or 2.4096% total removals) never appear anywhere in the MUS files covering the same temporal period.
Since mid 2023 EPEC has been purchasing, processing and archiving copies of both the full Registered Voter List (RVL) and the Monthly Update Service (MUS) files which gives the UPDATE, ADD or CANCEL transactions to the voter list throughout the year.
Once a baseline RVL is established, the MUS files can be used to update that baseline in order to keep the list current. That should be all one needs to keep an accurate dataset of the registered voter list using monthly updates … except there is a catch … the MUS for some reason doesn’t quite capture all of the changes that are occurring in the voter list. In fact, we see about 1-2.5% of the ADD or CANCEL transactions between each RVL snapshot are not reflected by any corresponding entries in the MUS.
All of the changes that are made between two different RVL baseline snapshots should be able to be observed in the corresponding MUS files that cover the same time period, and vice versa. The MUS has transaction logs accounting for new registrants, for registrants who move, for removing deceased individuals, for individuals that have had a change in their felon status, for individuals who are determined non-citizen, for administrative updates and correction, etc. So, in theory, it should be able to be a complete record. However, over the course of working with the VA data files, every so often we have noticed that some transactions seem to be unaccounted for. Therefore, once we had enough data compiled, we decided to test just how well the MUS data actually explains the changes we see between between two baseline RVL files.
Method:
For this experiment, we used full RVL snapshots purchased from VA Department of Elections (ELECT) on 2023-06-30 and 2024-08-29, and all of the monthly MUS distributions covering the entire time period in between.
Using the voter ID number field that is present in all datasets, we first determine which ID numbers were added to the 2024 RVL dataset, and which ID numbers were deleted from the 2023 RVL data. We then checked to see how many of those ID numbers appear in any of the MUS data files, for any reason.
Note that this data was processed statewide, such that registrants moving between localities within the state should not affect the total number of computed additions or removals, as the ID numbers should still be present in the datasets, although corresponding locality information may have changed.
Results:
The breakdown of the number of changes that were present in the MUS file over the time period of the RVL snapshots (2023-06-30 through 2024-08-29) is given in Figure 1 below. The MUS data was deduplicated and truncated to only consider transactions with TRANSACTION date information between the dates associated with the RVL datasets. The bars in Figure 1 are logarithmically scaled in the y-axis, with the x-axis representing the NVRAReasonCode given for each transaction in the MUS. The bars are color coded by transaction type. As there are duplicates and oversampling within the collection of MUS files, only the latest transactions for each uniquely identified ID number was utilized to generate the plot. As can be seen from the various categories along the x-axis of this plot, the data in the MUS logs should be sufficient to capture all of the transactions with the RVL.
Figure 1: Breakdown of MUS transactions between 2023-06-30 and 2024-08-29
Direct Inspection of the RVL Snapshots:
Performing a simple set-difference between the elements of the unique ID numbers present in the 2023-06-30 RVL data vs the 2024-08-29 RVL data shows that there were 341,191 unique ID’s added, and 139,232 removed between the two datasets.
Of the ID numbers that were ADDED between the raw RVL snapshots, 3,613 (or 1.0589%) never appear anywhere in the MUS files covering the same temporal period.
Of the 3,613 ID numbers that were ADDED between the raw RVL snapshots, and that don’t appear in the MUS record, 537 (or 14.863%) have at least one entry in the Voter History List (VHL) data the EPEC has been collecting and archiving.
Of the ID numbers that were REMOVED between the raw RVL snapshots, 3,355 (or 2.4096%) never appear anywhere in the MUS files covering the same temporal period.
Of the 3,355 ID numbers that were REMOVED between the raw RVL snapshots, and that don’t appear in the MUS record, 2,011 (or 59.94%) have at least one entry in the VHL data the EPEC has been collecting and archiving.
Using the MUS-Adjusted RVL baseline
If we ignore the 2024-08-29 dataset, and instead directly apply the transactions in the MUS datafiles to the 2023-06-30 dataset in order to create a new RVL list, we would end up with 342,888 Additions, and 137,849 removals respectively to unique voter ID numbers. We see 1,697 more (342,888-341,191=1697) additions when trying to directly apply the MUS than when directly comparing RVL snapshots, and 1,383 less (139,232-137,849=1393) removals. Keep in mind these discrepancies are in addition to the 3,613 and 3,355 discrepancies using the RVL snapshot baselines, as the ID numbers in each set are unique. So the total number of discrepancies is 3,613 + 3,355 + 1,697 + 1,383 = 10,048 records.
We do not understand yet the origin of these discrepancies, it could be a coding error on the part of the developers of the VERIS system, or it could be that there is a category of data adjustments that is not adequately reflected in the RVL or MUS data products. The RVL snapshots are supposed to be the authoritative record of the voter registration data, and the MUS data updates are supposed to capture all of the transactional changes to said registration records.
Regardless of the cause of the discrepancy, the fact remains that there are a small number of transactions and changes to the voter record that are unobservable. They are, in effect, “dark” transactions in the voter registration data that cannot be observed, validated or verified.