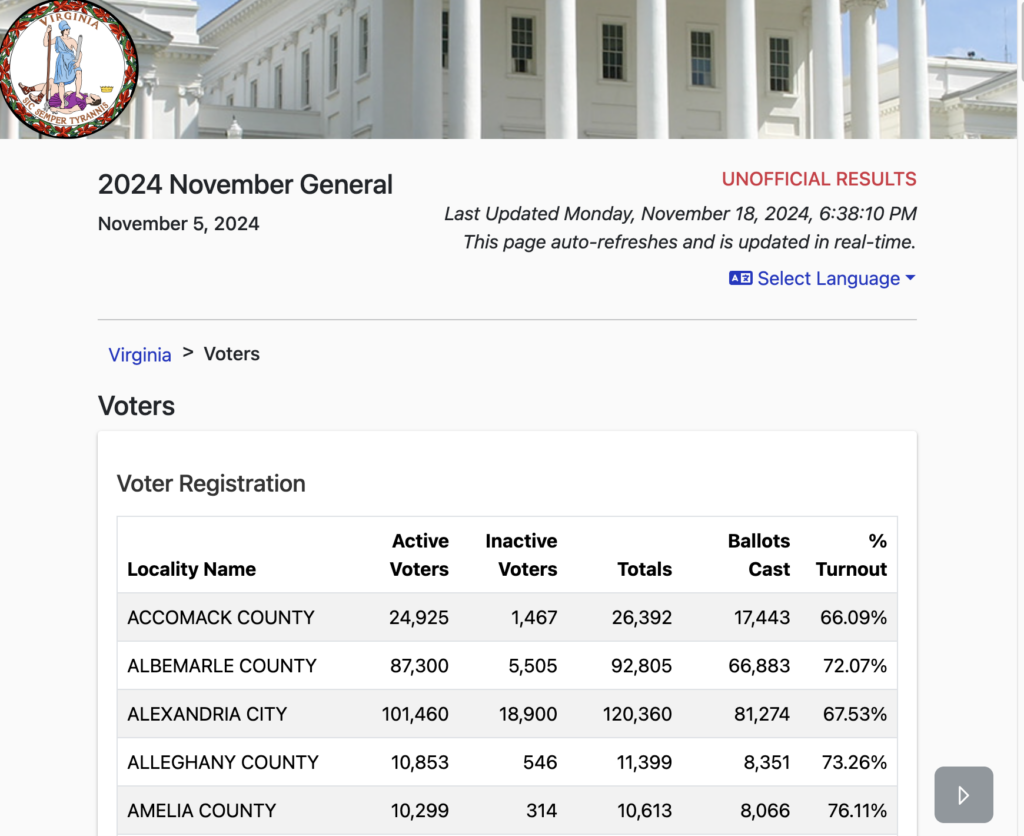
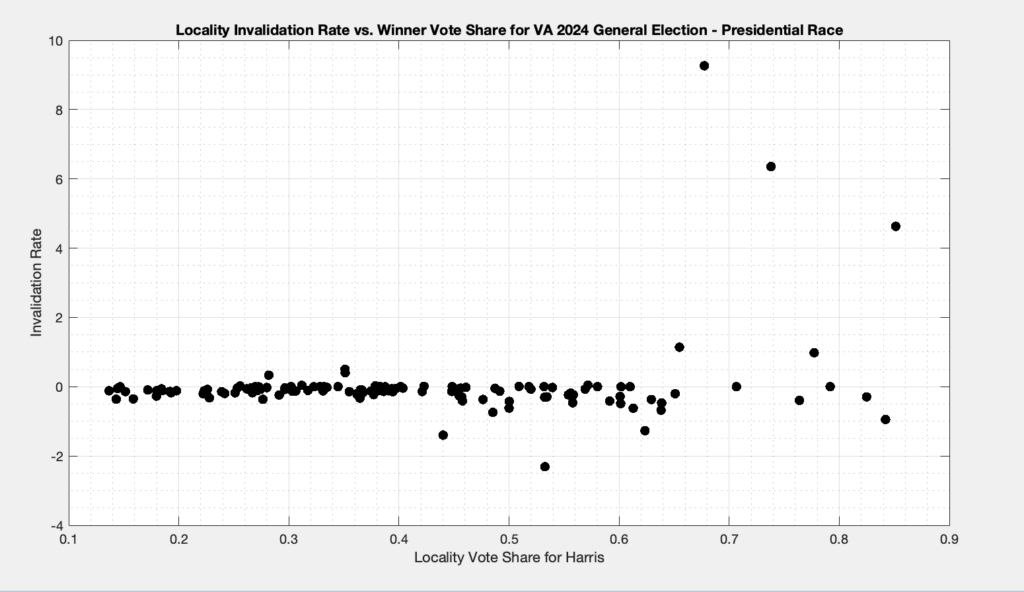
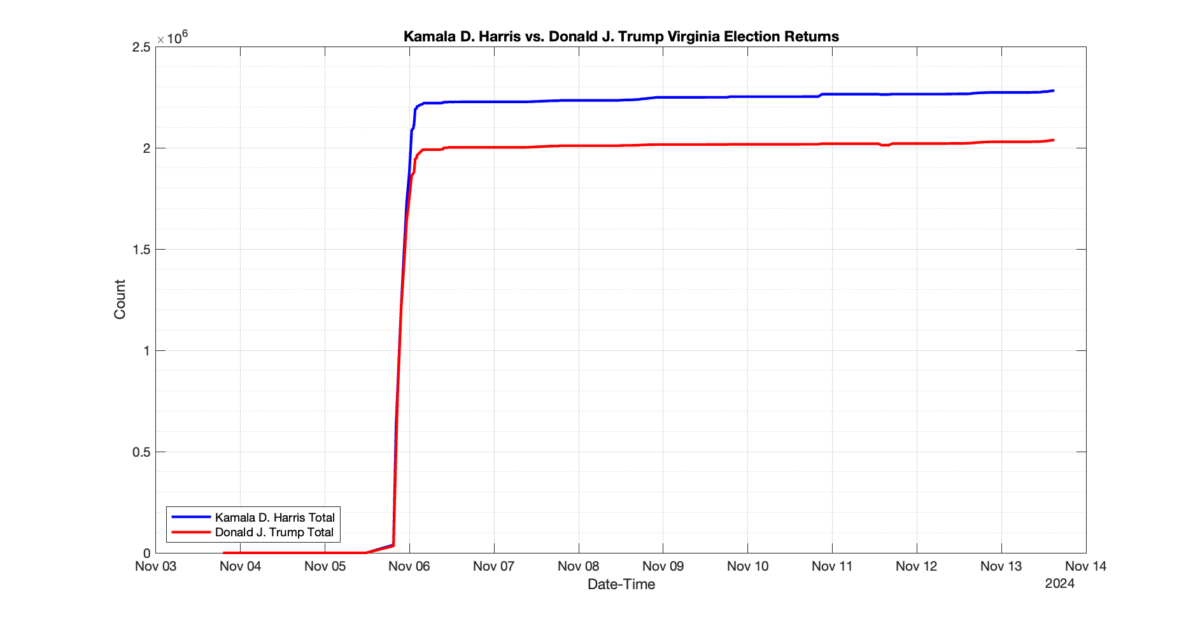
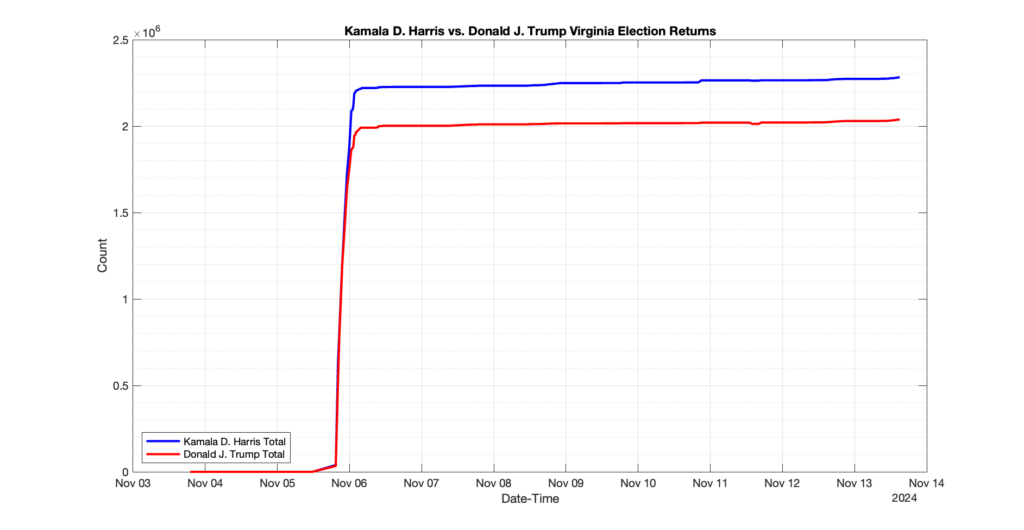
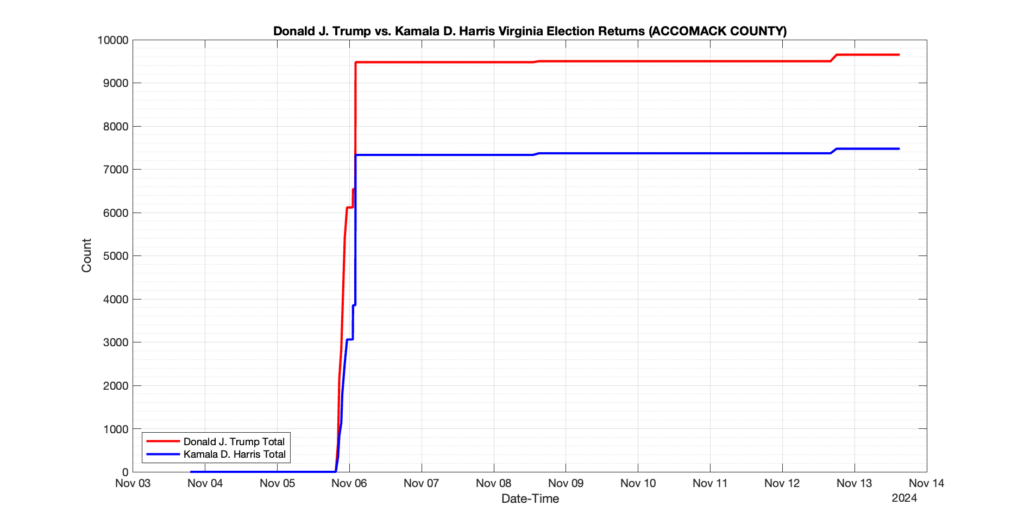
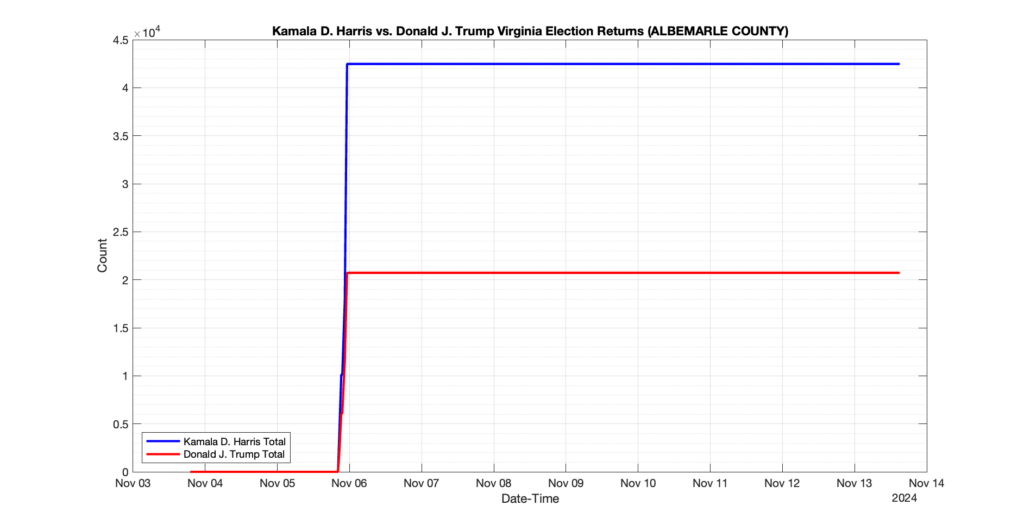
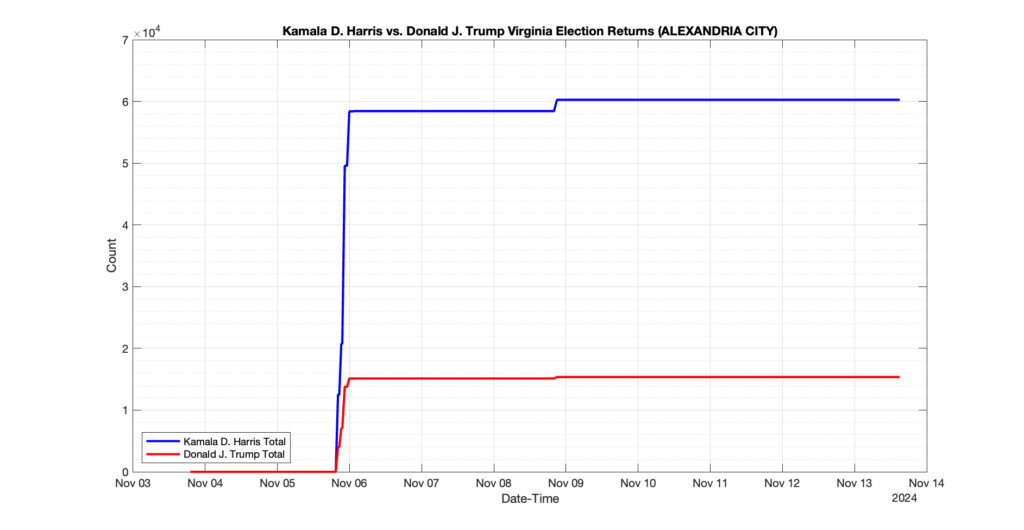
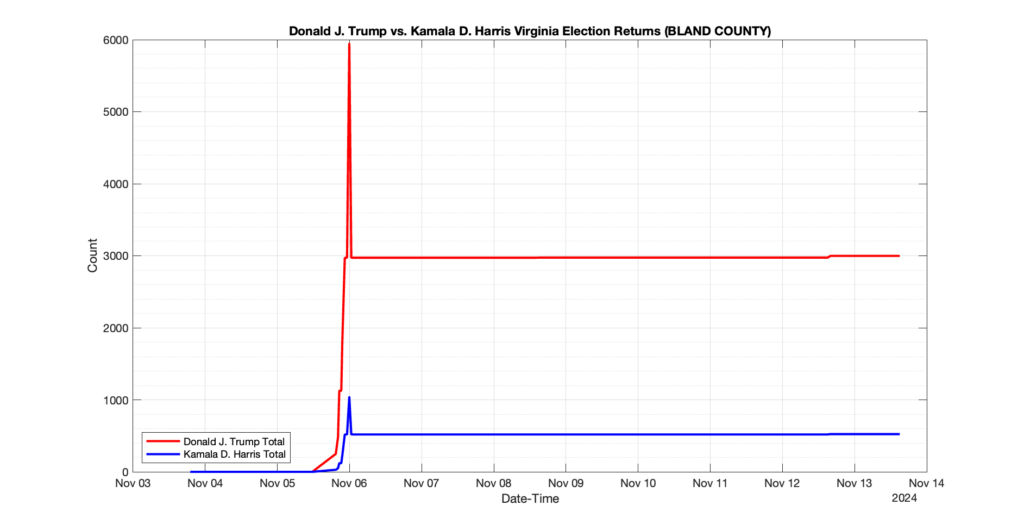
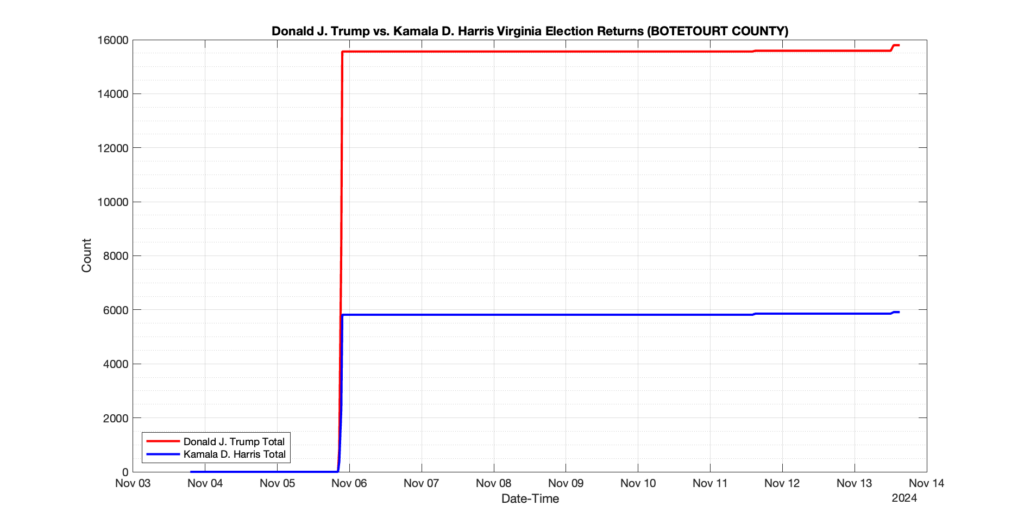
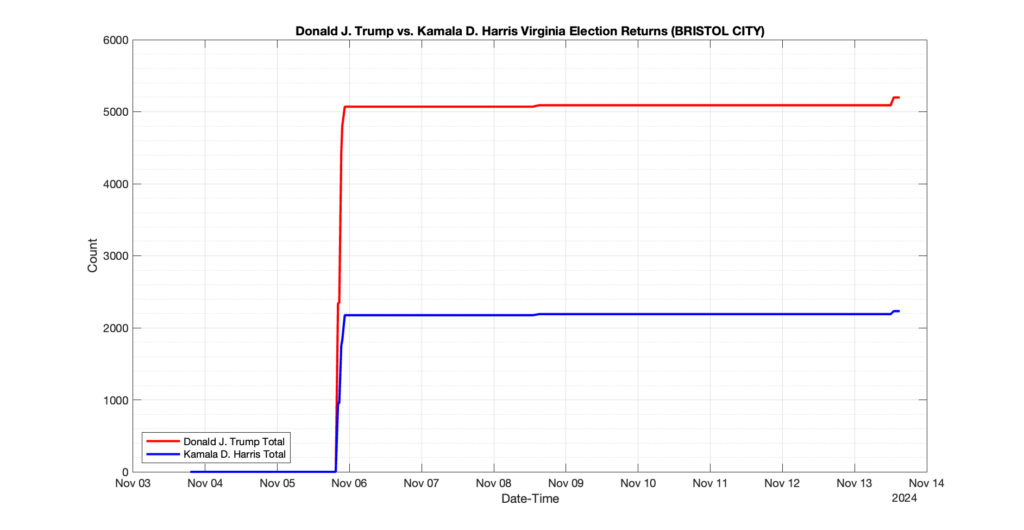
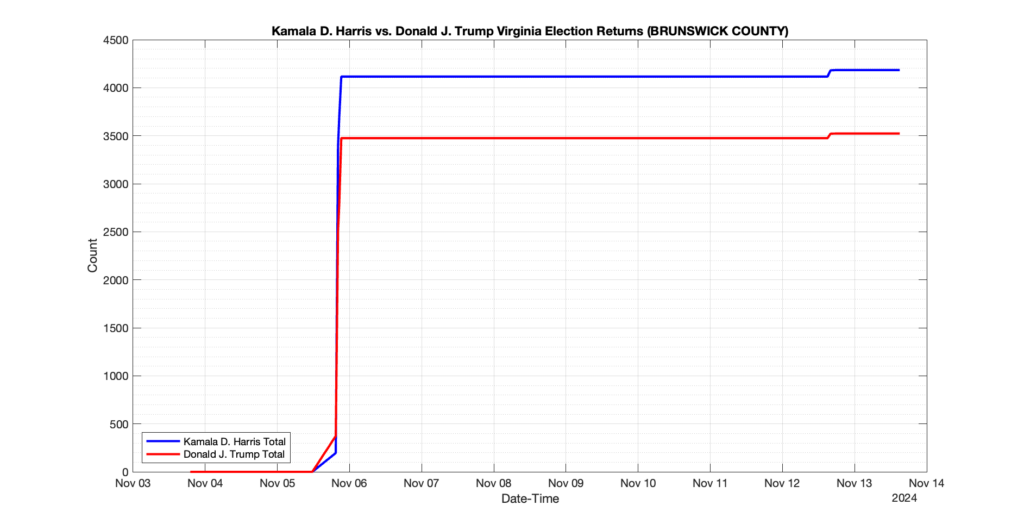
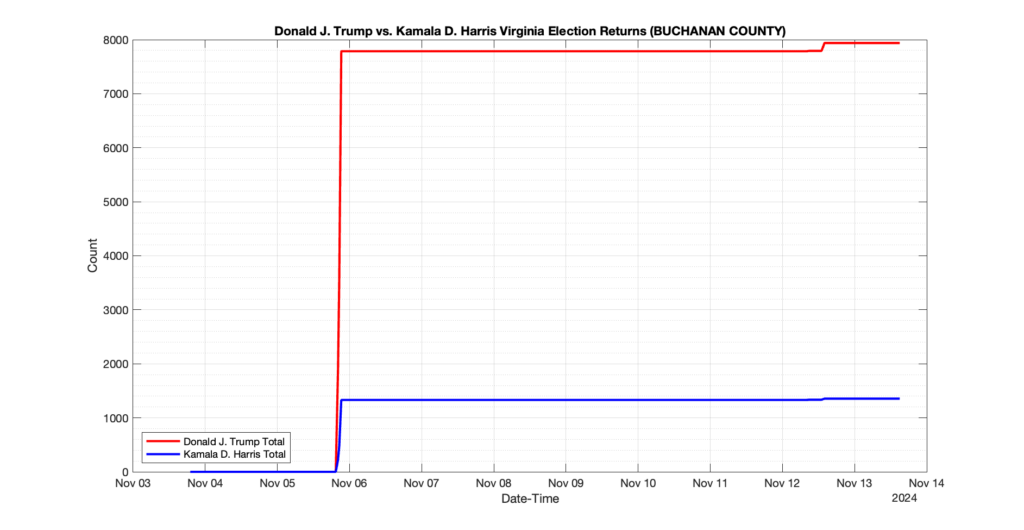
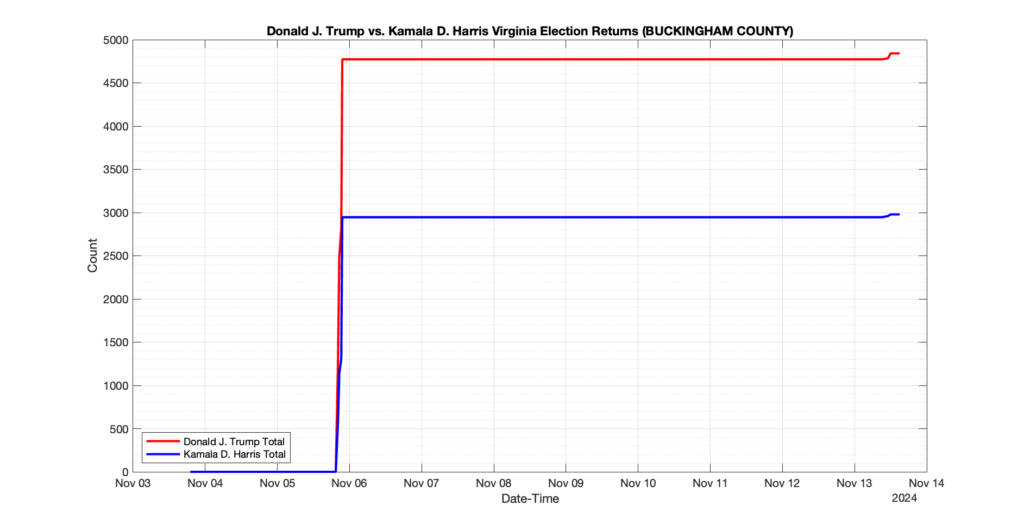
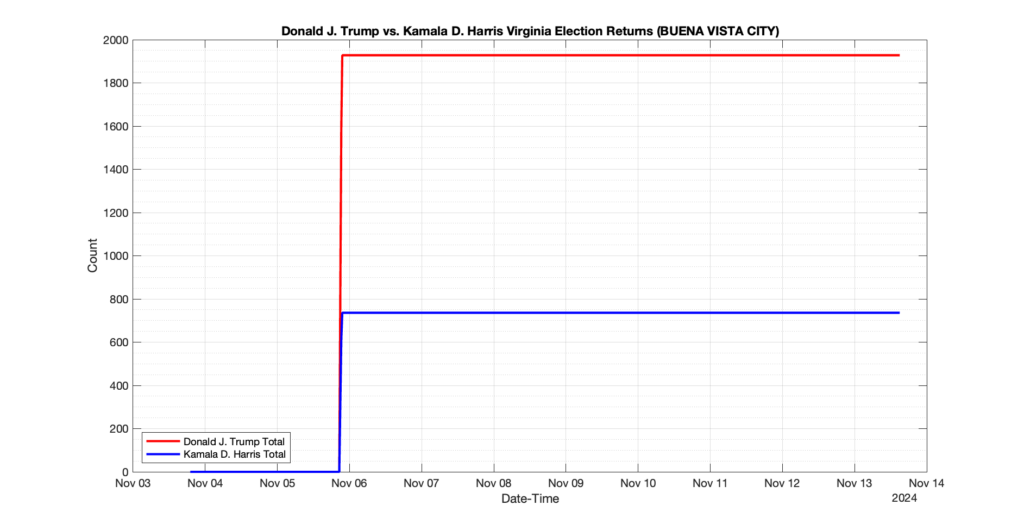
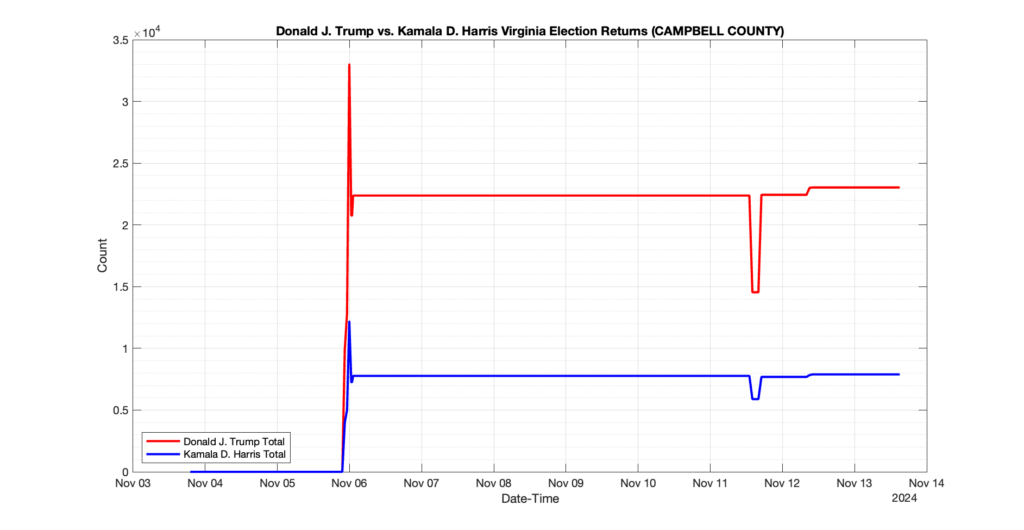
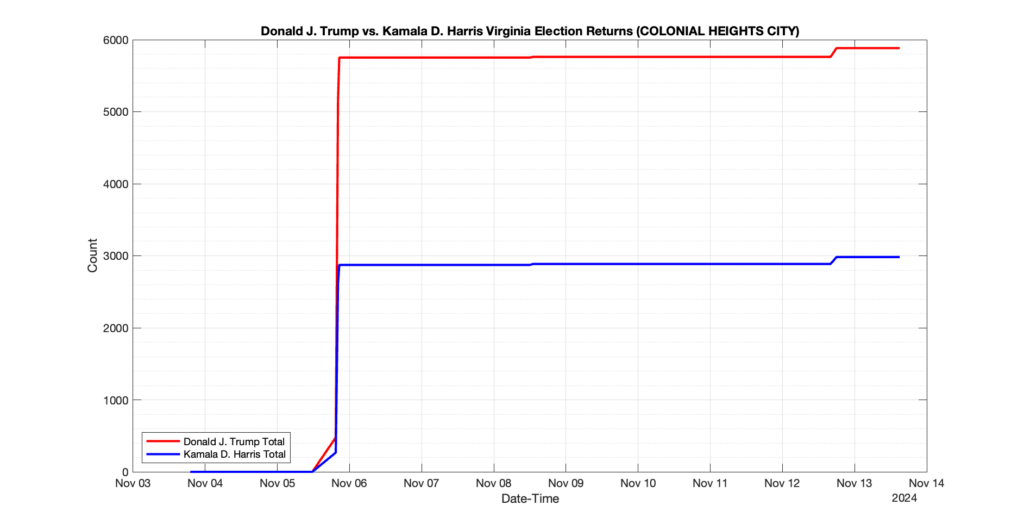
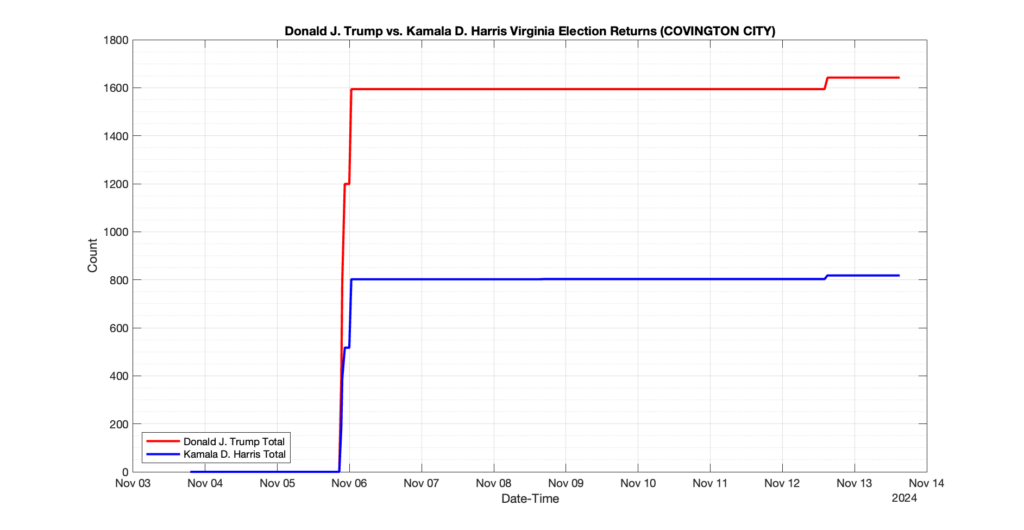
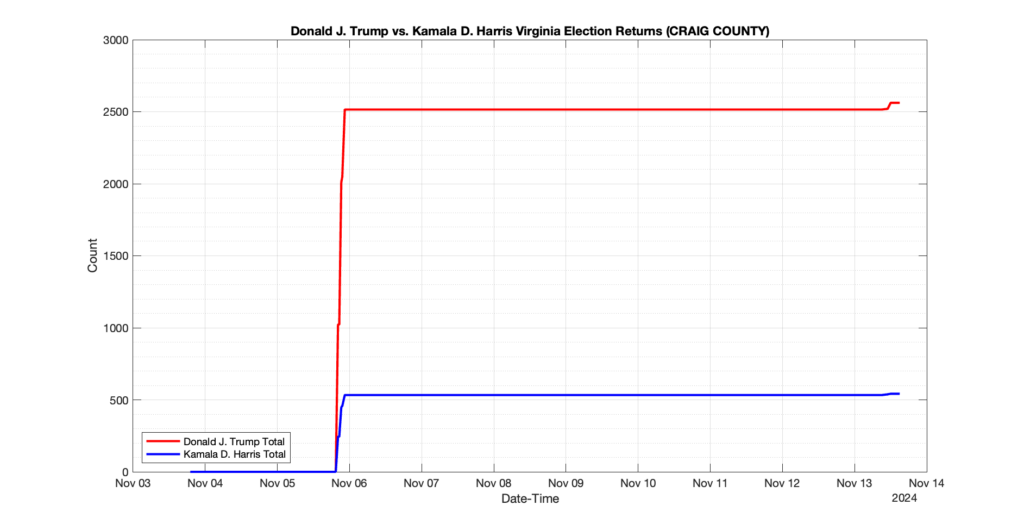
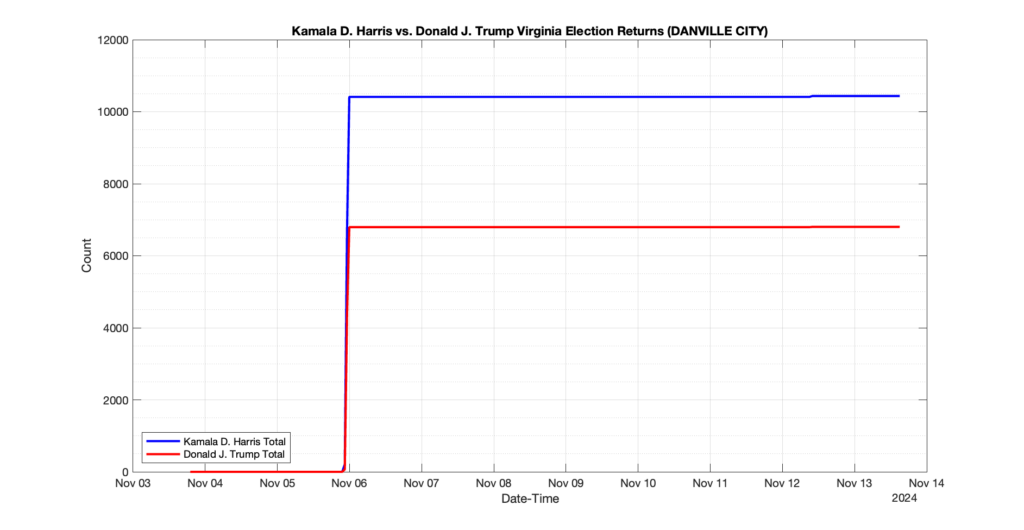
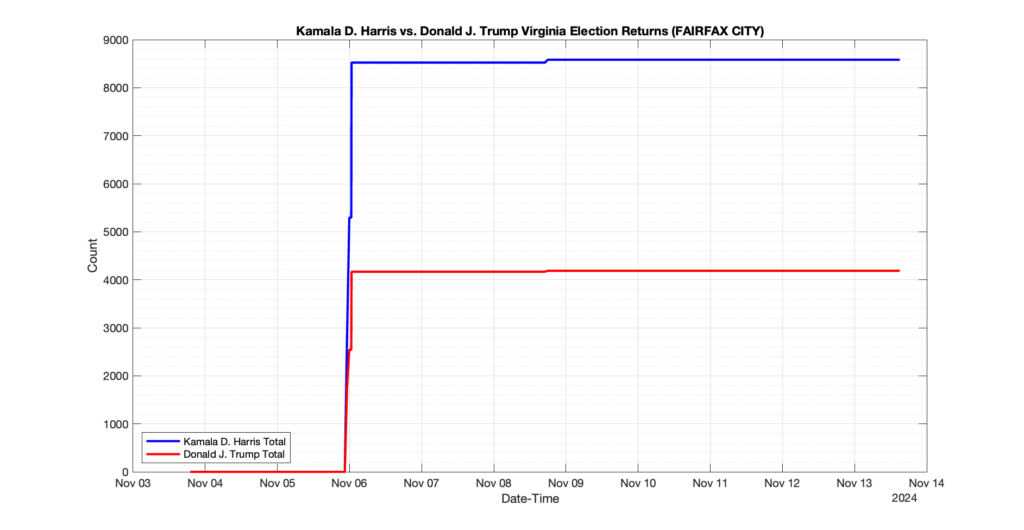
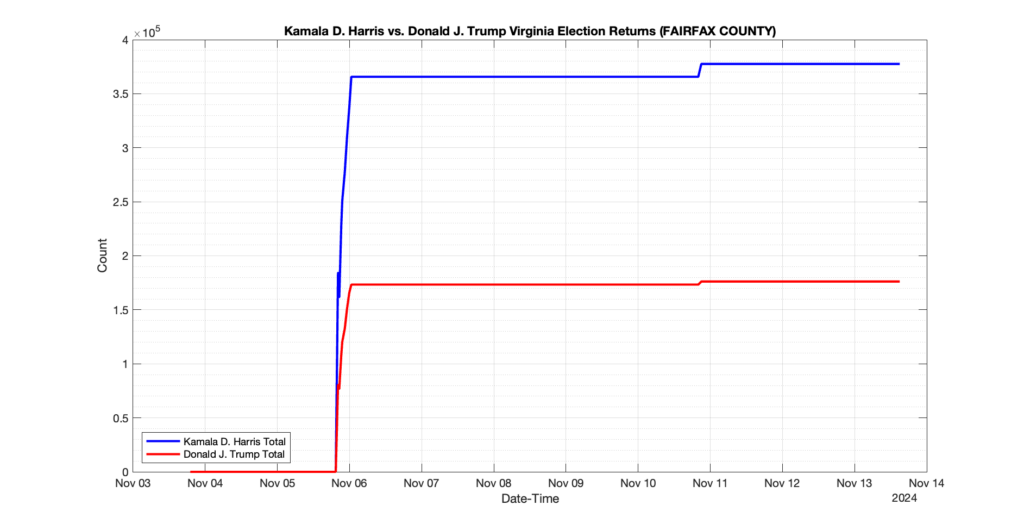
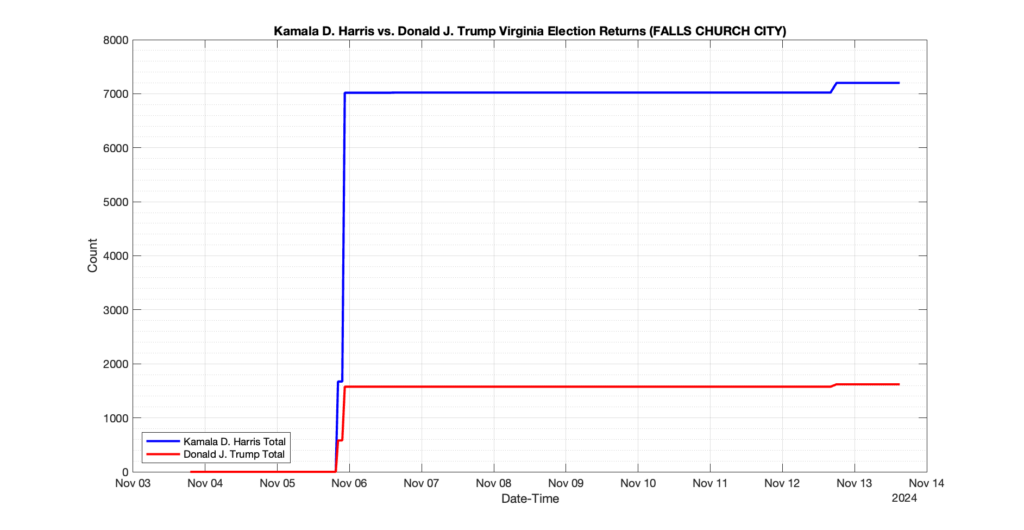
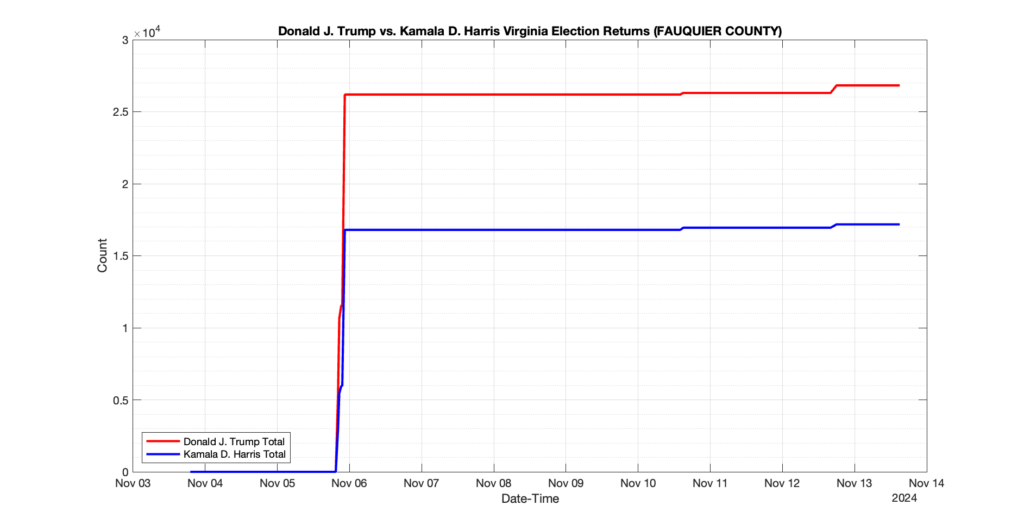
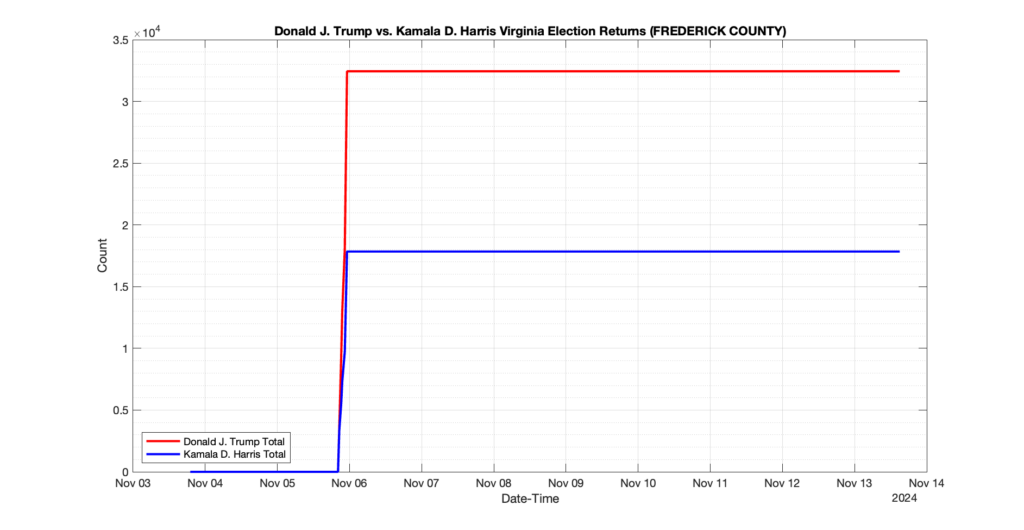
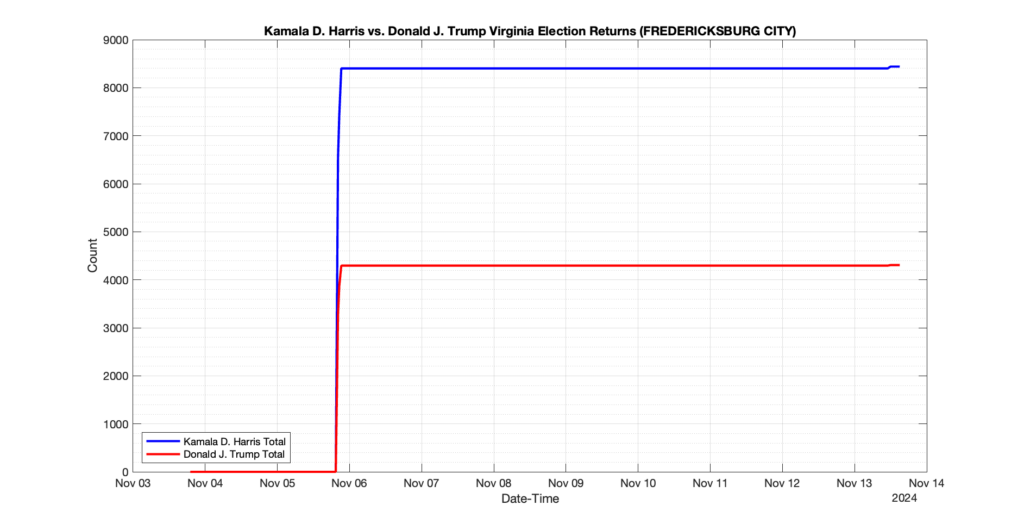
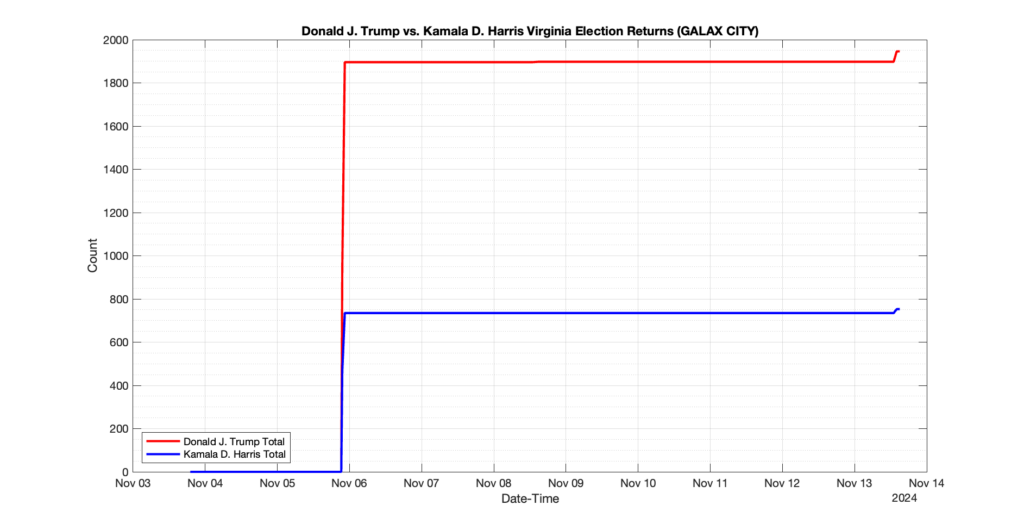
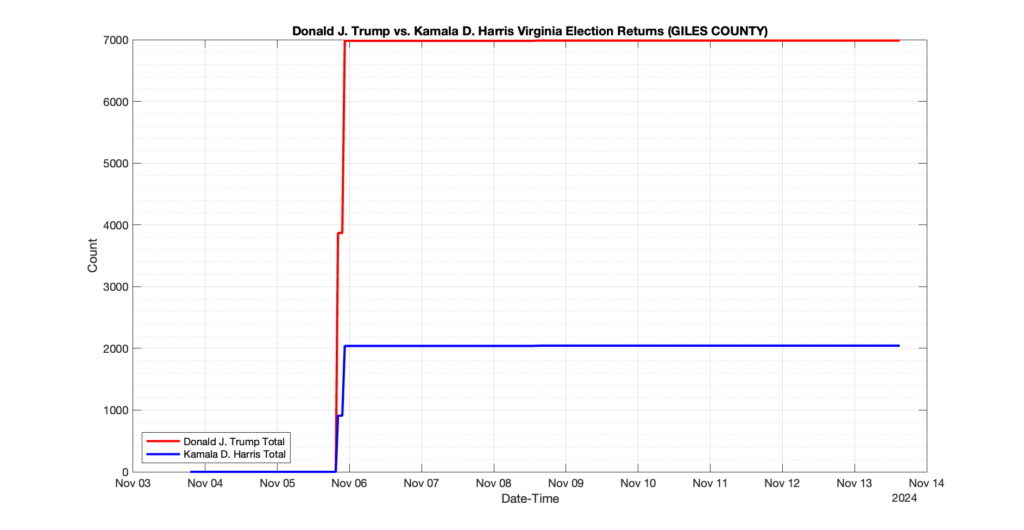
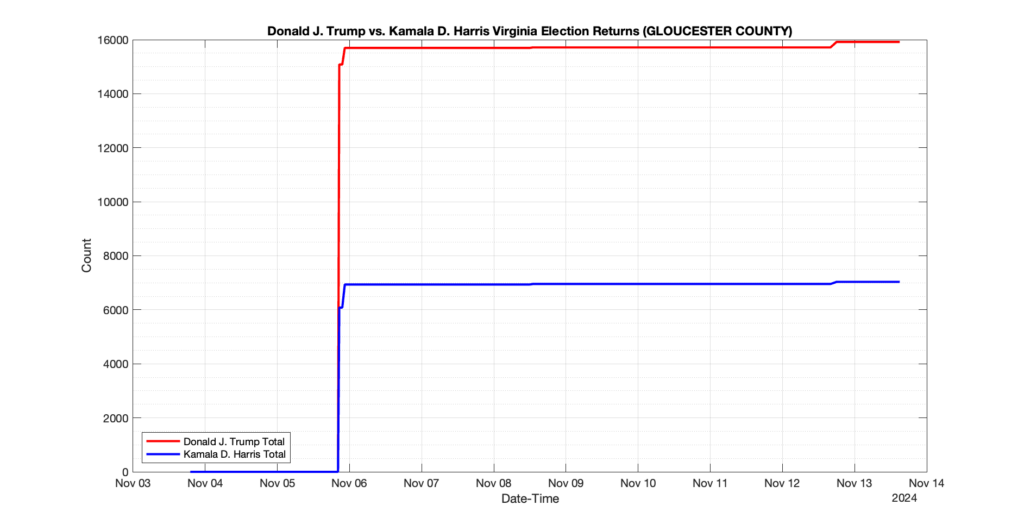
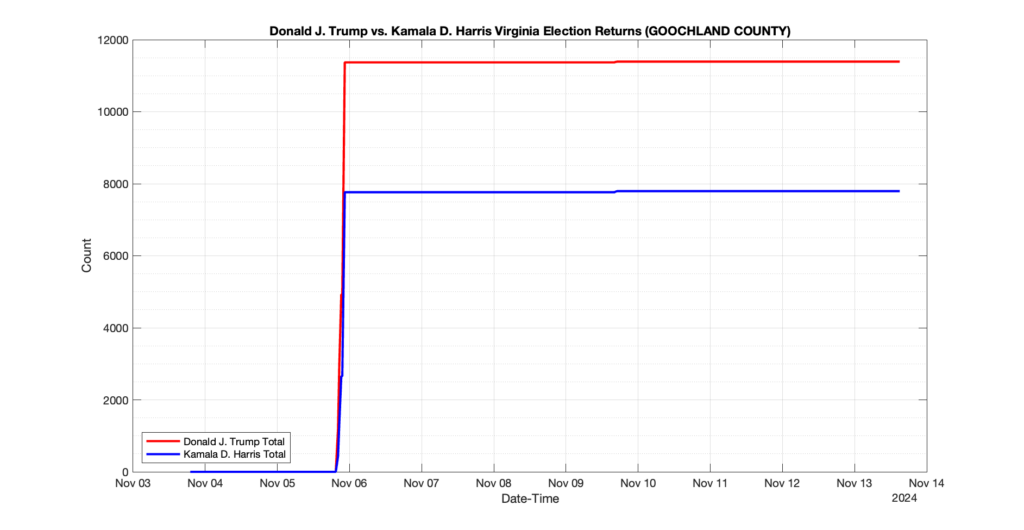
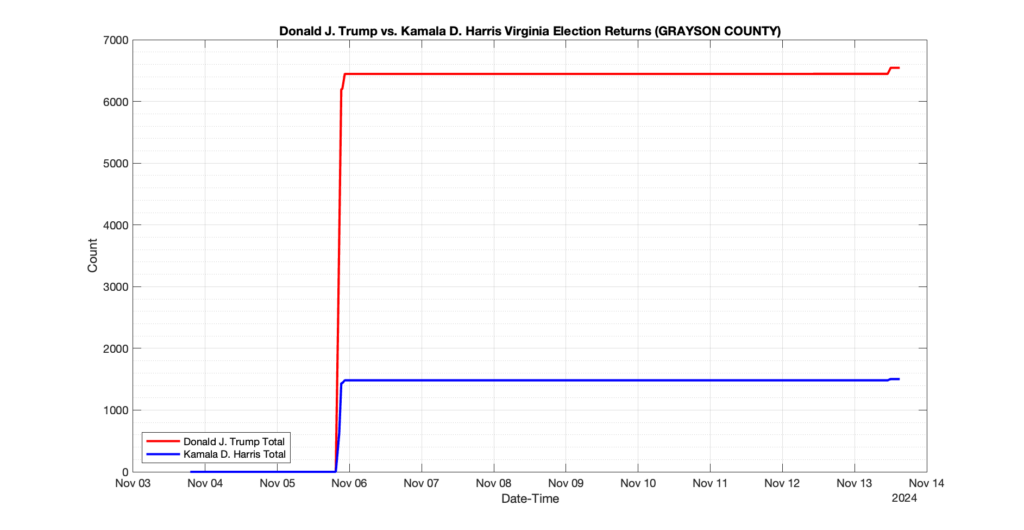
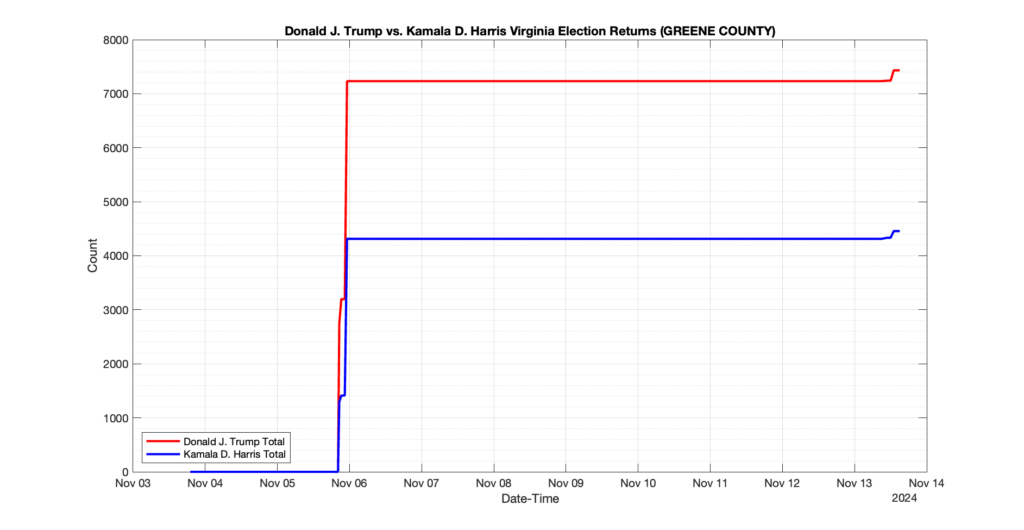
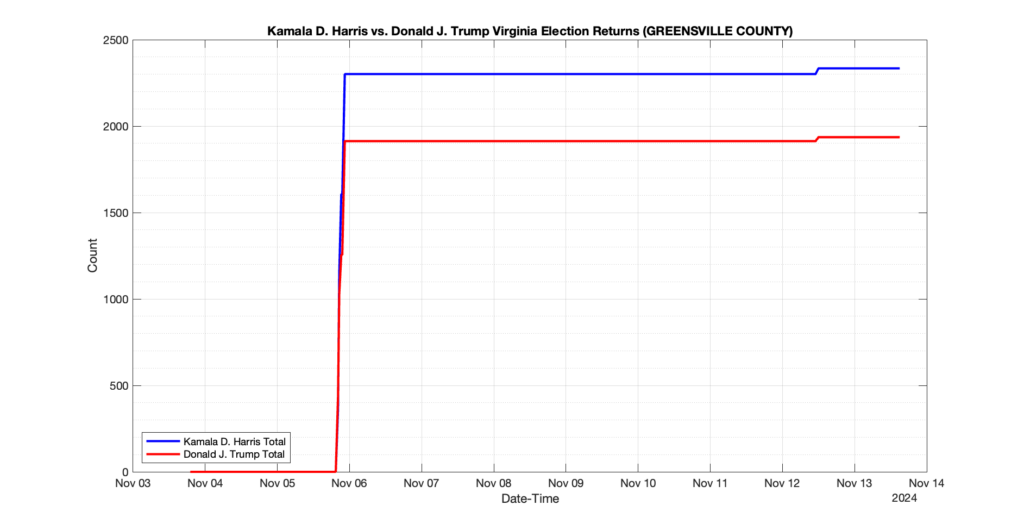
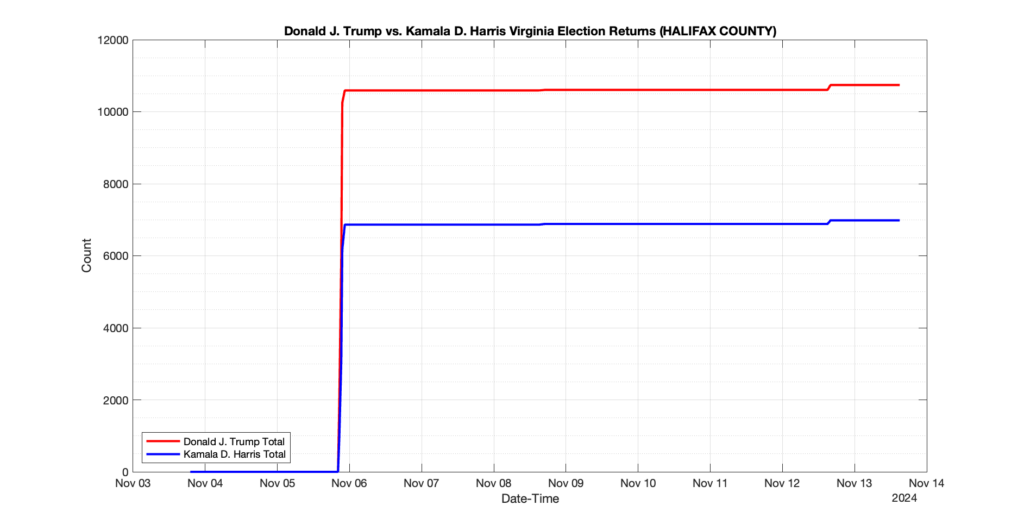
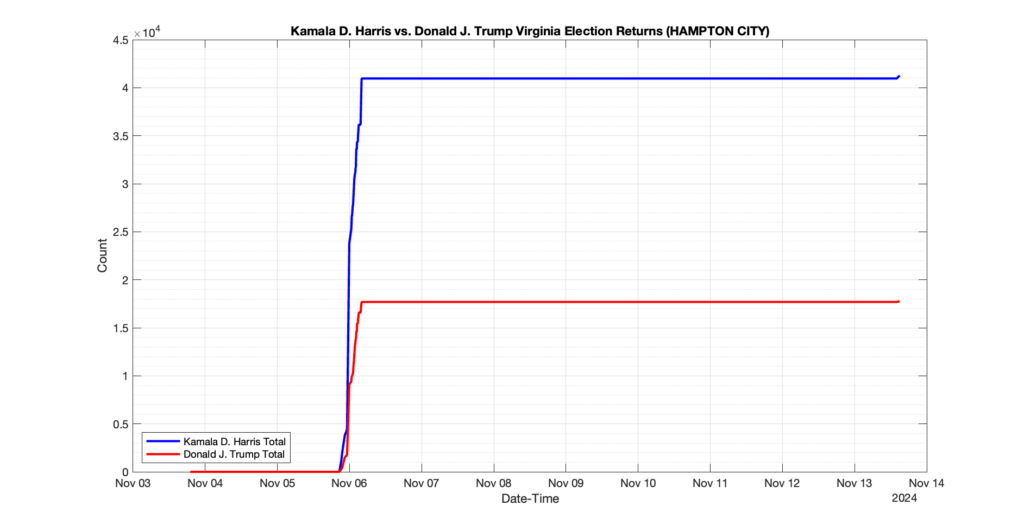
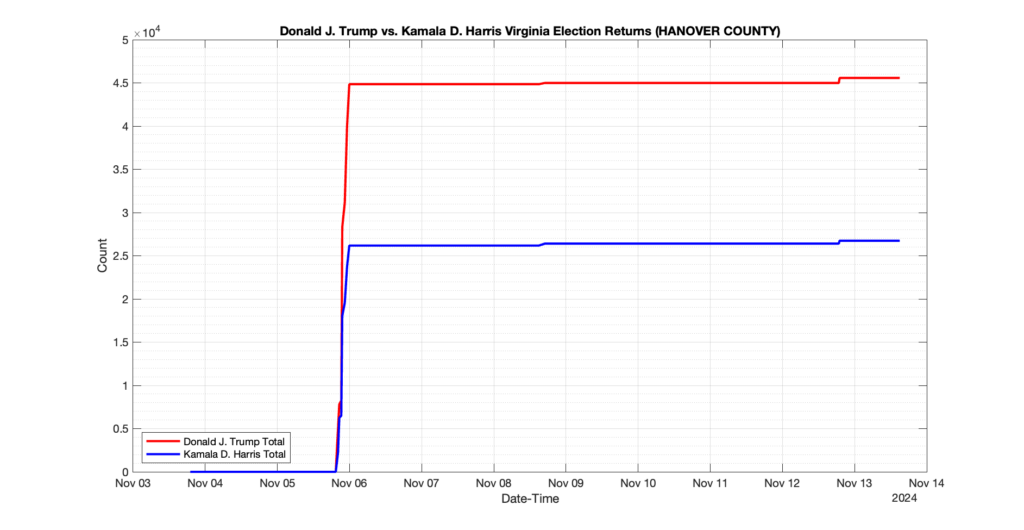
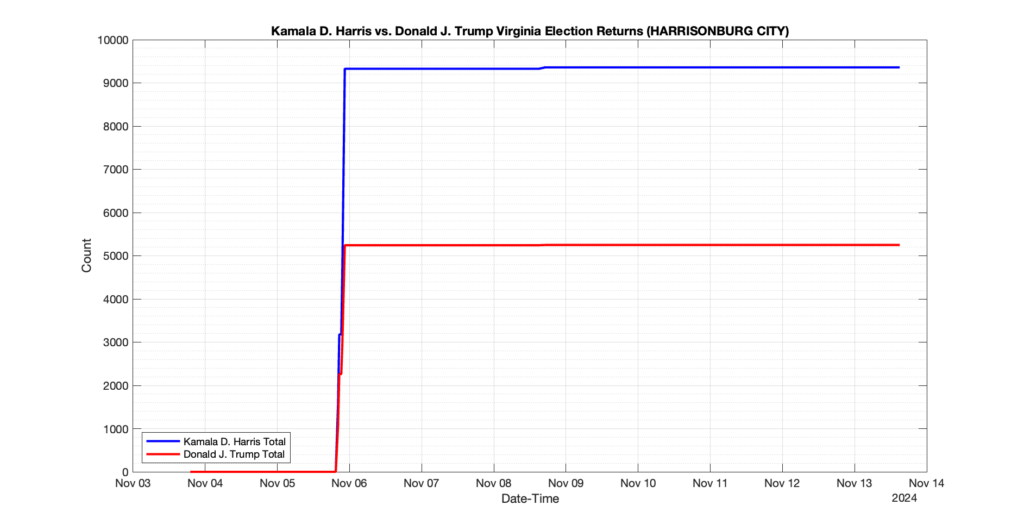
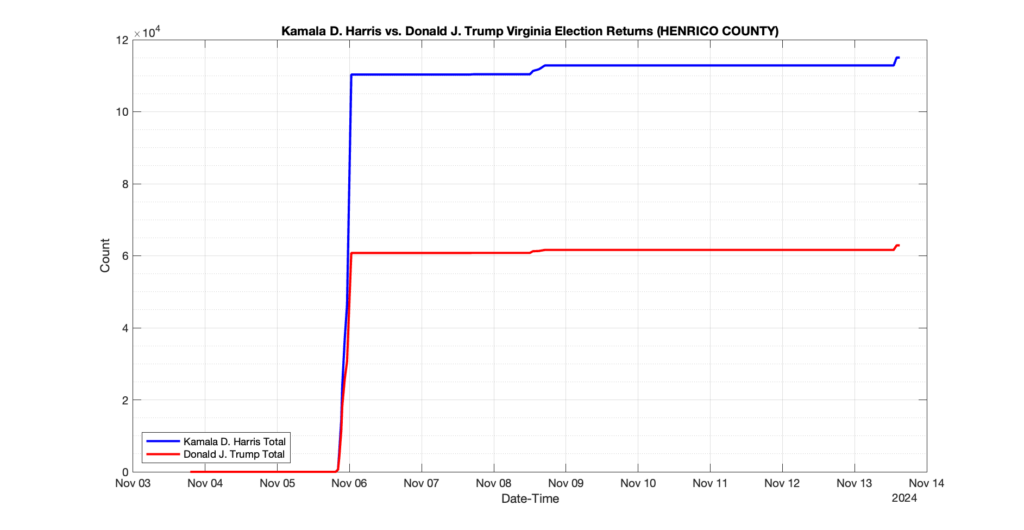
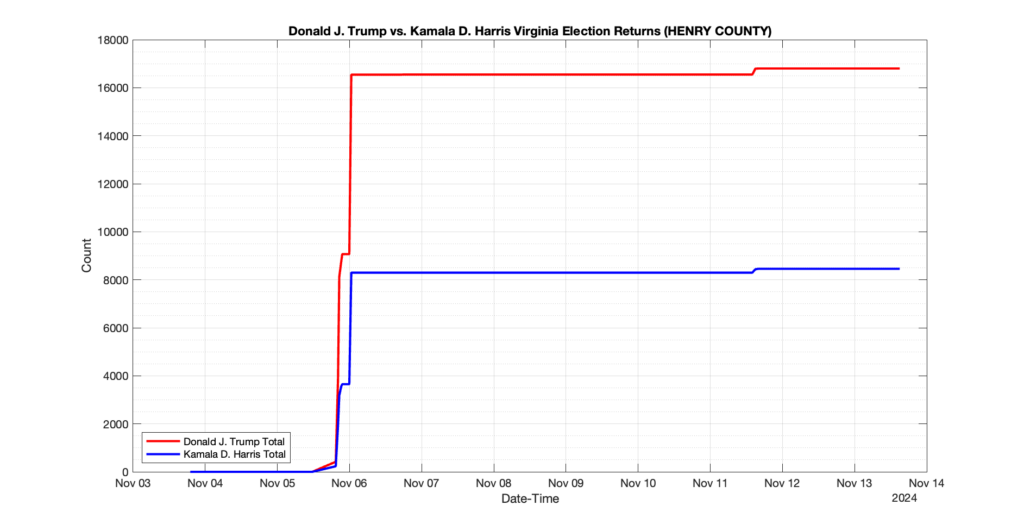
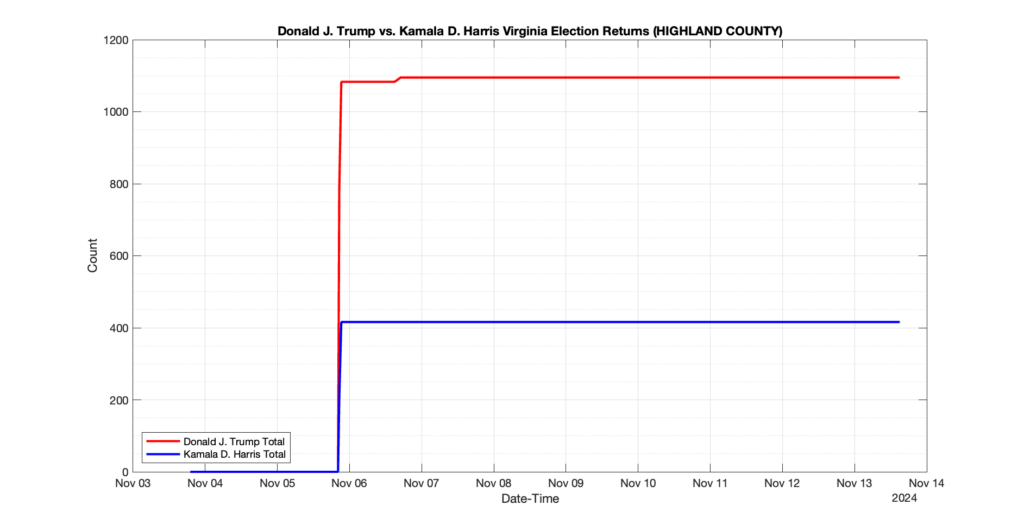
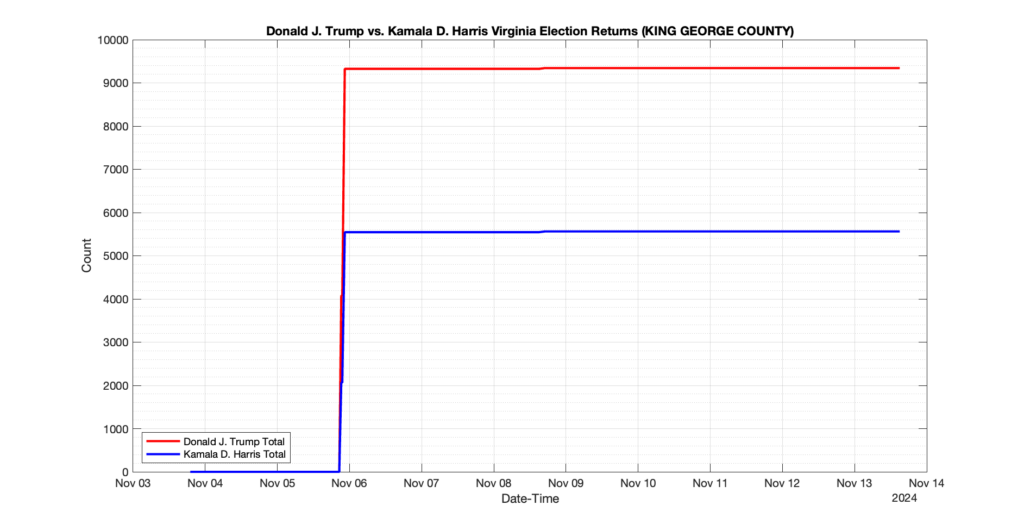
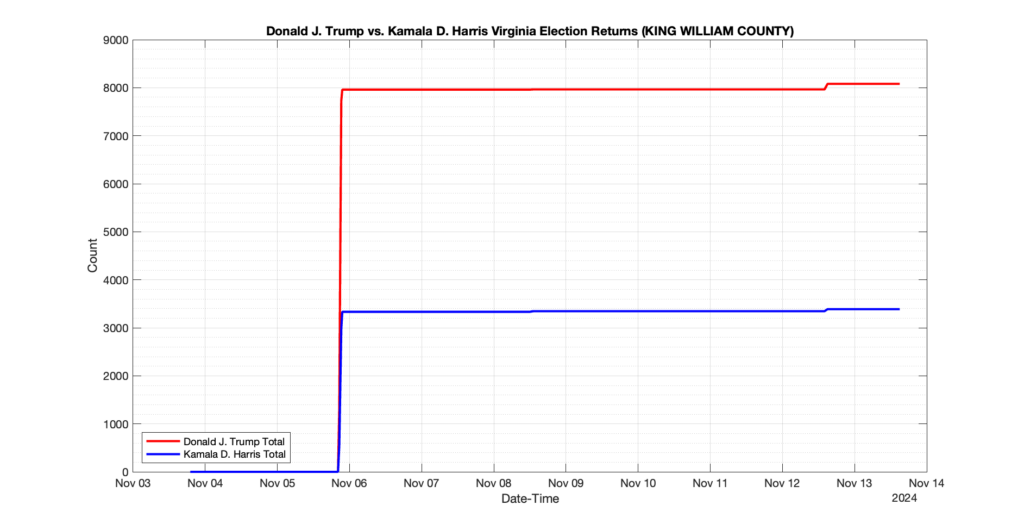
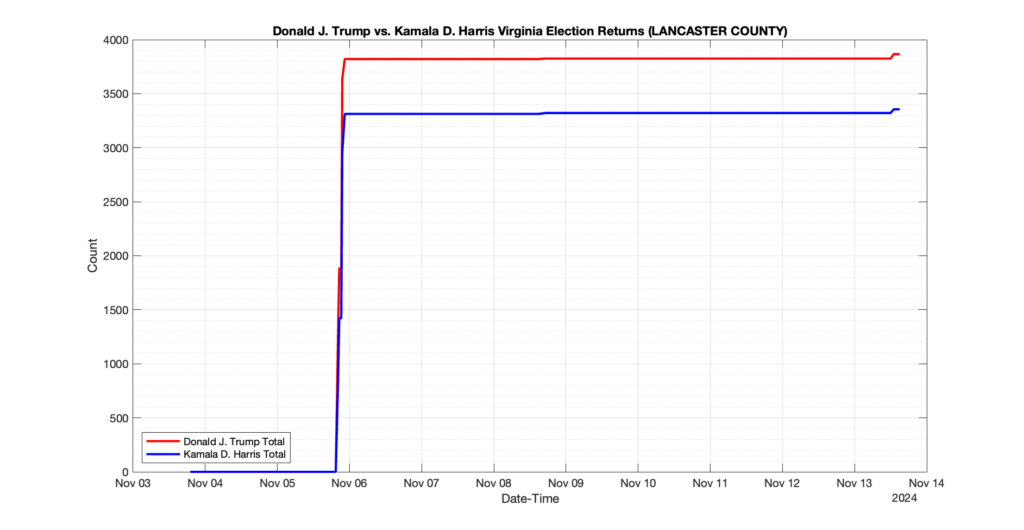
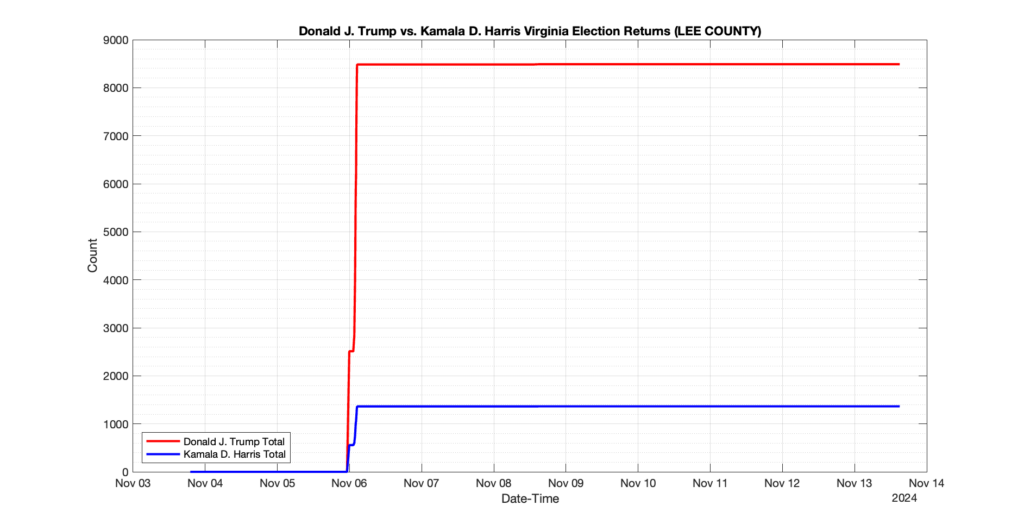
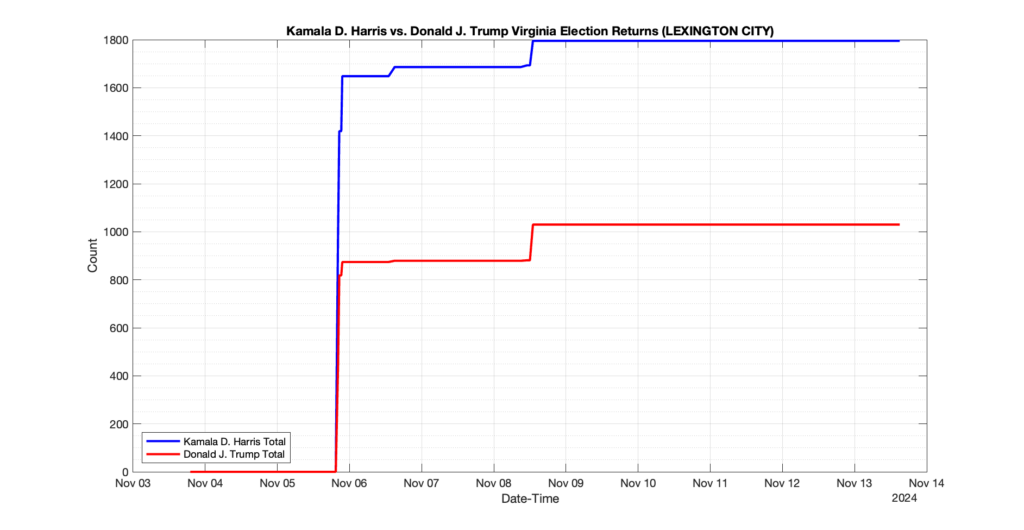
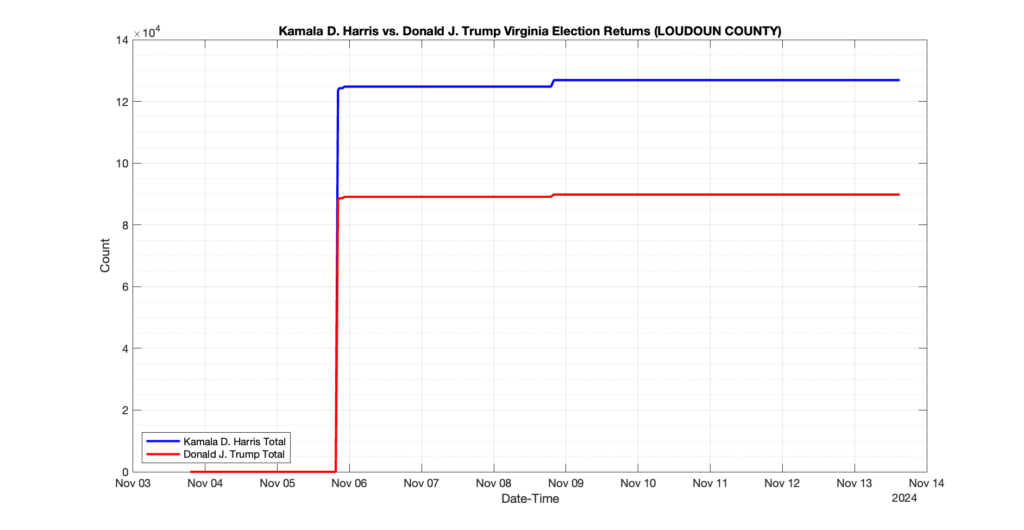
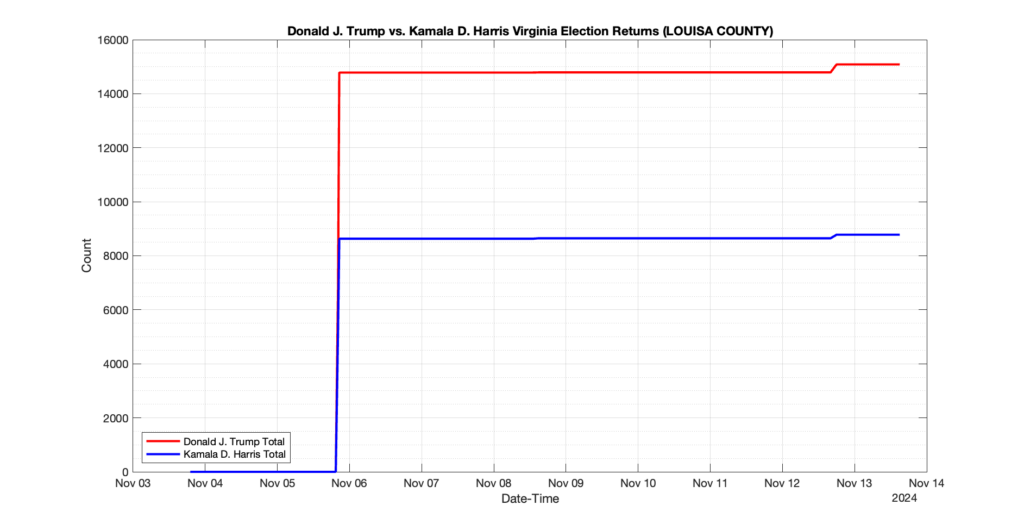
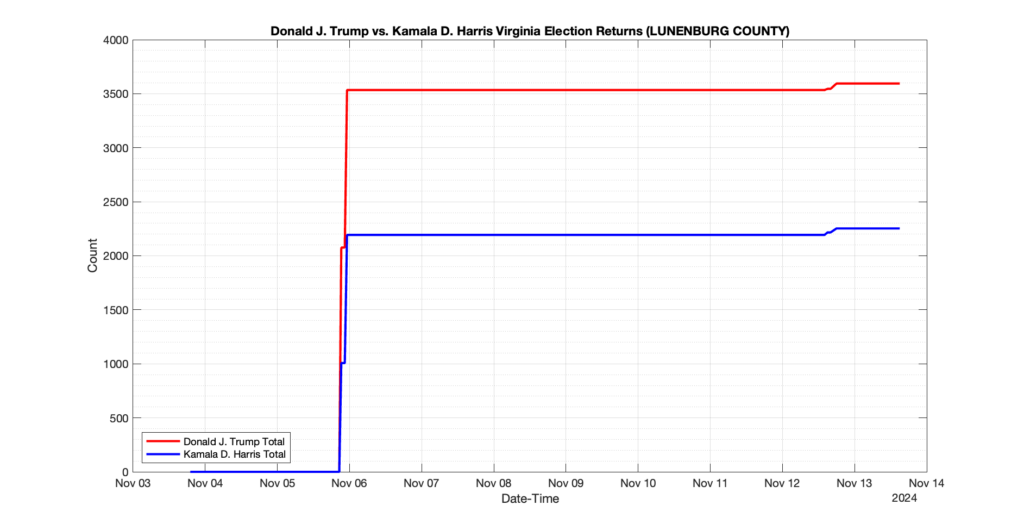
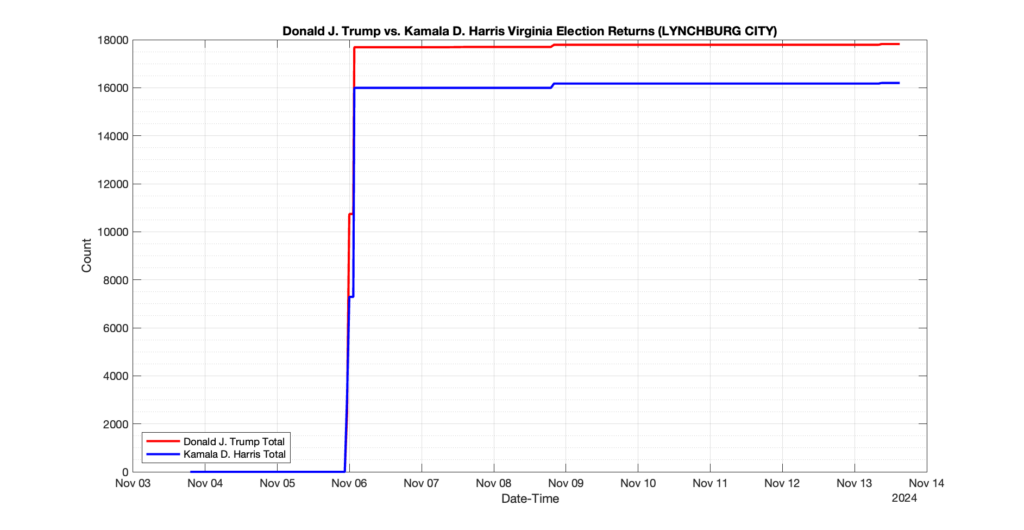
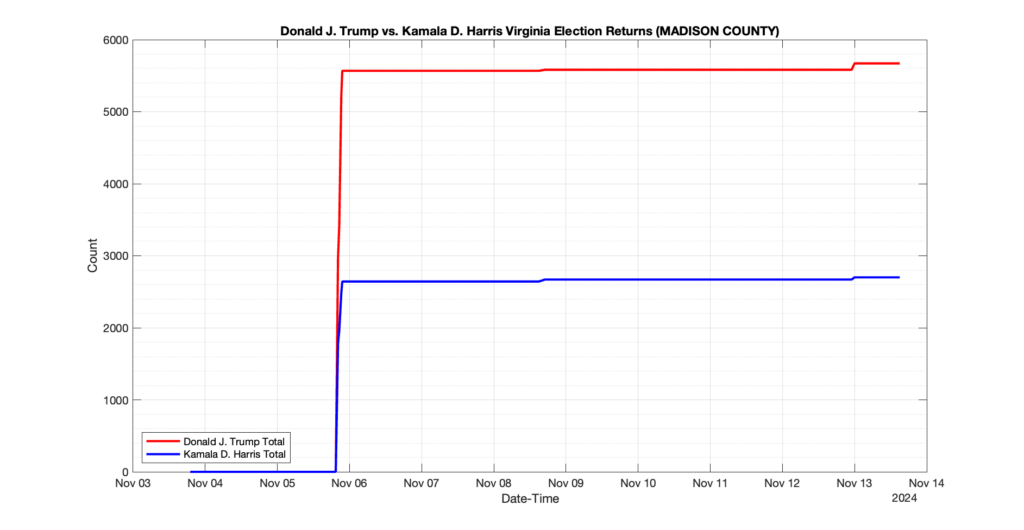
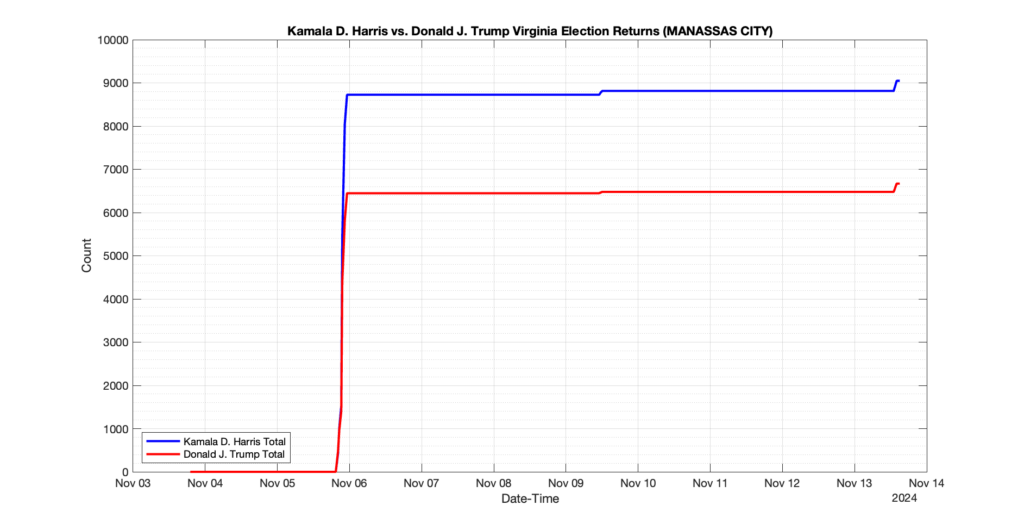
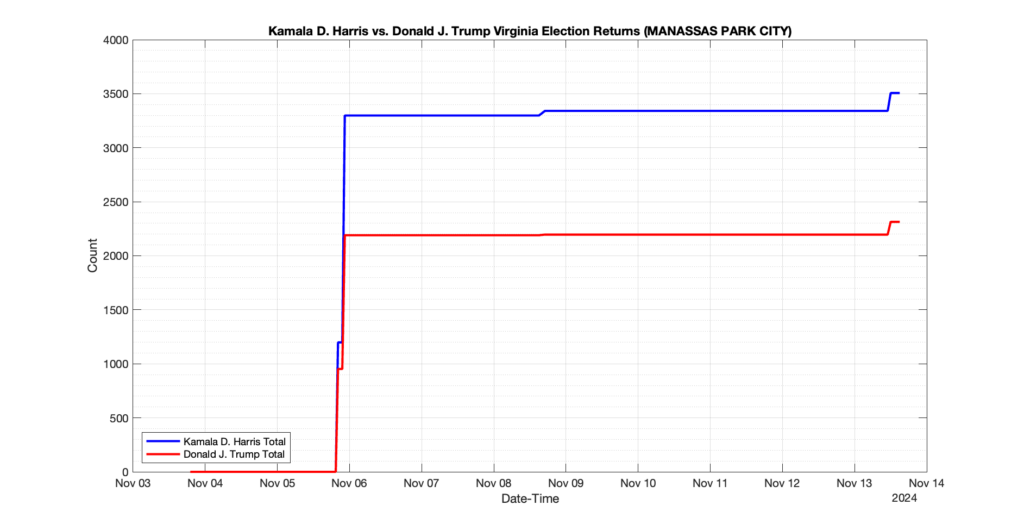
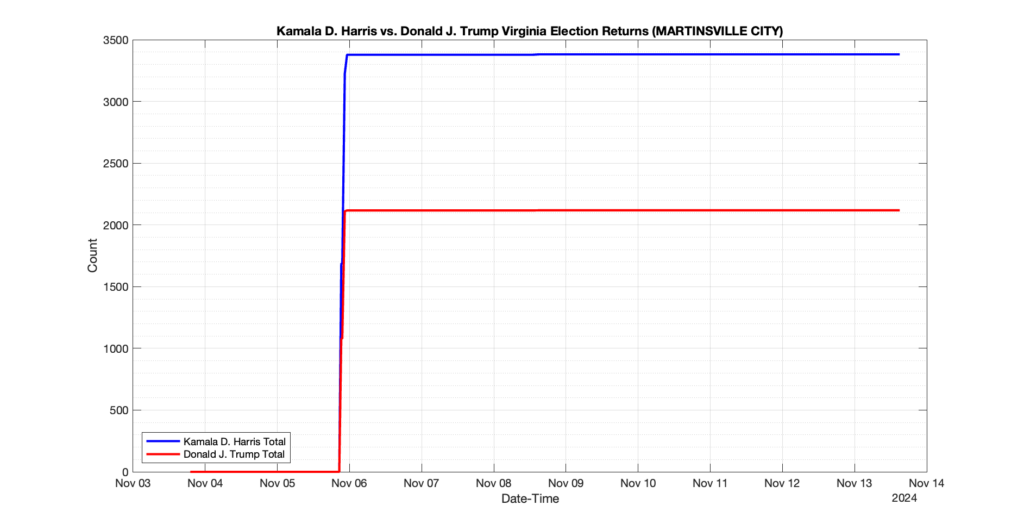
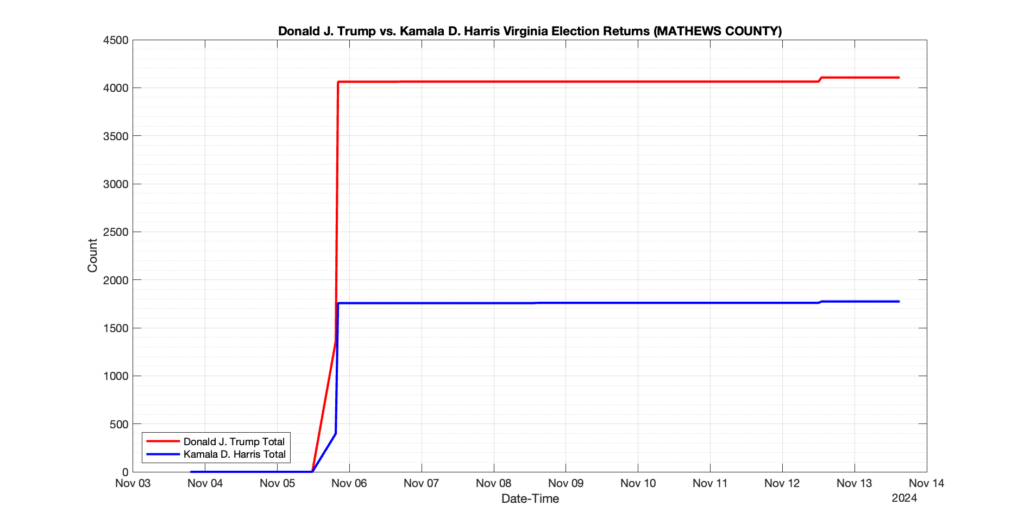
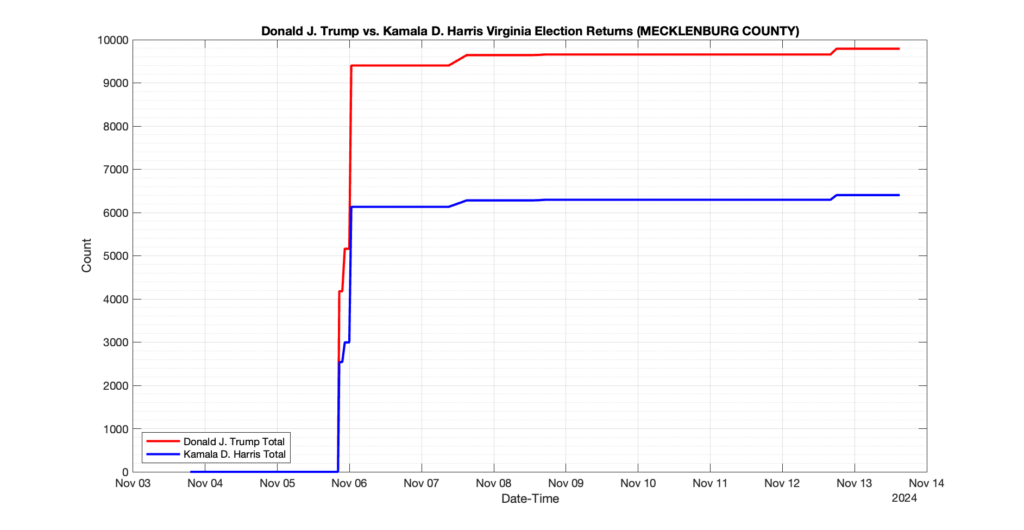
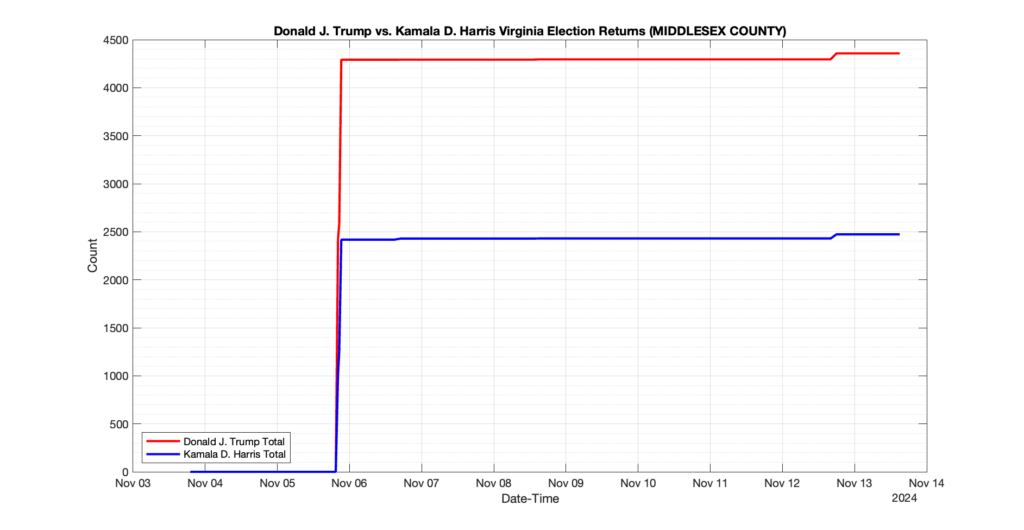
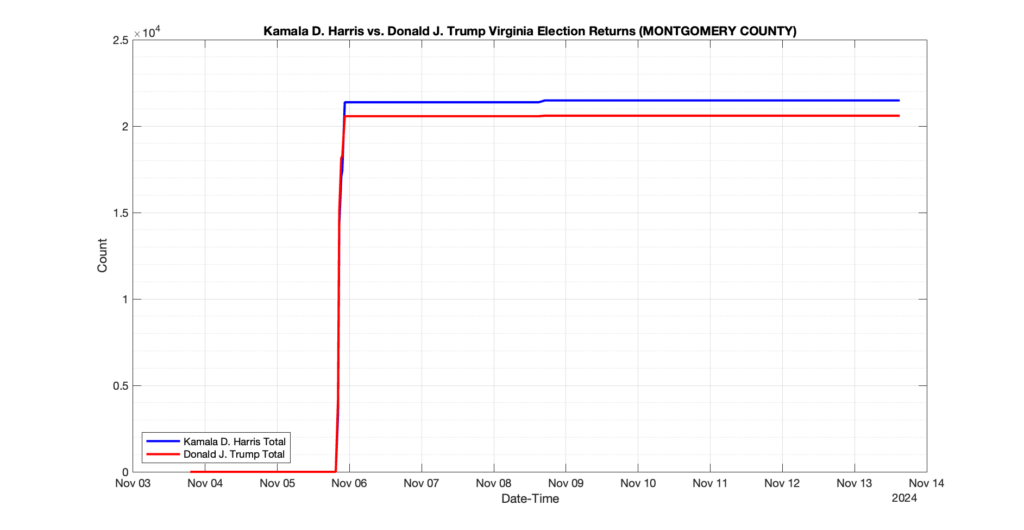
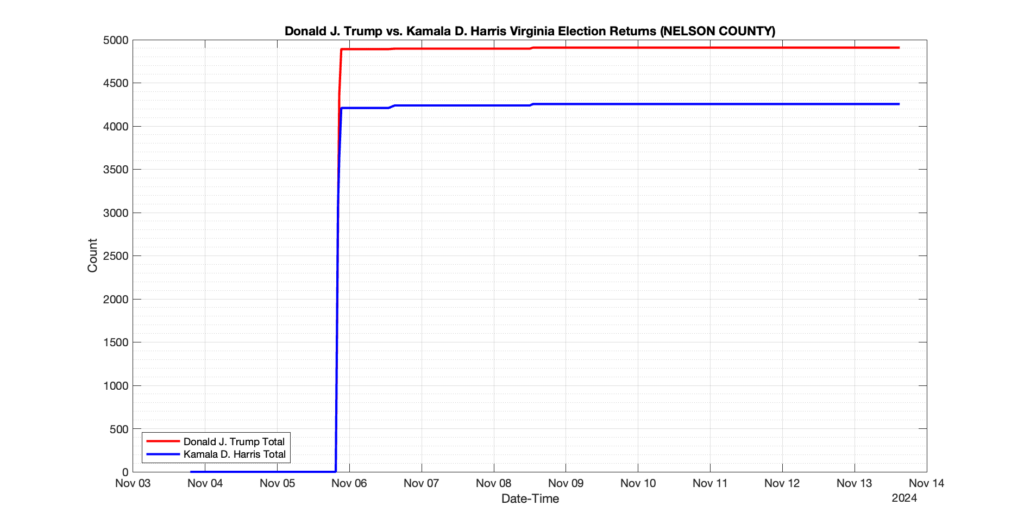
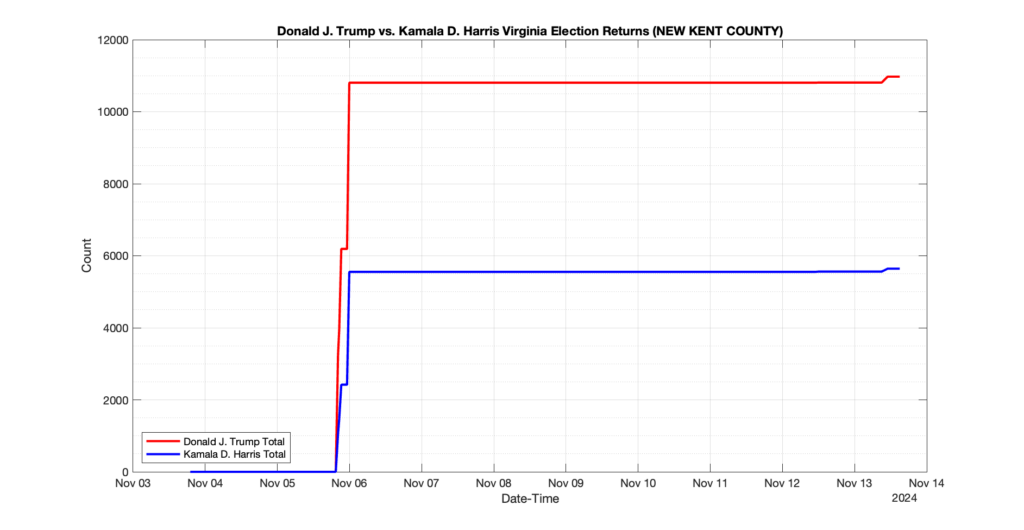
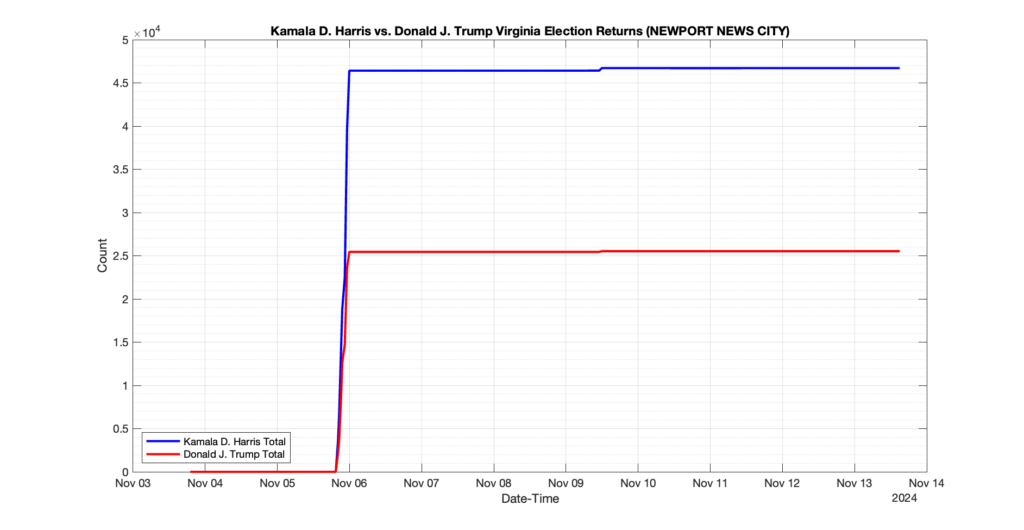
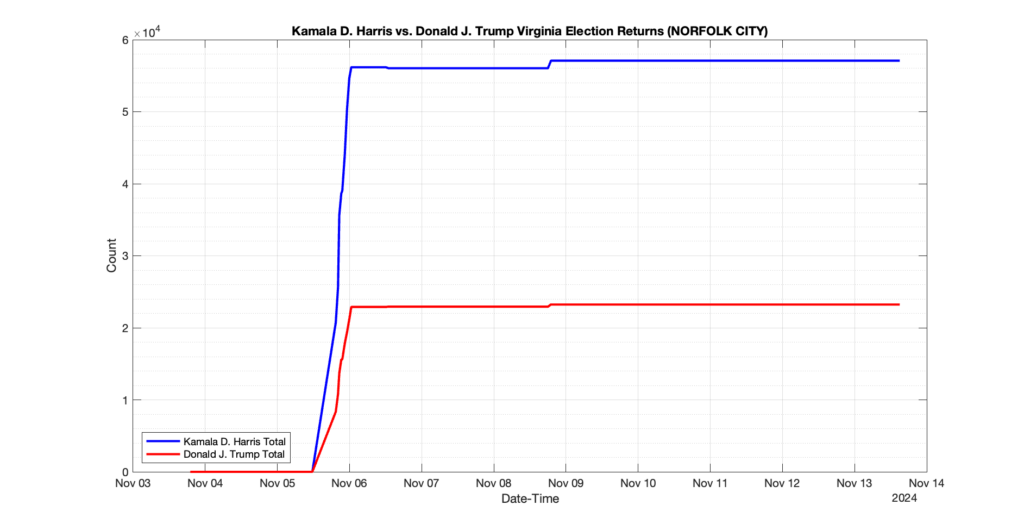
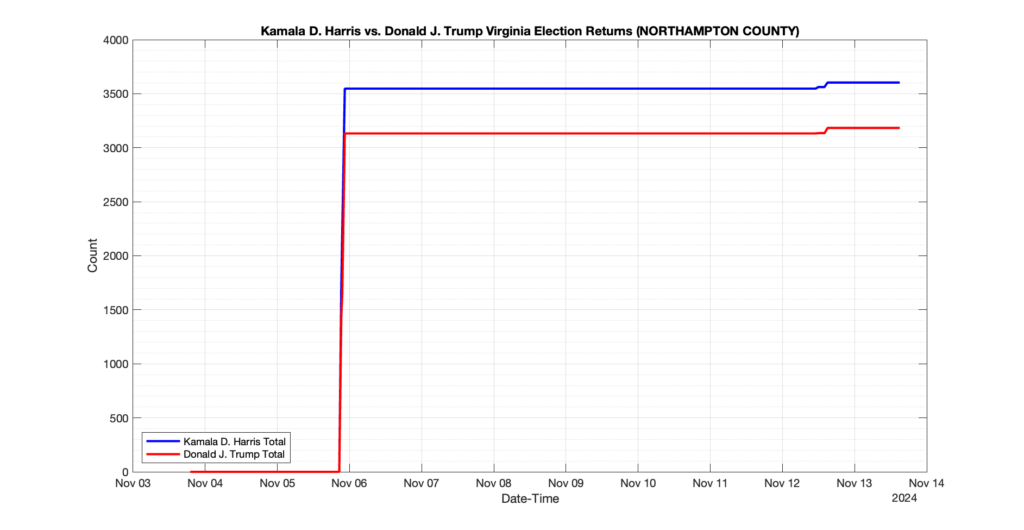
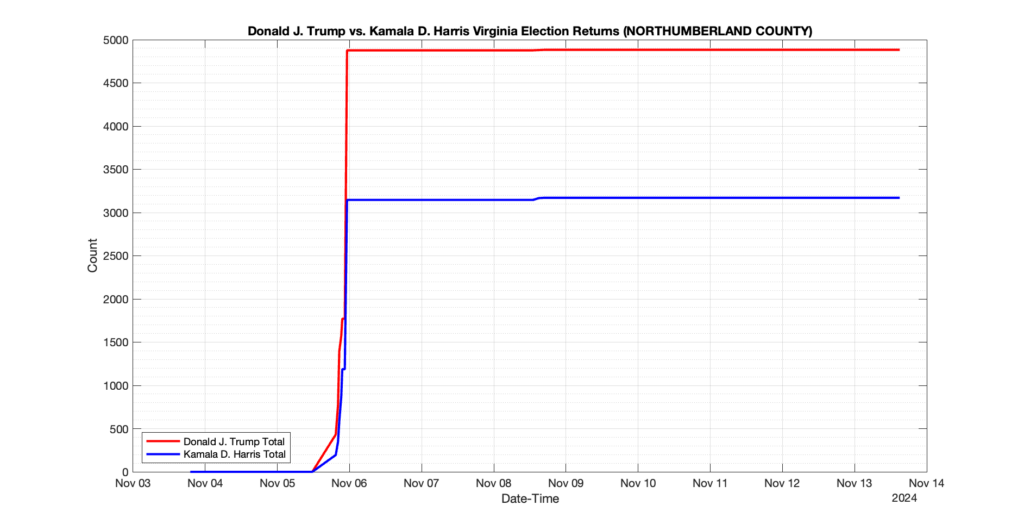
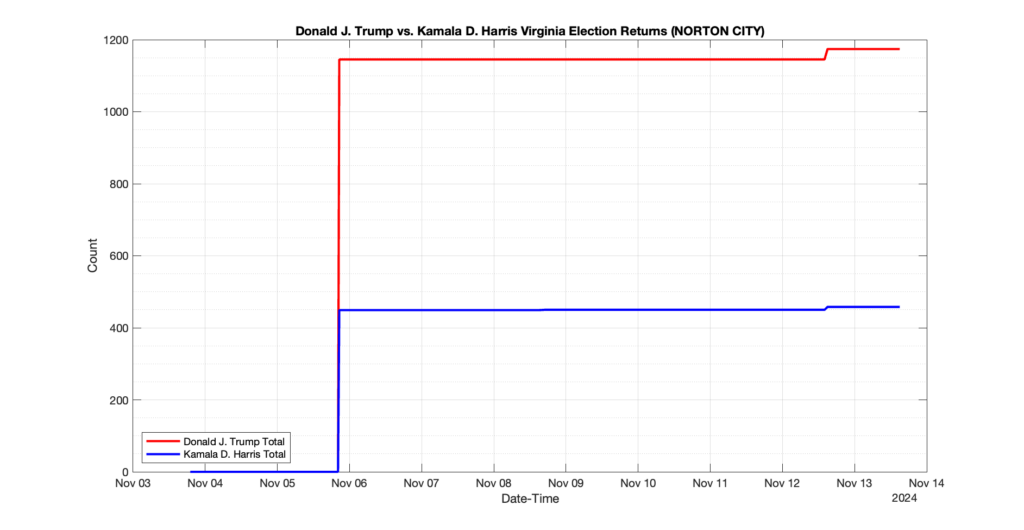
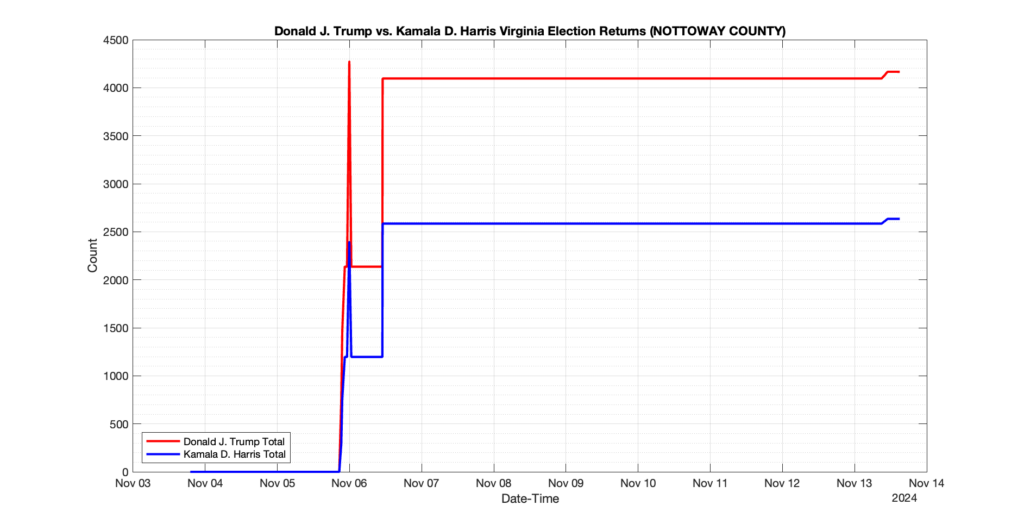
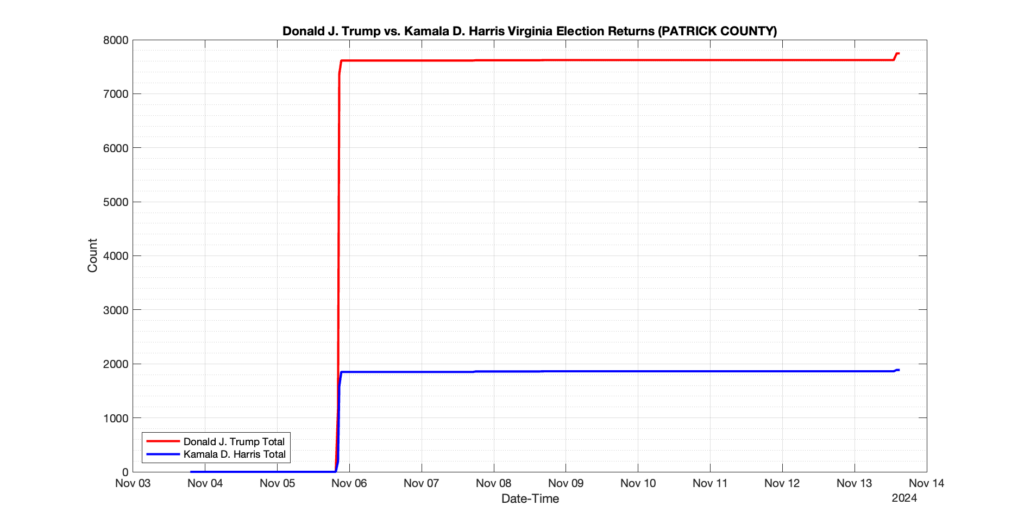
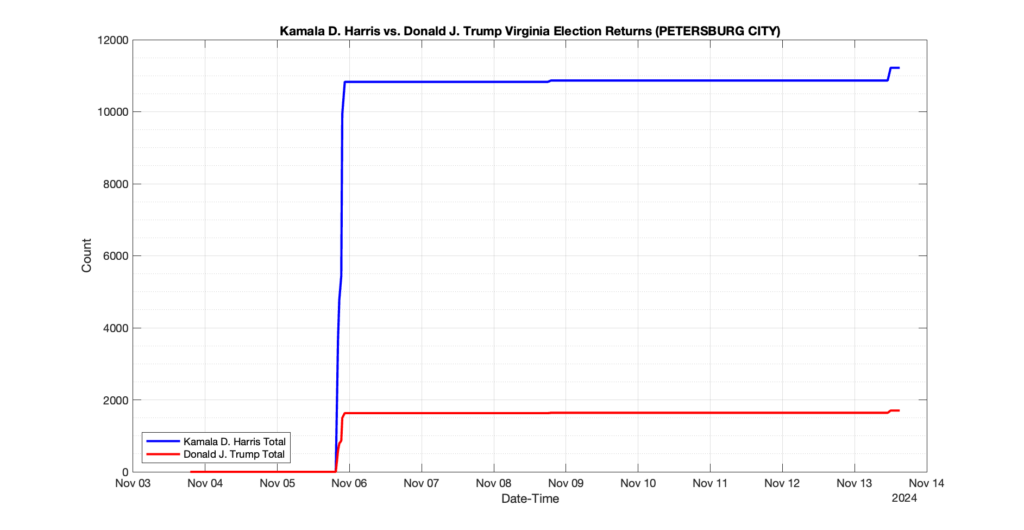
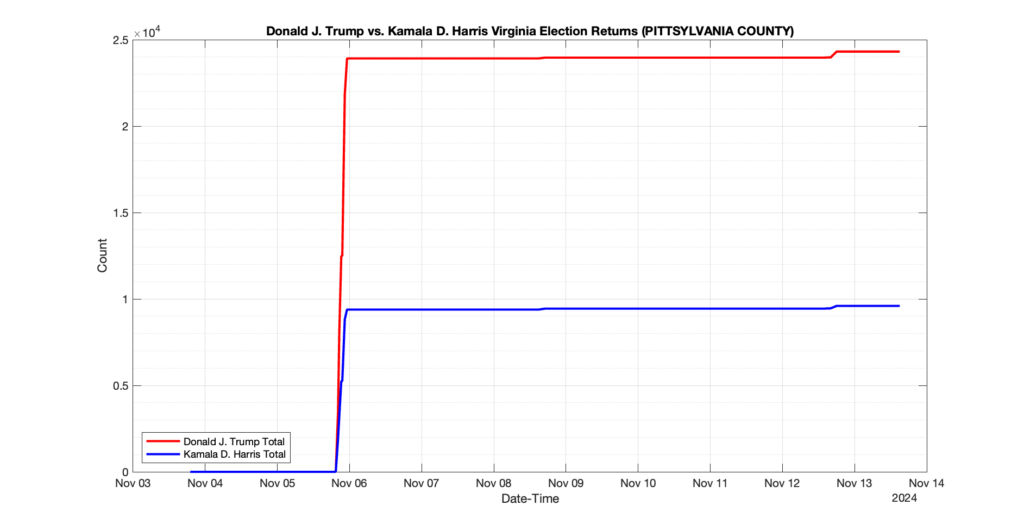
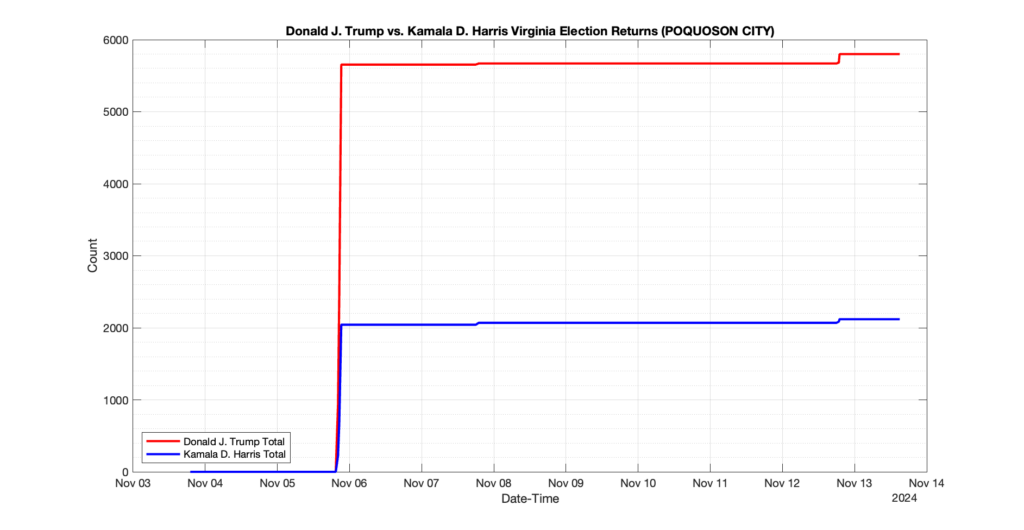
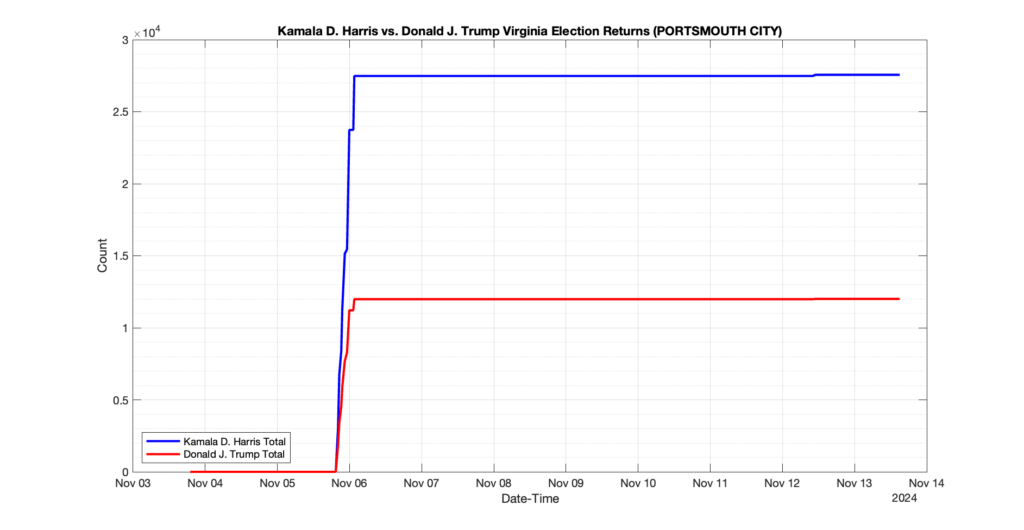
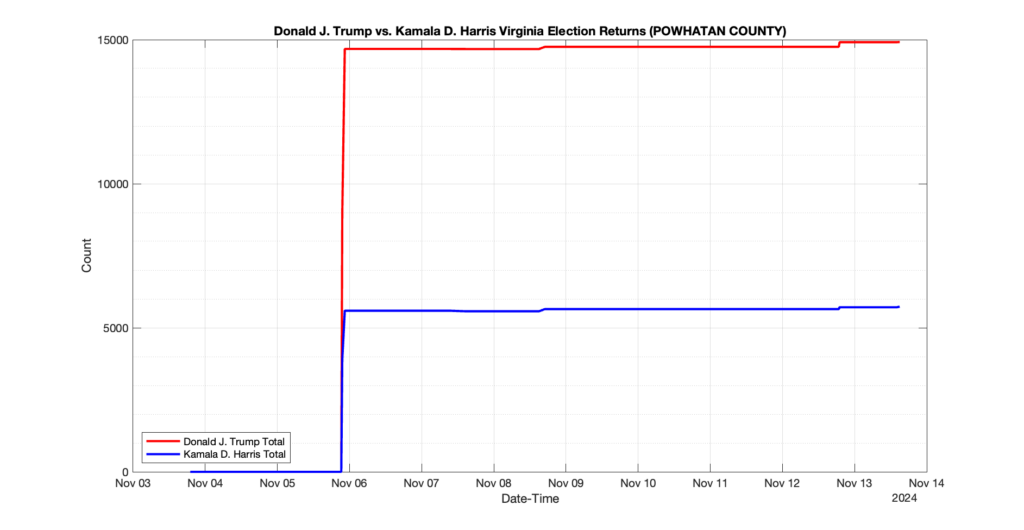
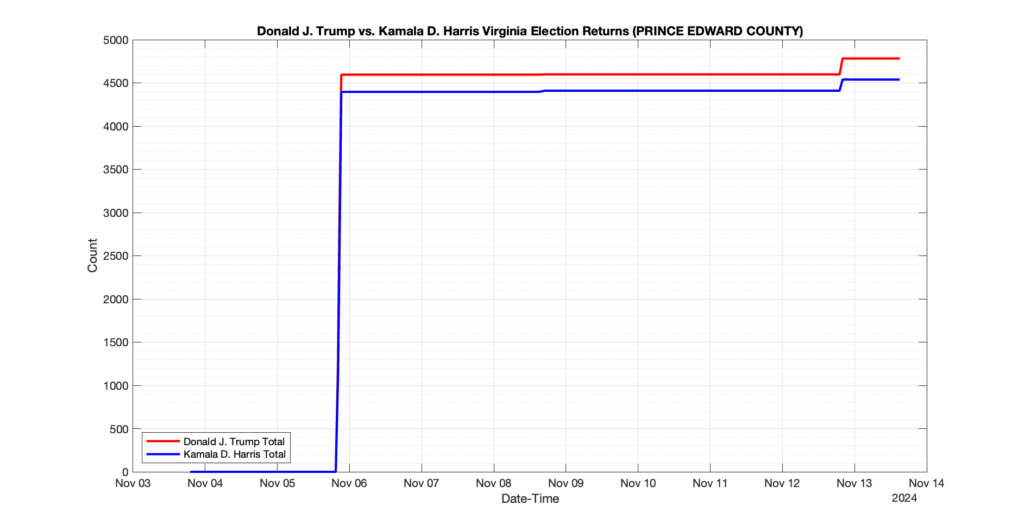
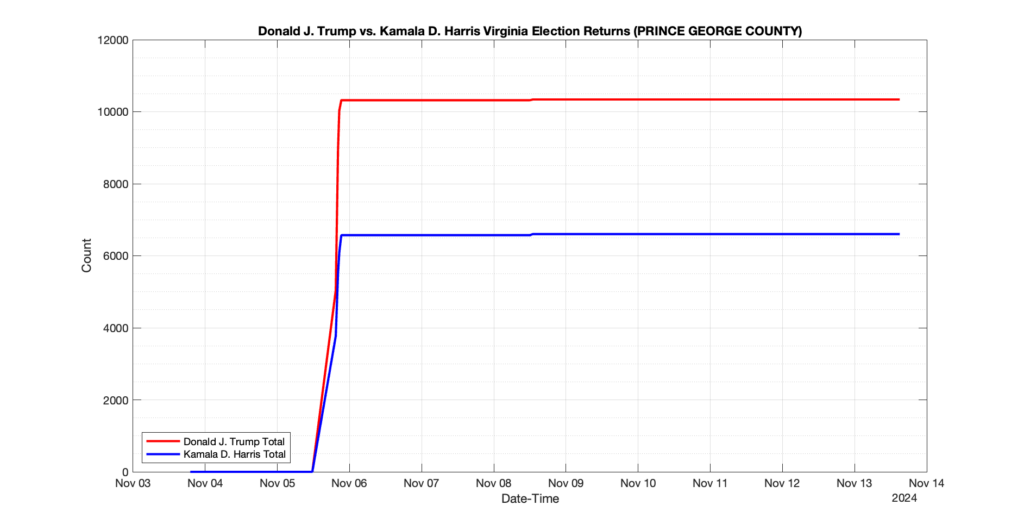
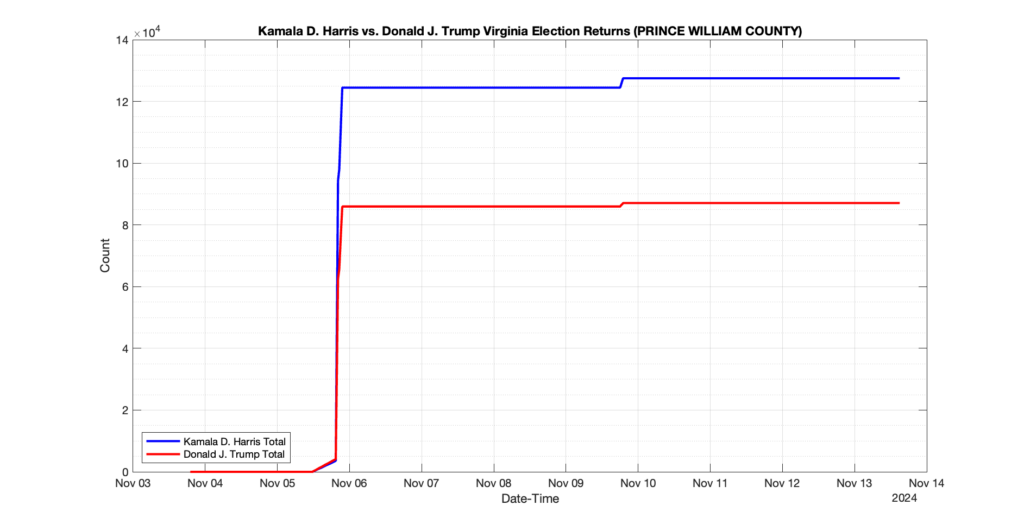
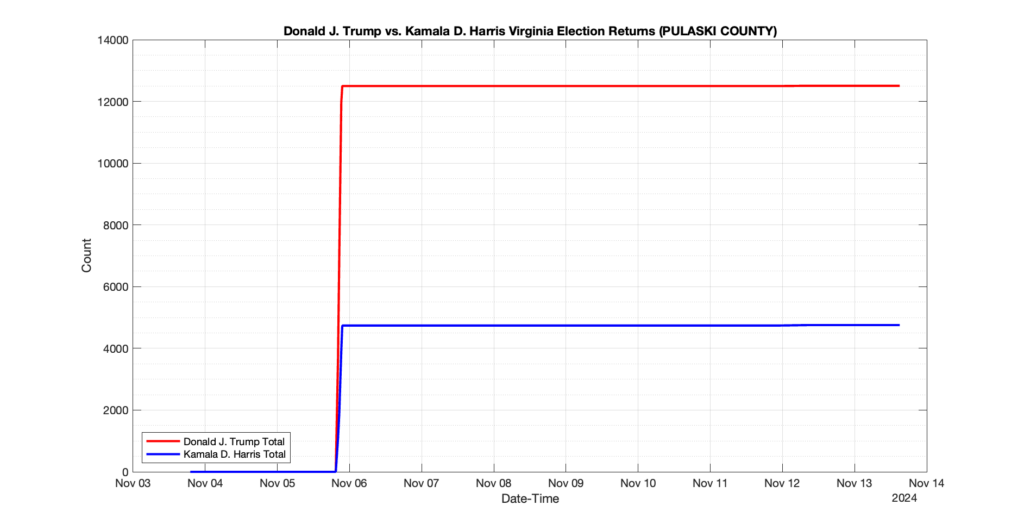
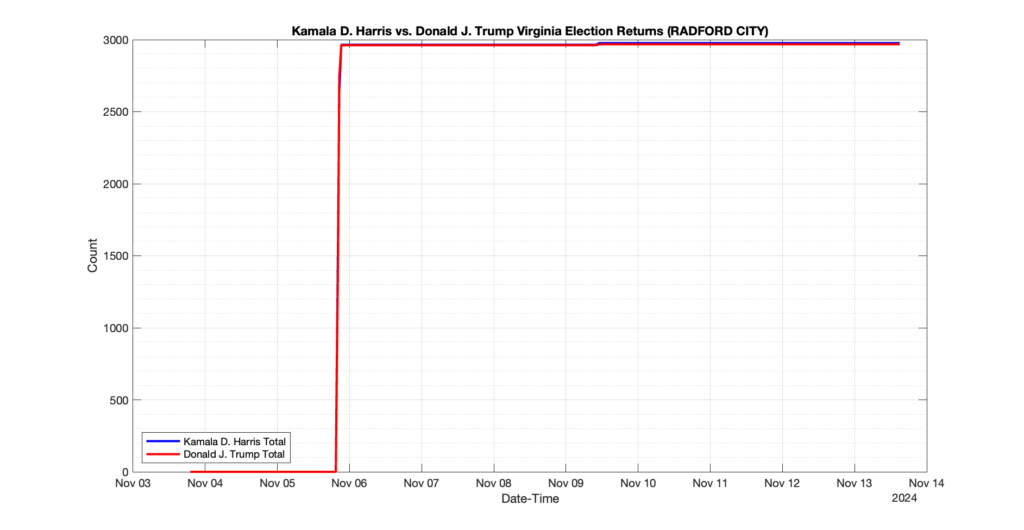
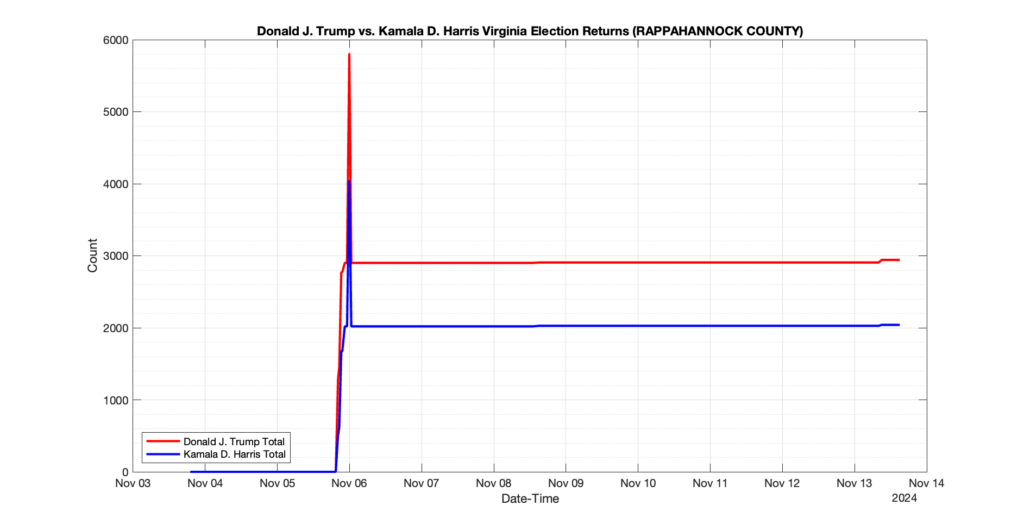
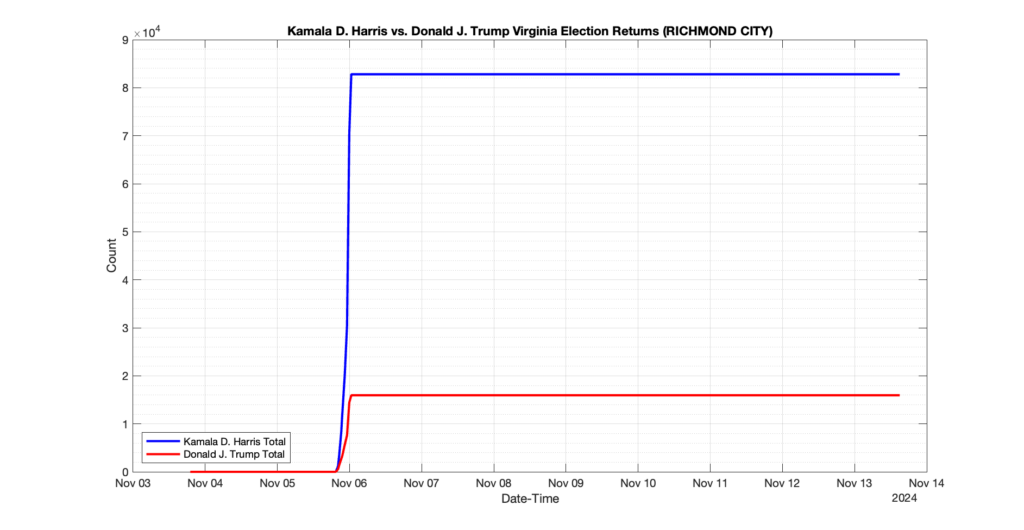
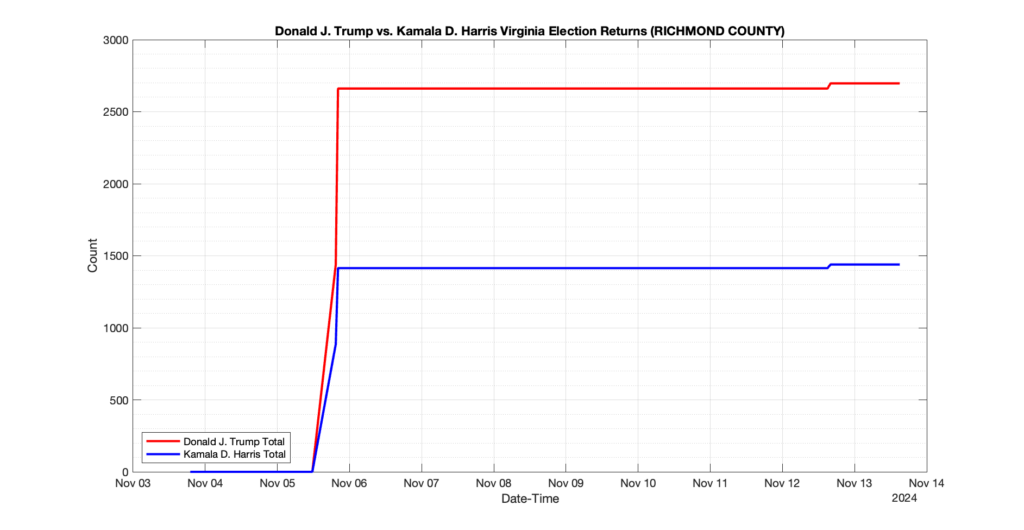
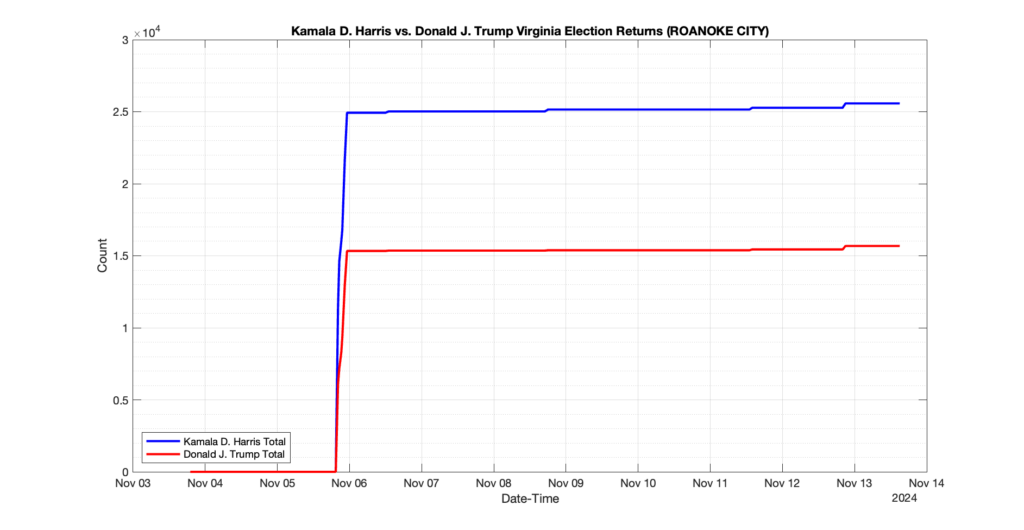
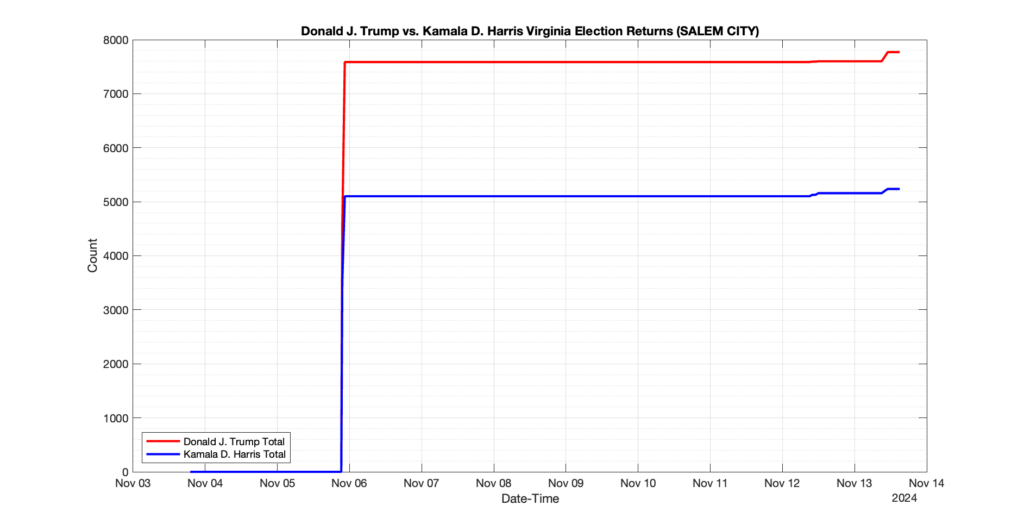
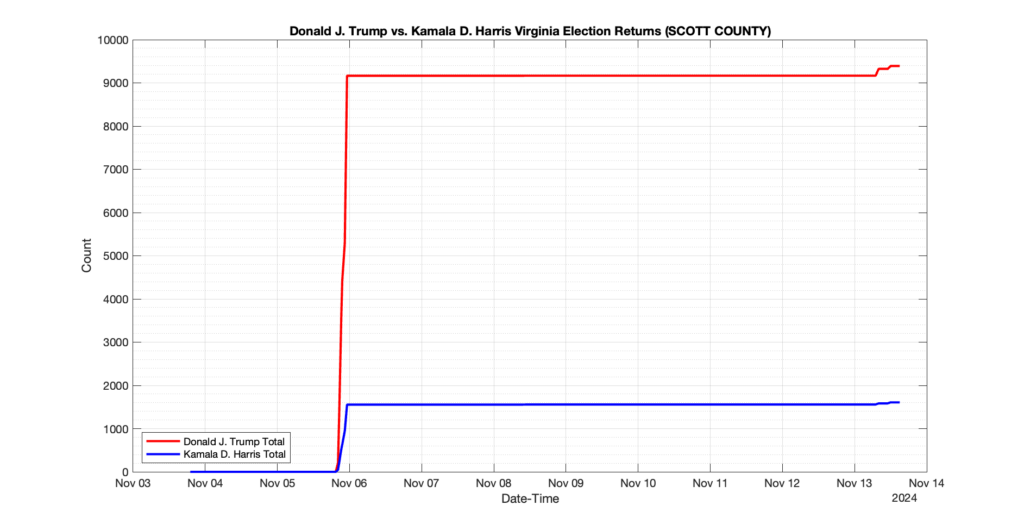
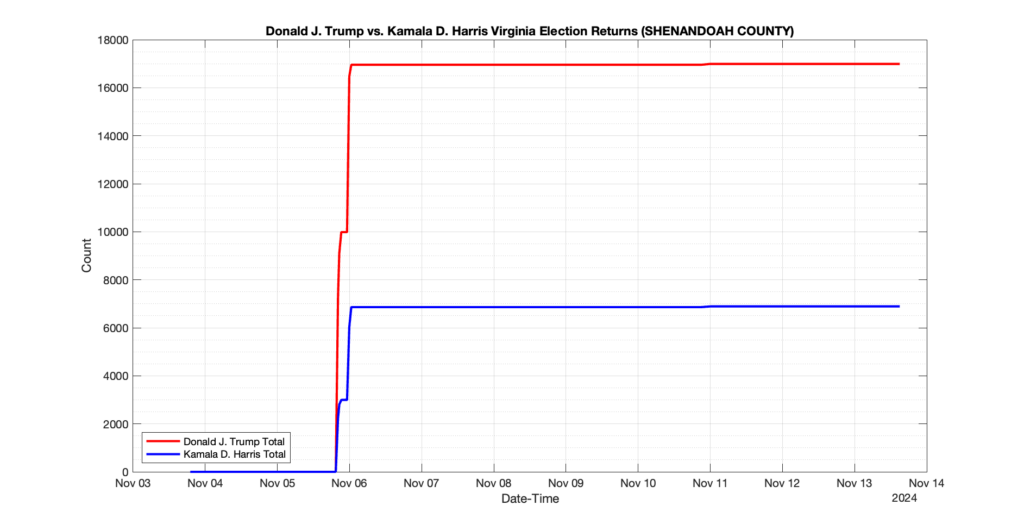
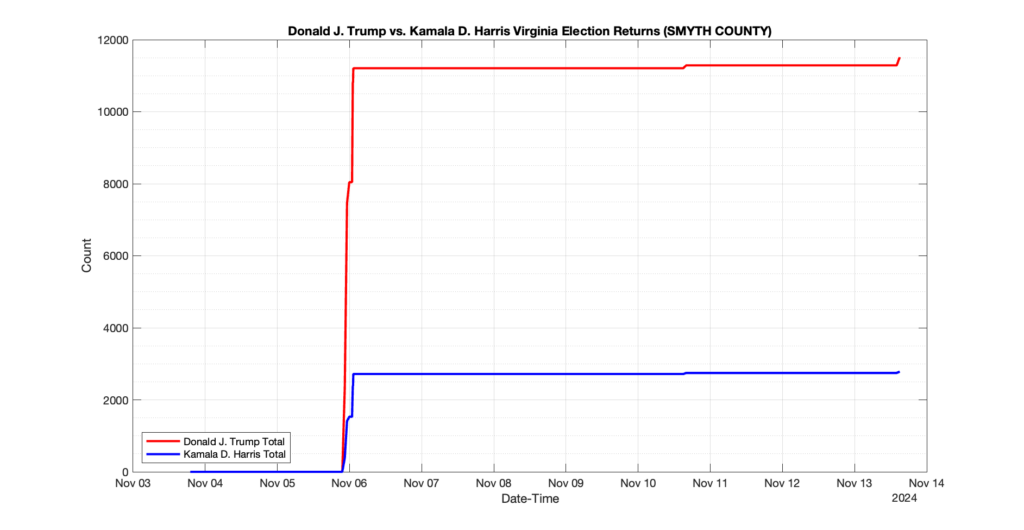
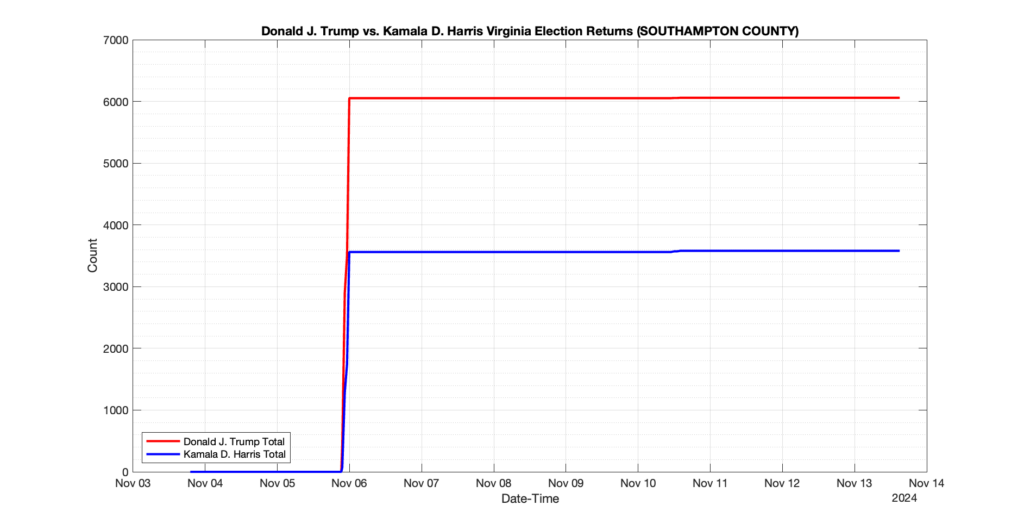
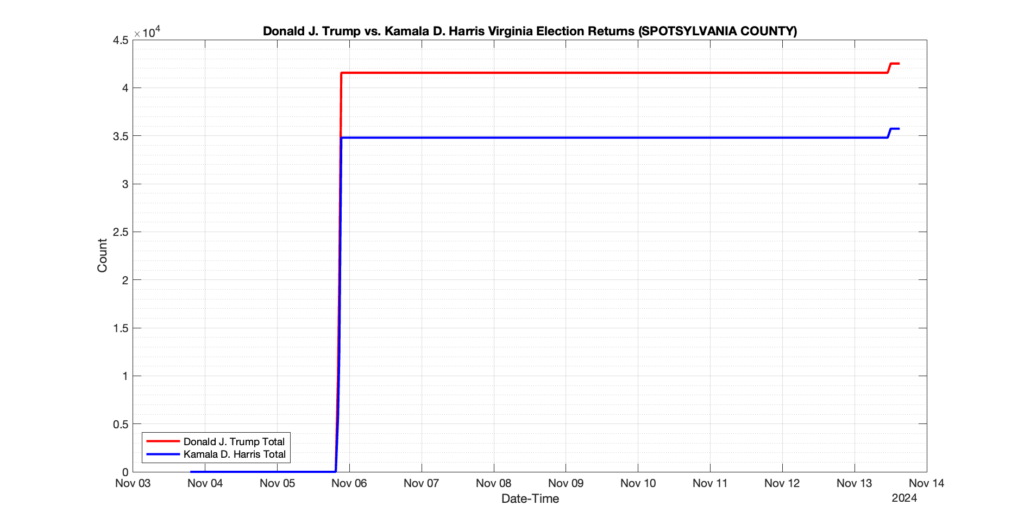
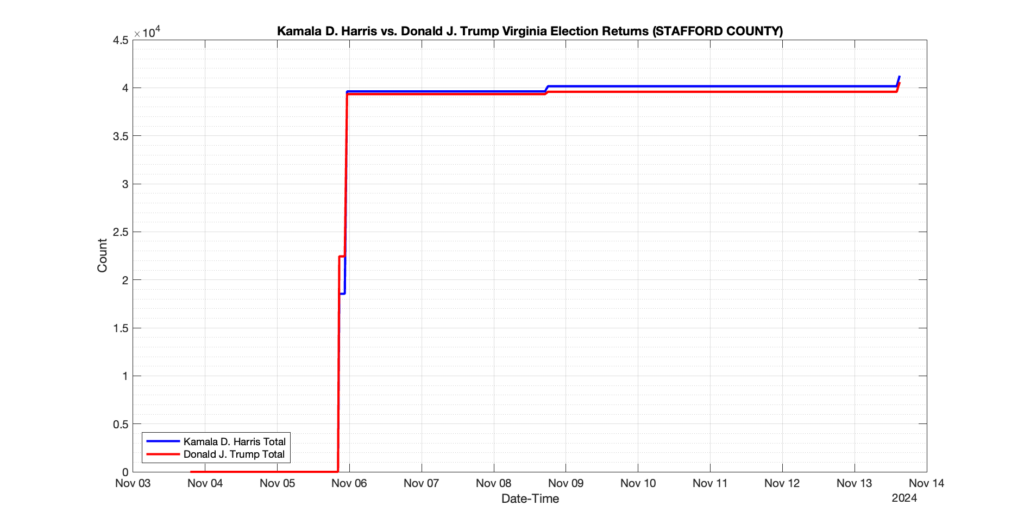
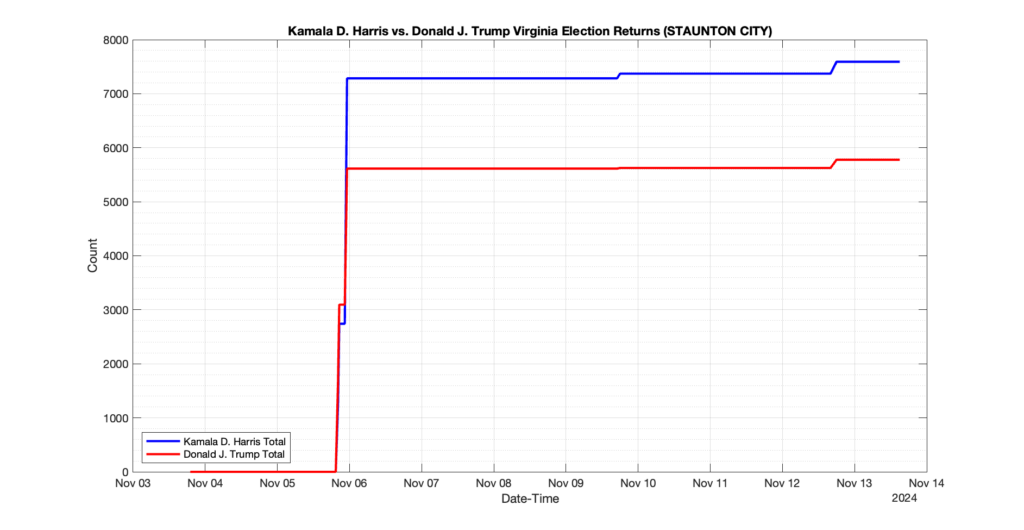
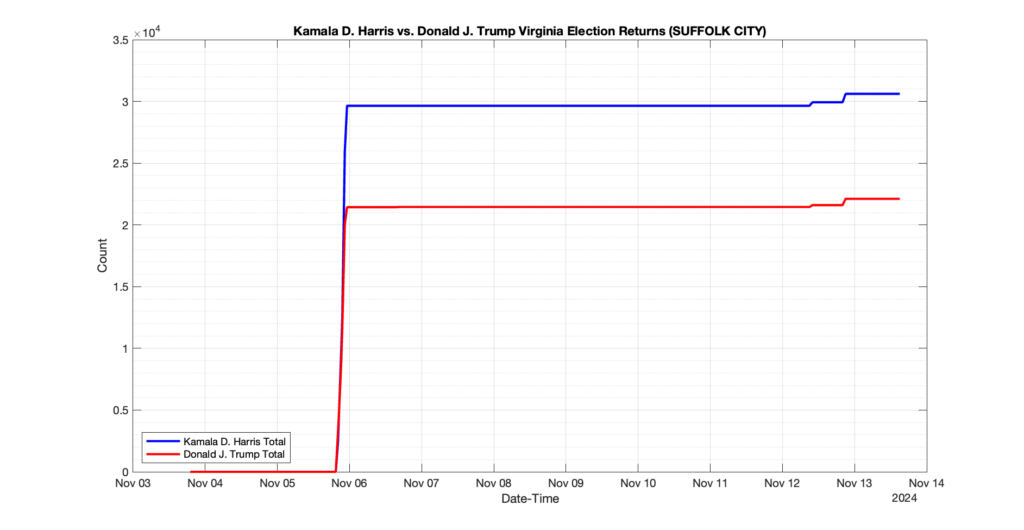
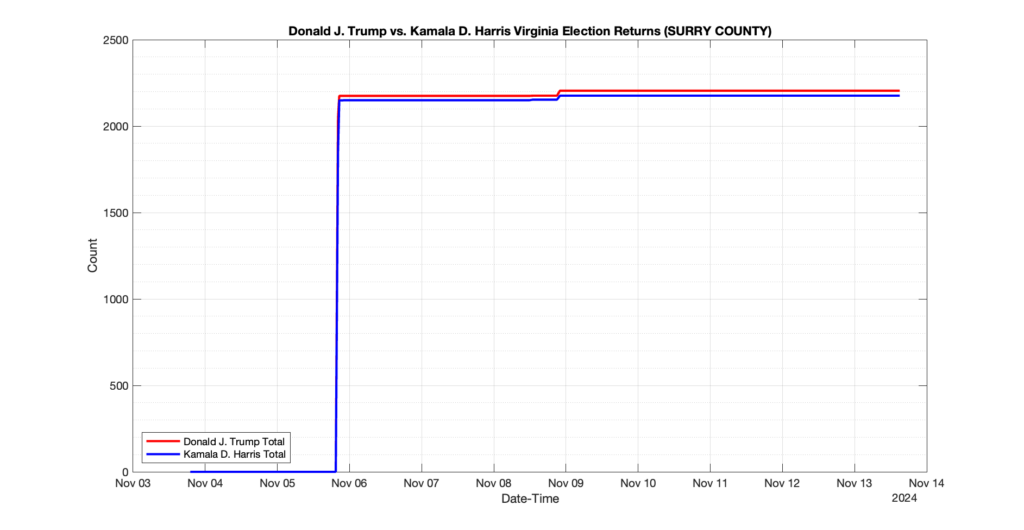
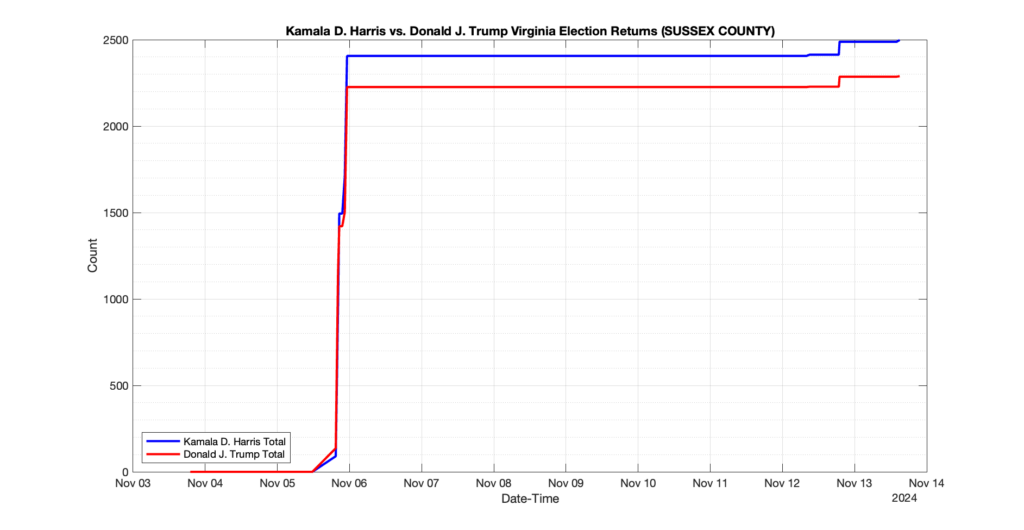
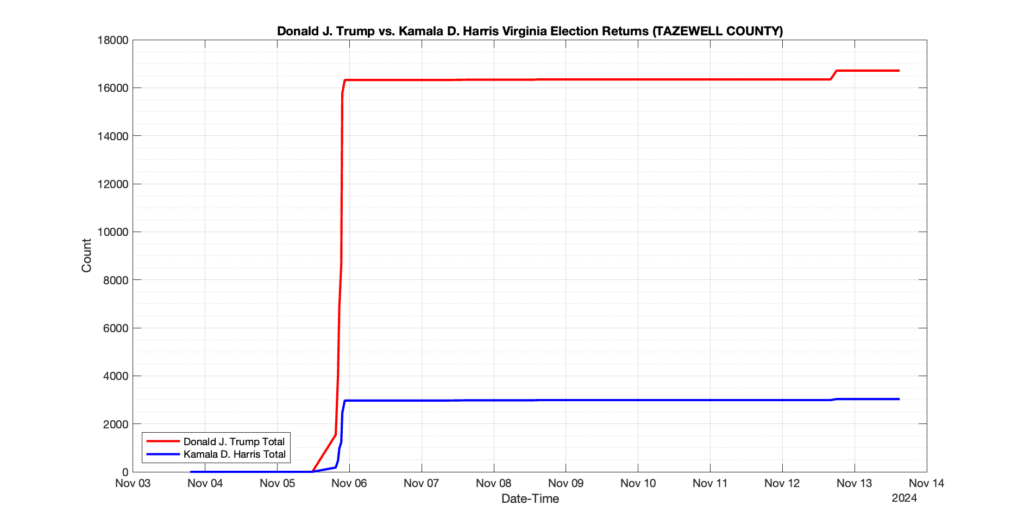
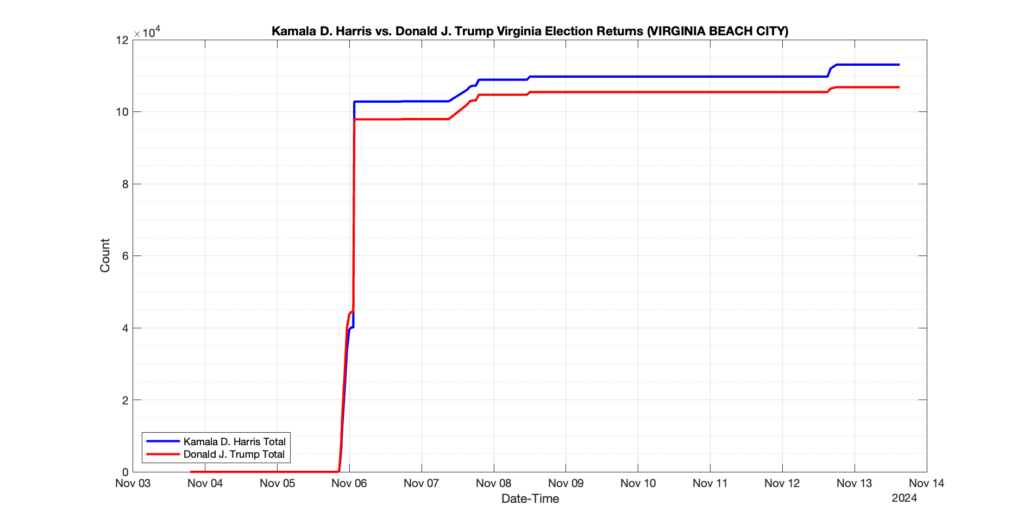
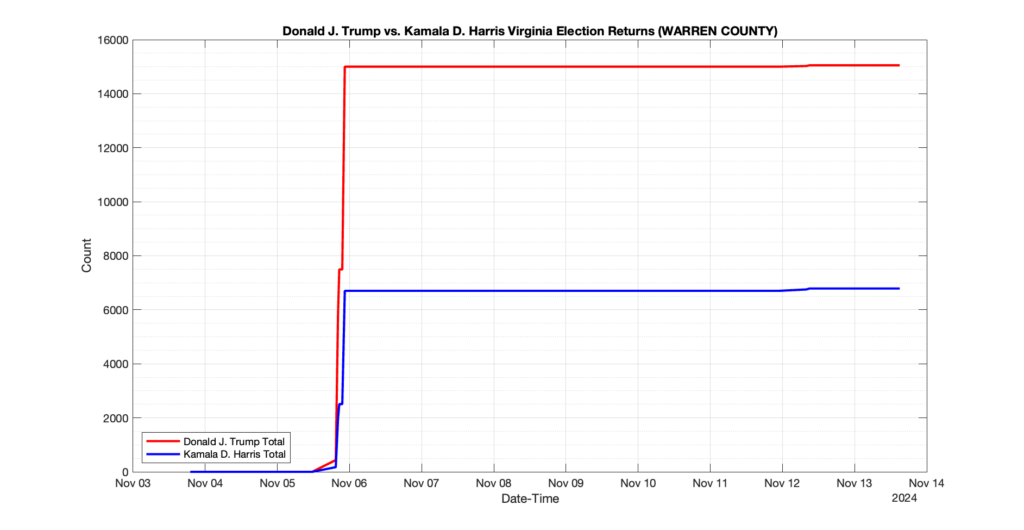
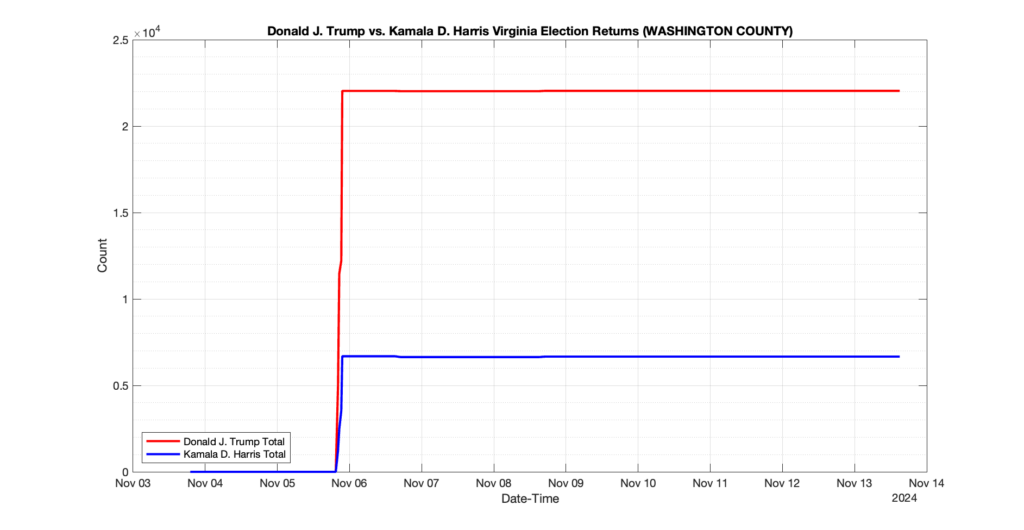
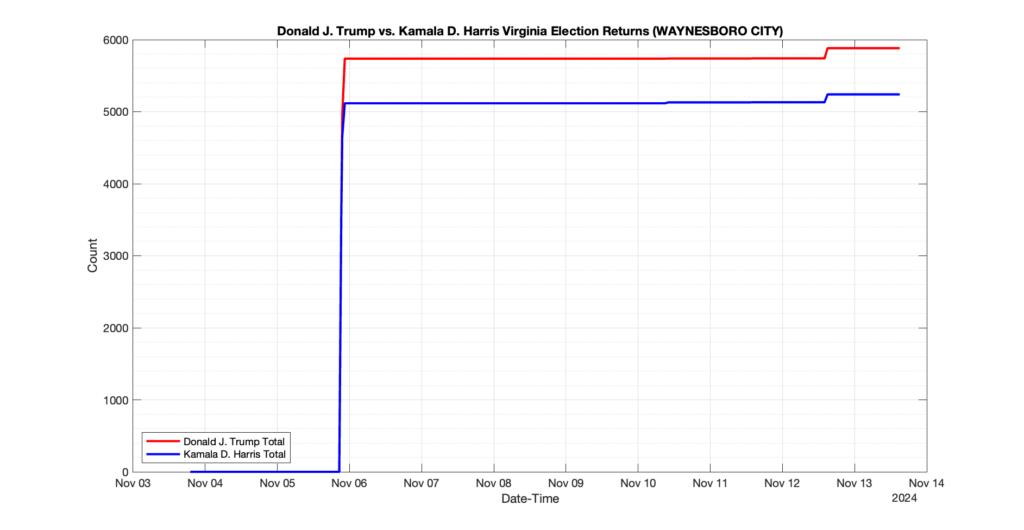
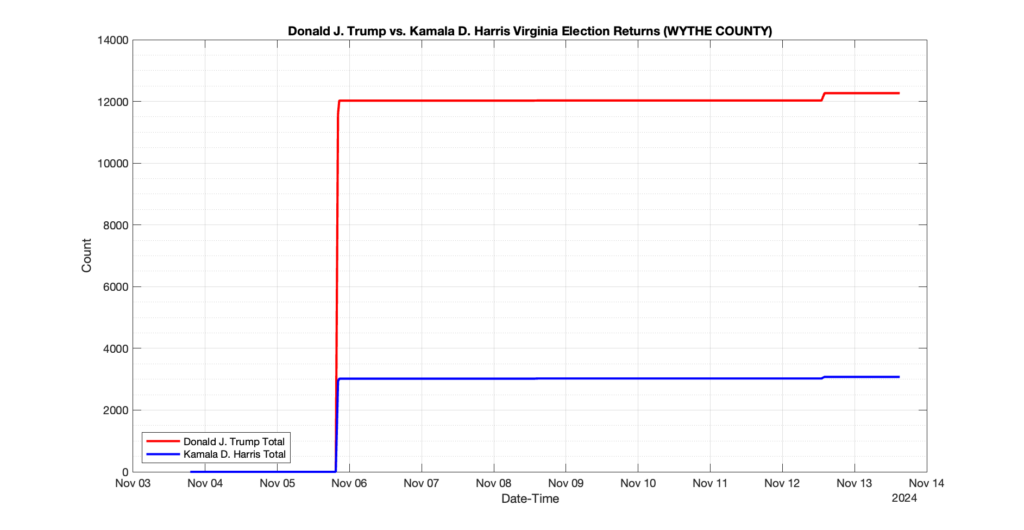
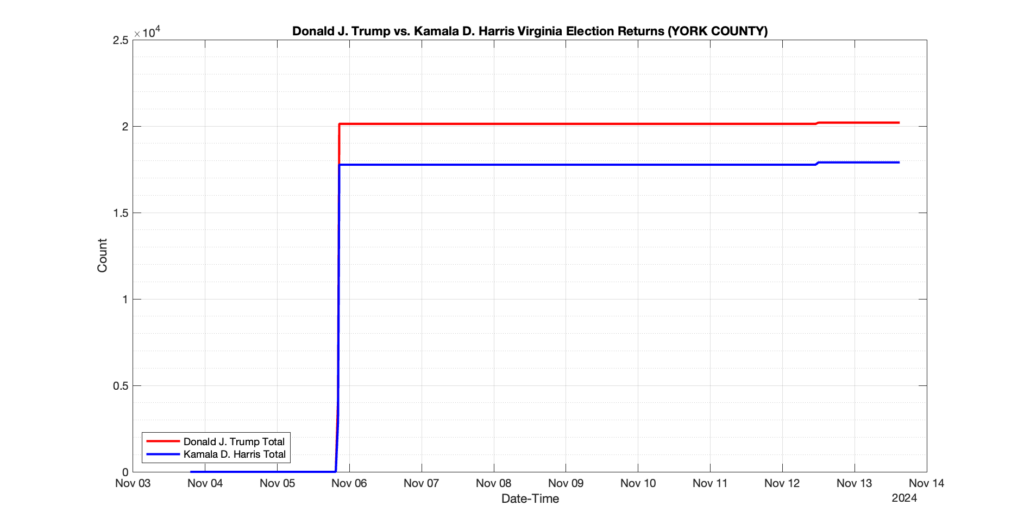
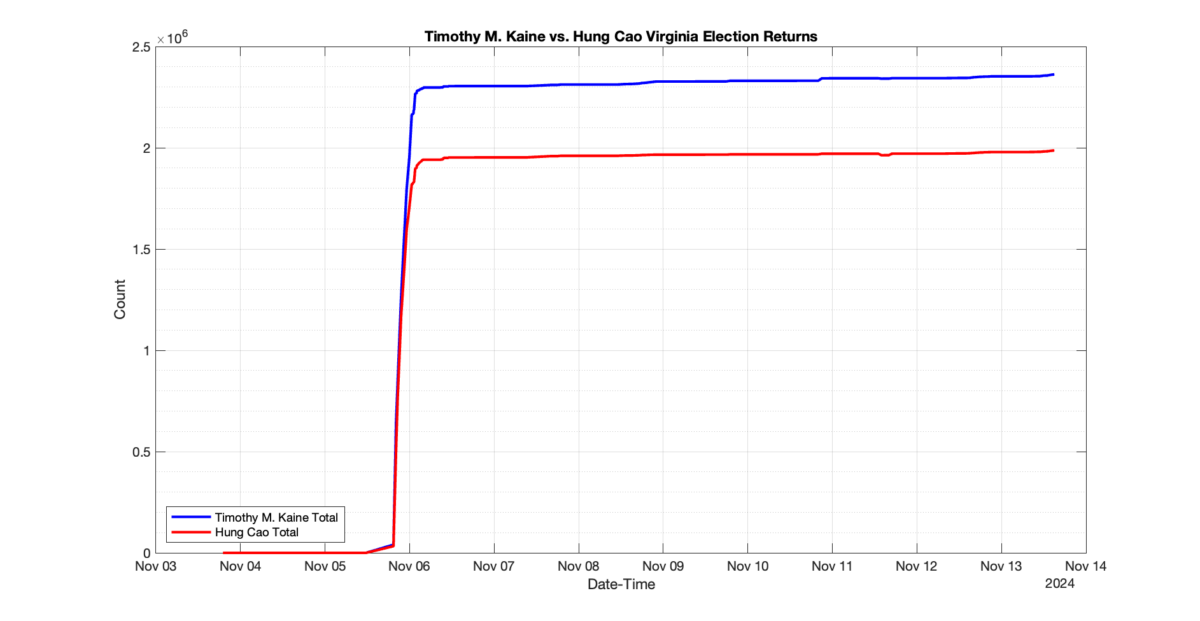
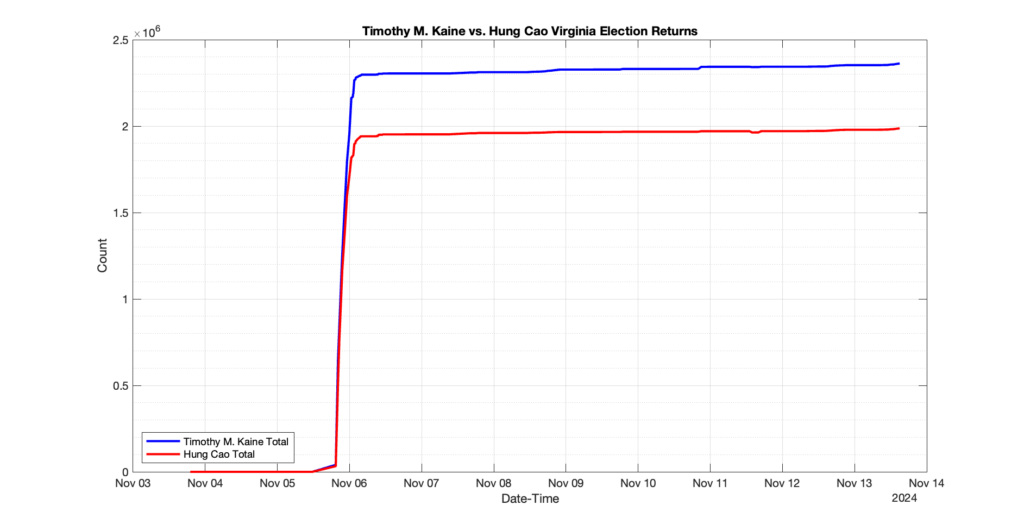
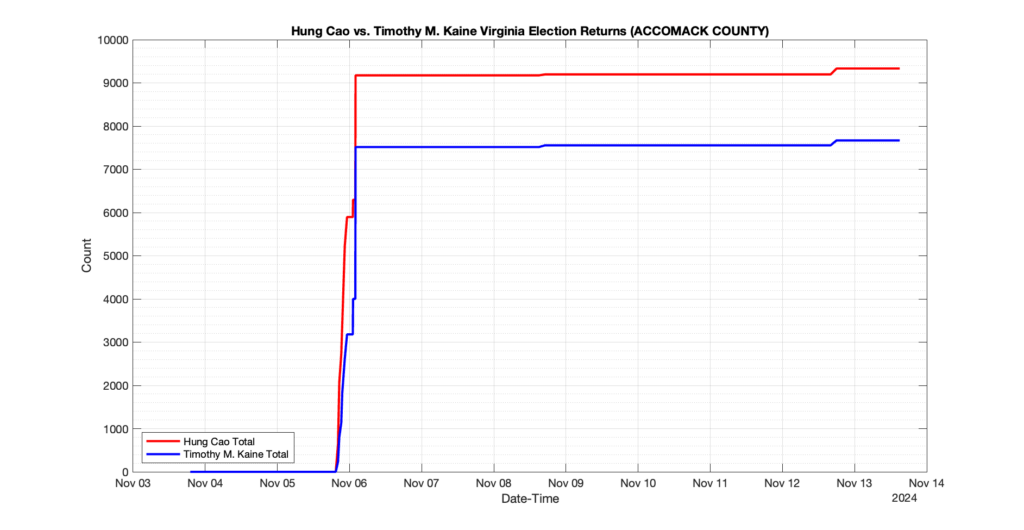
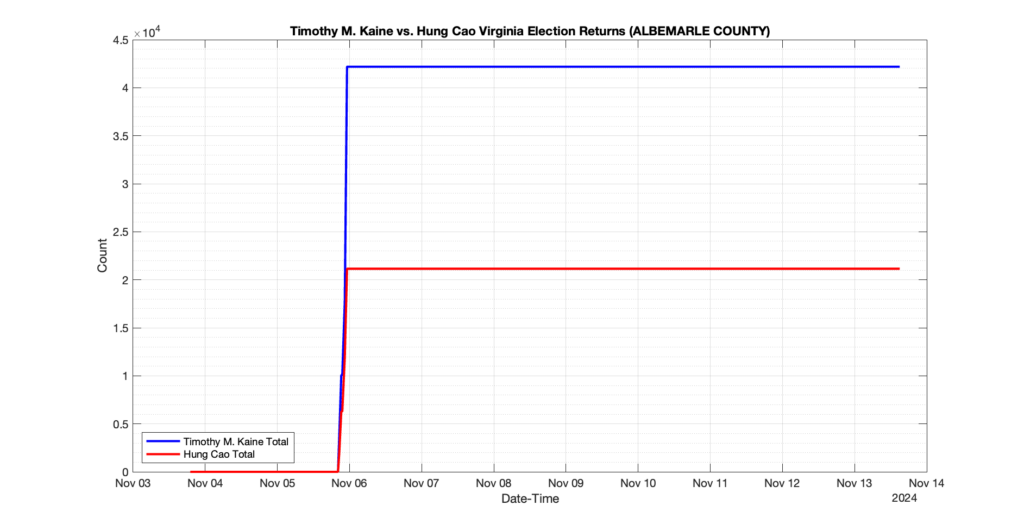
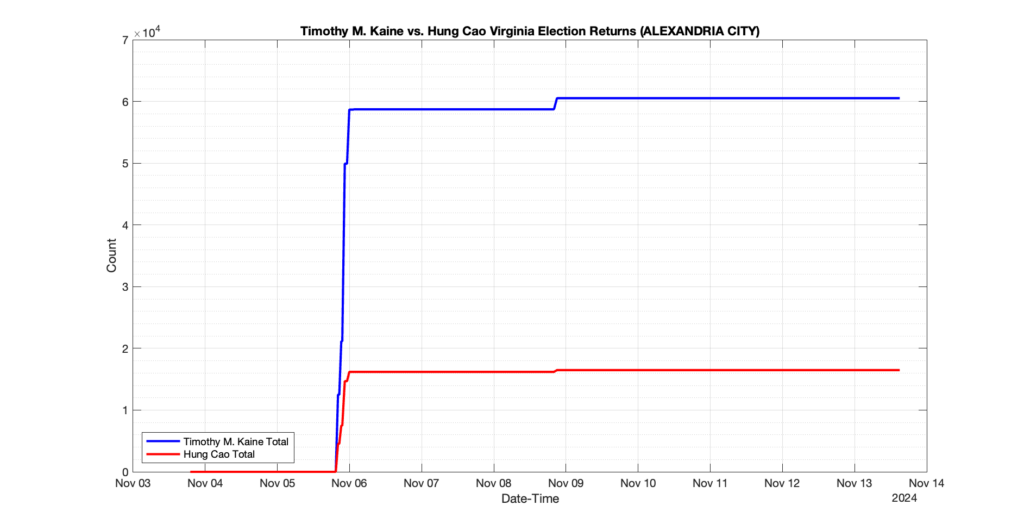
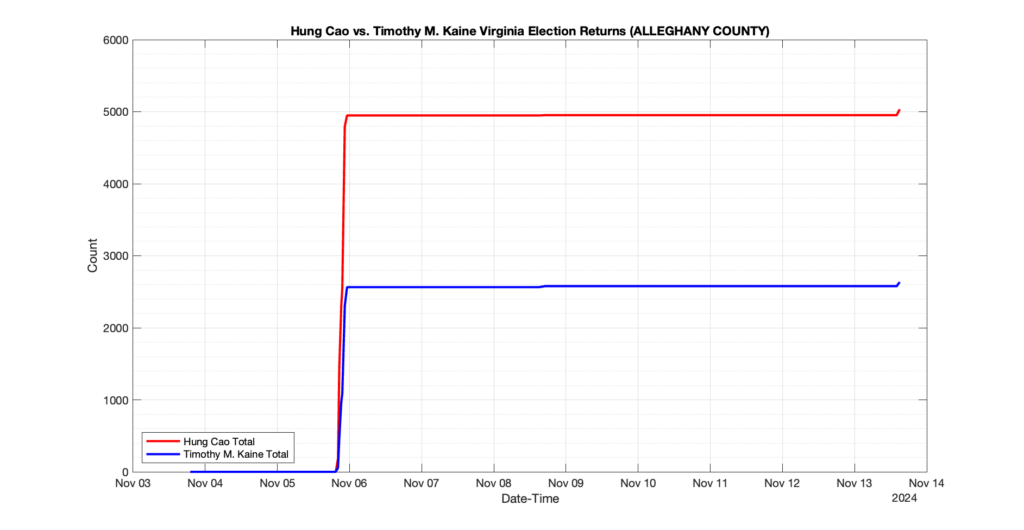
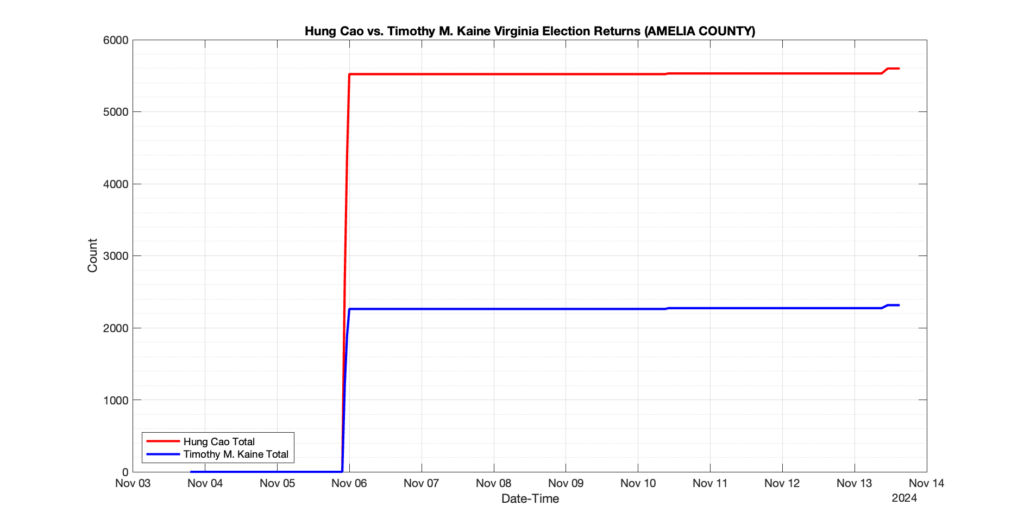
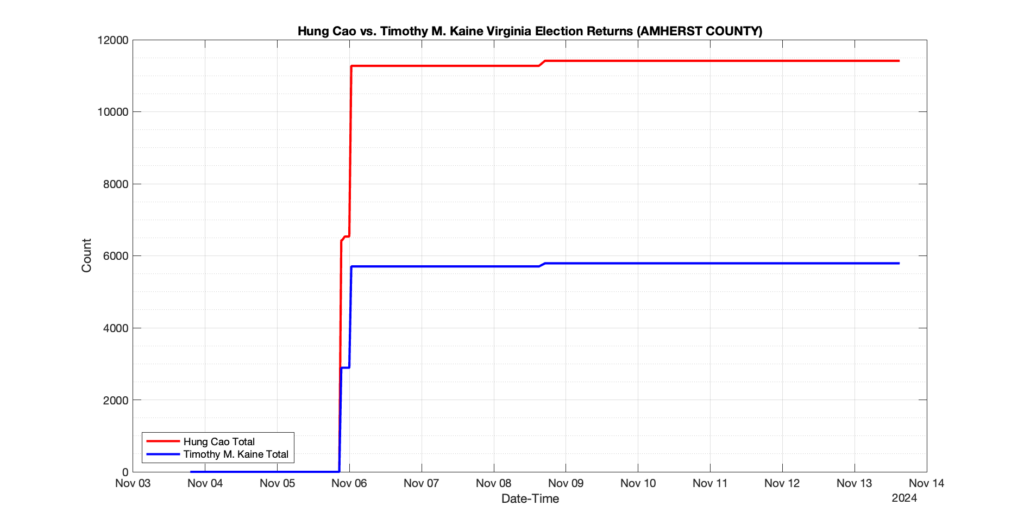
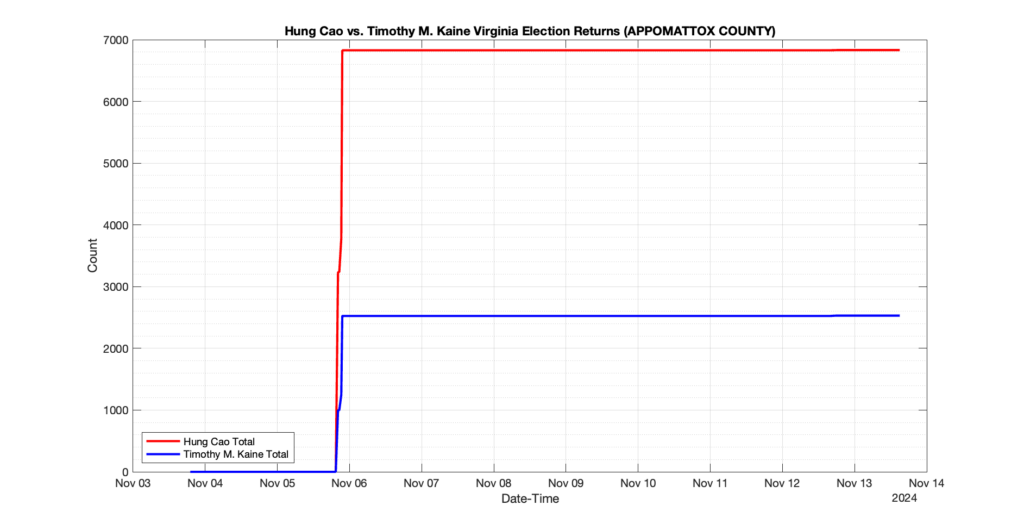
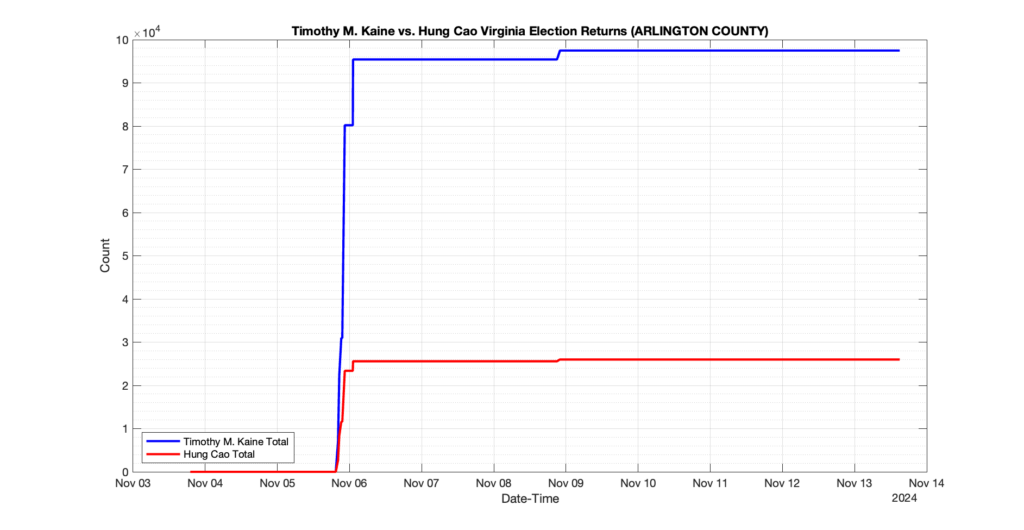
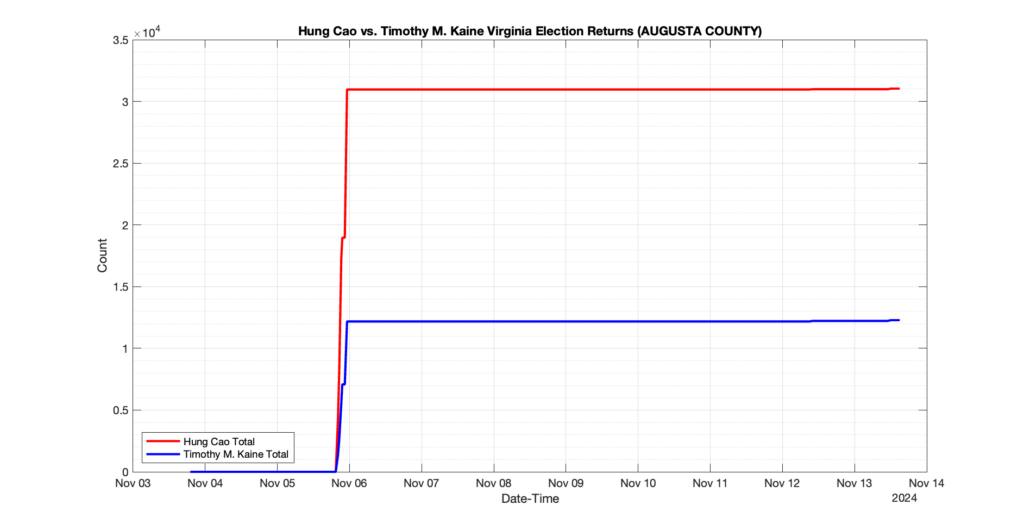
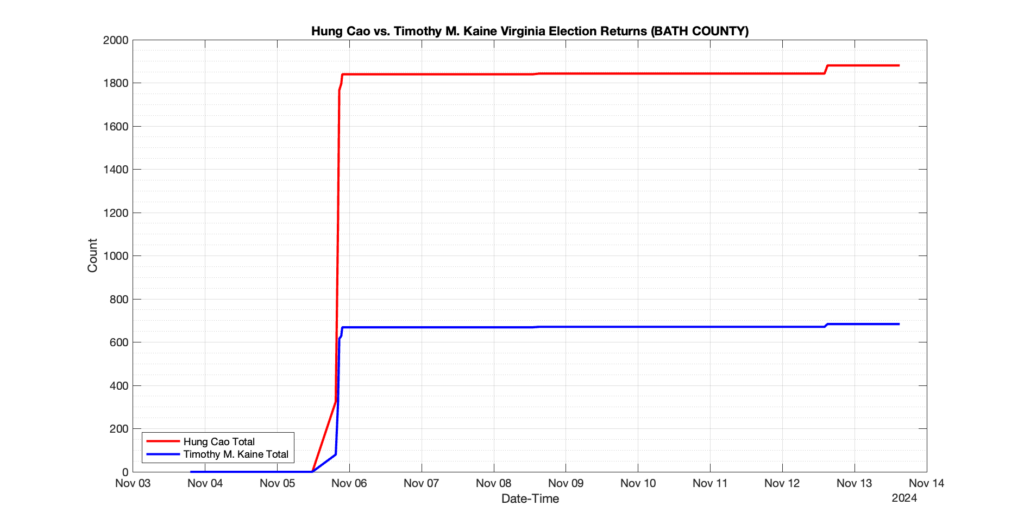
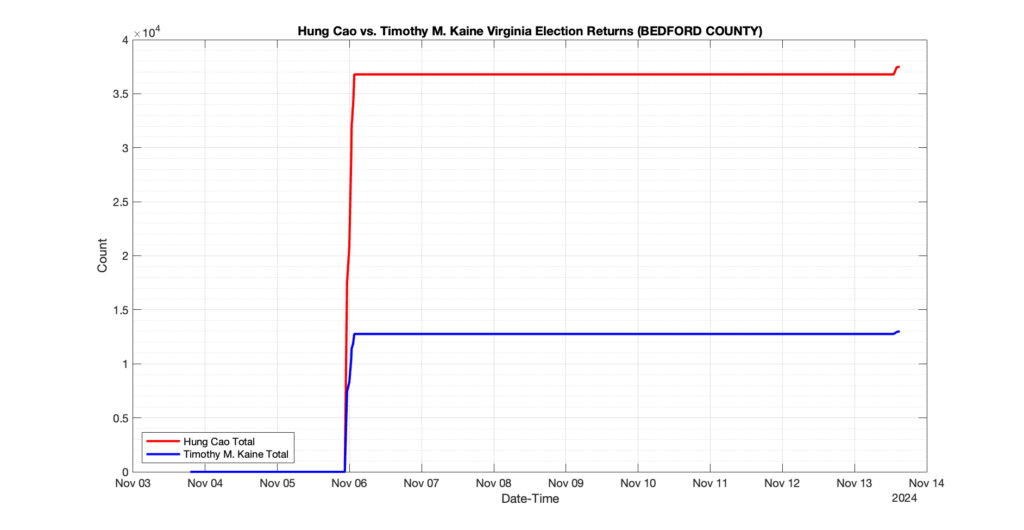
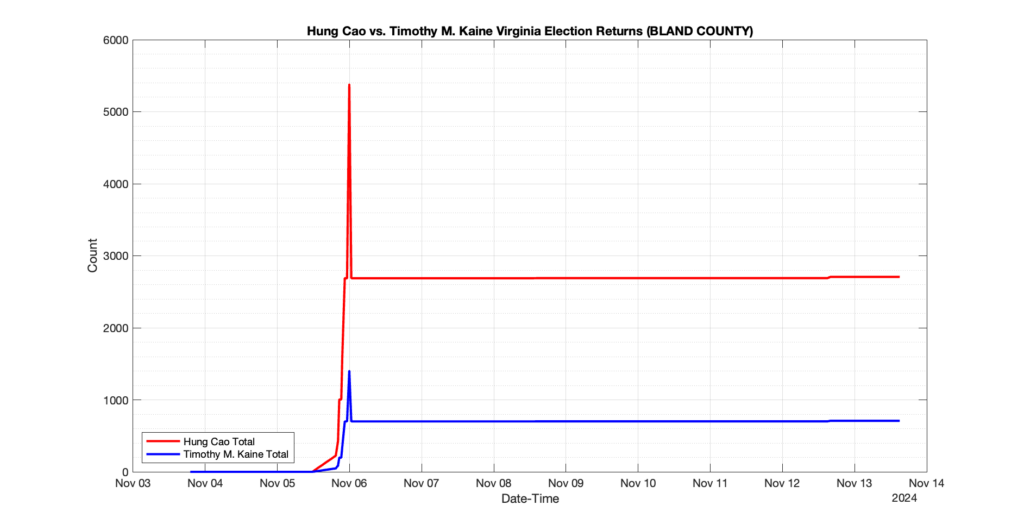
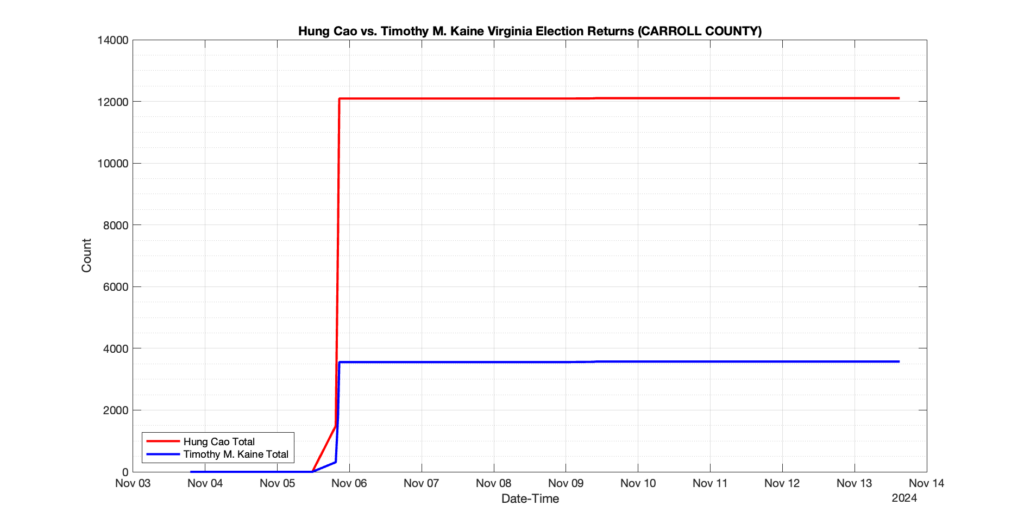
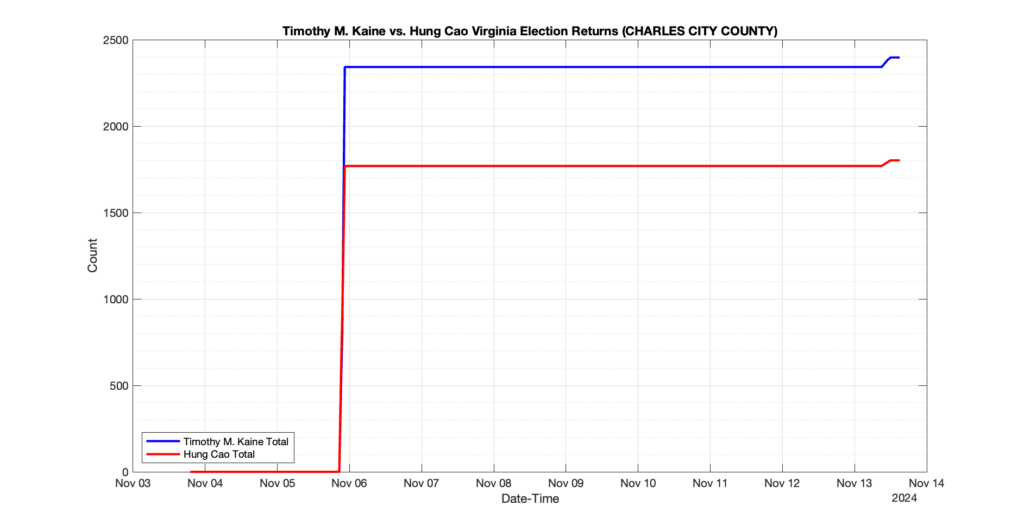
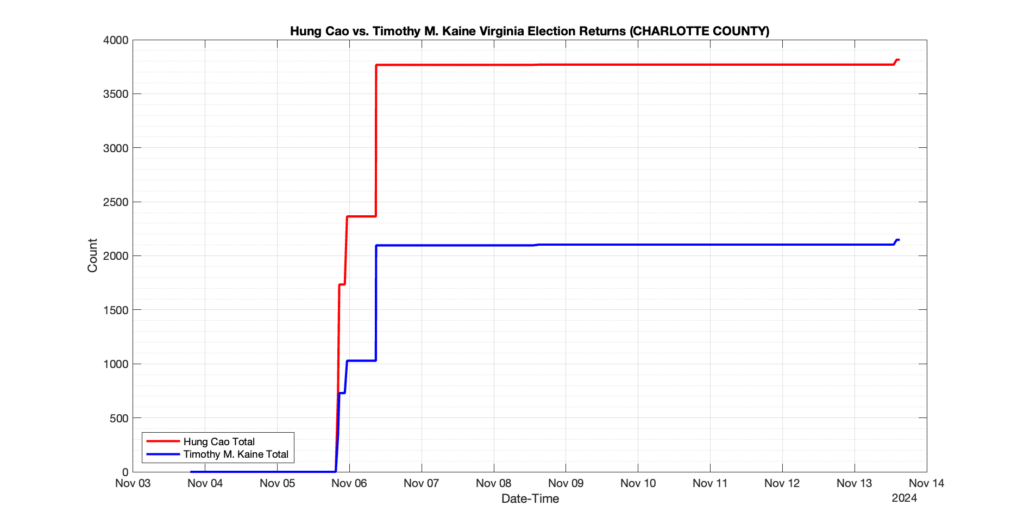
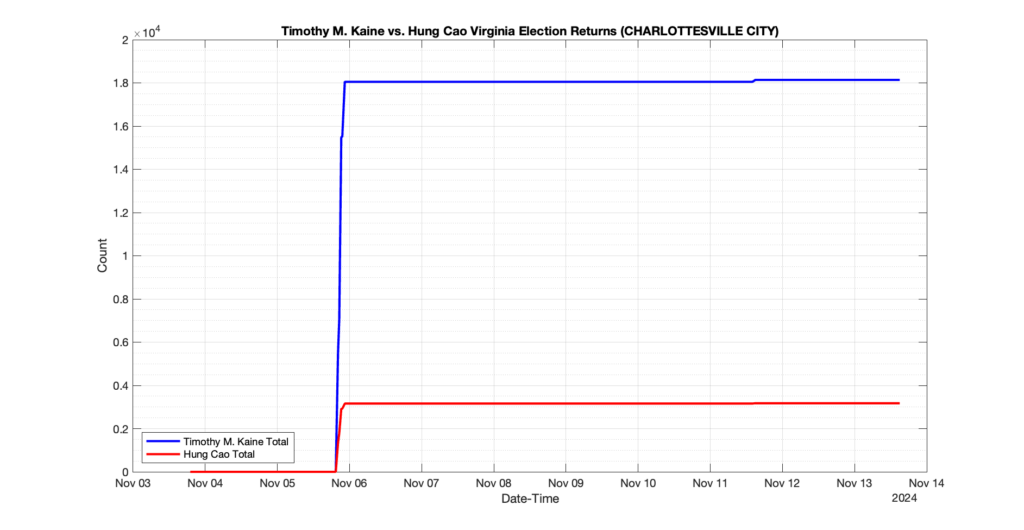
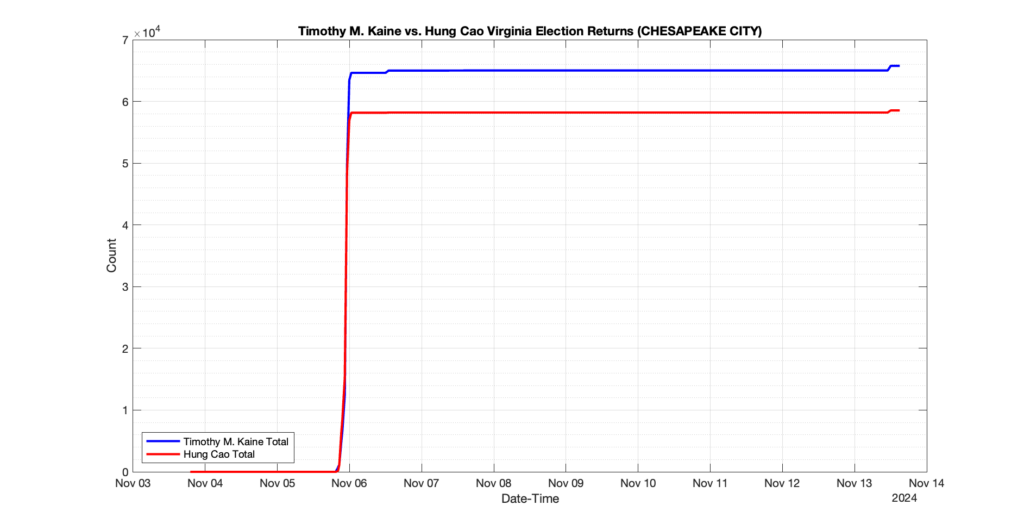
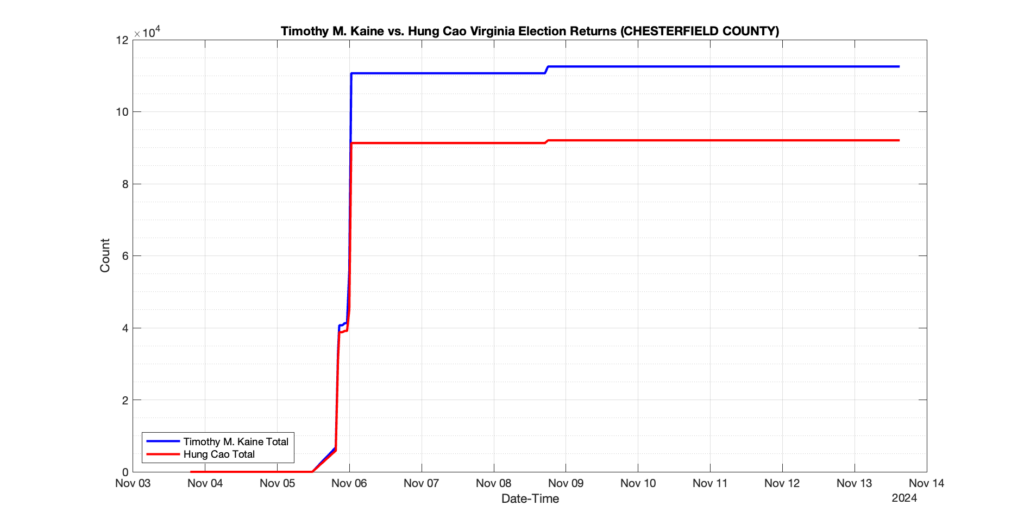
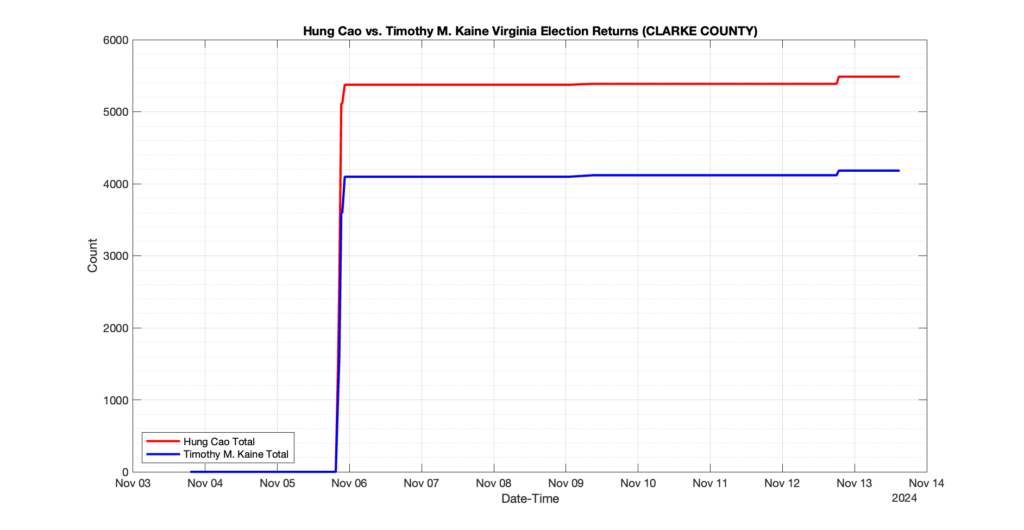
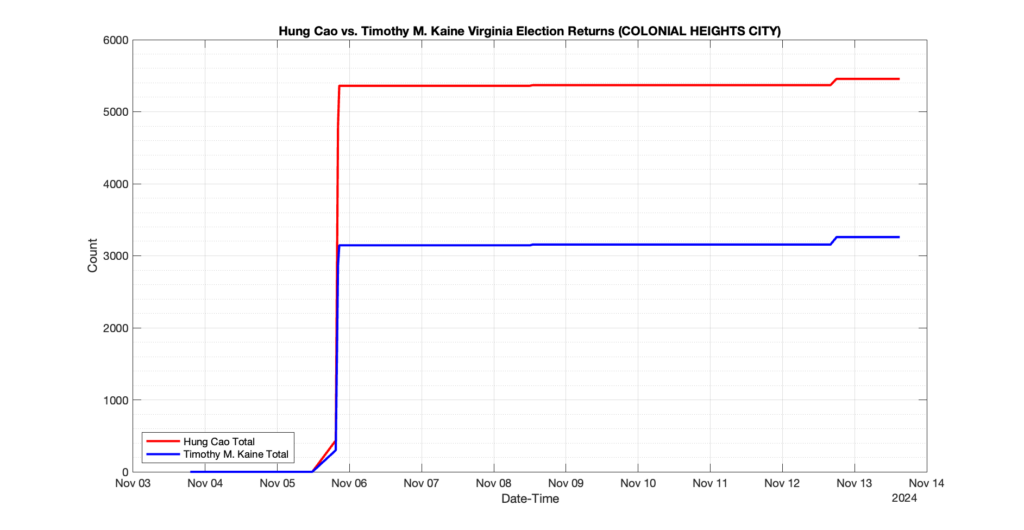
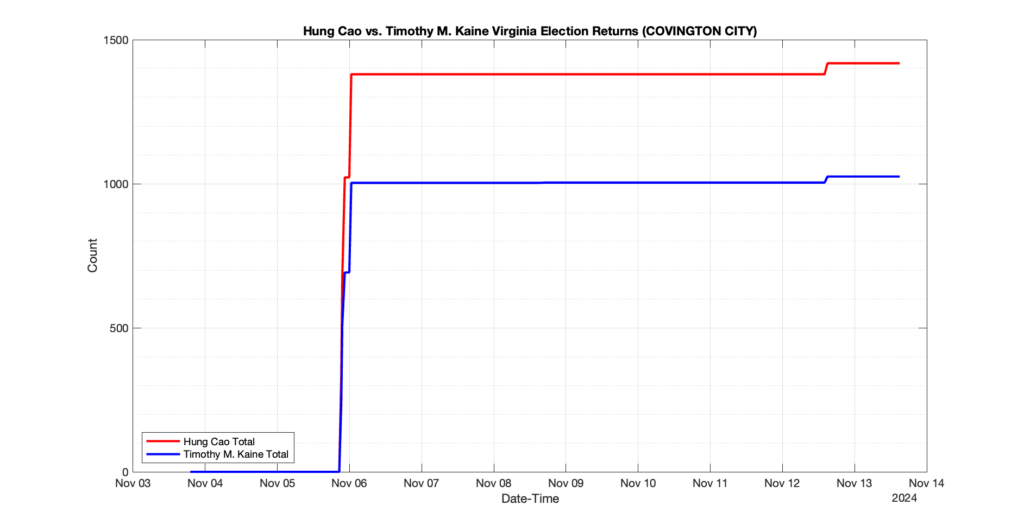
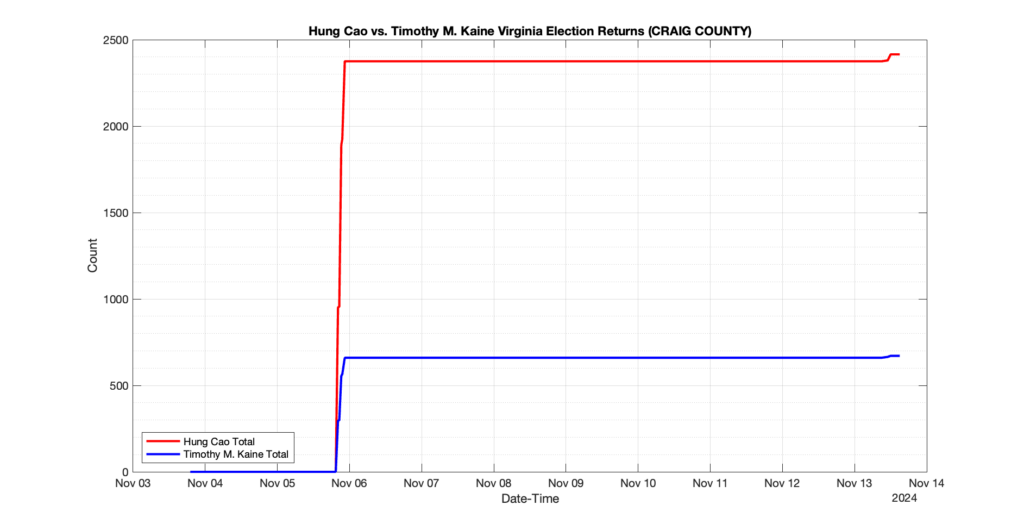
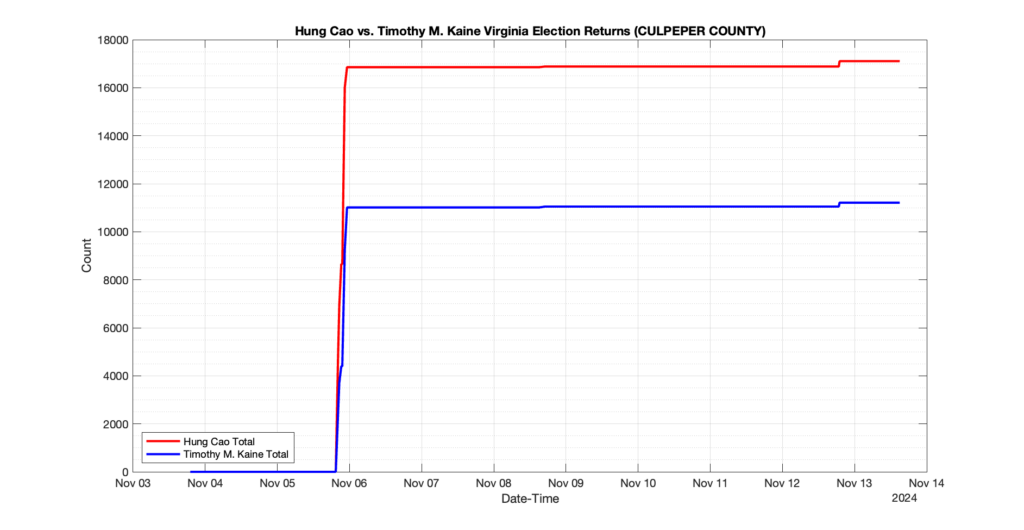
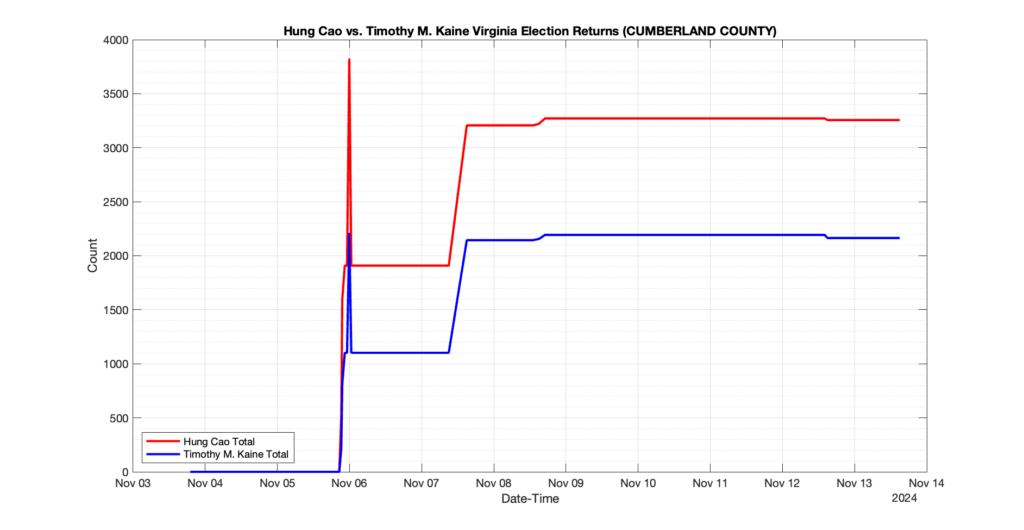
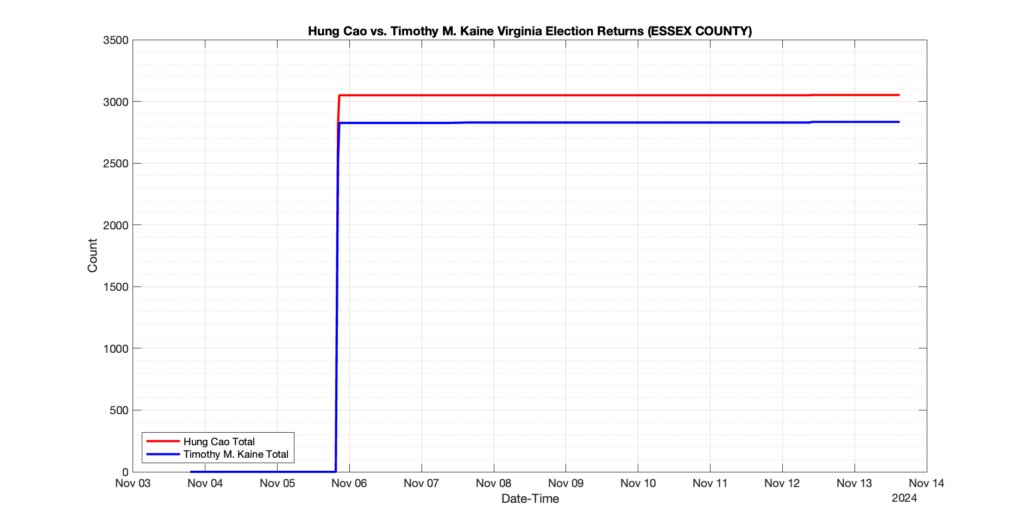
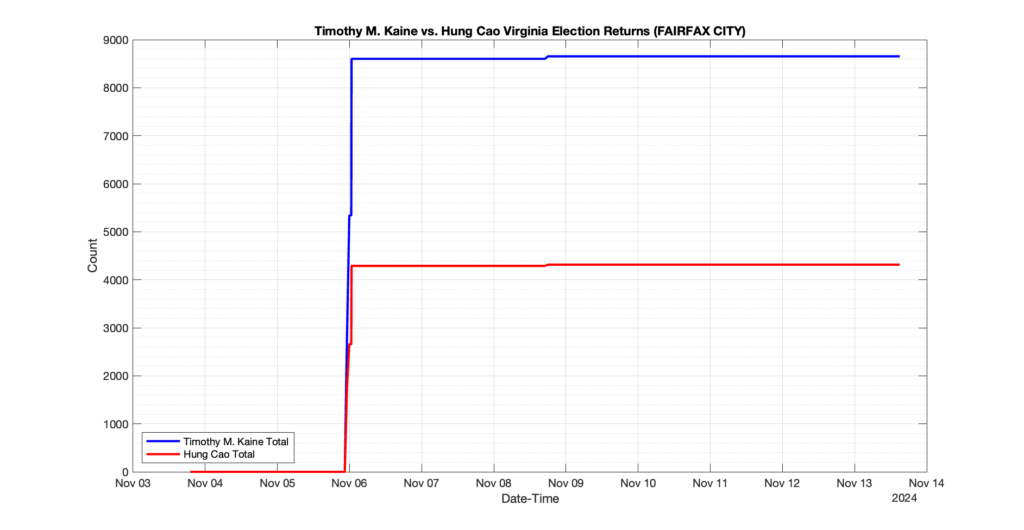
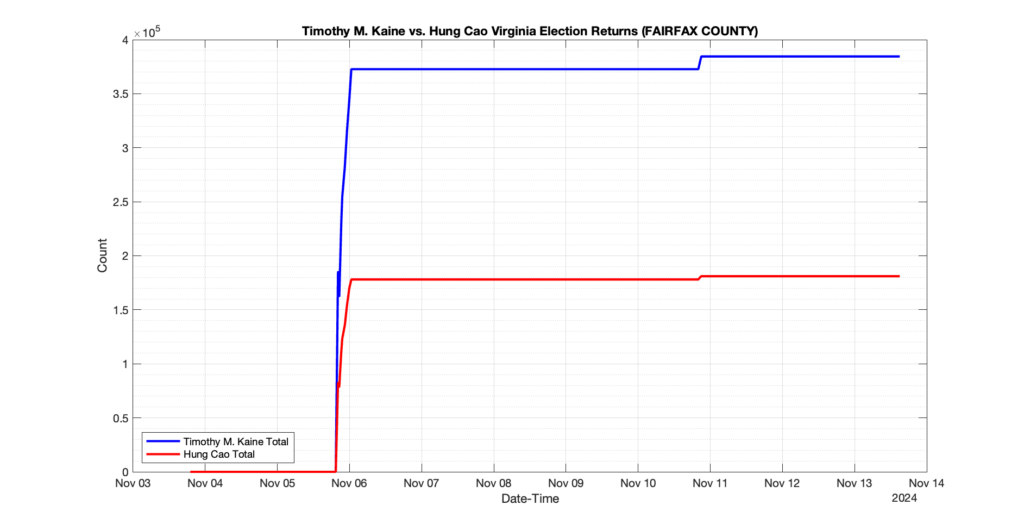
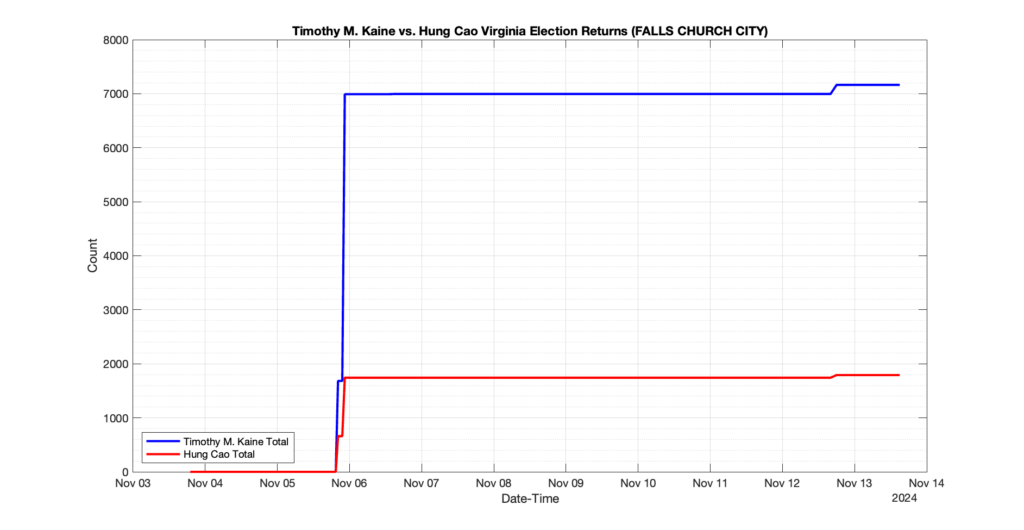
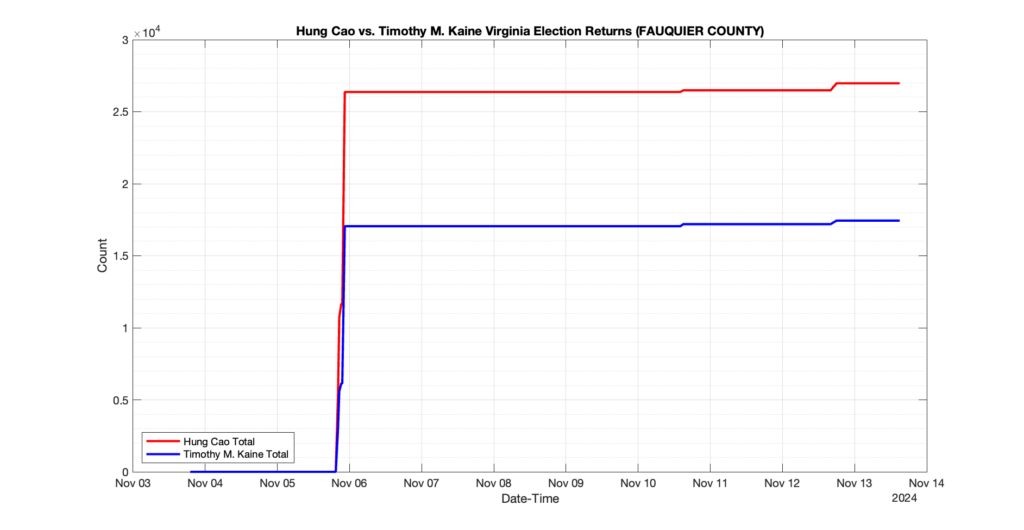
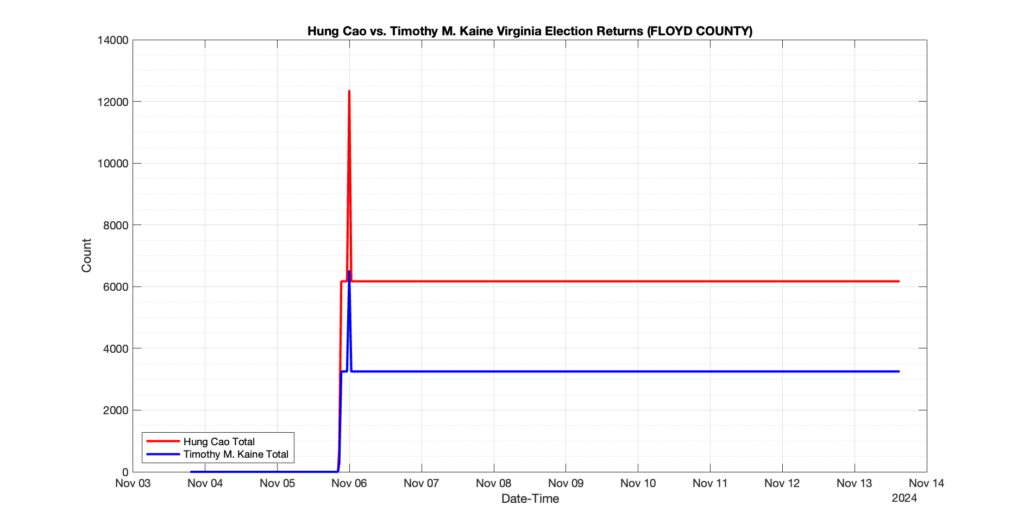
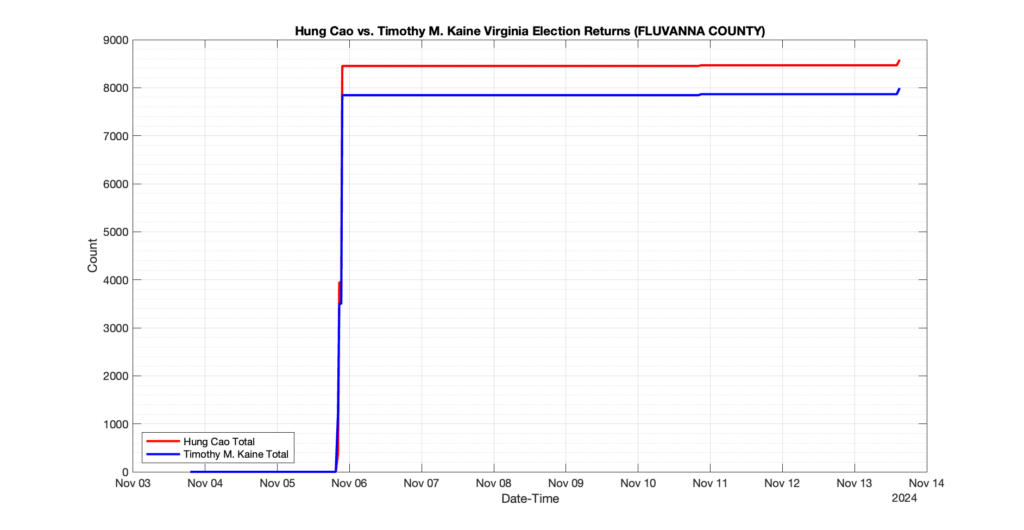
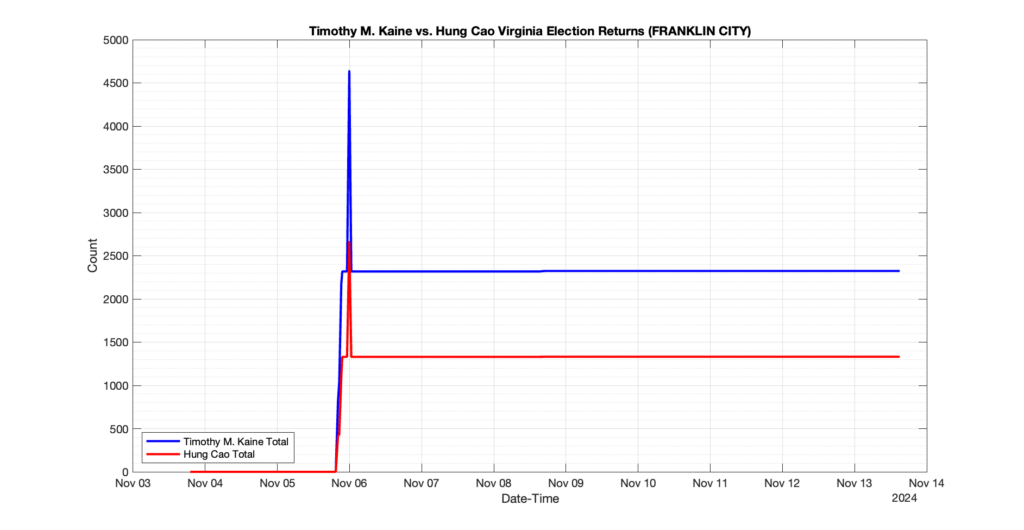
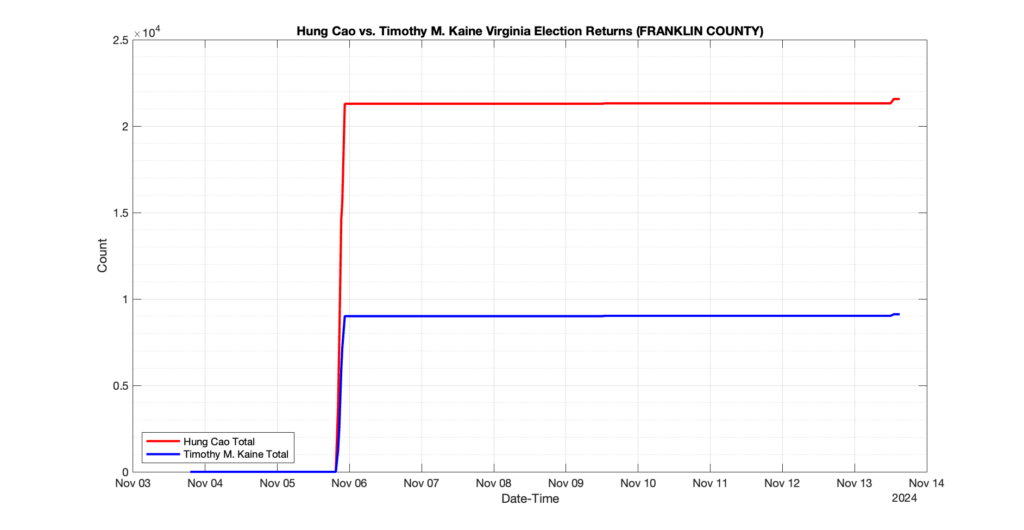
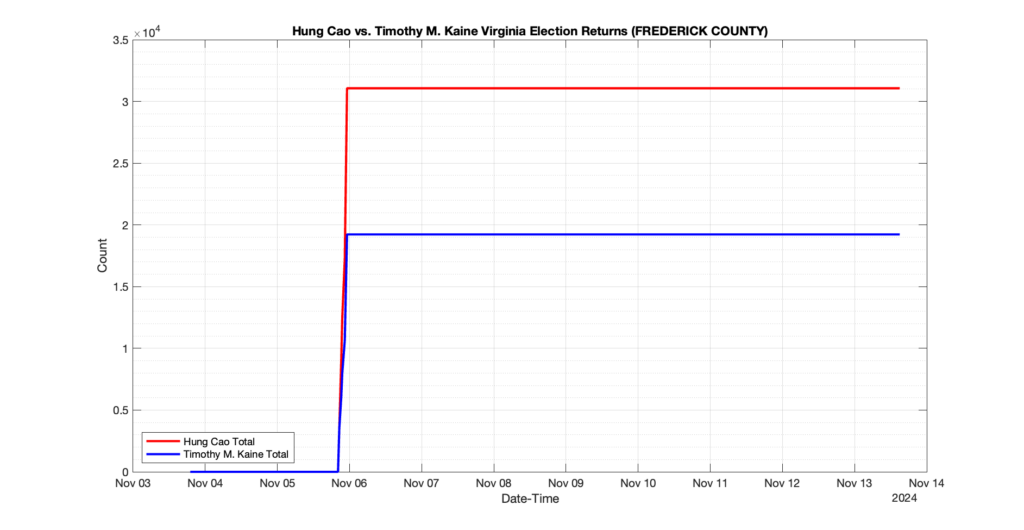
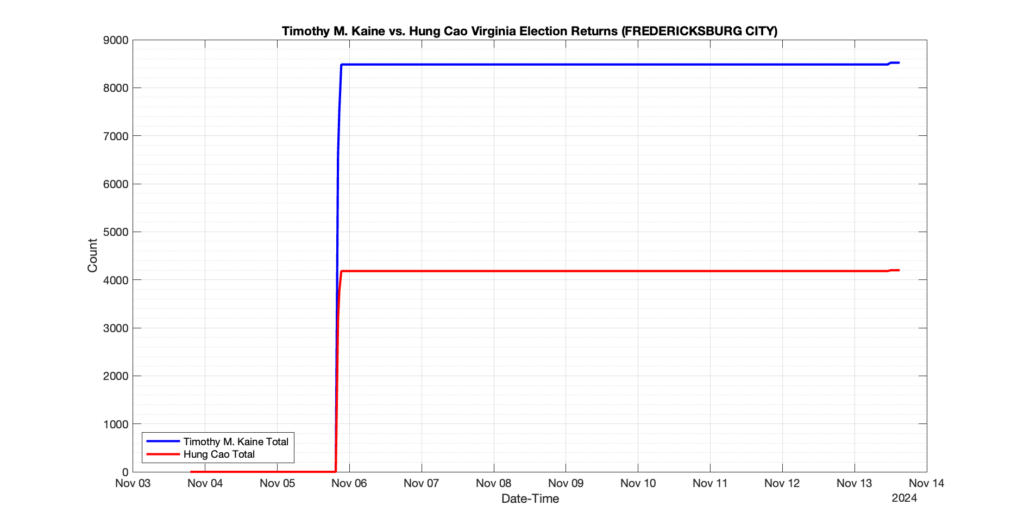
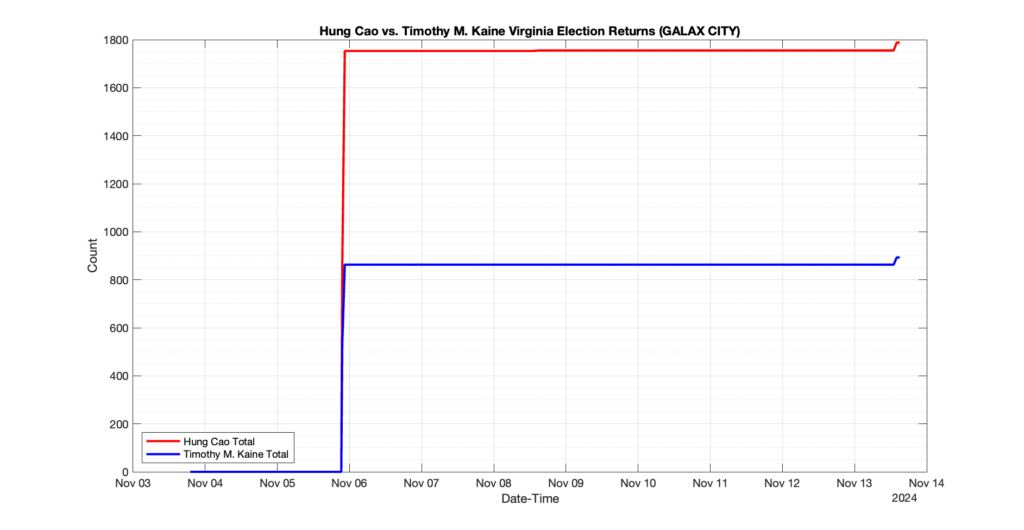
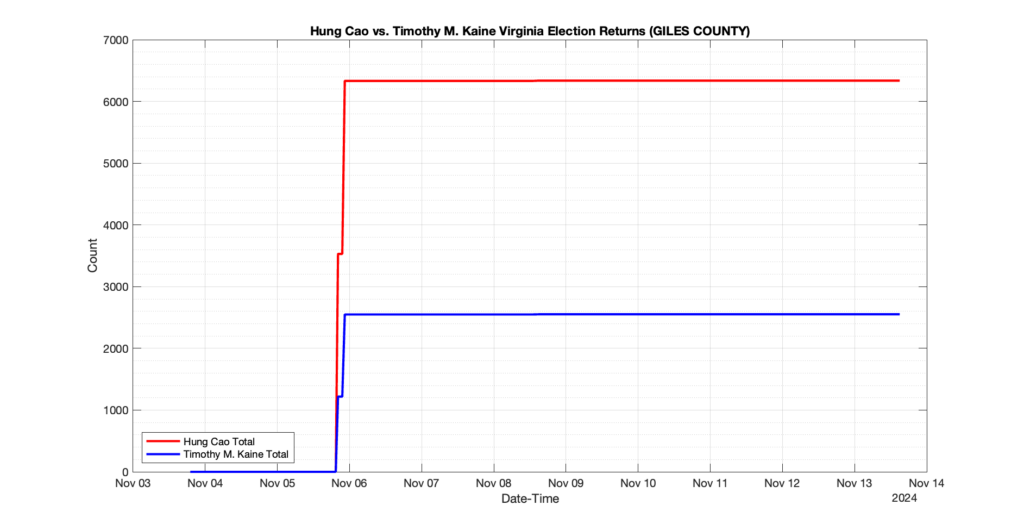
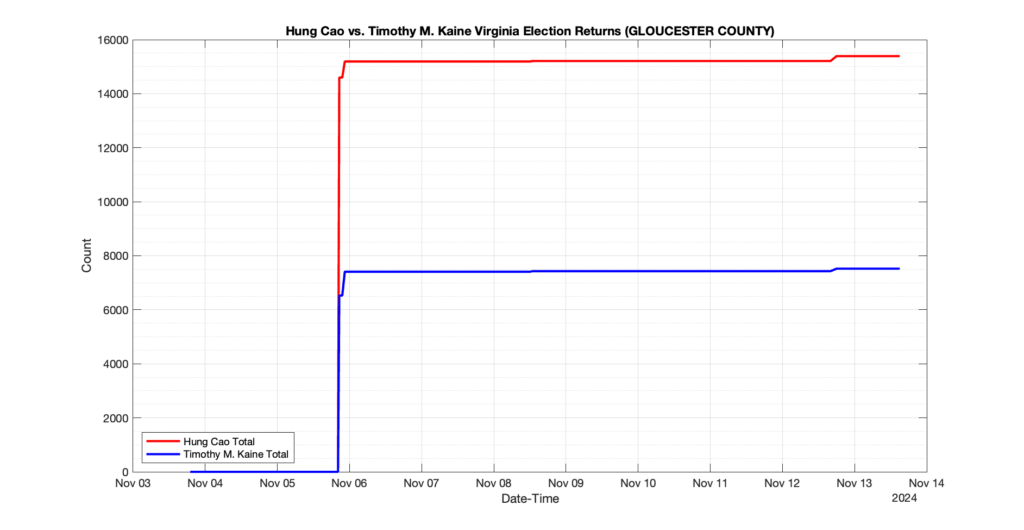
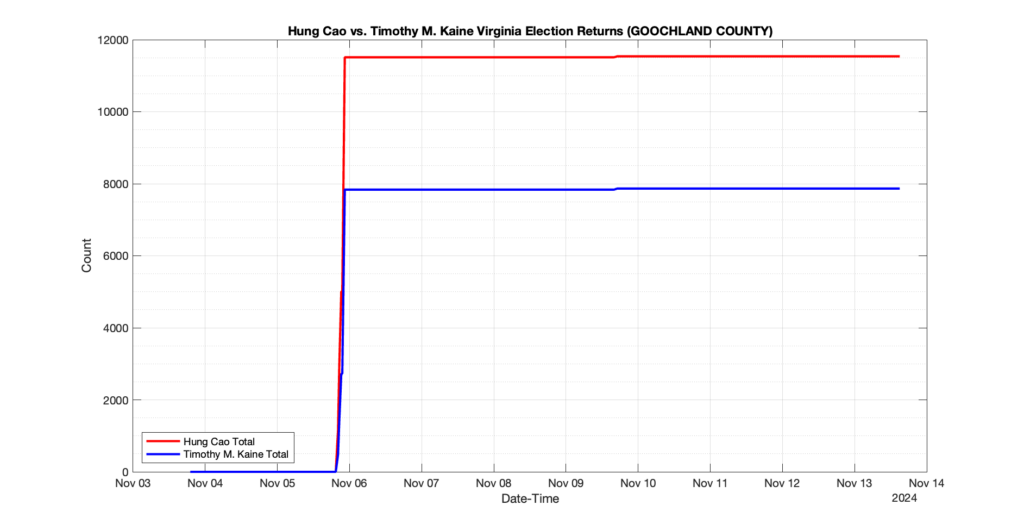
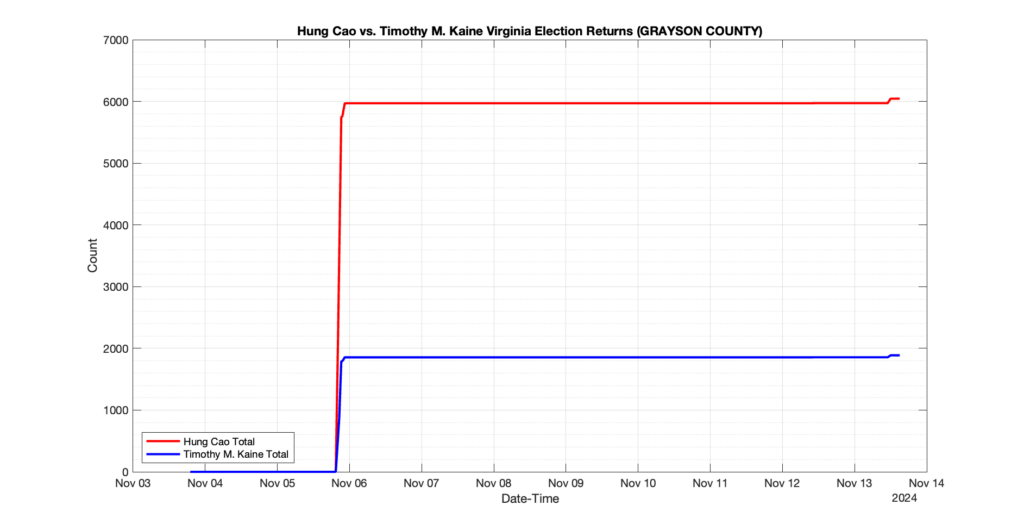
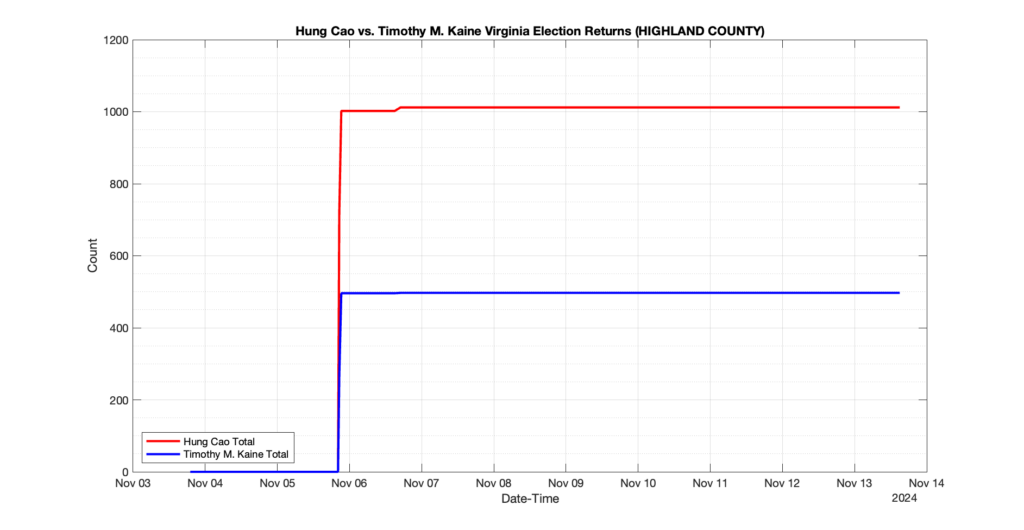
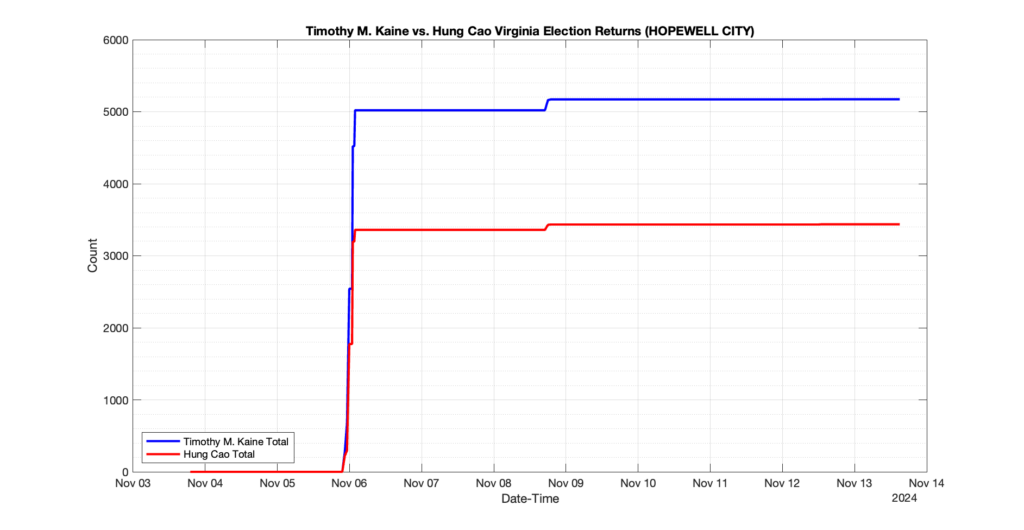
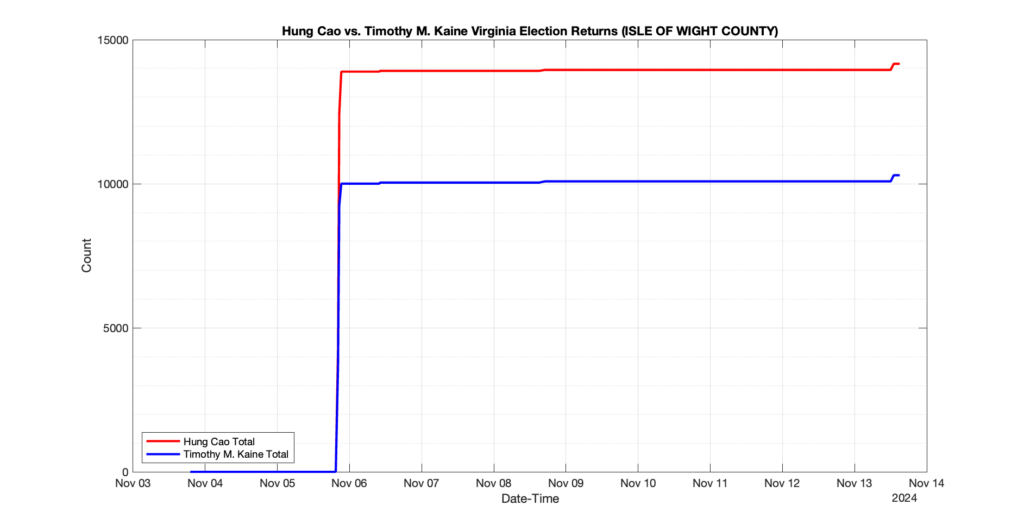
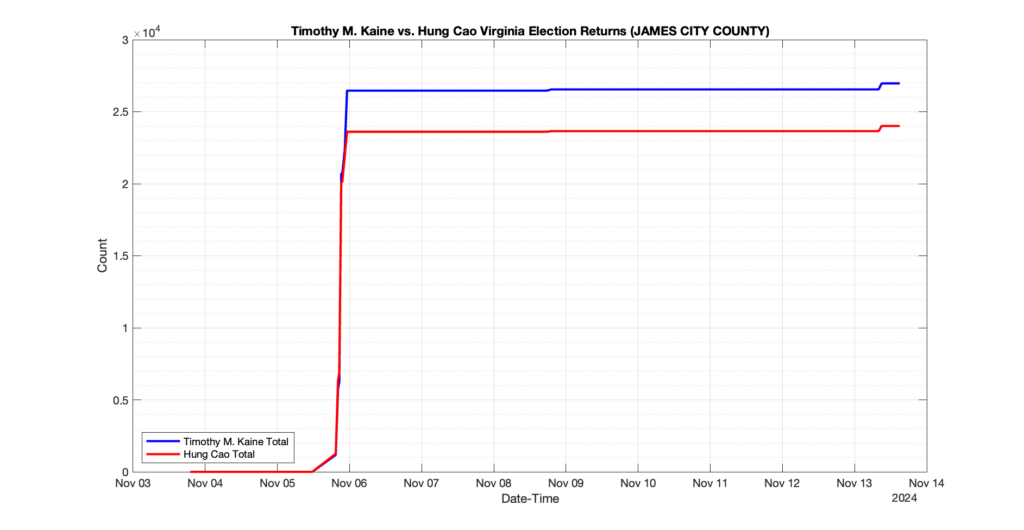
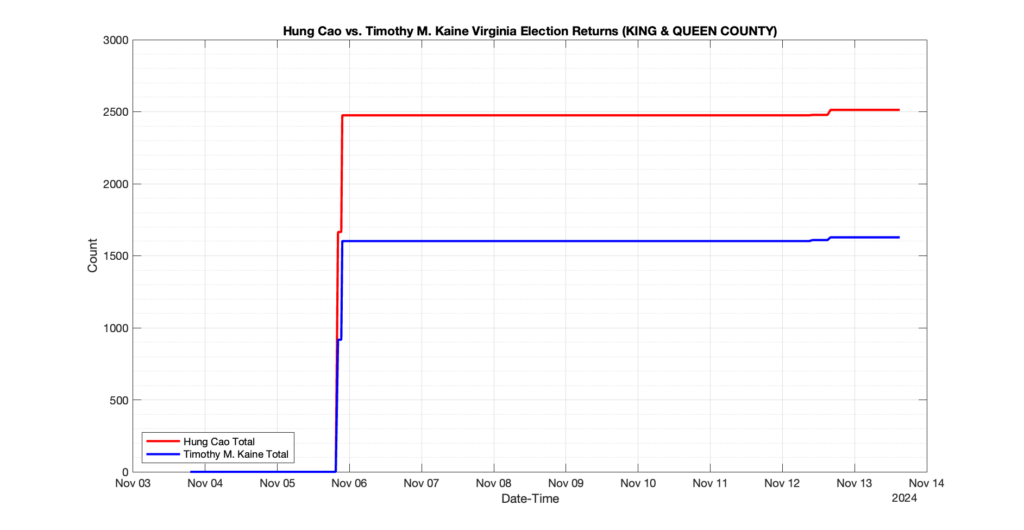
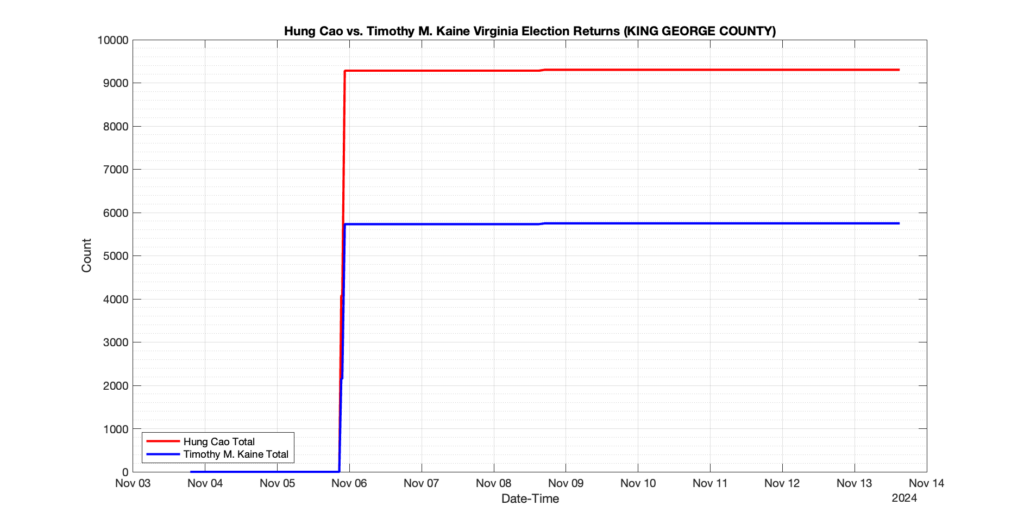
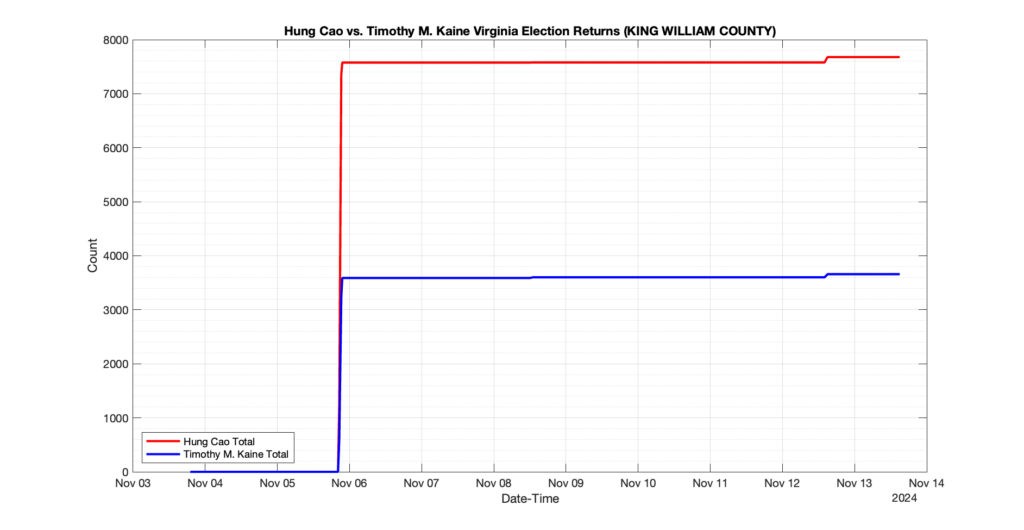
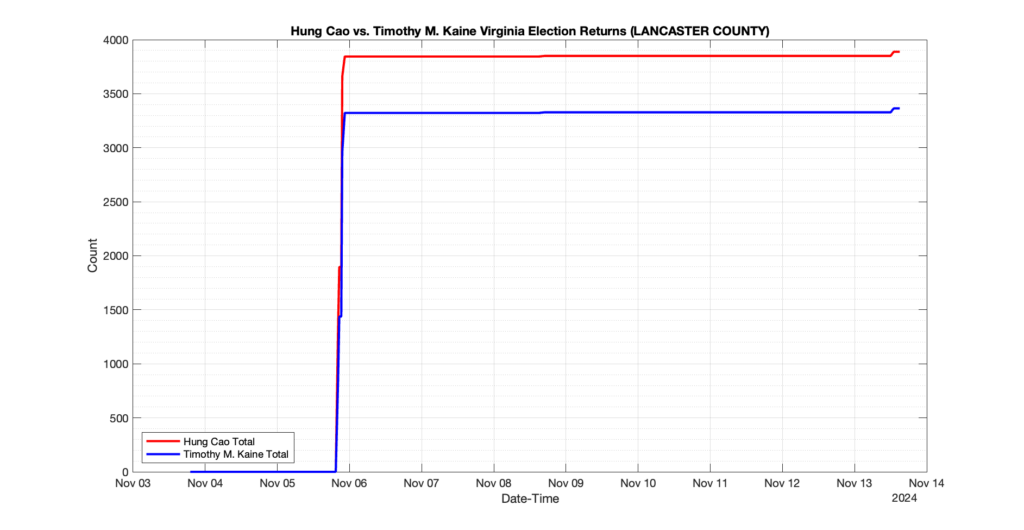
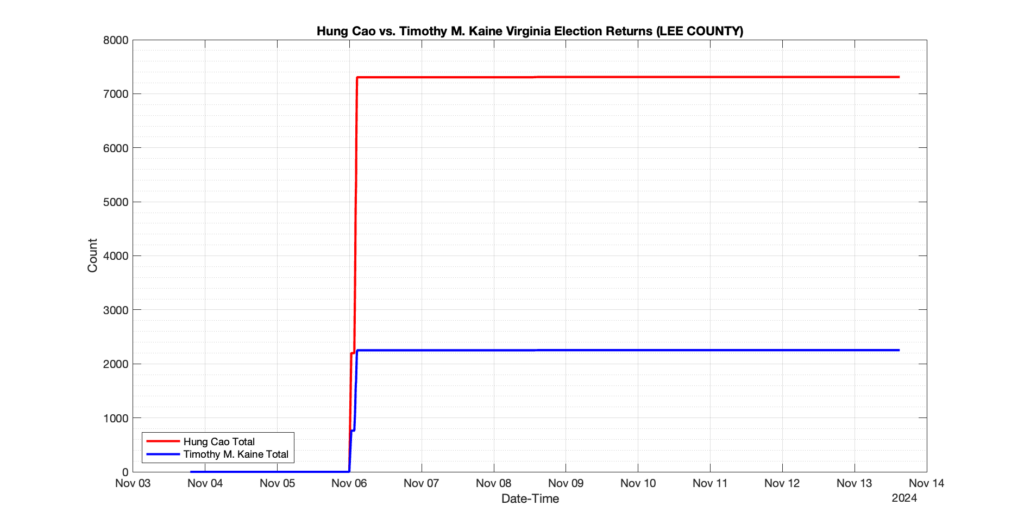
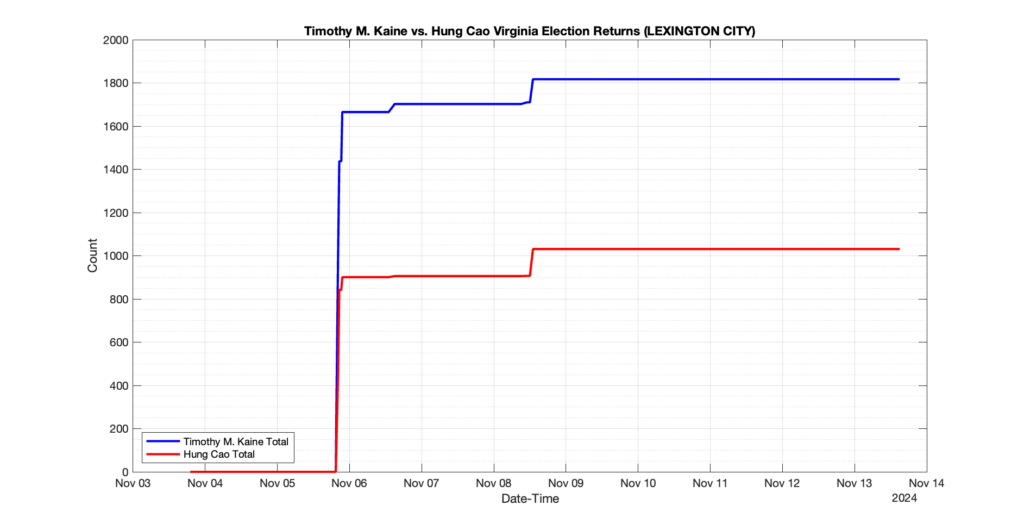
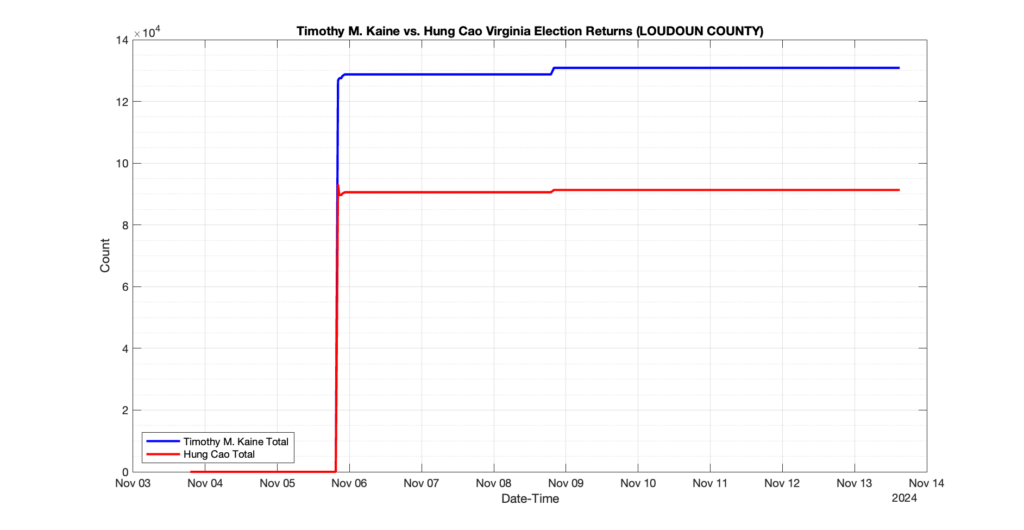
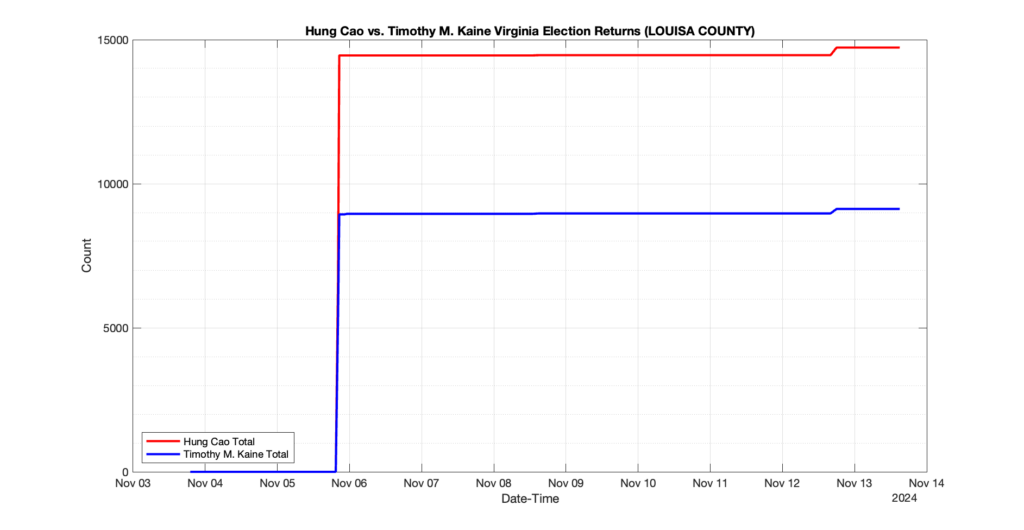
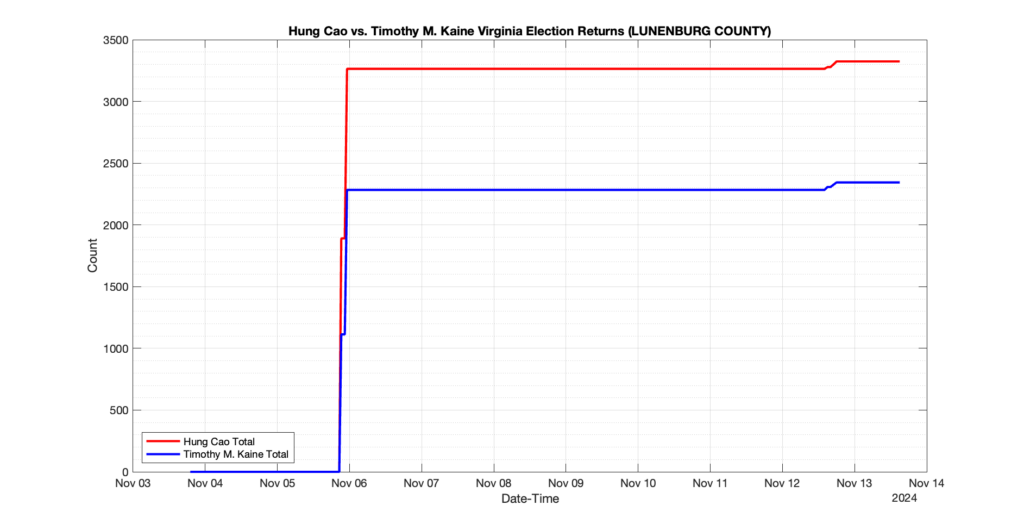
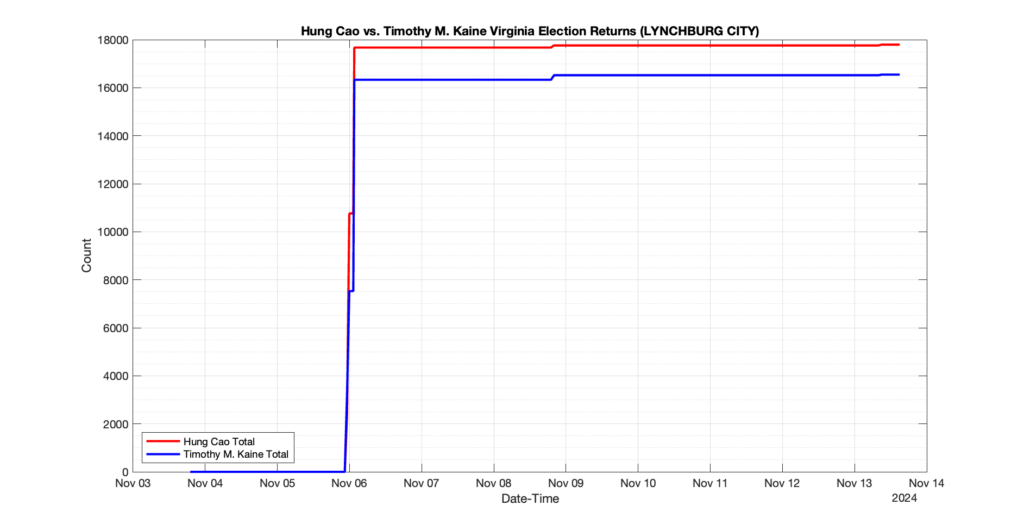
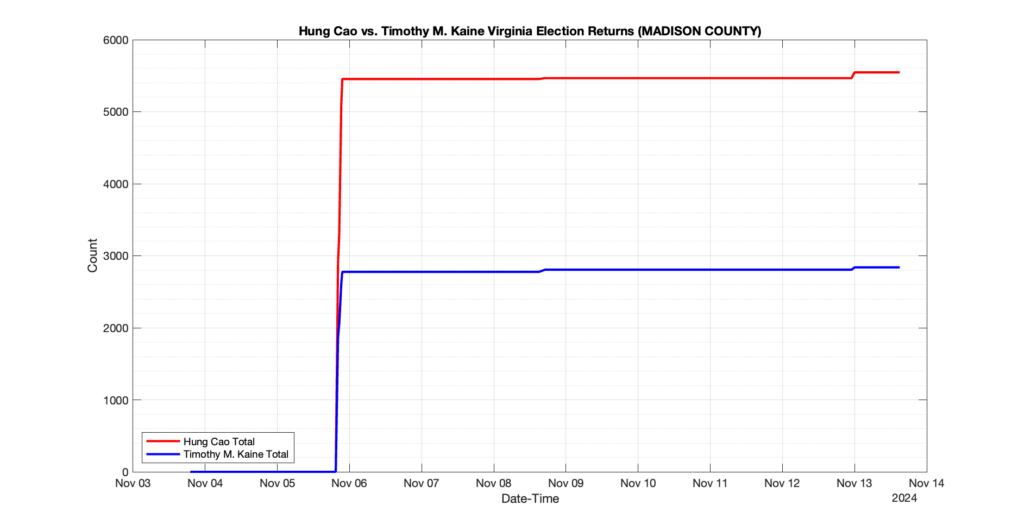
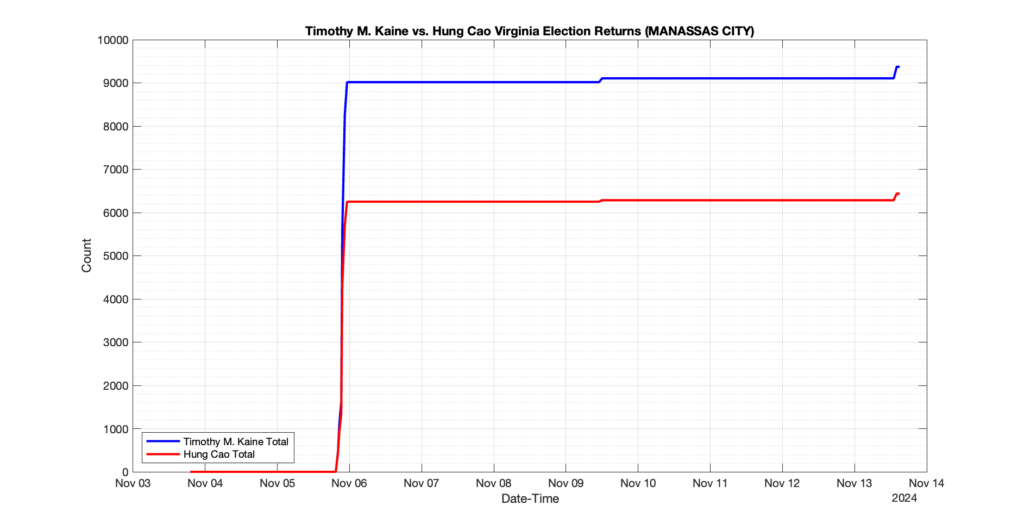
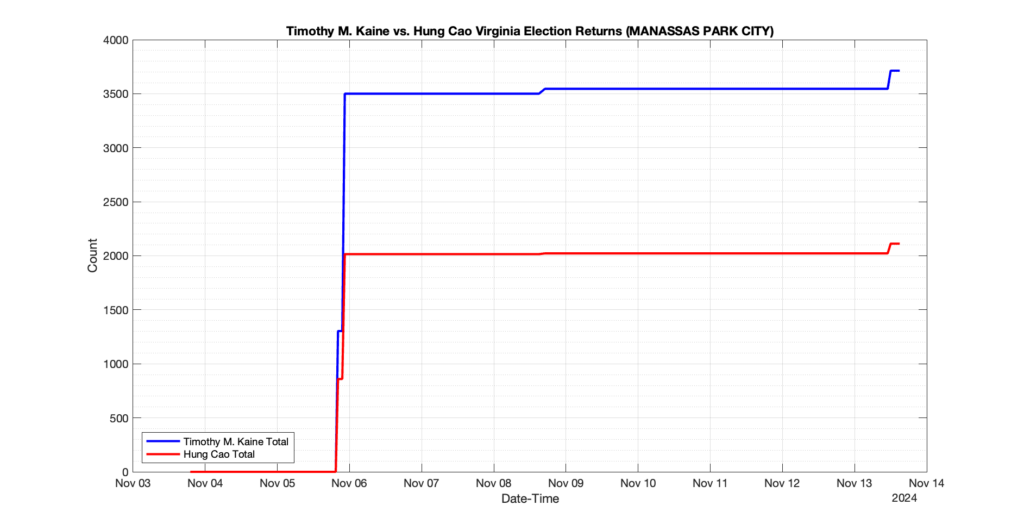
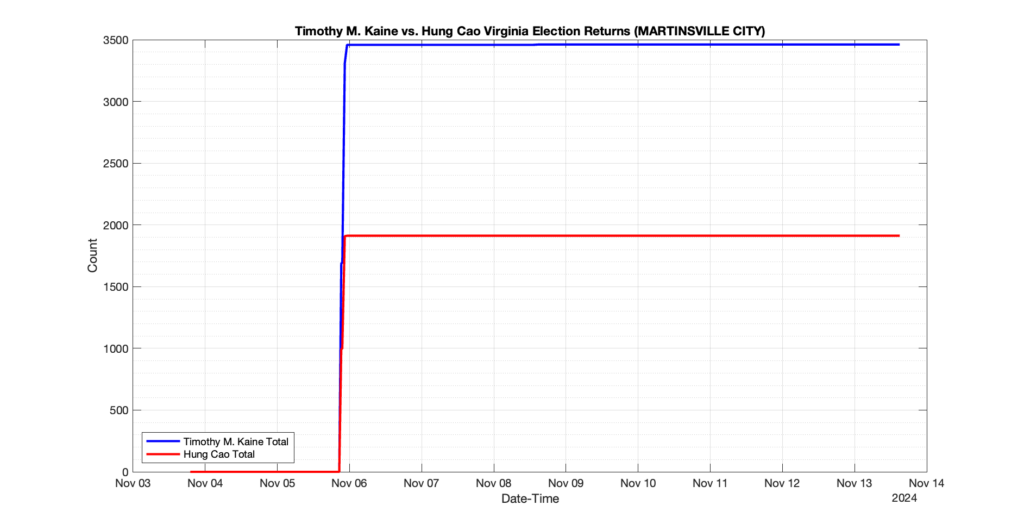
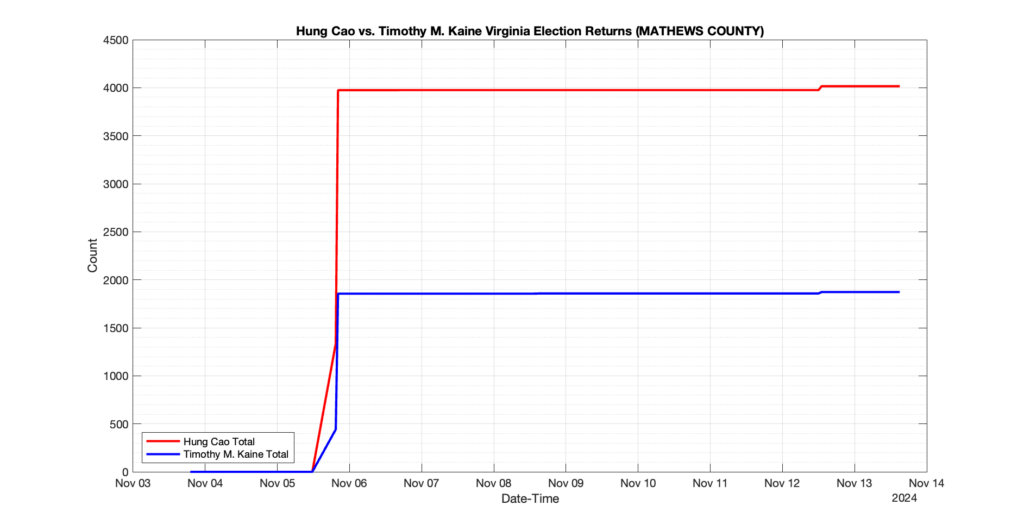
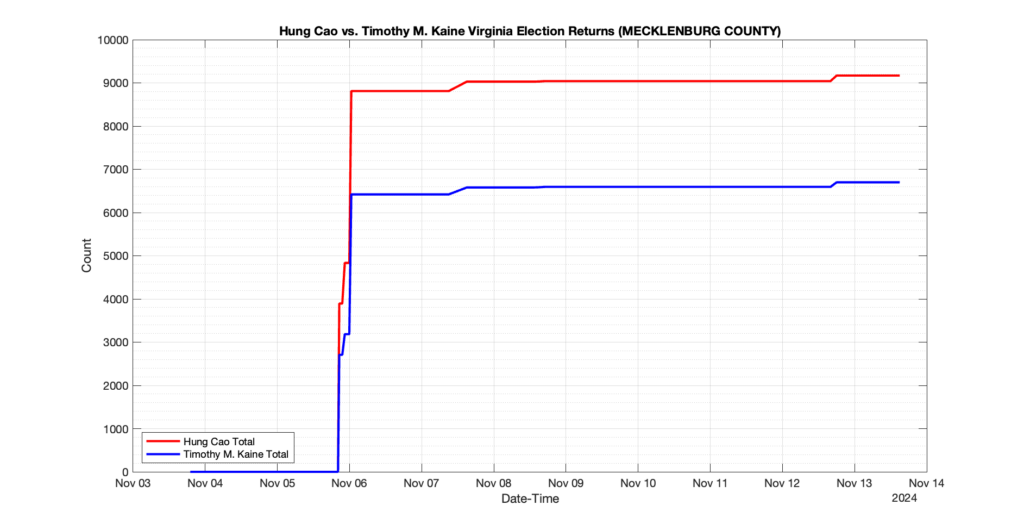
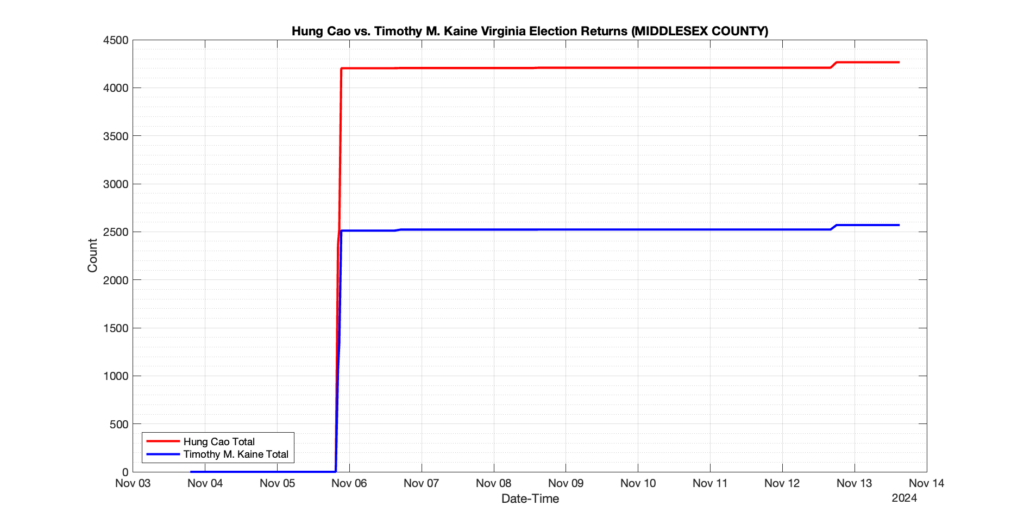
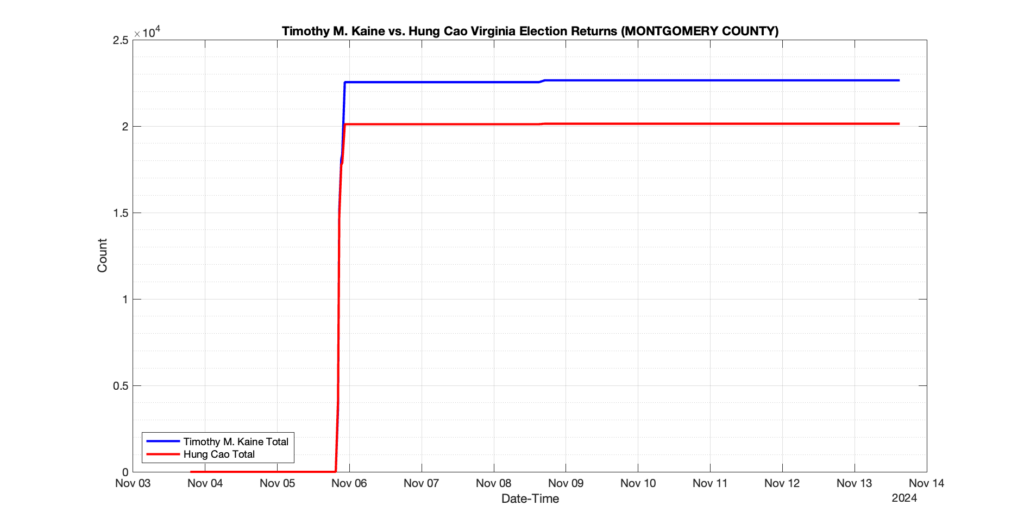
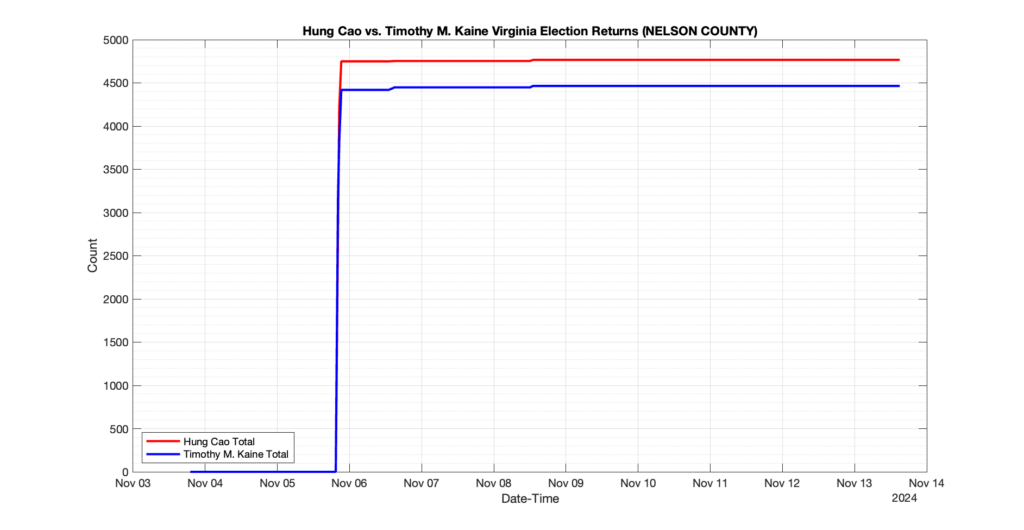
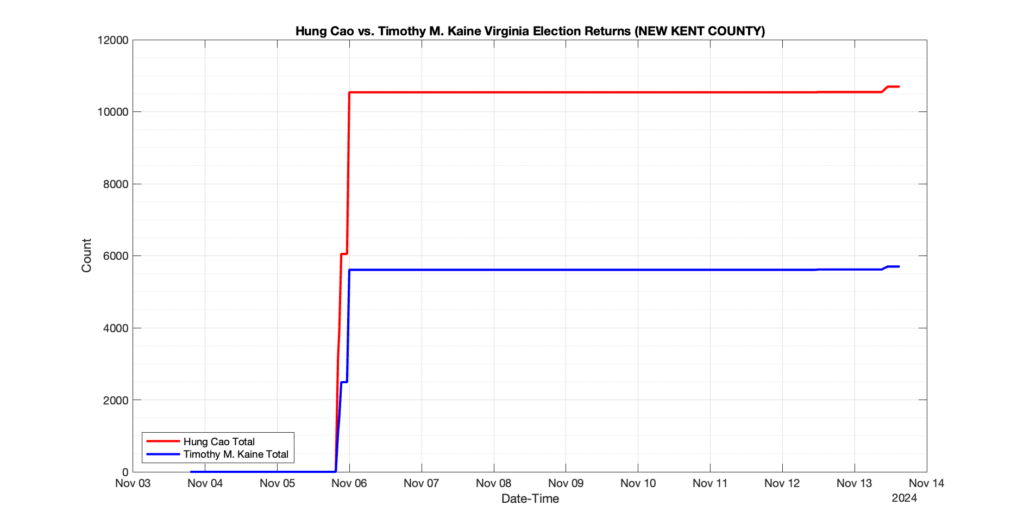
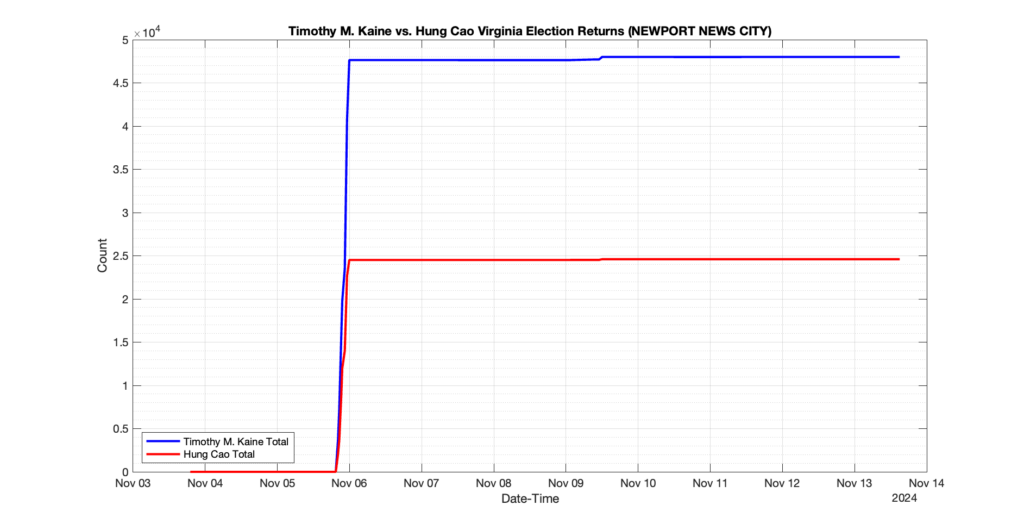
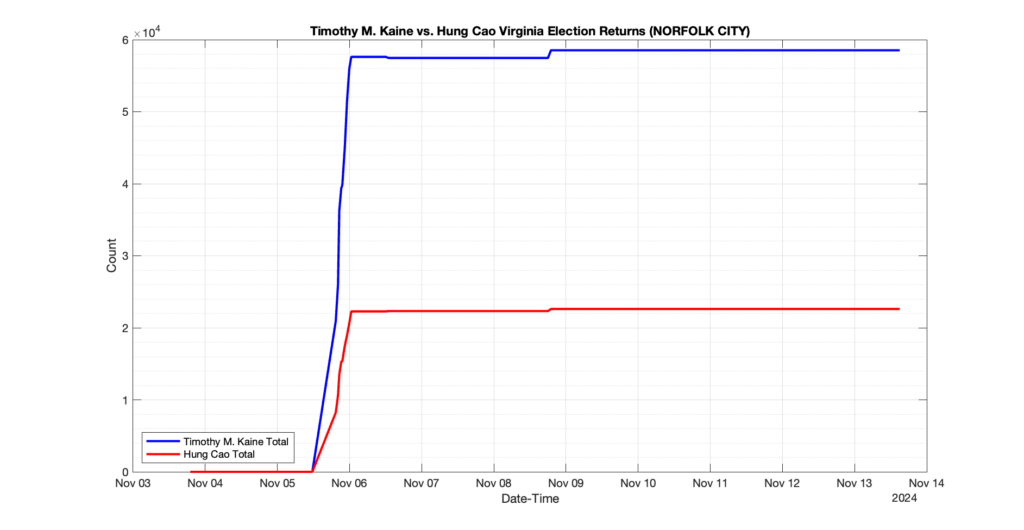
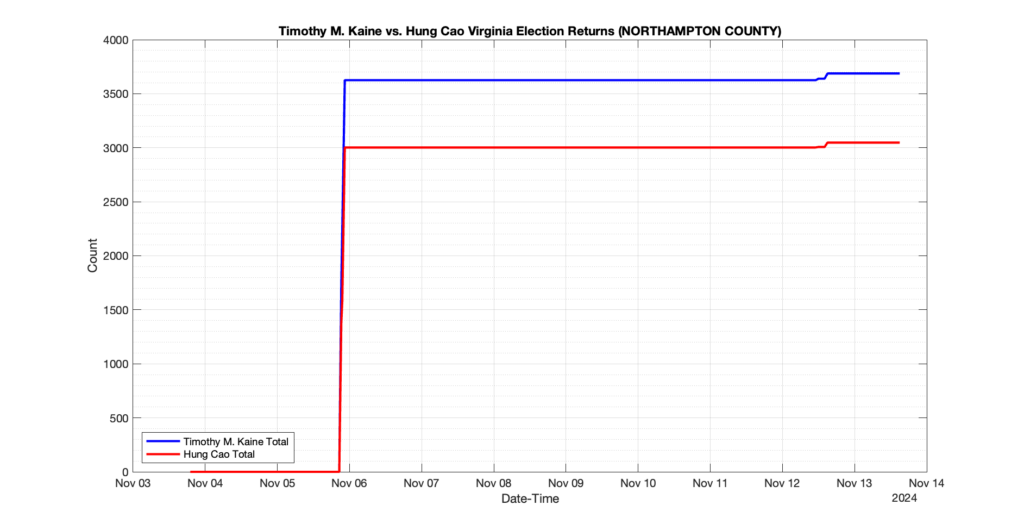
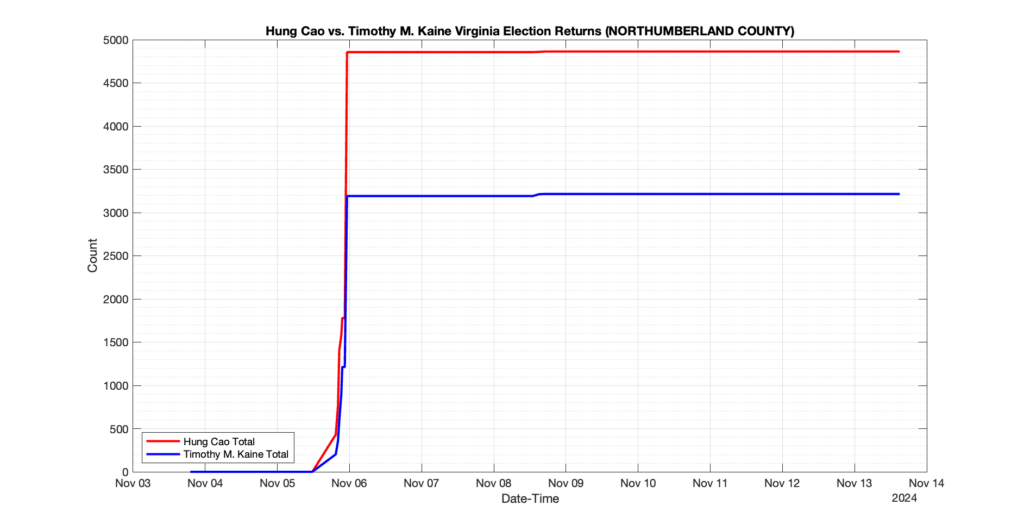
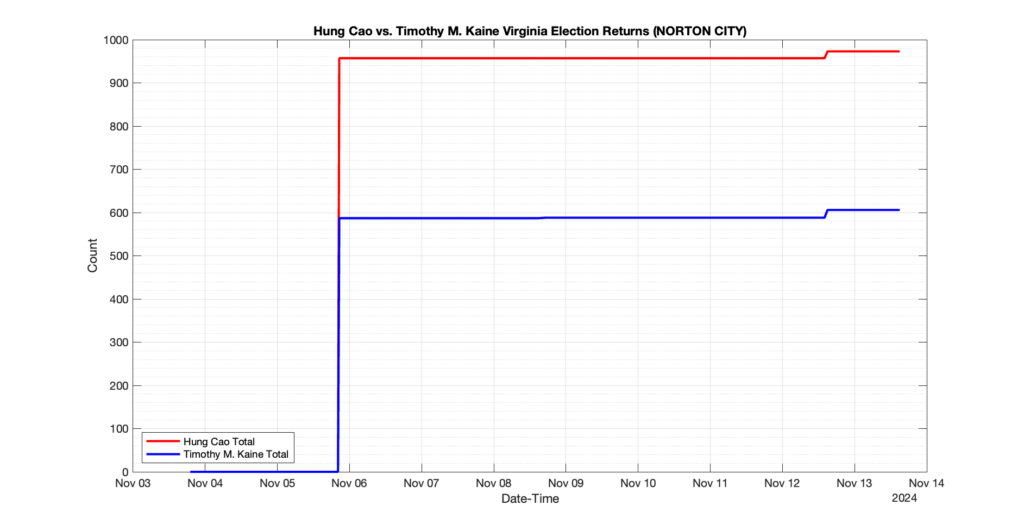
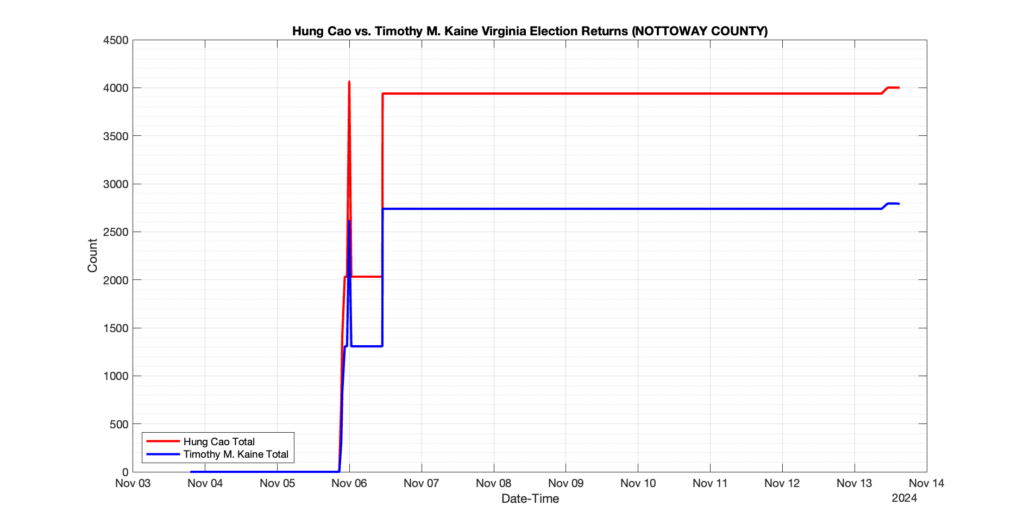
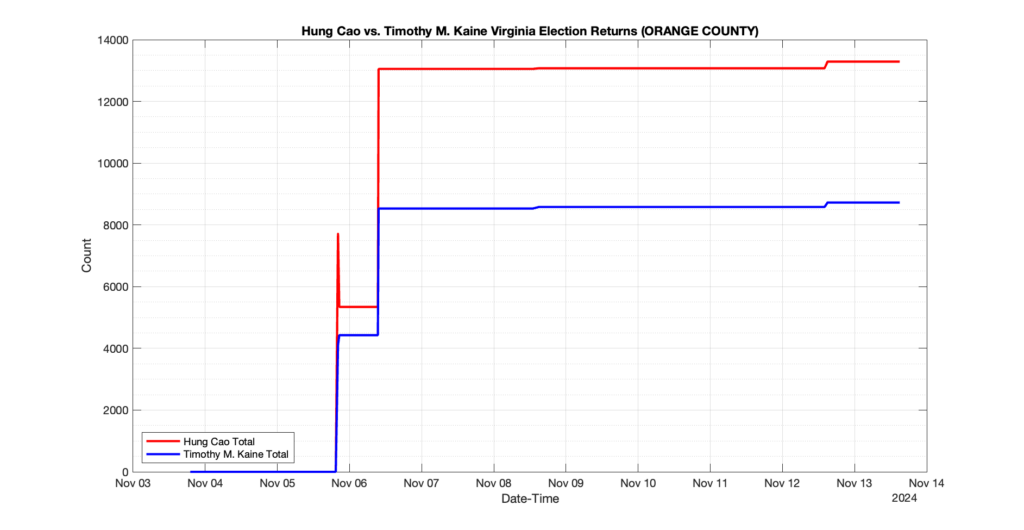
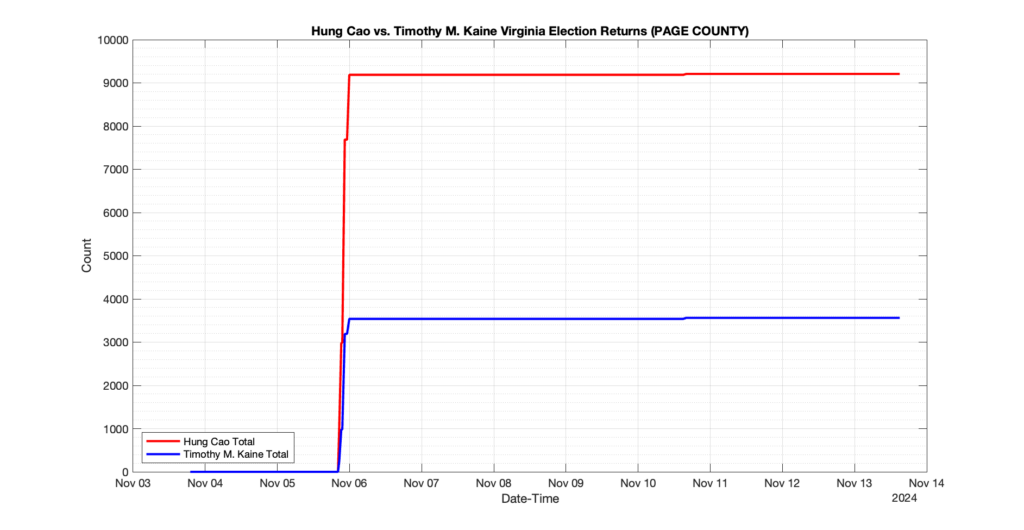
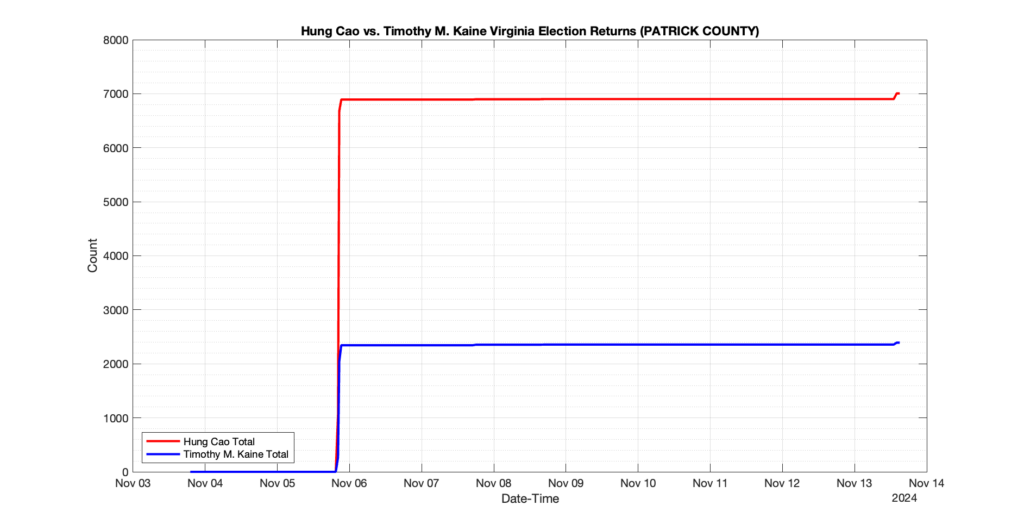
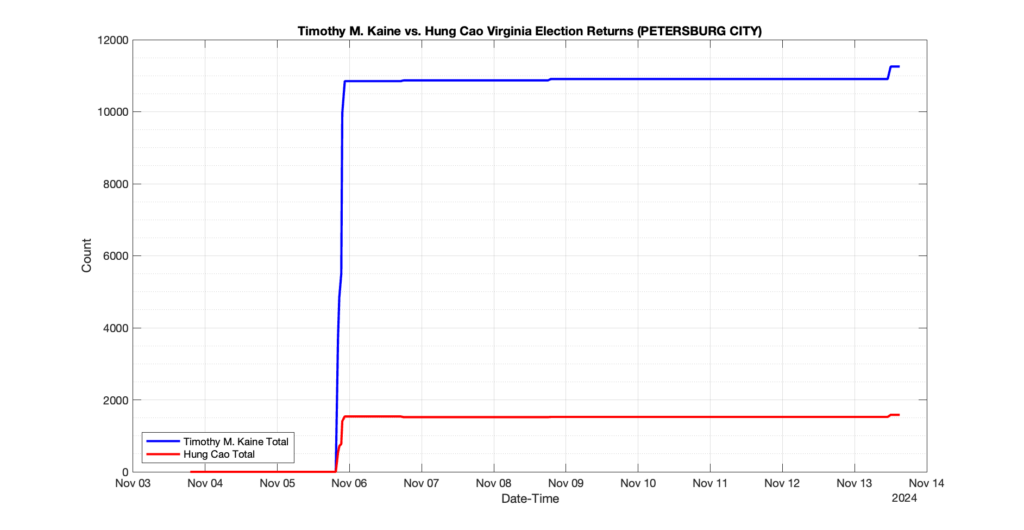
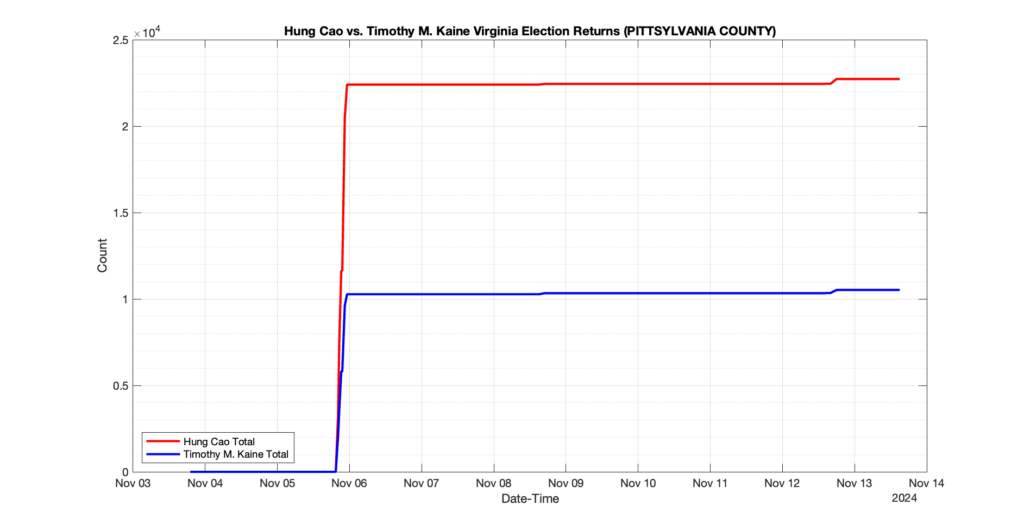
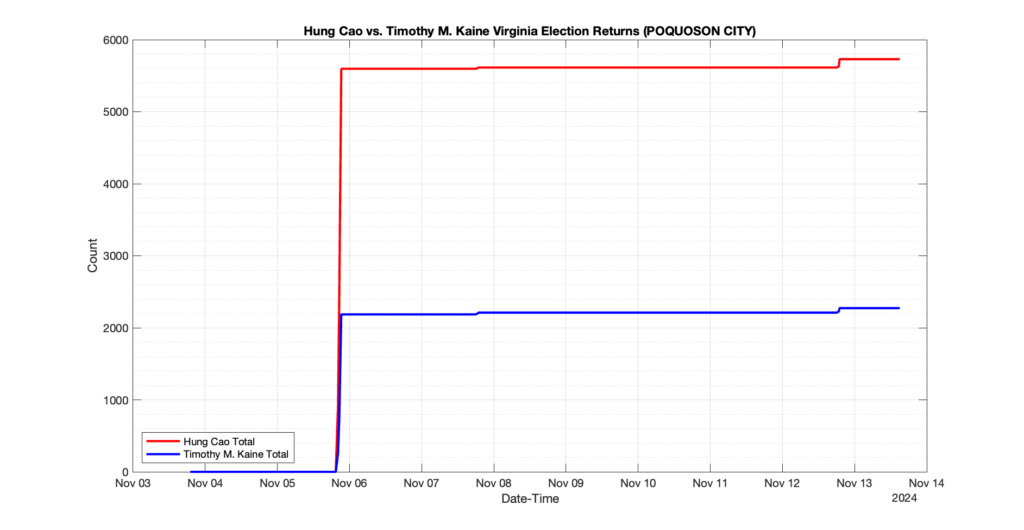
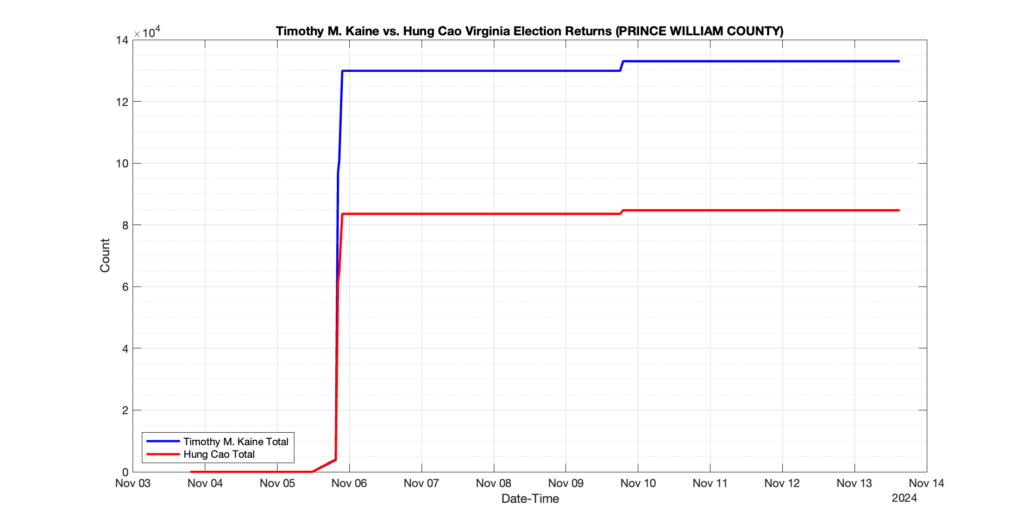
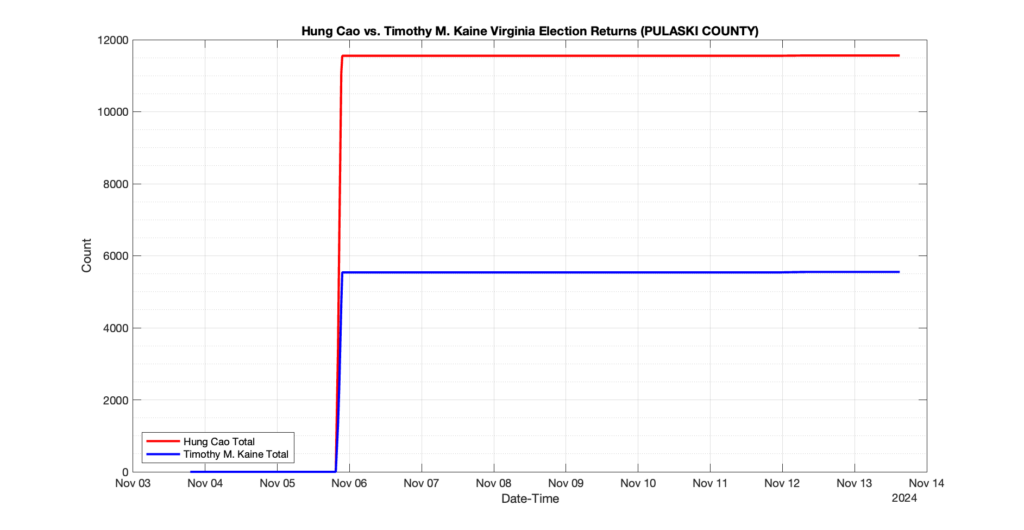
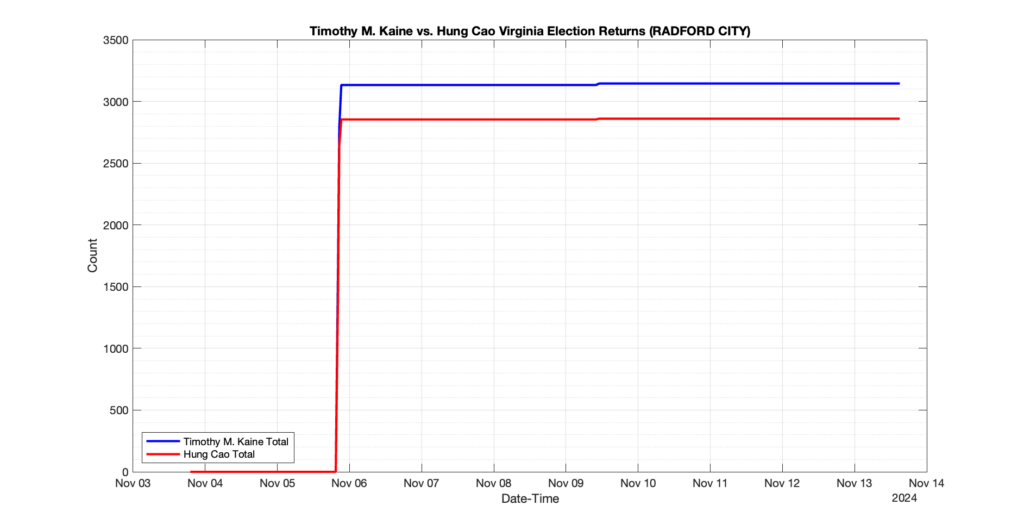
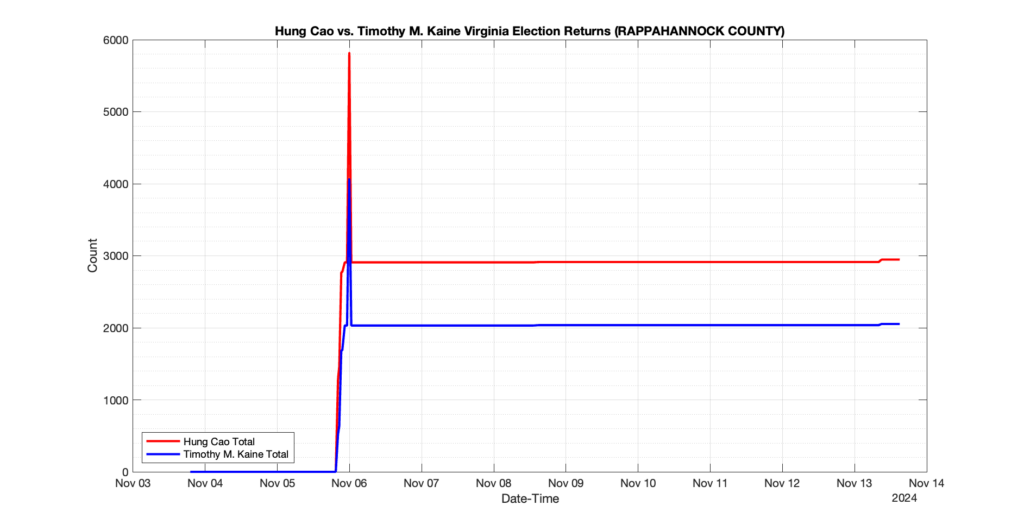
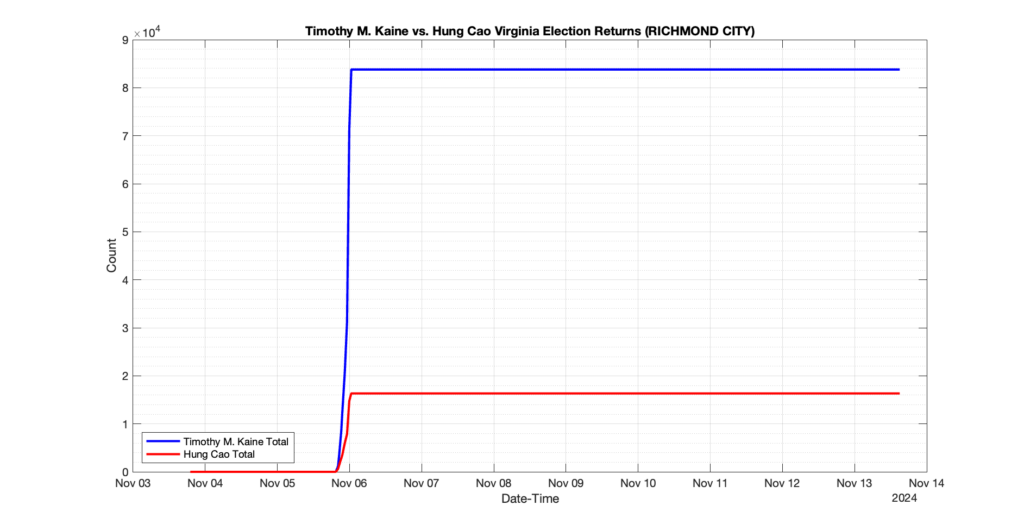
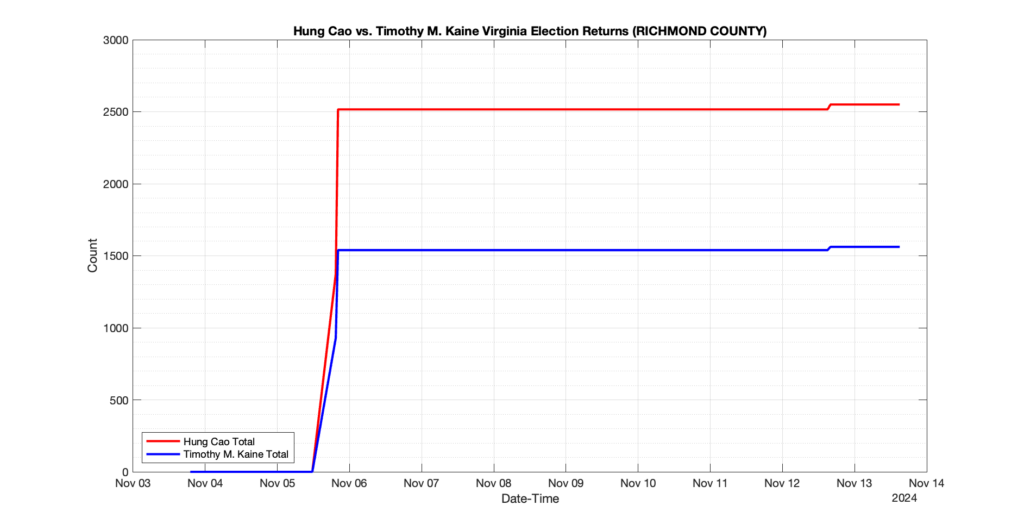
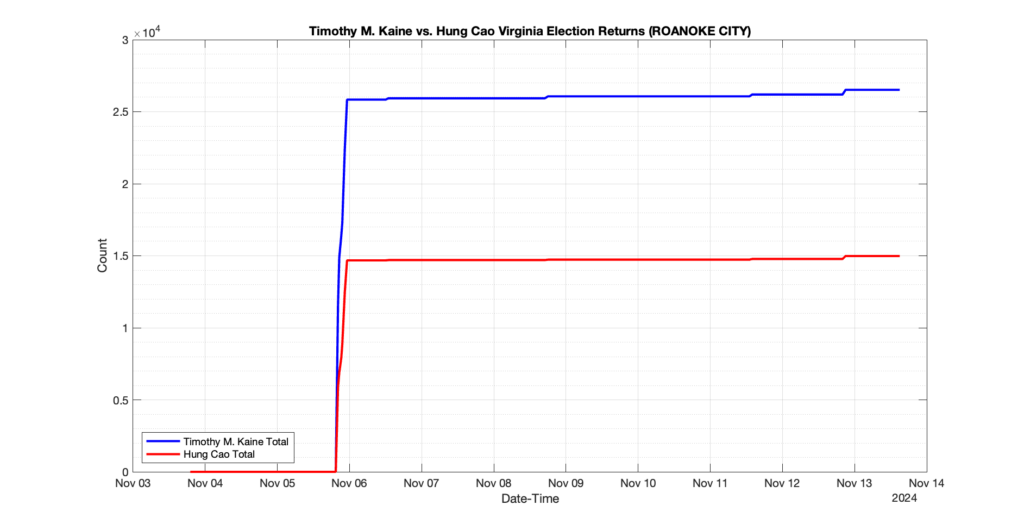
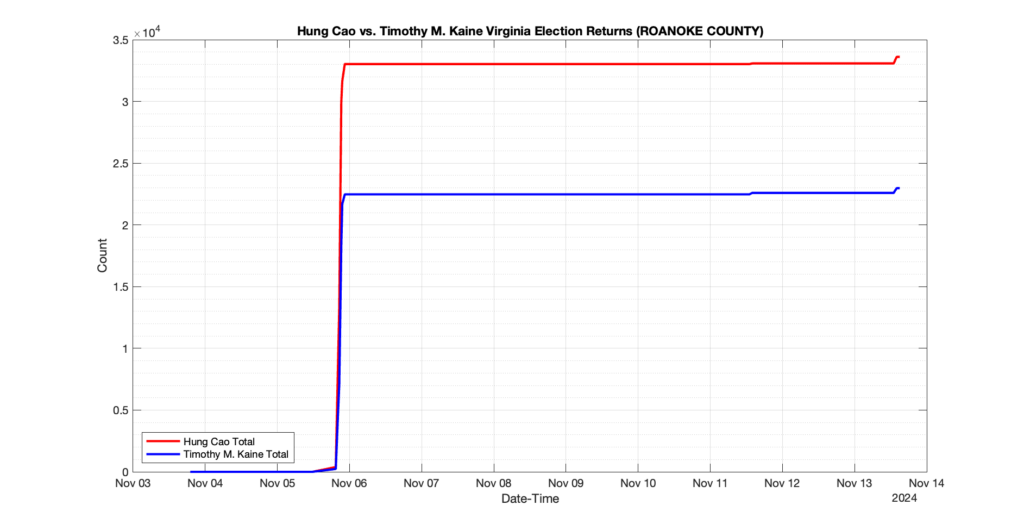
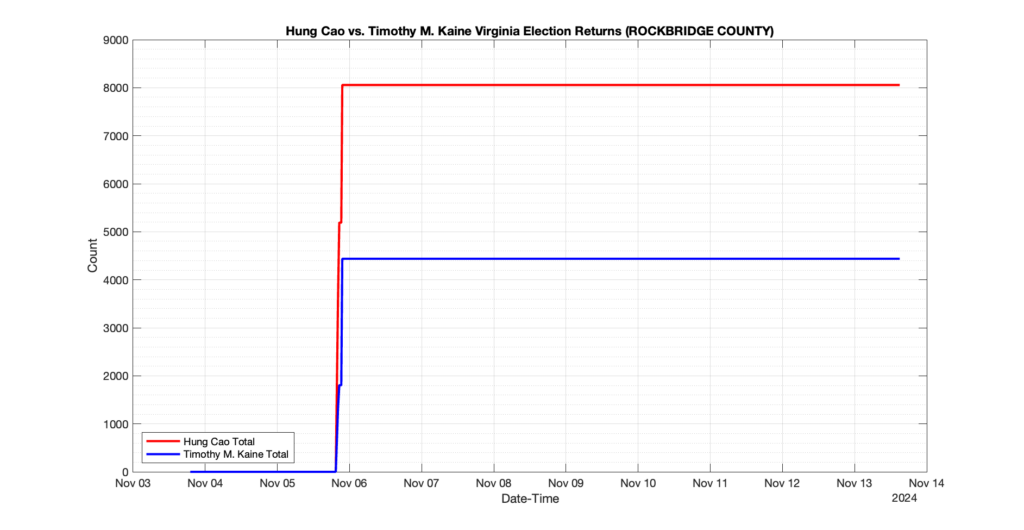
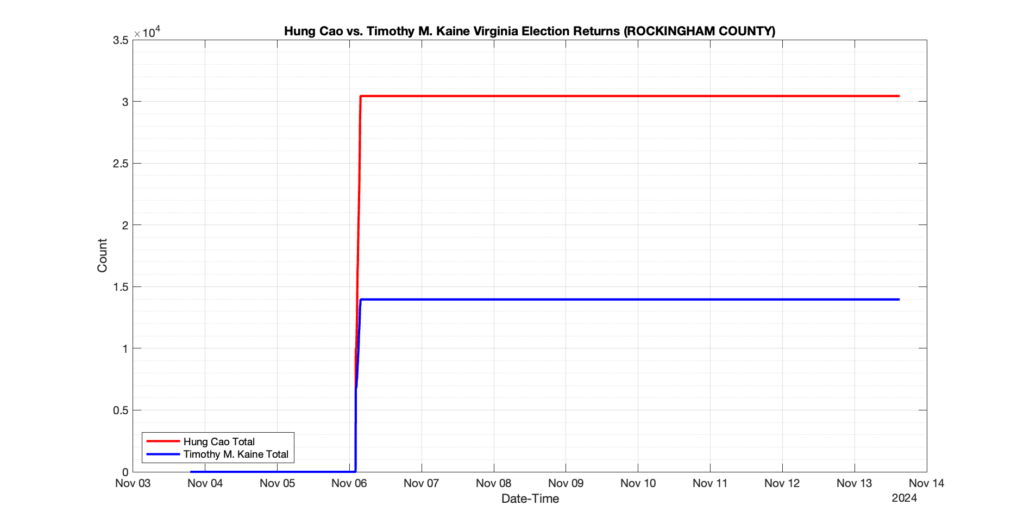
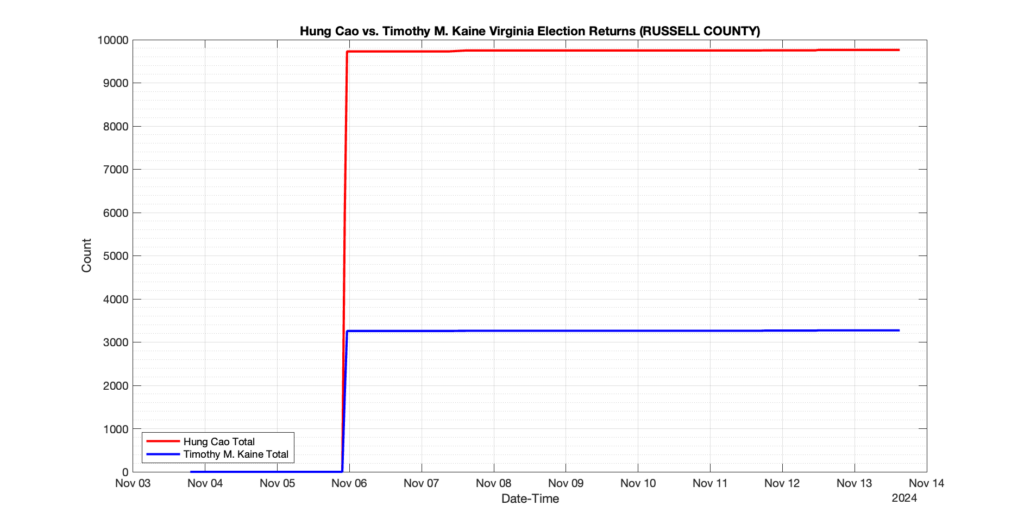
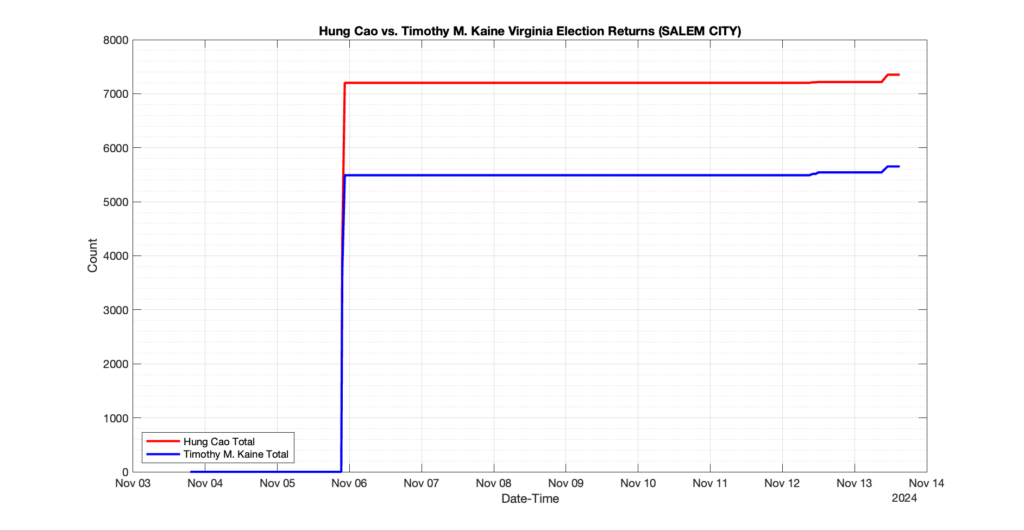
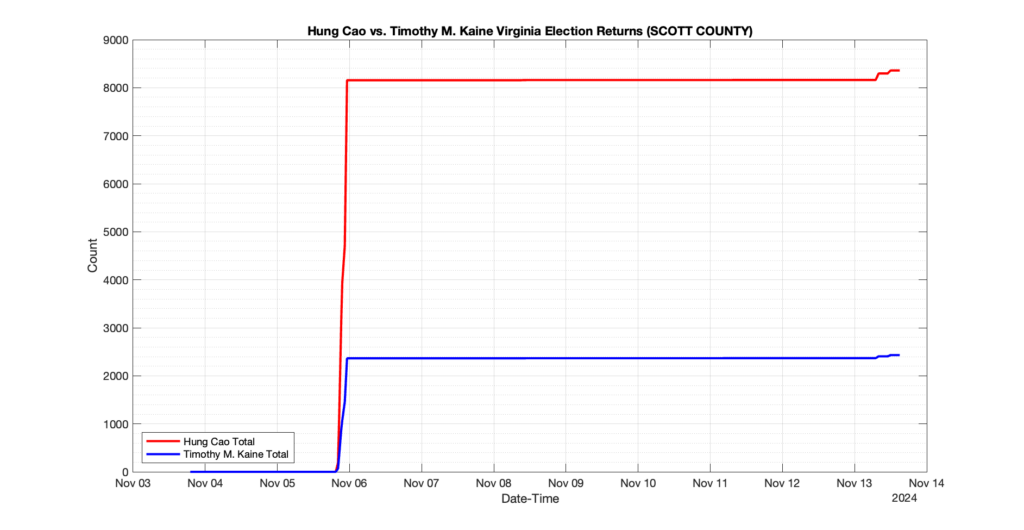
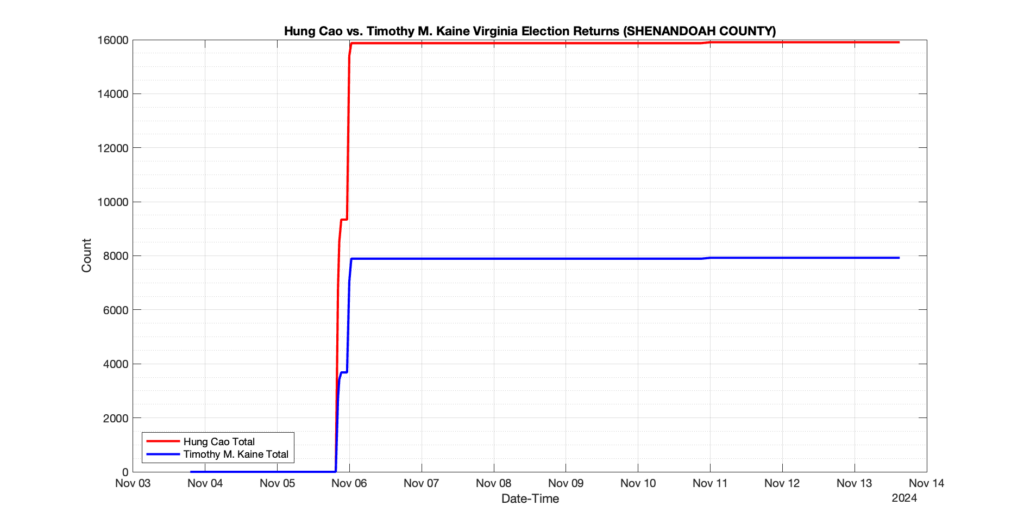
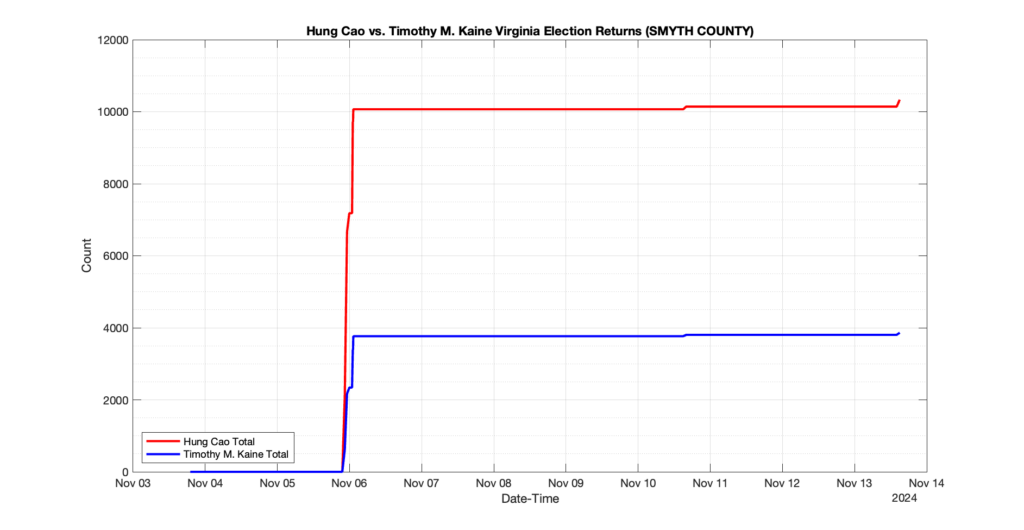
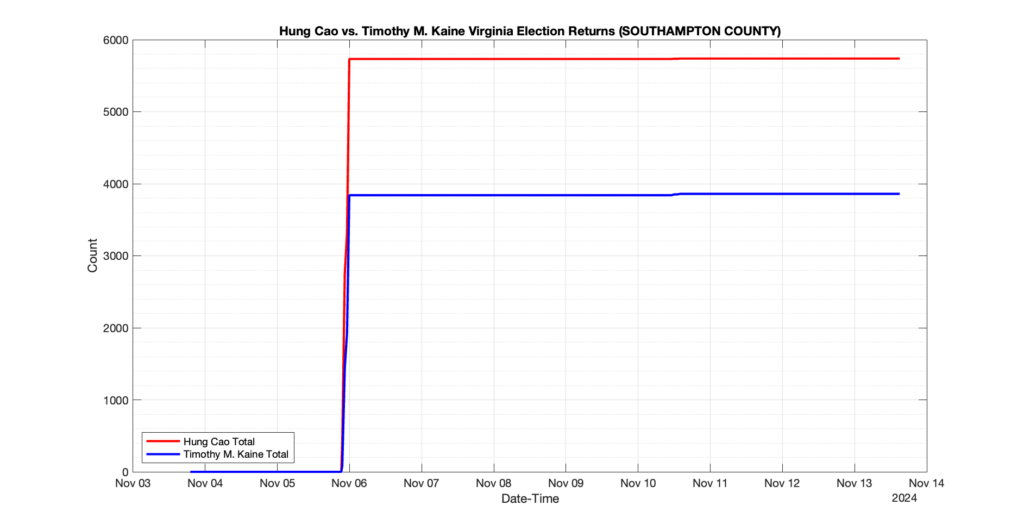
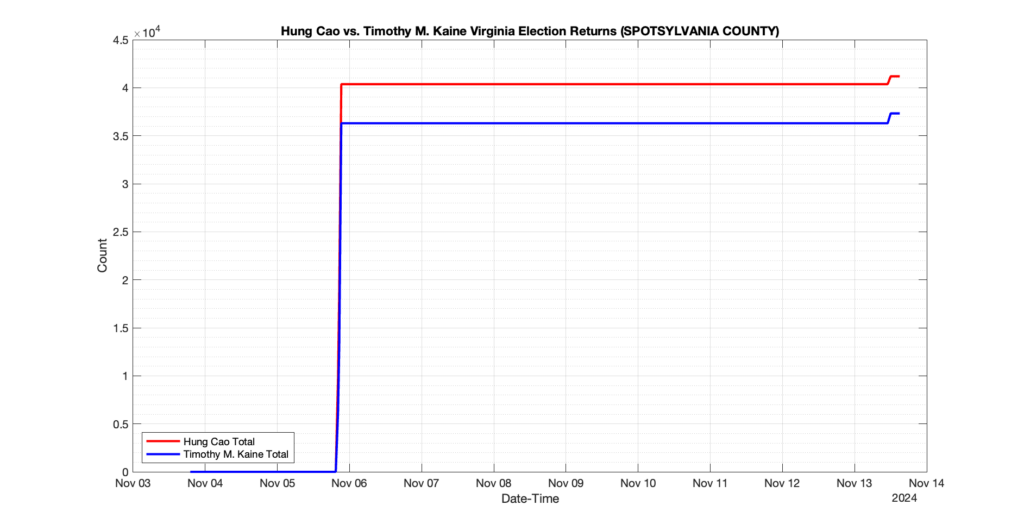
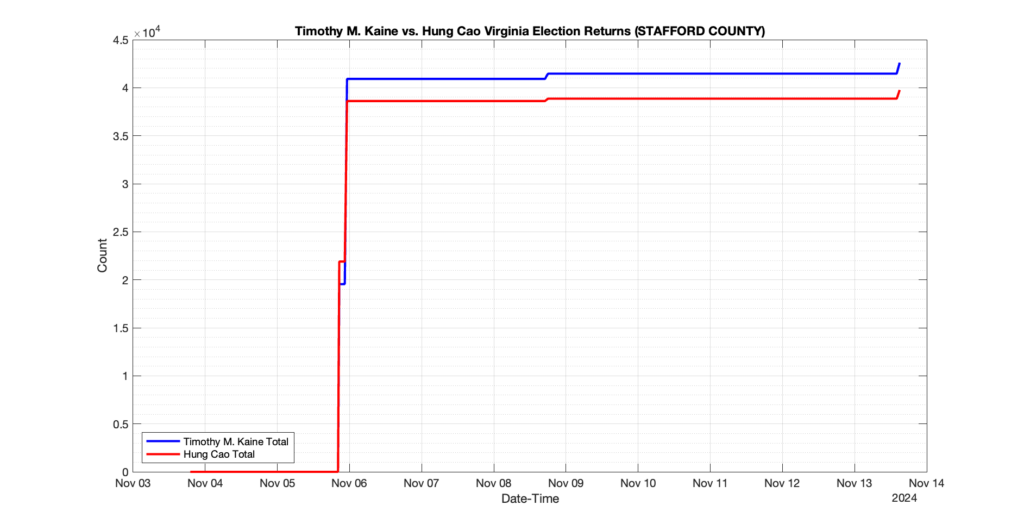
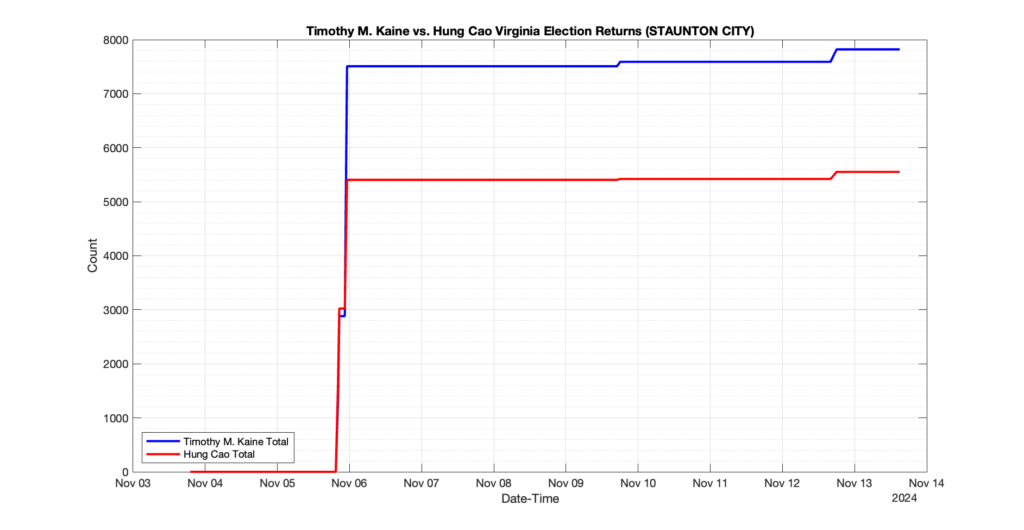
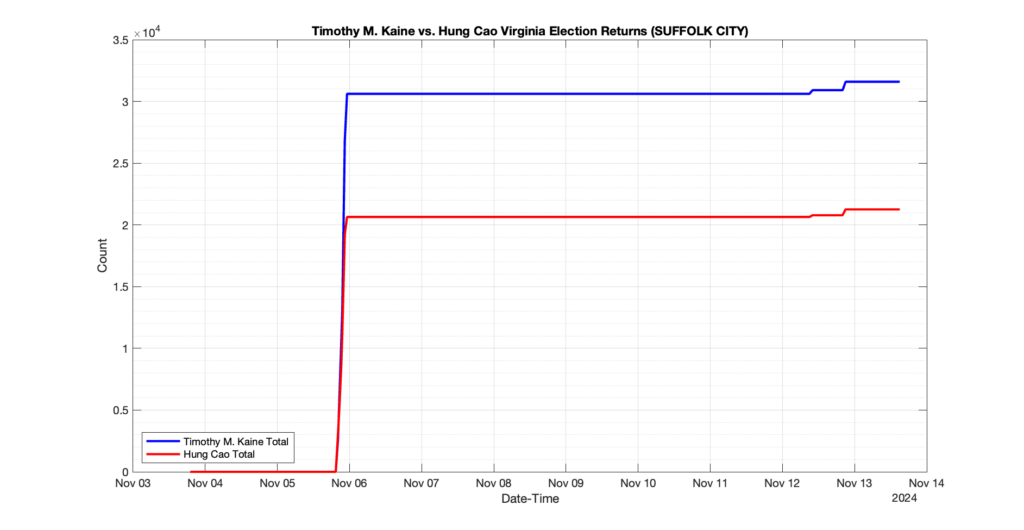
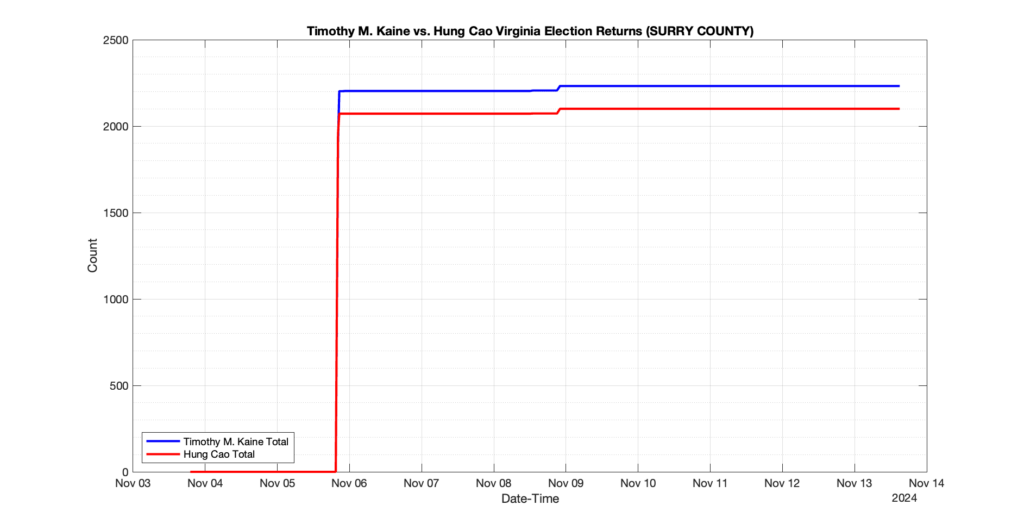
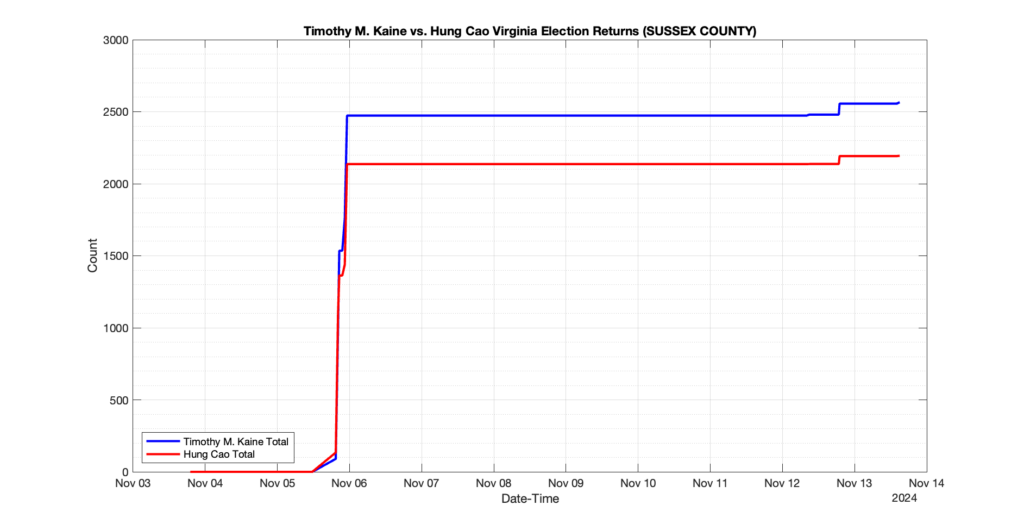
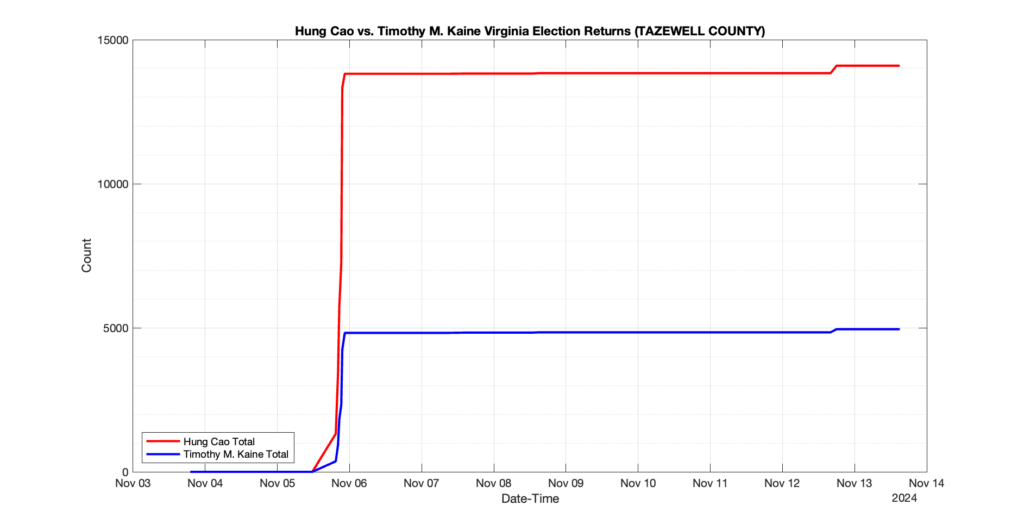
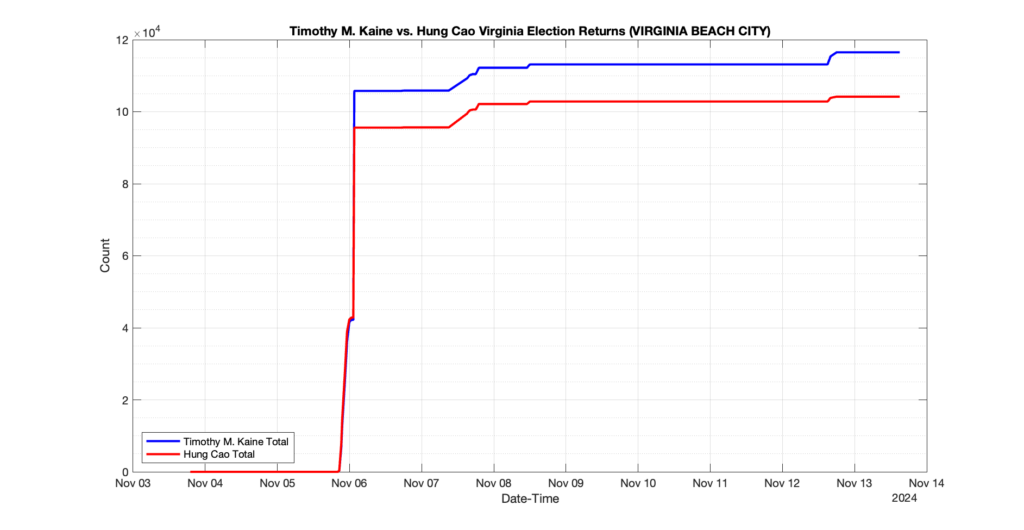
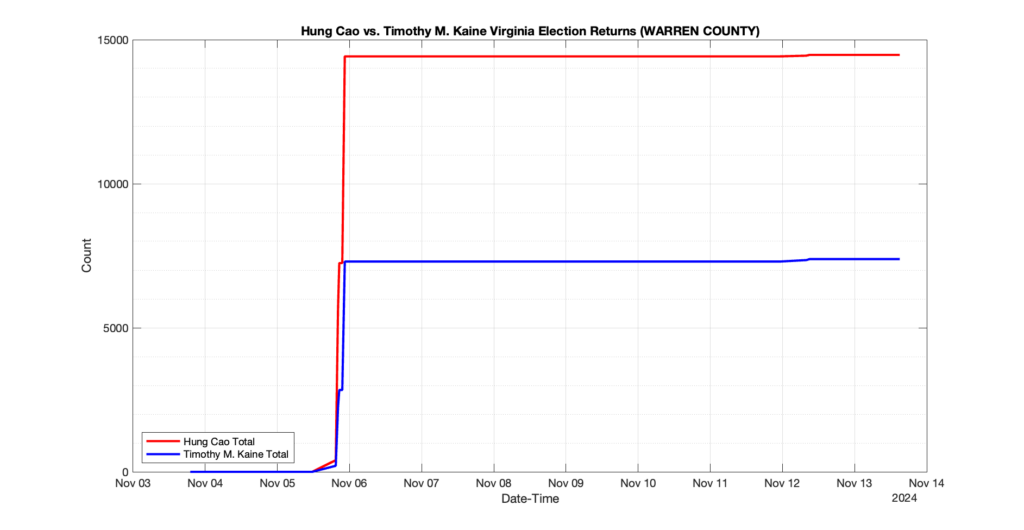
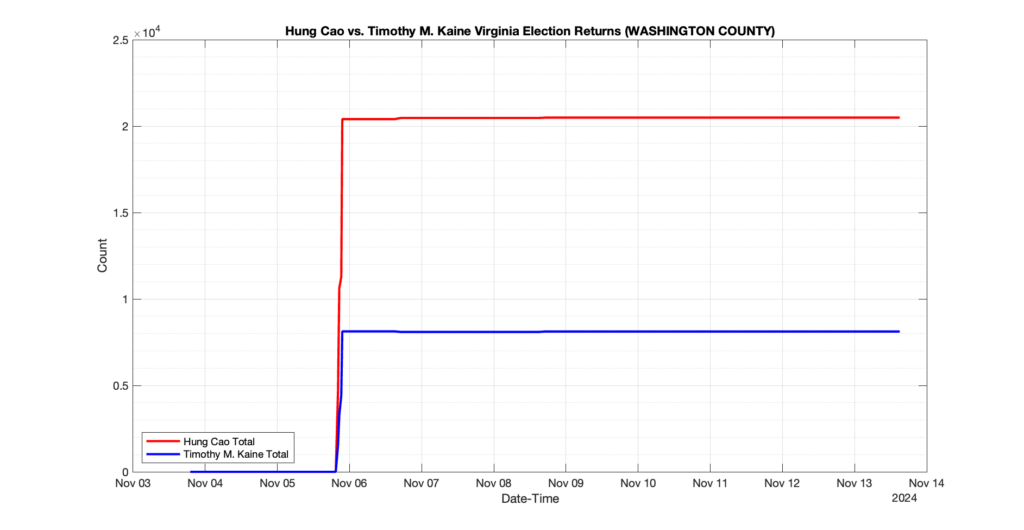
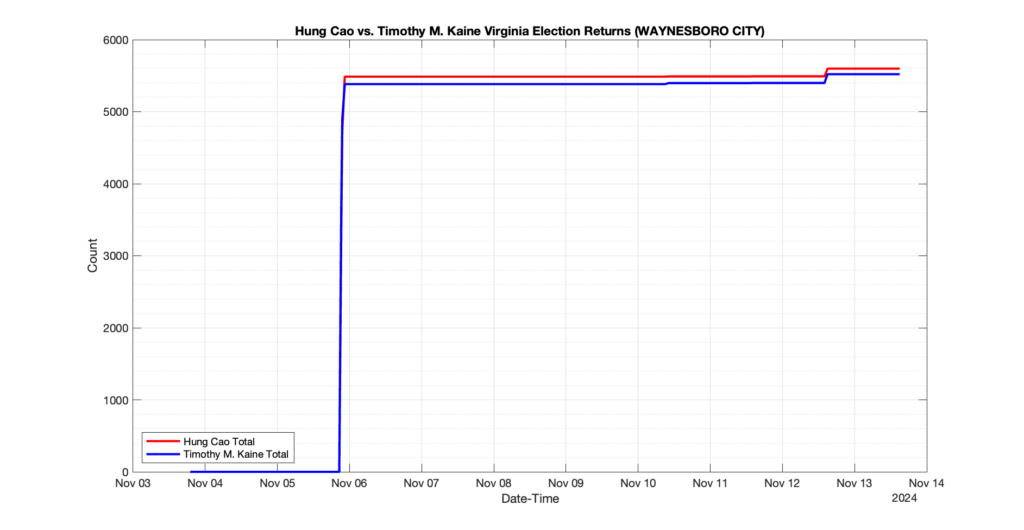
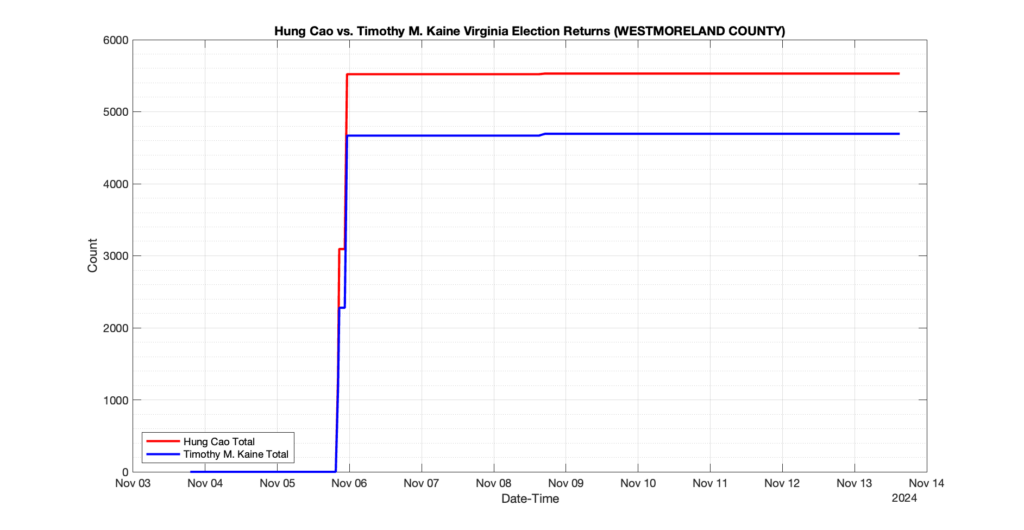
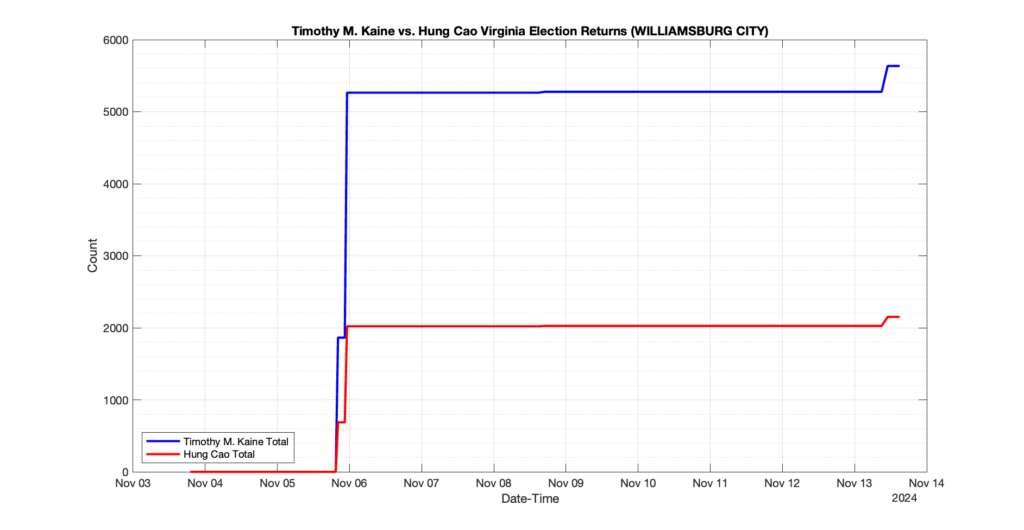
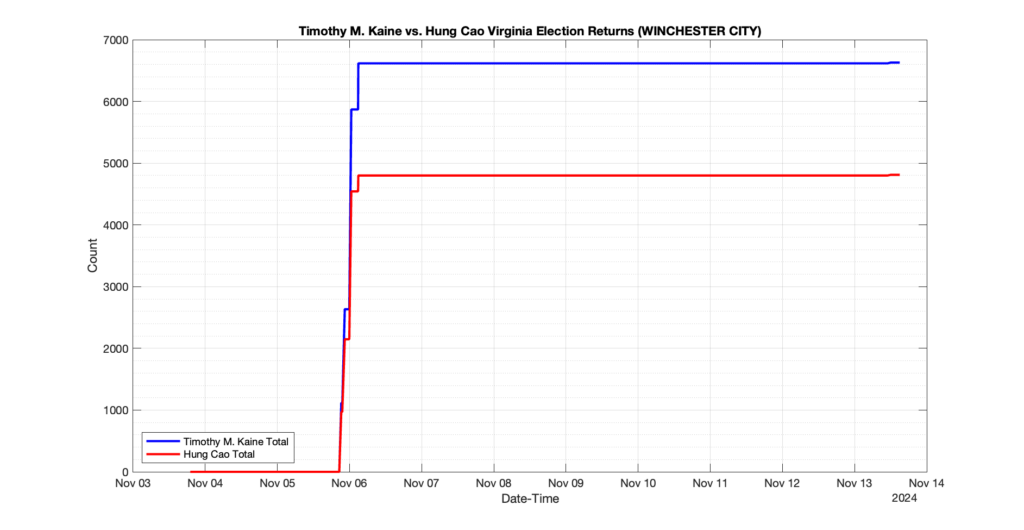
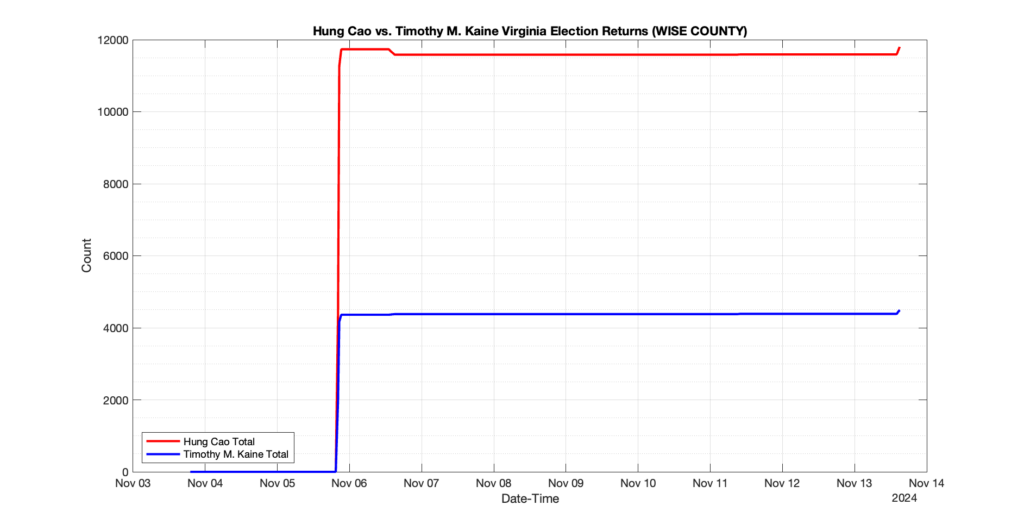
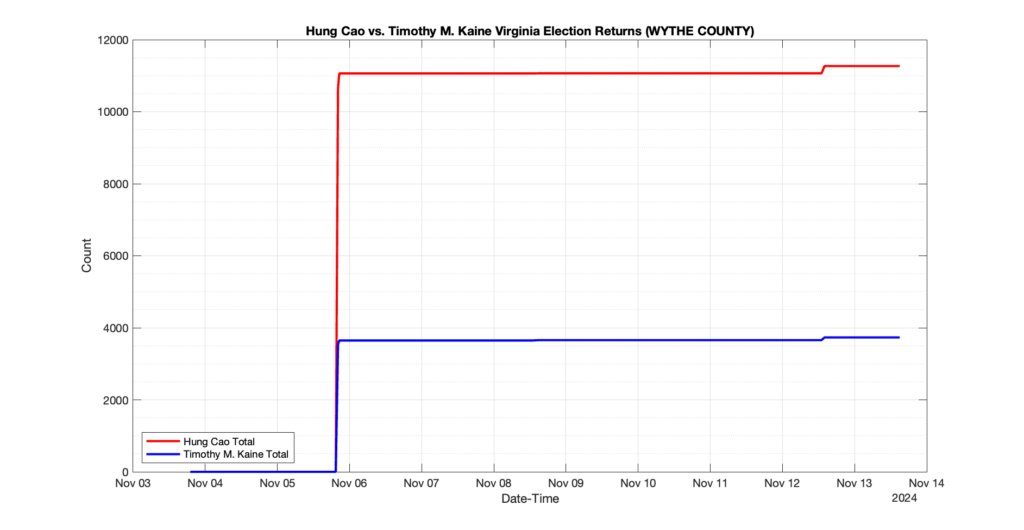
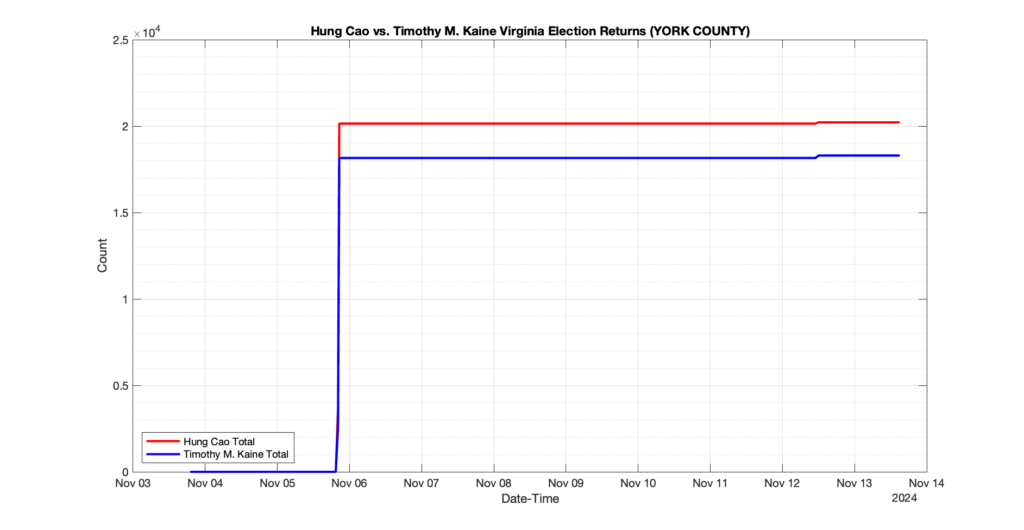
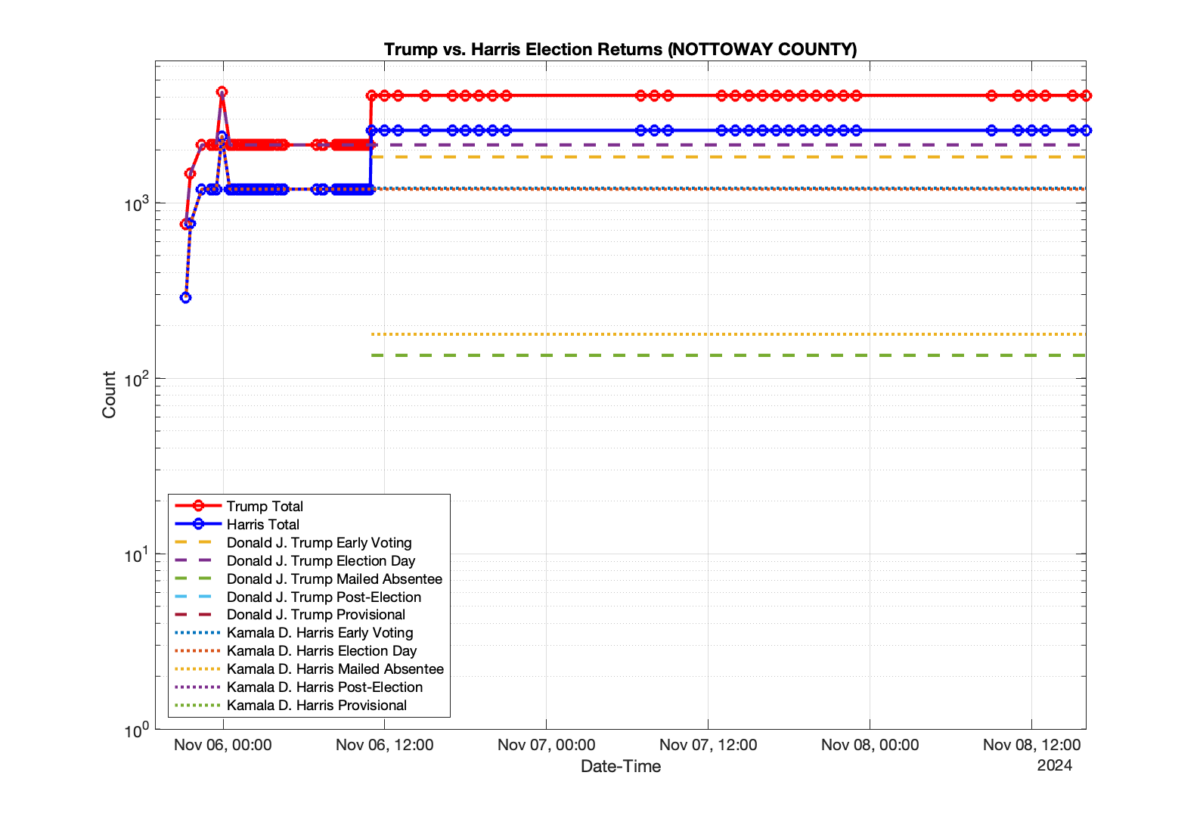
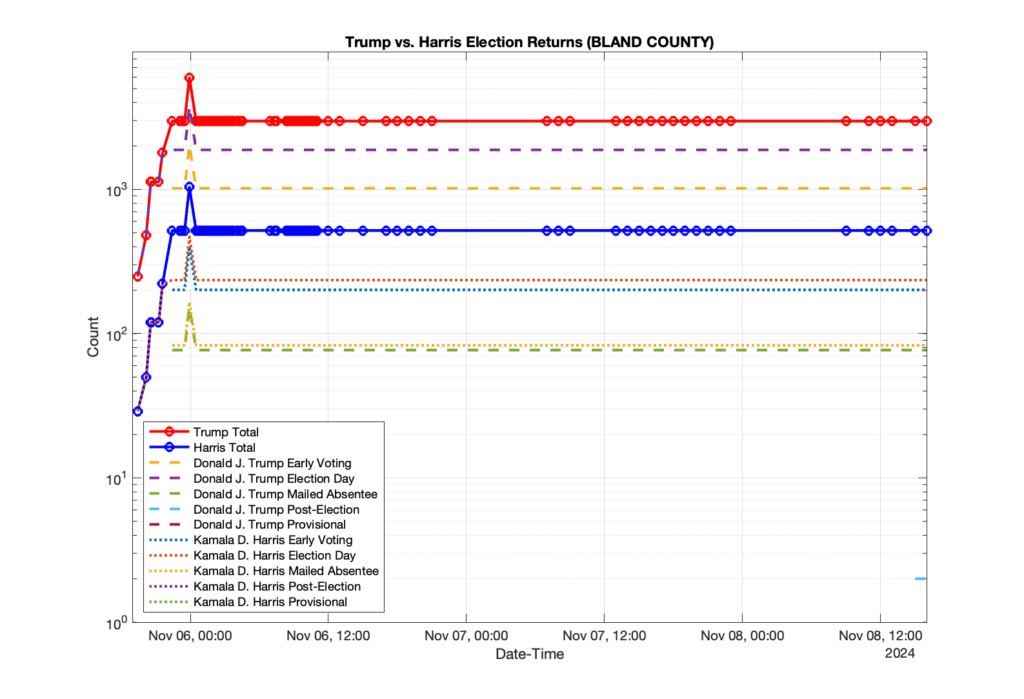
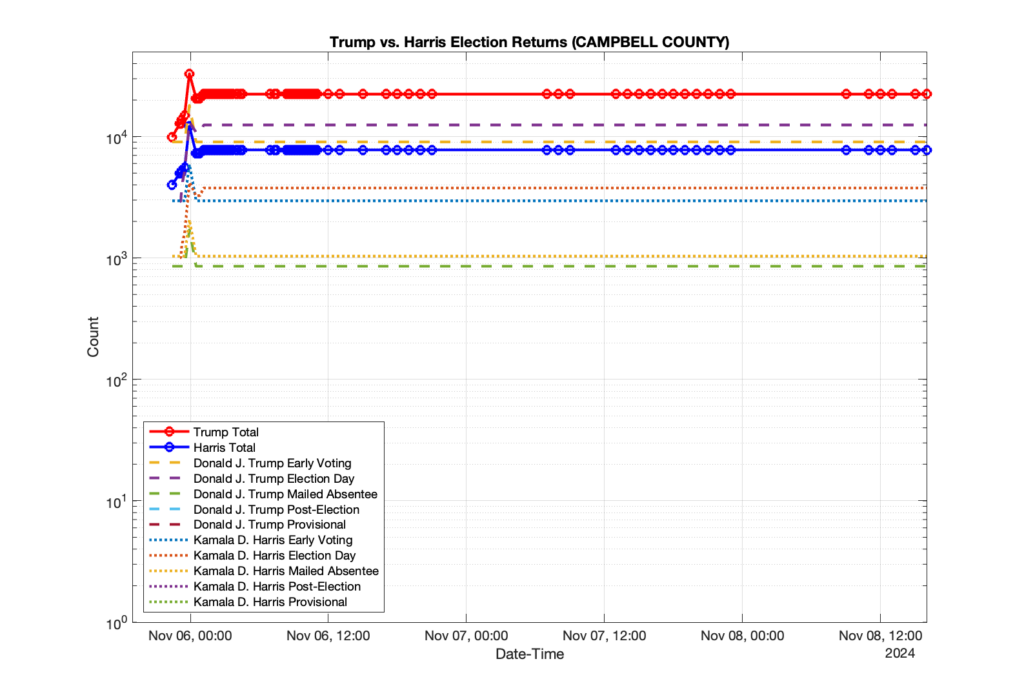
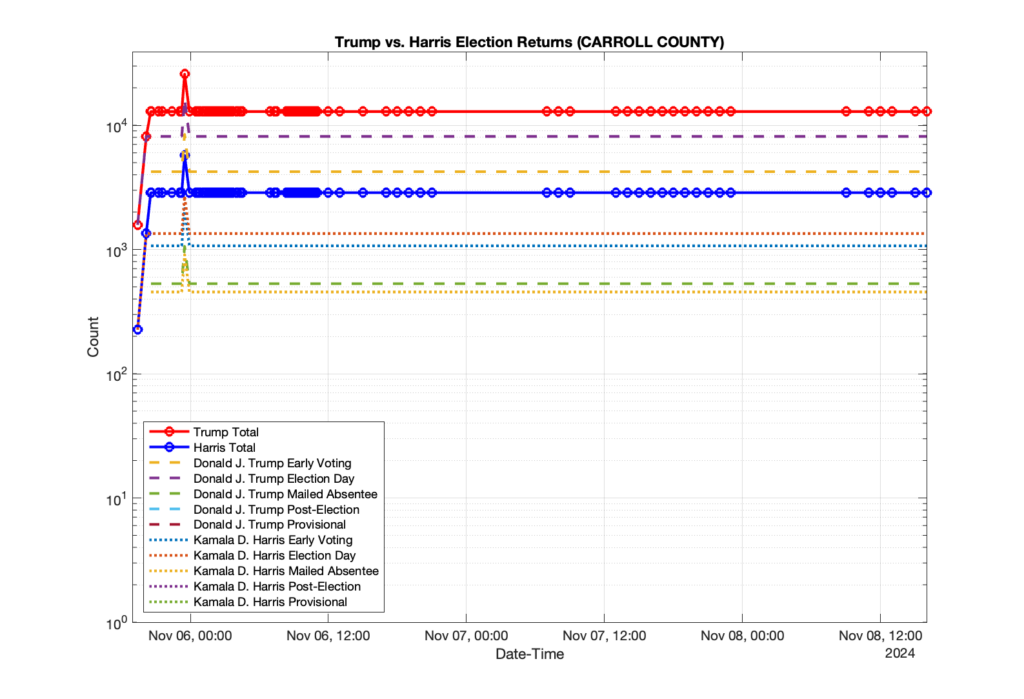
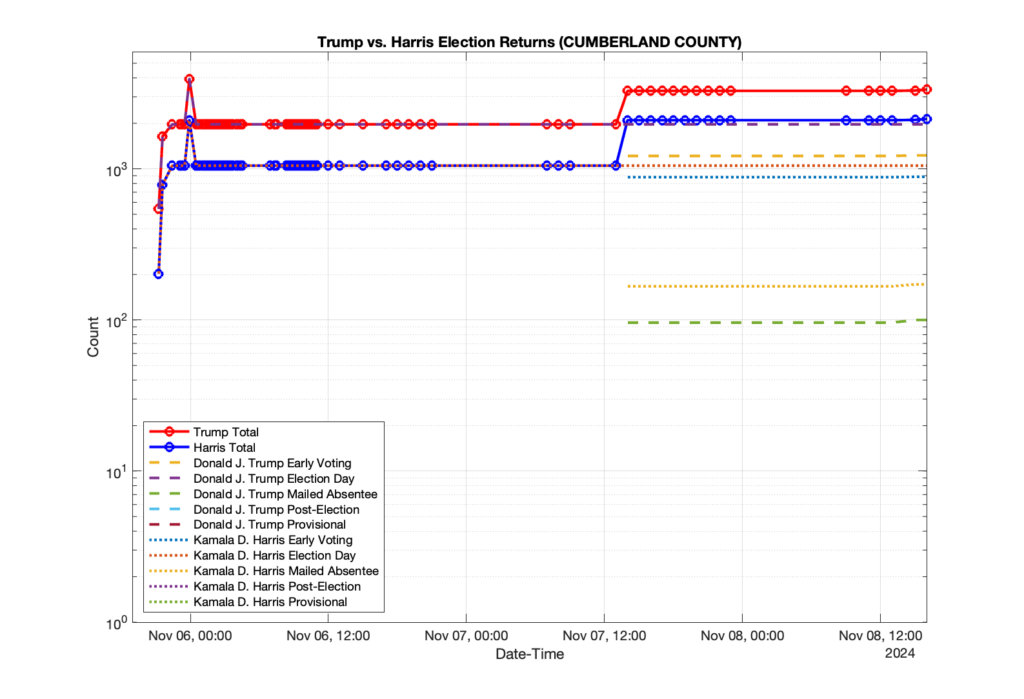
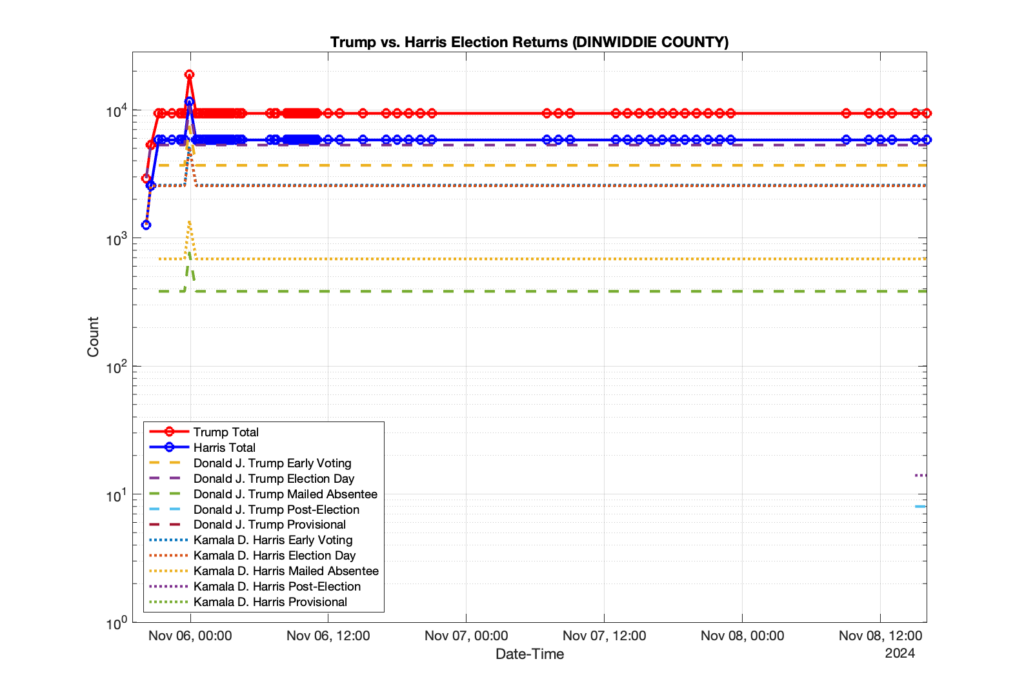
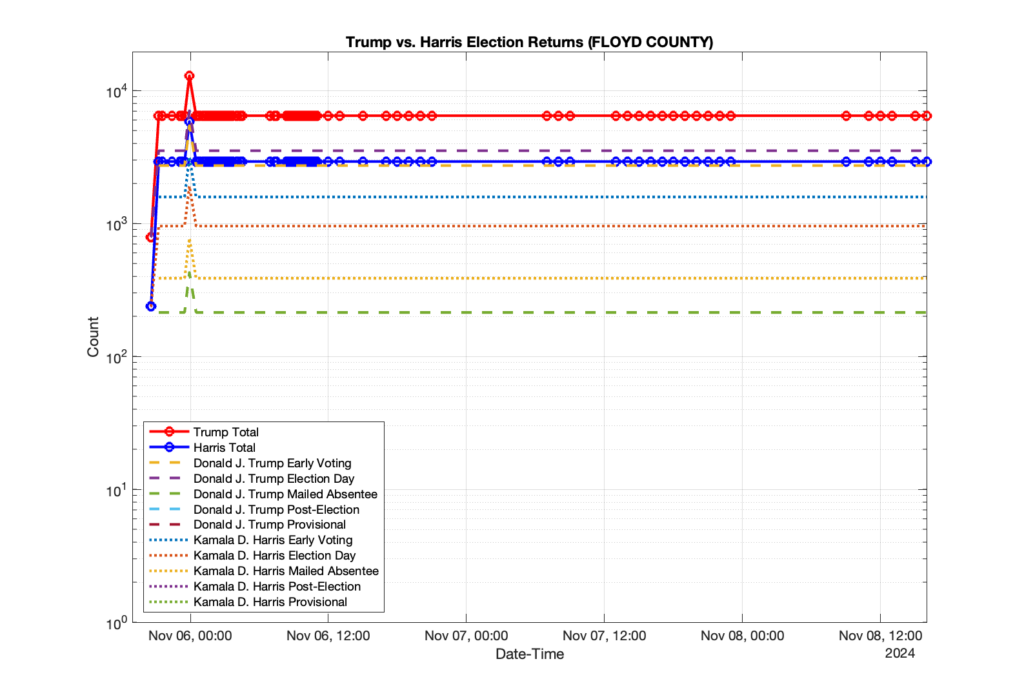
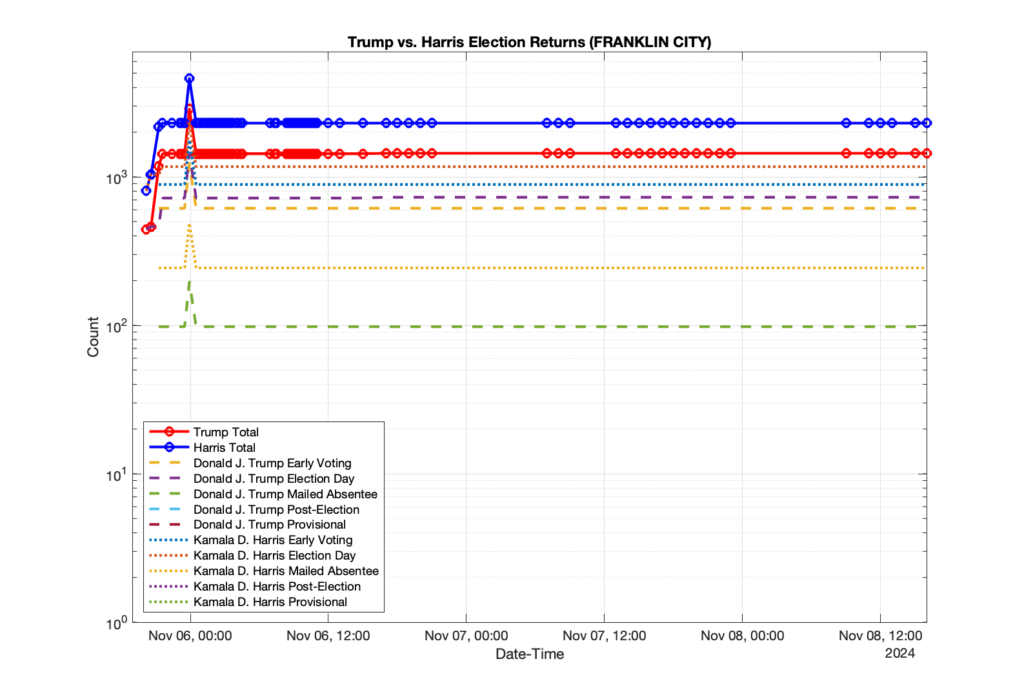
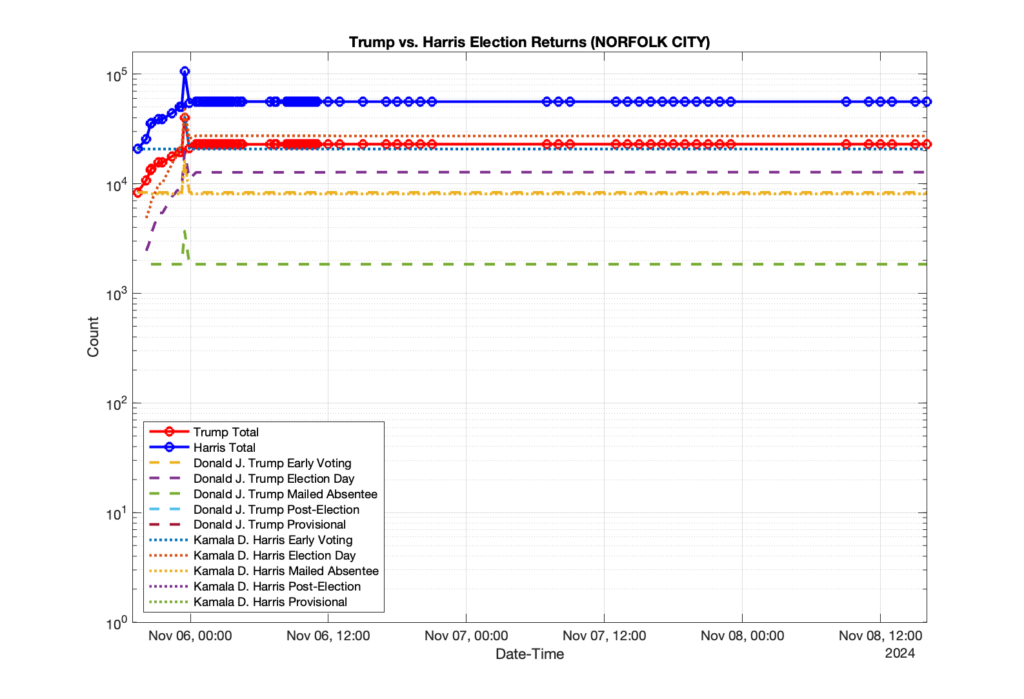
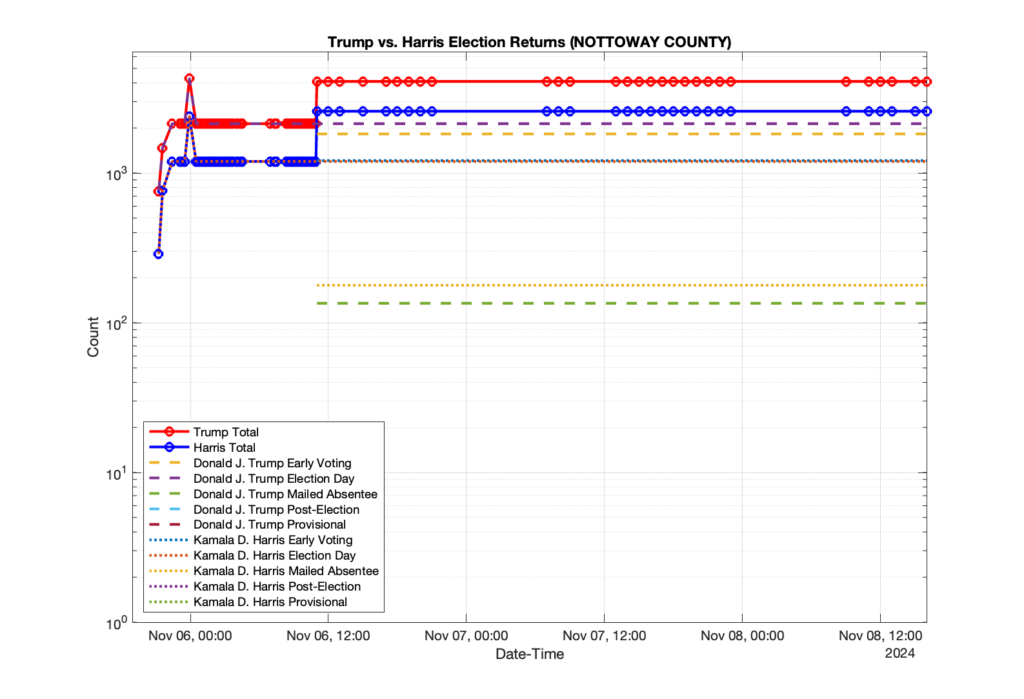
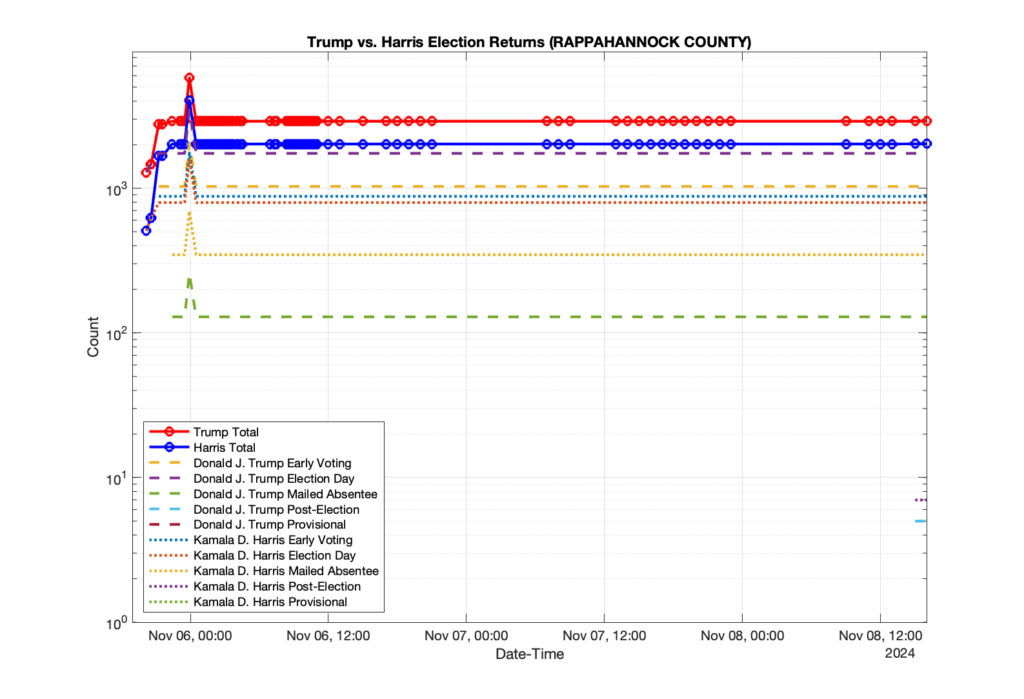
Below you will find the current summary data and graphics from the 2024 VA November General Election Daily Absentee List files. We pull the DAL file everyday and track the count of each specific ballot category in each daily file.
Note: Page may take a moment to load the graphics objects.
Place your cursor over the series name in the legend at right to see the series highlighted in the graphic. Place your cursor over a specific data point to see that data points value.
The logarithmic plot is the same underlying data as the linear scale plot, except with a logarithmic y-scale in order to be able to compress the dynamic range and see the shape of all of the data curves in a single graphic. Place your cursor over the series name in the legend at right to see the series highlighted in the graphic. Place your cursor over a specific data point to see that data points value.
The underlying data for the graphics above is provided in the summary data table.
Additional Data:
Additional CSV datasets stratified by Locality, City, Congressional District, State House District, State Senate District, and Precinct are available here. Please note that you need to give the page time to load before trying to drill down into any of the listed subdirectories, and mobile browsers have shown some issues.
A direct link to a zip file with ALL of the metrics data stratified by Locality, etc is here.
Data column descriptions:
“ISSUED” := Number of DAL file records where BALLOT_STATUS= “ISSUED”
“NOT_ISSUED” := Number of DAL file records where BALLOT_STATUS= “NOT ISSUED”
“PROVISIONAL” := Number of DAL file records where BALLOT_STATUS= “PROVISIONAL” and APP_STATUS=”APPROVED”
“DELETED” := Number of DAL file records where BALLOT_STATUS= “DELETED”
“MARKED” := Number of DAL file records where BALLOT_STATUS= “MARKED” and APP_STATUS=”APPROVED”
“ON_MACHINE” := Number of DAL file records where BALLOT_STATUS= “ON_MACHINE” and APP_STATUS=”APPROVED”
“PRE_PROCESSED” := Number of DAL file records where BALLOT_STATUS= “PRE-PROCESSED” and APP_STATUS=”APPROVED”
“FWAB” := Number of DAL file records where BALLOT_STATUS= “FWAB” and APP_STATUS=”APPROVED”
“MAIL_IN” := The sum of “MARKED” + “PRE_PROCESSED”
“COUNTABLE” := The sum of “PROVISIONAL” + “MARKED” + “PRE_PROCESSED” + “ON_MACHINE” + “FWAB”
“MILITARY” := Number of DAL file records where VOTER_TYPE= “MILITARY”
“OVERSEAS” := Number of DAL file records where VOTER_TYPE= “OVERSEAS”
“TEMPORARY” := Number of DAL file records where VOTER_TYPE= “TEMPORARY”
“MILITARY_COUNTABLE” := Number of DAL file records where VOTER_TYPE= “MILITARY” and where COUNTABLE is True
“OVERSEAS_COUNTABLE” := Number of DAL file records where VOTER_TYPE= “OVERSEAS” and where COUNTABLE is True
“TEMPORARY_COUNTABLE” := Number of DAL file records where VOTER_TYPE= “TEMPORARY” and where COUNTABLE is True
“MILITARY_ISSUED” := Number of DAL file records where APP_STATUS==”Approved”, VOTER_TYPE= “MILITARY” and where BALLOT_STATUS==”ISSUED”
“OVERSEAS_ISSUED” := Number of DAL file records where APP_STATUS==”Approved”, VOTER_TYPE= “OVERSEAS” and where BALLOT_STATUS==”ISSUED”
“TEMPORARY_ISSUED” := Number of DAL file records where APP_STATUS==”Approved”, VOTER_TYPE= “TEMPORARY” and where BALLOT_STATUS==”ISSUED”
“COUNTABLE_HIGH_PROP_NG” := Number of DAL file records where COUNTABLE is True and the registrant has voted in 75% or more of the November General elections on record. (i.e. They have a high November General propensity score)
“COUNTABLE_MED_PROP_NG” := Number of DAL file records where COUNTABLE is True and the registrant has voted in < 75% and > 0% of the November General elections on record.
“COUNTABLE_ZERO_PROP_NG” := Number of DAL file records where COUNTABLE is True and the registrant has never voted in any of the November General elections on record.
All data purchased by Electoral Process Education Corp. (EPEC) from the VA Dept of Elections (ELECT). All processing performed by EPEC.
If you like the work that EPEC is doing, please support us with a donation.
Since VA Gov Youngkin issued Executive Order 35, it has been getting quite a bit of press … I wanted to make a few comments on it after having a chance to digest it.
Overall, I think it’s a net positive for Election Integrity efforts in VA, but not because there is any new or groundbreaking policy by the governor or his administration. Most of the items in his EO are already existing policy, and the EO language is worded such that the current actions of the Department of Elections (ELECT) can be arguably said to comply with those policies. There are a couple of small improvements, such as the fact that this EO codifies into transparent public policy the specific requirements that the commissioner must certify in writing. Even though there isn’t any drastically new policies, this does improve on overall public transparency, confidence and accountability, and I think thats a good thing.
What will be interesting in my opinion, is that now that this EO has been issued, will our team at EPEC notice any demonstrable difference in the quality of voter registration data that we track from ELECT going forward?
More specifically, I’m going to be tracking a few very specific records to see if they get addressed or not.
There are a few egregious records in the VA voter registration file that are obviously problematic that should be removed or at least updated/corrected by ELECT. I, and the team at EPEC, have been tracking these specific records for years but have not published or discussed them publicly. A few of them we even directly mentioned to the current Commissioner of Elections during our face-to-face meeting with her last year. These records should be “easy” to find and clean up by ELECT, as they are obviously errant and invalid registrations in their current state.
As of the latest data we have, those records are still in the voter list and listed as ACTIVE registrations, after nearly four years since I first found them. They can easily be identified with very simple logical checks to the registration records … descriptions of which I and the team at EPEC have discussed publicly and provided direct to ELECT and local registrars on multiple occasions.
The reason I bring this up, is that these can be considered and used as “hold out” test cases, in data science parlance. They are “canaries in the coal mine”, if you will. If we at EPEC start observing that these records are being responsibly updated or removed going forward, in accordance with the mandate in the EO to perform daily scrubbing of the voter rolls for ineligible records, then that would give VA citizens some evidence and verification that the Gov and ELECT are serious about their efforts.
That would be excellent if they did, but seeing as how I’ve been observing these records for 4 years while the administration proclaim what an excellent job its doing … I’m not going to hold my breath.
We have updated our previous analysis with the latest information from the VA Department of Elections data.
Update 07/27/2024: The below numbers have been revised after discovering a minor programming error and a human “fat-finger” error when I originally transcribed table 1. [The previous erroneous numbers were 2031 registrants removed, 438 with observed voting history, for a total of 1089 ballots. The new corrected totals are 1973, 399, and 938 respectively.]
Abstract:
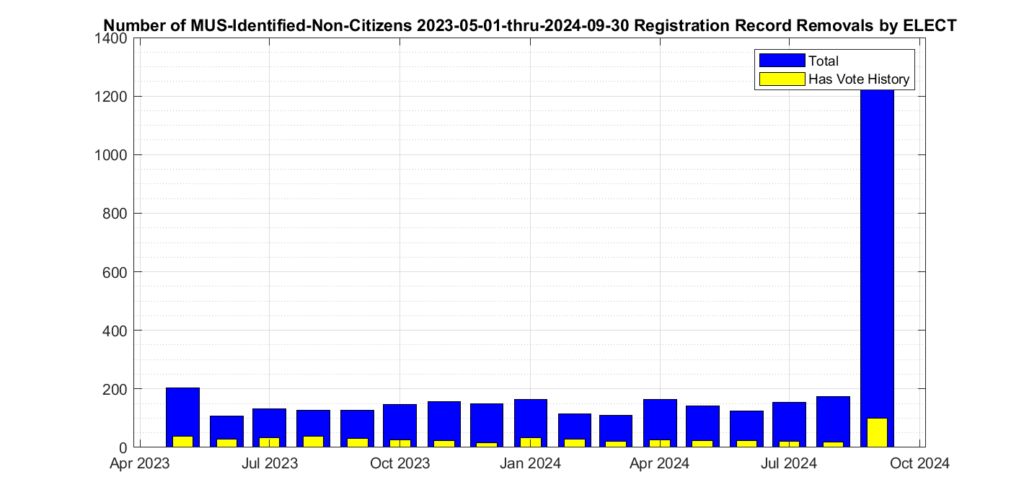
Using the data provided by the VA Department of Elections (ELECT), we have identified at least 1,973 unique registrations that were identified as “Determined Non-Citizen” and removed by ELECT from the voter rolls since May of 2023. Of those 1,973 there were 399 that also had corresponding records of recent ballots cast at some point in the official Voter History record that we could observe. There were 938 associated ballots cast identified since Feb of 2019.
After our previous post on this topic in March 2024, we submitted all of the relevant information that we had at the time to the VA AG’s office. We have not heard any response or update on the matter since that time, besides this being considered an active investigation.
Background:
The VA Department of Elections continuously tries to identify and remove invalid or out of date registration records from the voter rolls. One category used for removal is if a registrant has been determined to be a non-citizen. It is required by the VA Constitution that only citizens are allowed to vote in VA elections.
In elections by the people, the qualifications of voters shall be as follows: Each voter shall be a citizen of the United States, shall be eighteen years of age, shall fulfill the residence requirements set forth in this section, and shall be registered to vote pursuant to this article. …
Additionally, according to VA Code Section 24.2-1004, the act of knowingly casting a ballot by someone who is not eligible to vote is a Class 6 felony.
A. Any person who wrongfully deposits a ballot in the ballot container or casts a vote on any voting equipment, is guilty of a Class 1 misdemeanor.
B. Any person who intentionally (i) votes more than once in the same election, whether those votes are cast in Virginia or in Virginia and any other state or territory of the United States, (ii) procures, assists, or induces another to vote more than once in the same election, whether those votes are cast in Virginia or in Virginia and any other state or territory of the United States, (iii) votes knowing that he is not qualified to vote where and when the vote is to be given, or (iv) procures, assists, or induces another to vote knowing that such person is not qualified to vote where and when the vote is to be given is guilty of a Class 6 felony.
ELECT makes available for purchase by qualifying parties various different data sets, including the registered voter list (RVL) and the voter history list information file (VHL). Additionally, ELECT makes available a Monthly Update Service (MUS) subscription that is published at the beginning of each month and contains (almost) all of the Voter List changes and transactions for the previous period.
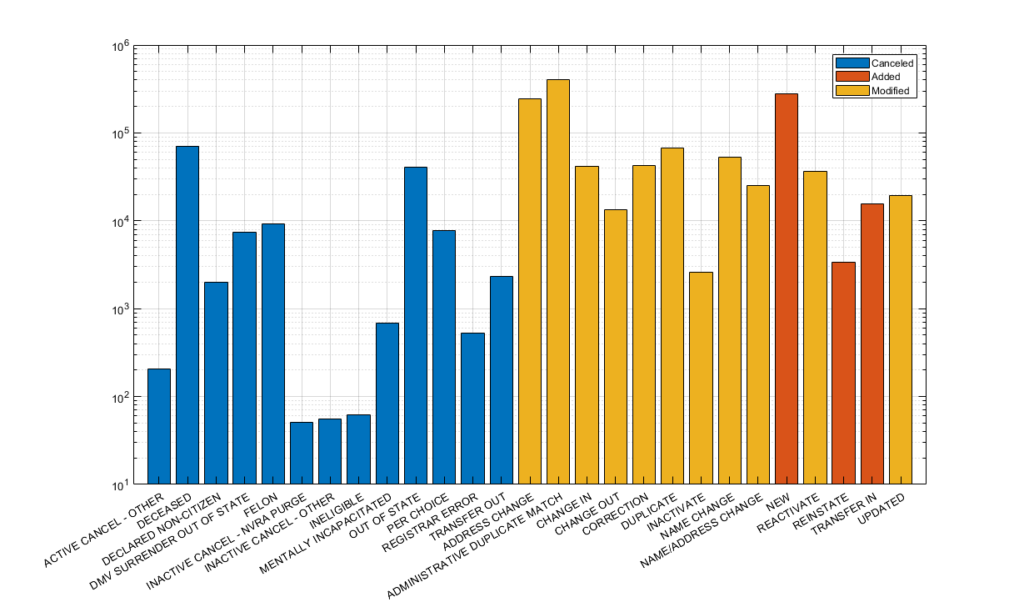
In the MUS data there is a “NVRAReasonCode” field that is associated with each transaction that gives the reason for the update or change in the voter record. This is in accordance with the disclosure and transparency requirements in the NVRA. One of the possible reason codes given for records that are removed is “Determined Non-Citizen.”
EPEC has been consistently purchasing and archiving all of these official records as part of our ongoing work to document and educate the public as to the ongoing operations of our elections. (If your interested in supporting this work, please head on over to our donation page, or to our give-send-go campaign to make a tax-deductible donation, as these data purchases are not cheap!)
EPEC looked at the number of records associated with unique voter identification numbers that had been identified for removal from the voter record due to non-citizenship status, per the entries in the MUS, and correlated those results with our accumulated voter history list information in order to determine how many non-citizen registrations had corresponding records of ballots cast in previous elections. We only considered those records that are currently in a non-active state as of the latest MUS transaction log, as some determinations of non-citizenship status in the historical MUS transaction log might have been due to error and subsequently corrected and reinstated to active status. That is, we are not considering those records that had a “Determined Non-Citizen” disqualification, but were then subsequently reinstated and reactivated by ELECT.
Results:
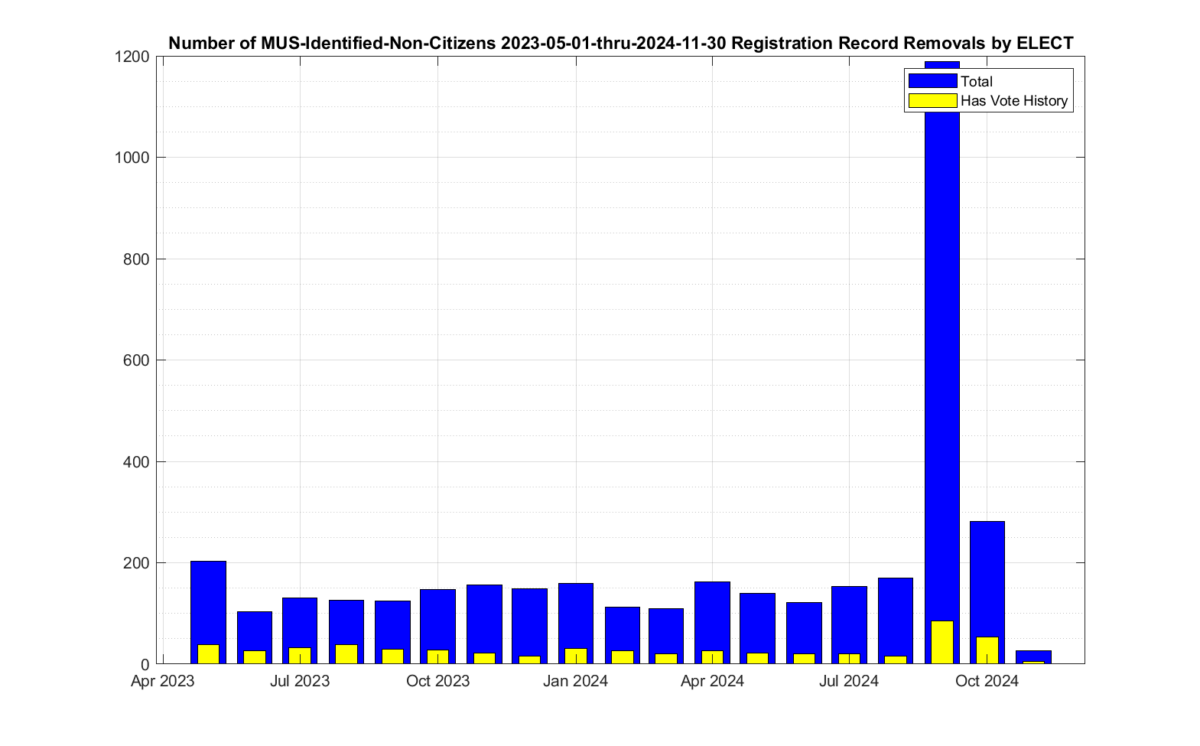
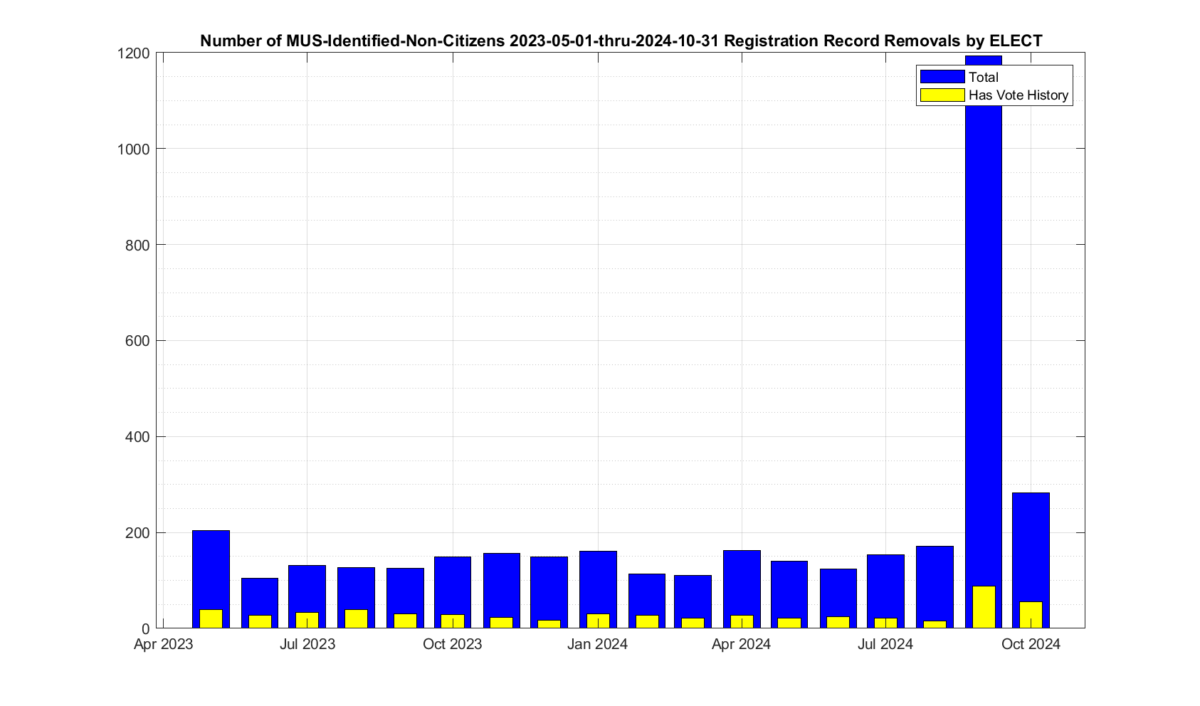
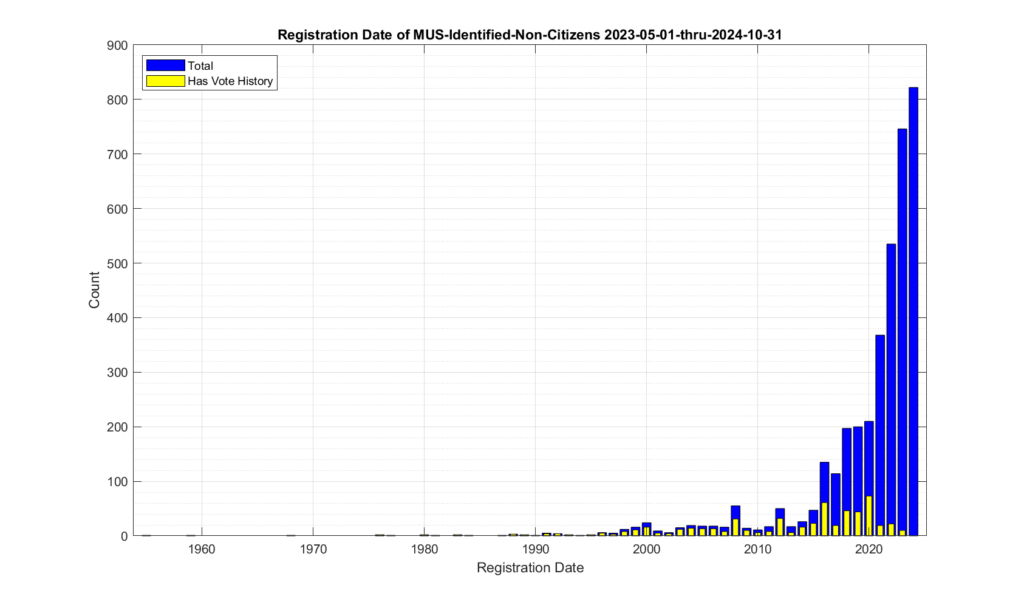
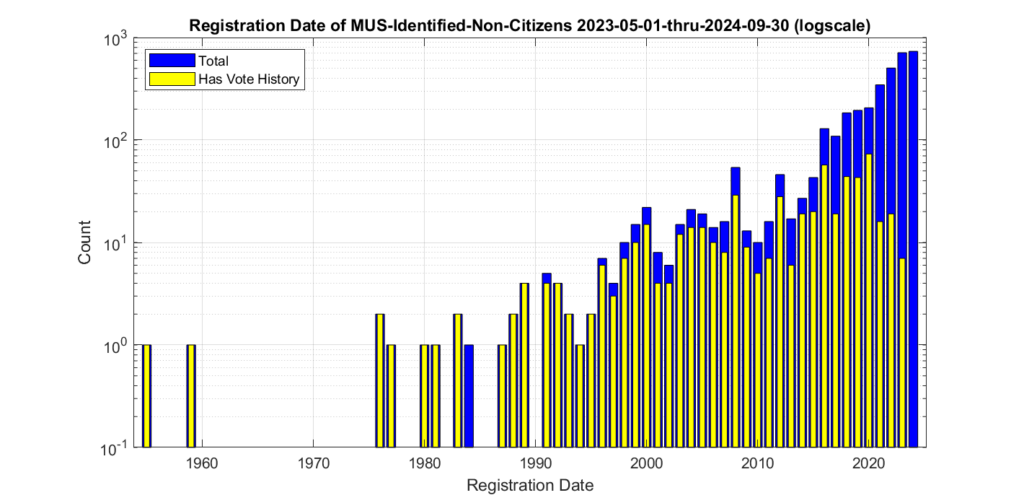
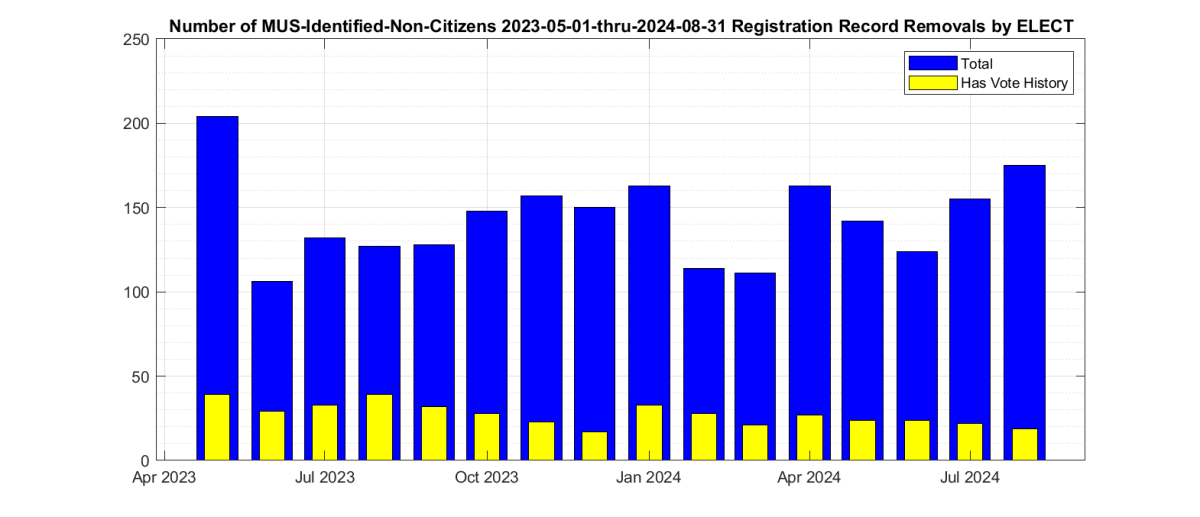
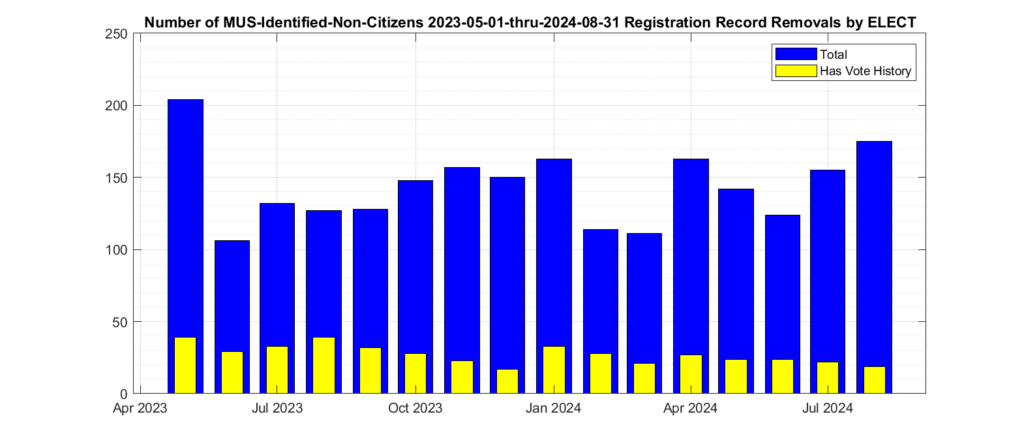
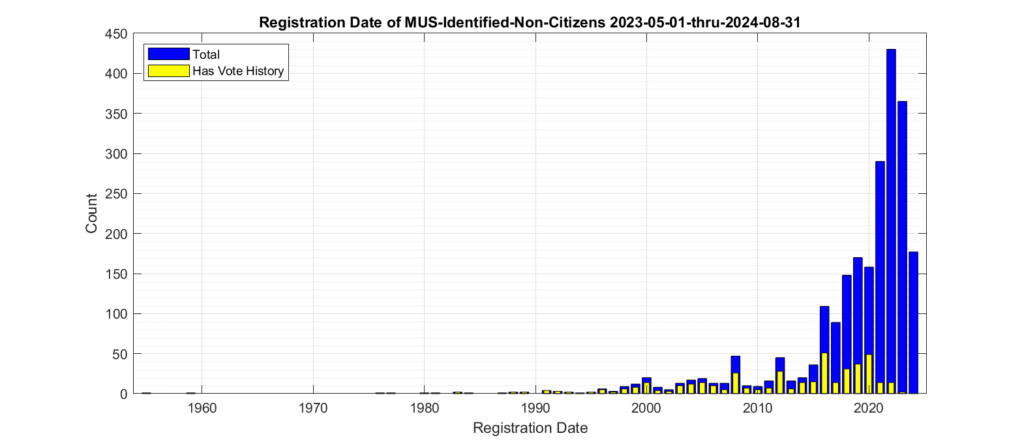
There were 1,973 unique voter records marked for removal with the reason of “Determined Non-Citizen” and not subsequently reinstated in the accumulated MUS record that EPEC began collecting in mid-2023. Of those 1,973 records there were 399 unique voter ID’s that also had a record of casting one or more ballots in the accumulated vote history data that EPEC has been gathering, for a total of 938 ballots cast that can be identified since Feb of 2019. Figure 1 shows the distribution of non-citizen voters in the cumulative MUS file history. The blue trace represent the total identified and CANCELED non-citizen registrations, and the yellow trace represents the number of those records that also had corresponding records in the accumulated voter history data.
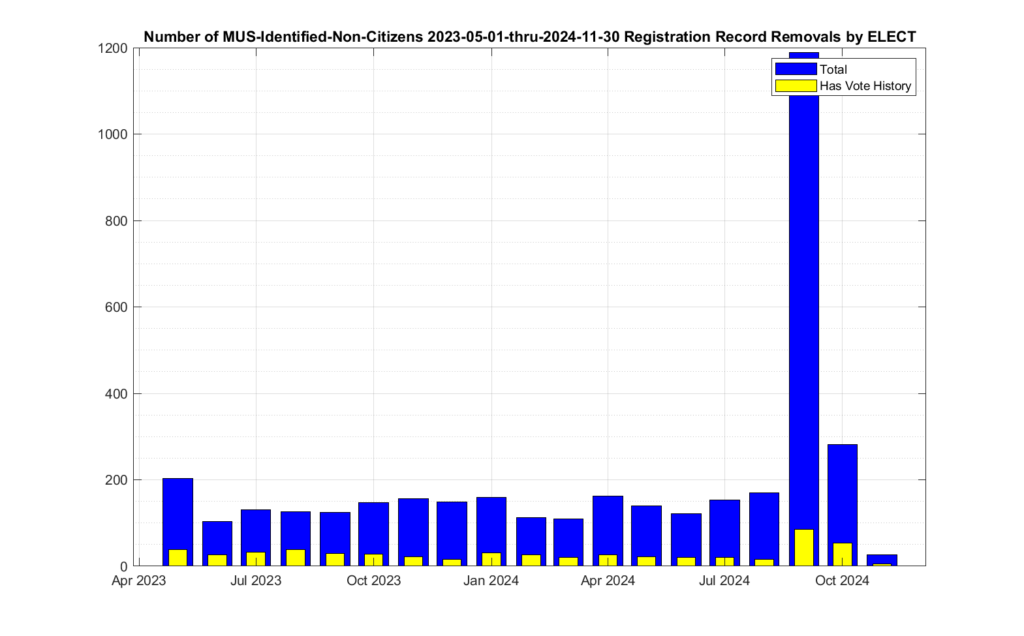
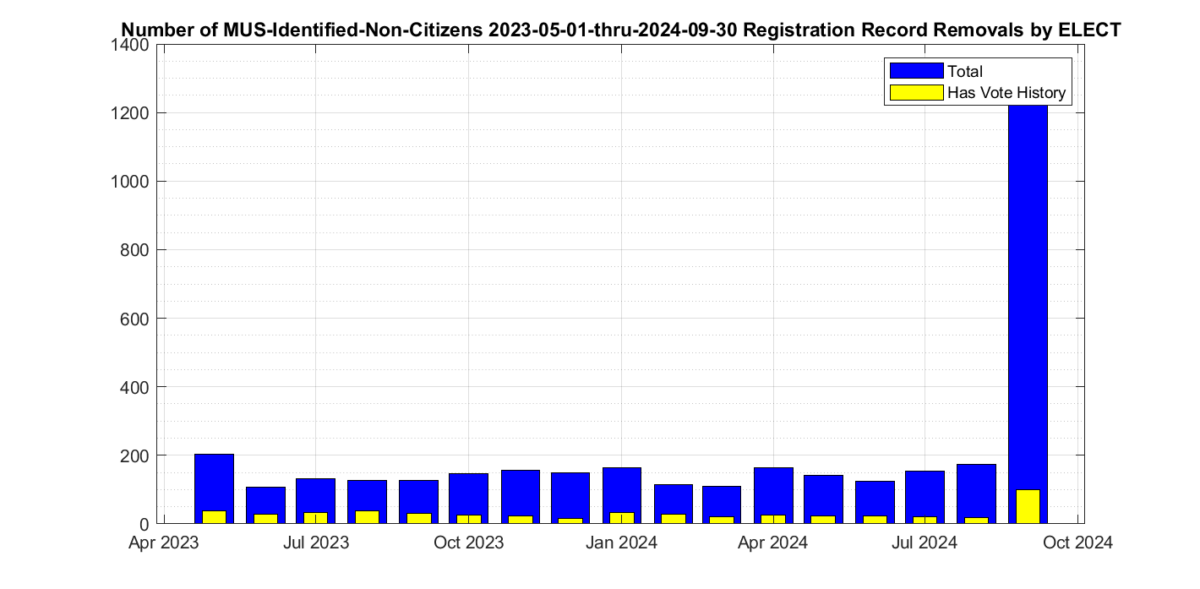
Note that the data contained in the MUS updates often covers more than a single month period. In other words, the individual MUS files are oversampled. Subsequent MUS files can therefore also have repeated entries from previous versions, as their data may overlap. Our analysis used the first unique entry for a given voter ID marked as “Determined Non-Citizen” in the cumulative MUS record in order to build Figure 1. This data oversampling in the MUS helps explain the relative increase in the May 2023 bin.
The distribution of identified unique voter ID’s for the 399 identified non-citizen voters per VA locality is given below in Table 1. It should be noted that each ballot record has a specific locality associated with where the ballot was cast, whereas unique individuals might move between localities over time. The assignment of unique identified individuals to each locality in table 1 is therefore based on the locality listed in the specific MUS “Determined Non-Citizen” record for that individual, while the assignment of ballot cast to Localities is based on the individual VHL records. A person could have lived and voted multiple times in one county, then moved to another county and voted again before finally being determined as a non-citizen. The same person would have generated multiple VHL records for each ballot cast, and associated with potentially different localities. This should be kept in mind when attempting to interpret Table 1.
Locality
Registrants
Voters
Ballots
ACCOMACK COUNTY
1
0
0
ALBEMARLE COUNTY
19
3
4
ALEXANDRIA CITY
96
19
34
AMELIA COUNTY
2
1
3
APPOMATTOX COUNTY
1
0
0
ARLINGTON COUNTY
57
13
38
AUGUSTA COUNTY
5
1
1
BEDFORD COUNTY
9
2
3
BOTETOURT COUNTY
1
0
0
BRUNSWICK COUNTY
1
1
2
BUCKINGHAM COUNTY
2
0
0
CAROLINE COUNTY
5
1
0
CARROLL COUNTY
6
2
5
CHARLES CITY COUNTY
1
0
0
CHARLOTTESVILLE CITY
15
2
7
CHESAPEAKE CITY
52
15
32
CHESTERFIELD COUNTY
130
19
41
CLARKE COUNTY
6
3
4
COLONIAL HEIGHTS CITY
4
1
3
CULPEPER COUNTY
12
0
0
DANVILLE CITY
13
2
8
DINWIDDIE COUNTY
7
1
1
EMPORIA CITY
2
0
0
FAIRFAX CITY
6
3
9
FAIRFAX COUNTY
355
73
162
FAUQUIER COUNTY
11
1
2
FRANKLIN COUNTY
2
1
1
FREDERICK COUNTY
16
1
1
FREDERICKSBURG CITY
13
1
1
GALAX CITY
1
0
0
GILES COUNTY
2
0
0
GLOUCESTER COUNTY
1
1
1
GOOCHLAND COUNTY
4
0
0
GRAYSON COUNTY
1
0
0
GREENE COUNTY
4
1
2
HALIFAX COUNTY
1
0
0
HAMPTON CITY
39
9
15
HARRISONBURG CITY
30
2
3
HENRICO COUNTY
29
3
8
HENRY COUNTY
0
0
2
ISLE OF WIGHT COUNTY
1
0
0
JAMES CITY COUNTY
21
4
11
KING WILLIAM COUNTY
1
0
0
LOUDOUN COUNTY
126
38
86
LOUISA COUNTY
6
0
0
LYNCHBURG CITY
14
2
2
MANASSAS CITY
21
3
9
MANASSAS PARK CITY
9
0
0
MARTINSVILLE CITY
4
1
0
MECKLENBURG COUNTY
6
3
10
MIDDLESEX COUNTY
1
0
0
NELSON COUNTY
2
0
0
NEW KENT COUNTY
1
1
0
NEWPORT NEWS CITY
58
18
44
NORFOLK CITY
50
11
28
NORTHUMBERLAND COUNTY
2
1
4
NOTTOWAY COUNTY
1
0
0
ORANGE COUNTY
2
1
3
PETERSBURG CITY
17
3
5
PITTSYLVANIA COUNTY
3
1
1
PORTSMOUTH CITY
31
10
34
POWHATAN COUNTY
3
0
1
PRINCE EDWARD COUNTY
8
2
3
PRINCE GEORGE COUNTY
9
1
1
PRINCE WILLIAM COUNTY
193
39
92
PULASKI COUNTY
5
1
2
RAPPAHANNOCK COUNTY
1
0
0
RICHMOND CITY
103
19
58
ROANOKE CITY
39
3
5
ROANOKE COUNTY
2
0
0
ROCKINGHAM COUNTY
20
4
9
RUSSELL COUNTY
2
1
1
SALEM CITY
3
0
0
SHENANDOAH COUNTY
4
1
1
SMYTH COUNTY
2
0
0
SPOTSYLVANIA COUNTY
28
2
5
STAFFORD COUNTY
36
6
20
STAUNTON CITY
2
0
0
SUFFOLK CITY
27
11
21
SUSSEX COUNTY
2
1
3
TAZEWELL COUNTY
2
1
1
VIRGINIA BEACH CITY
96
14
38
WARREN COUNTY
8
2
5
WASHINGTON COUNTY
2
2
6
WAYNESBORO CITY
3
0
0
WESTMORELAND COUNTY
1
0
0
WILLIAMSBURG CITY
3
0
0
WINCHESTER CITY
13
1
1
WYTHE COUNTY
2
0
0
YORK COUNTY
15
9
35
Grand Total
1973
399
938
Table 1: Distribution of unique individuals determined to be non-citizens that voted in each locality, and the number of total non-citizen identified ballots cast.
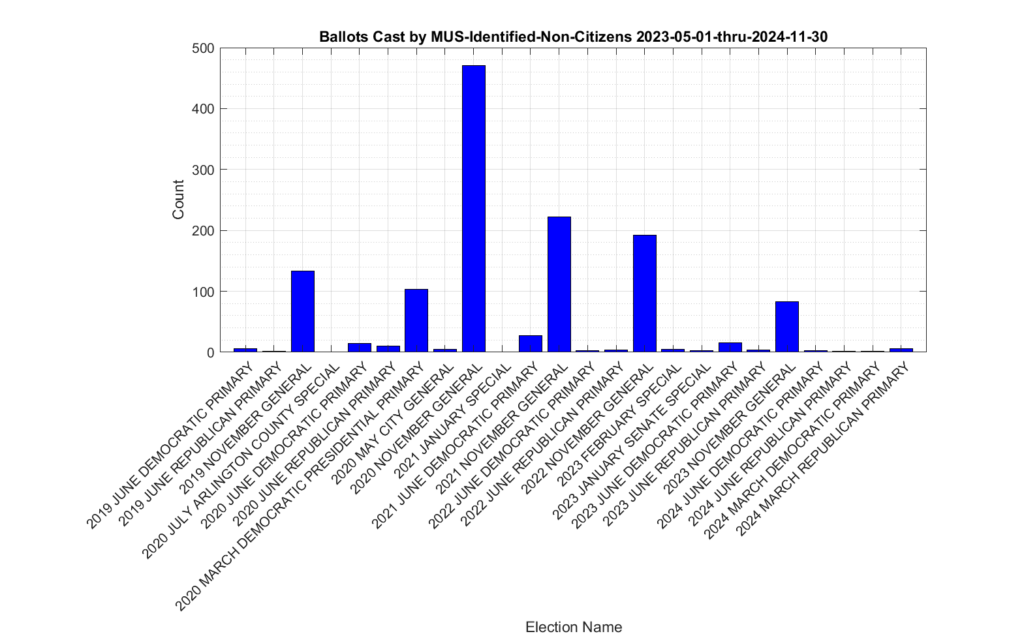
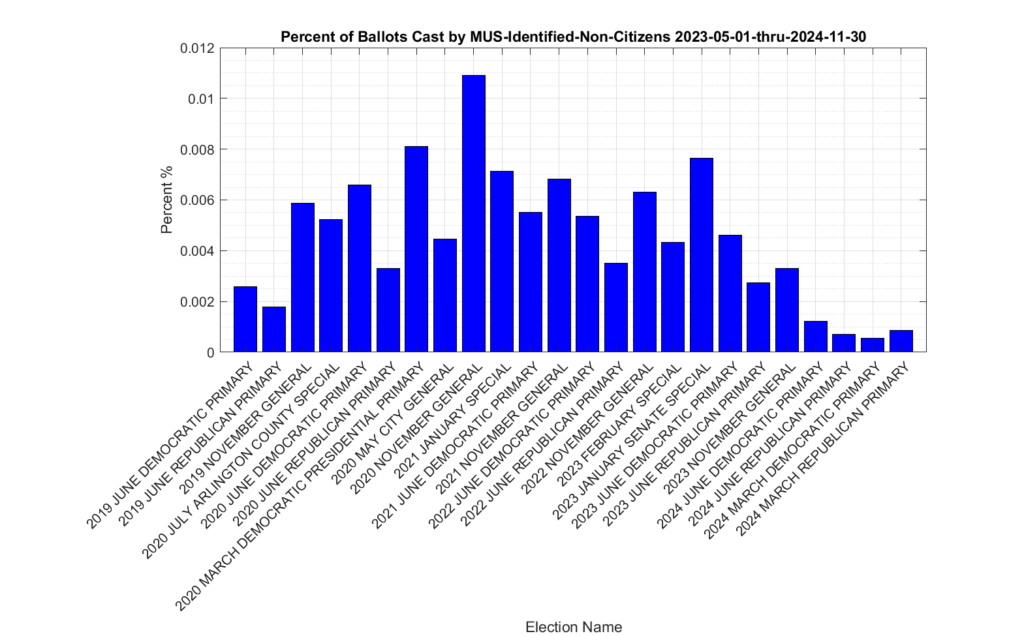
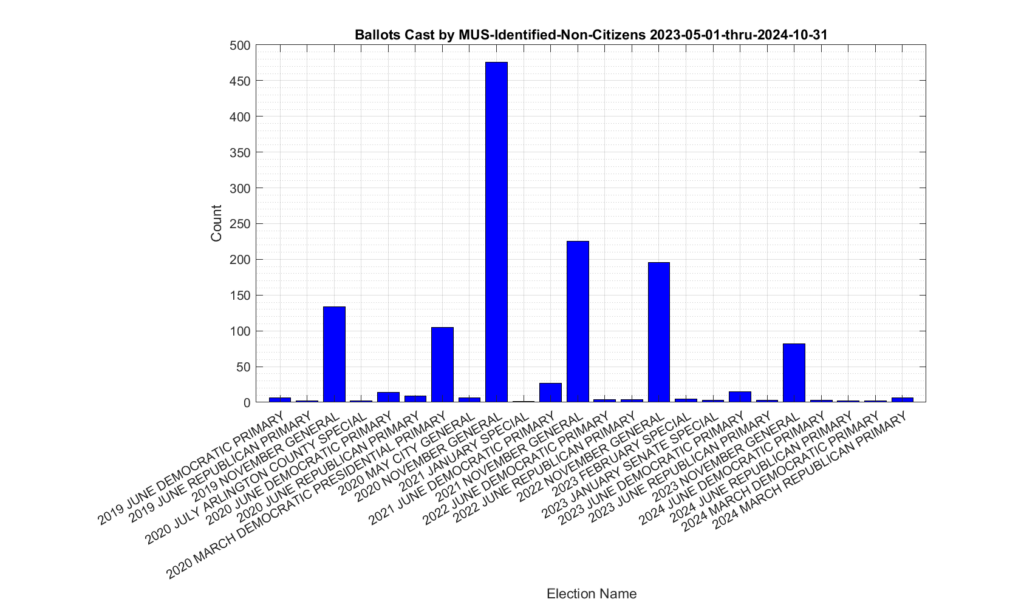
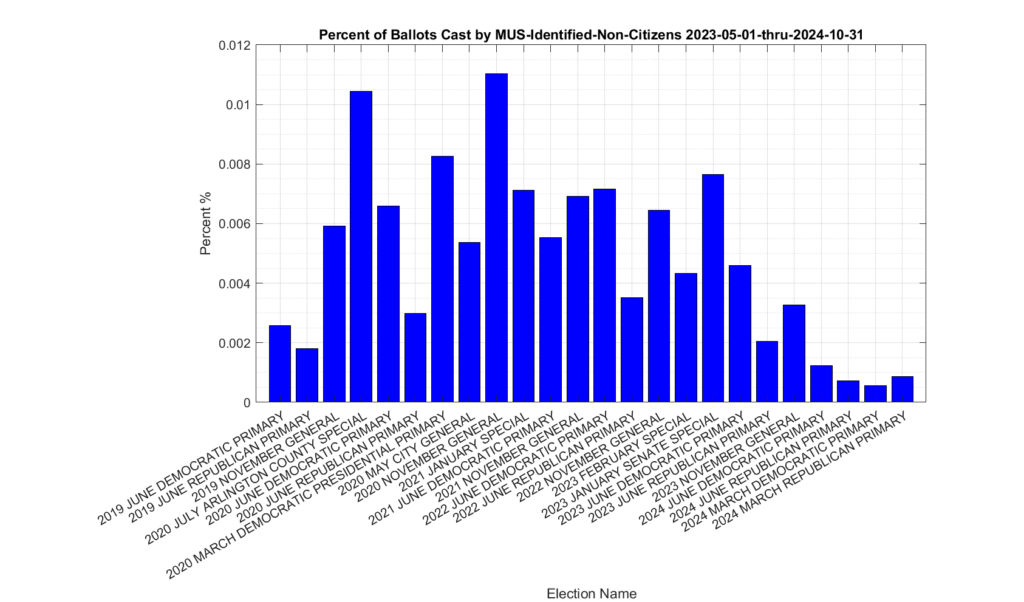
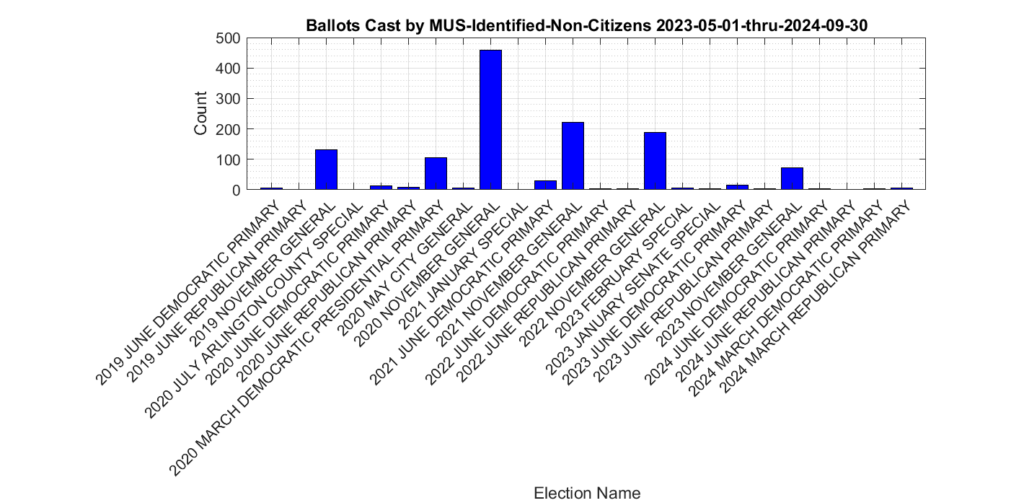
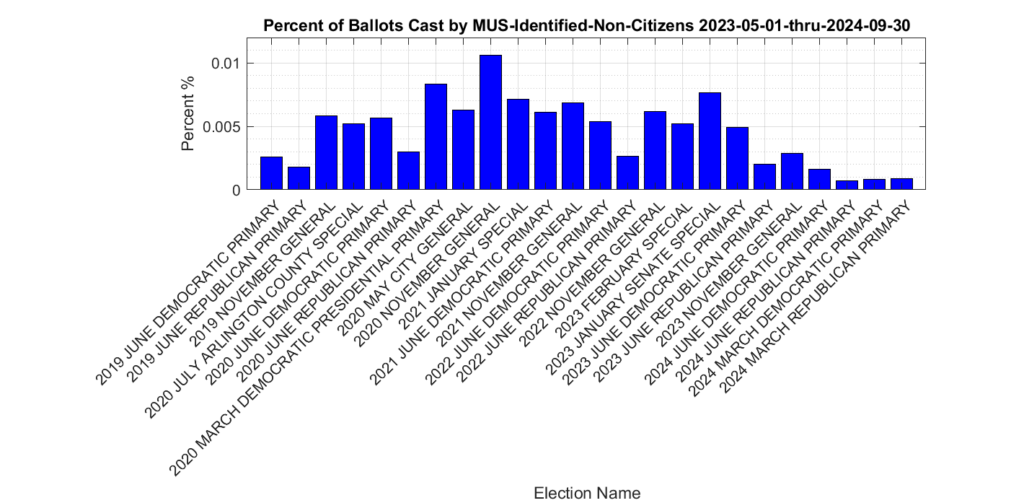
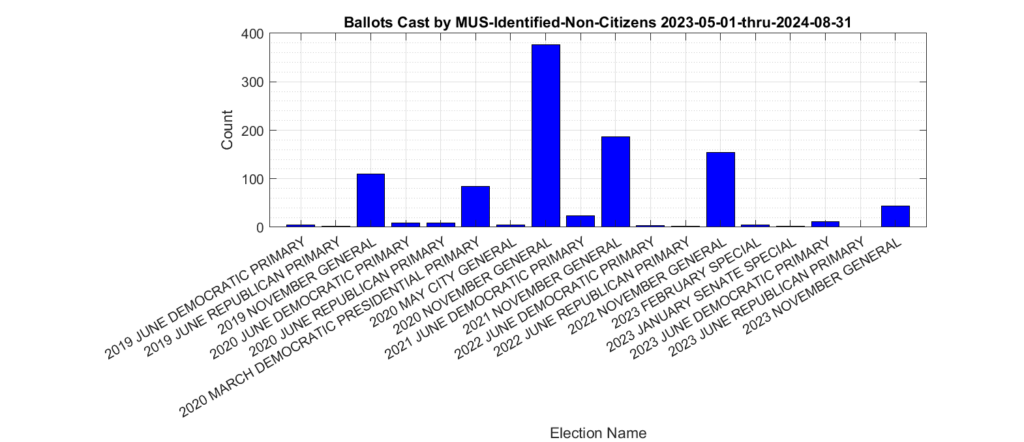
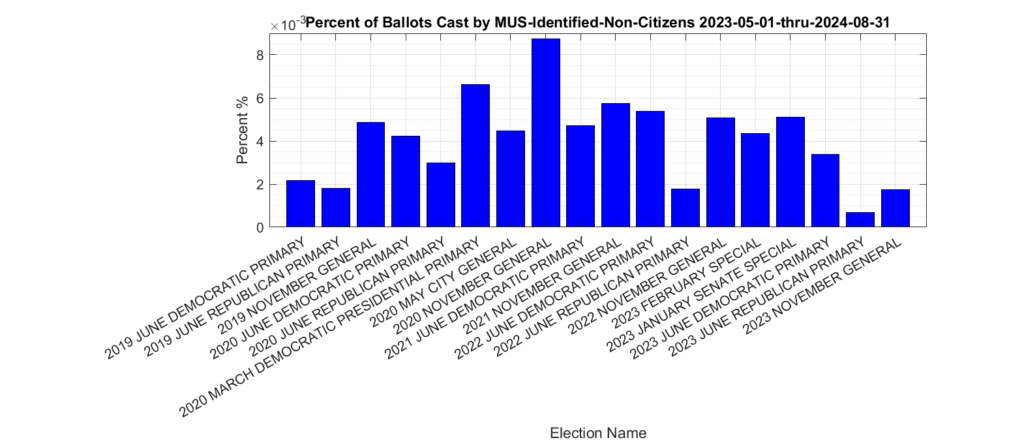
The distribution of the 938 ballots that were identified as being cast by non-citizen voters (yellow trace in Figure 1) in previous elections is shown in Figure 2. The most significant spikes are in the 2019, 2020, 2021 and 2022 November General elections, as well as the 2020 March Democratic presidential primary. Figure 3, which shows this distribution as a percentage of votes cast. Note that we do not yet have a voter history dataset from ELECT that covers the recent 2024 March and June primaries, so those elections are omitted from consideration. Also please note the scale of the Y-axis on the percent plot in Figure 3 is in units of 10^-3 percent.
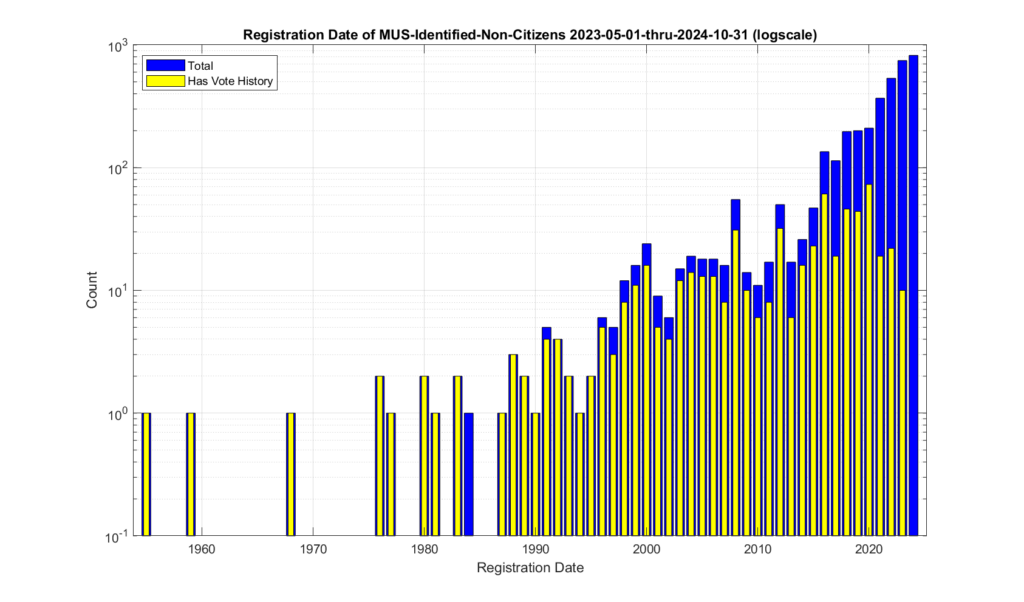
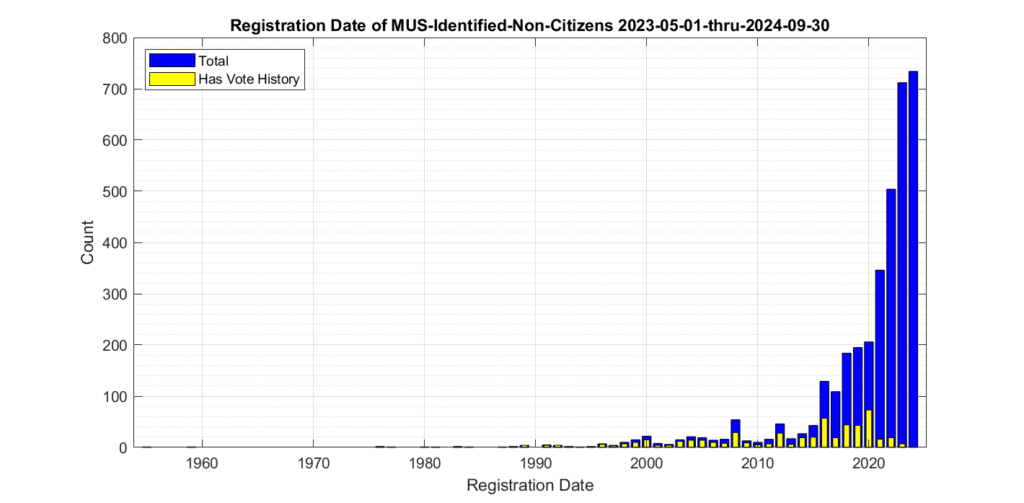
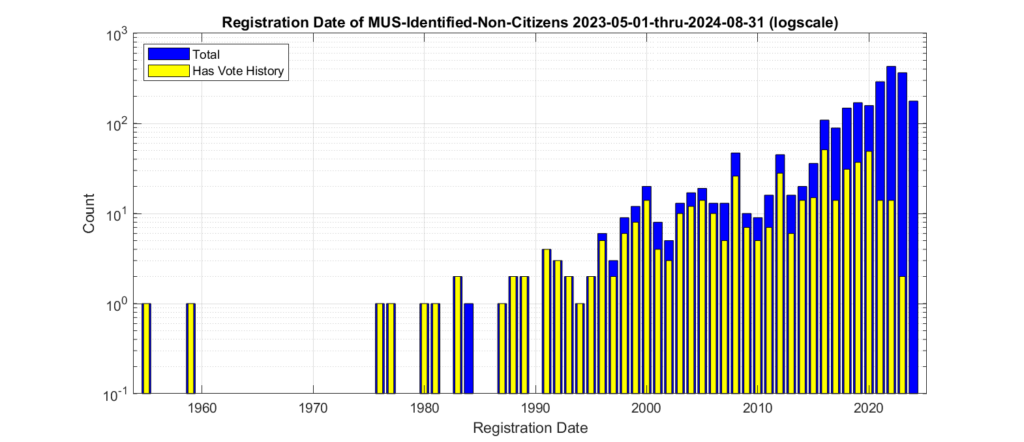
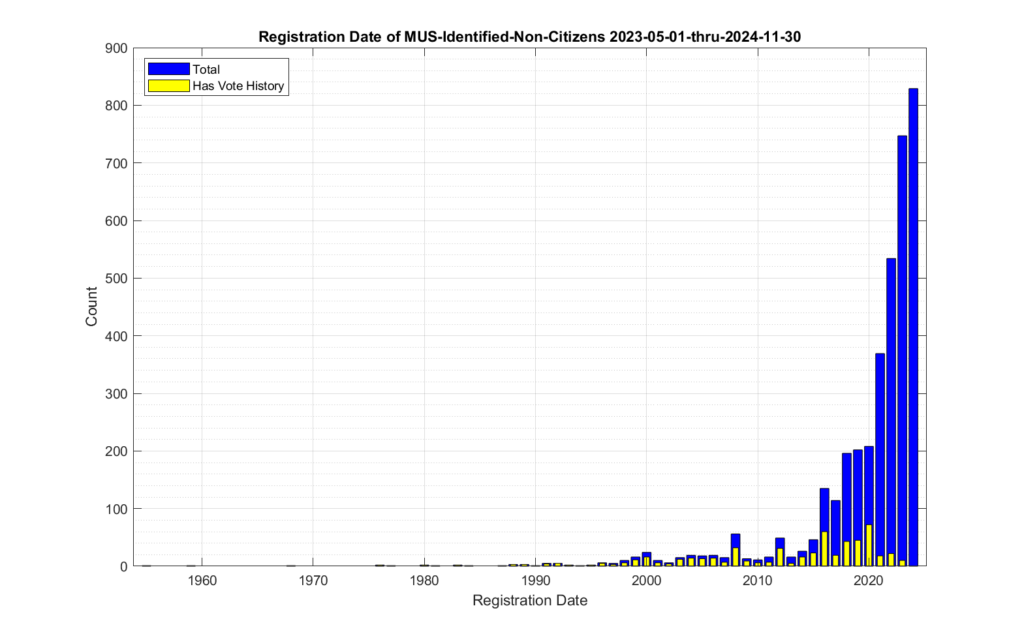
Figures 4 and 5 show the distribution of the registration dates of the identified non-citizen records. The same data is plotted in figure 4 and 5, with the only difference being the scale of the Y-axis in order to better observe the dynamic range of the values. When we look at the registration date of these identified records, we see that there is a distinct relative increase starting around 1996, and then again around 2012.
EPEC made a FOIA request to the VA Attorney General’s office on March 11, 2024 inquiring for any records regarding how many prosecutions for non-citizen voting had occurred since June of 2023. We received a response that the AG had no such relevant records.
EPEC subsequently submitted our March analysis dataset to the VA AG’s office upon their request. We have heard no updates or status as to any action taken by the AG’s office since that time, except that it is being considered an ongoing investigation.
Discussion
It appears from the MUS data, that the VA Department of Elections (ELECT) is doing routine identification, cleanup and removal of non-citizen registrations, which is a good thing and we commend them for their continued efforts to maintain clean voter registration lists.
However, the fact that a small number of these identified non-citizen registrations are also associated with (presumably … if the data from ELECT is accurate) illegally cast ballots in previous elections does raise a number of questions that citizens should be (politely) asking and discussing with their legislators, elected and appointed government officials. Each act of non-citizen voting is a de-facto disenfranchisement of legal voters rights, and is a punishable offense under VA law.
Q: How did these registrants get placed onto the voter rolls in the first place?
Q: What method and/or data sources are used by the state to identify non-citizen registrations for removal? If that process is exhaustive, and covers all registrations, then these numbers might be considered to represent a statistical complete picture of the problem. If that process is not exhaustive, in that it only uses serendipitous corroborating data sources, then these results likely under-represent the scale of the issues.
Q: As noted above, we are only considering here those individuals who have not had their records re-instated or reactivated after a determination of non-citizen status. We do not have enough information to determine how or why some records were first determined to be non-citizen, canceled and then subsequently re-instated. One potential area of concern is determining whether or not registrants might be falsely or errantly claiming to not be a citizen on official documents in order to be excused from jury duty, for example, and then work to re-instate their voting status once those documents percolate through the system to ELECT and are flagged for removal. This is a wholly separate but serious issue, as making false claims on official documents is itself a punishable offense.
Q: What procedures, processes and technical solutions are in place to prevent current or future registration and casting of ballots by non-citizens? This is especially pertinent given the current state of the flow of illegal immigrants crossing our national borders. According to a recent report by Yahoo Finance, VA is one of the top 30 destinations for illegal migrants, with both Loudoun County and Fairfax making the list.
Q: Why have none of the identified non-citizens who also cast ballots been investigated or prosecuted under VA Code 24.2-1004? As the identification of these ballots comes directly from looking at the official records produced by ELECT, it seems prudent for these to be forwarded by ELECT to the AG’s office with a recommendation to investigate and prosecute. Yet our FOIA request to the VA AG’s office inquiring as to any records associated with these types of investigations or prosecutions produced a “no relevant records exist” response. And since we submitted this information to the AG’s office, there has been no follow up.
Additionally, this evidence which is derived from only official state records, directly contradicts multiple news media reports and attestations that non-citizen voting is a “Myth”, and that non-citizen voting happens “almost never”. If the data from ELECT is accurate, then there are at least 938 ballots that have been cast by non-citizen voters just since 2019. Now, that is still very infrequent, but it is not “almost never.” It is a legitimate concern … and these discoveries are only the registrations that have been found and removed from the voter roles by ELECT and that we can observe in the data. We do not know how many exist that we do not know about.
It should be reiterated that these are only the records that we can observe given our data repository, and how often we can realistically purchase and acquire voter history and voter registration information. It is therefore likely that this represents a significant undercount of the occurrences of non-citizen voters and non-citizen voting.
It costs us (EPEC) approximately ~$5K for each purchase of the statewide voter history list, and approximately $15K/year to maintain RVL records using a single baseline full purchase + 2 purchases of the 6mo MUS subscription. Due to the infrequent nature of these data purchases, it is very likely that some individuals have had their voter history or voter registration information completely removed from the record in between our purchases. Additionally, we know that the MUS data does not entirely encompass all transactions performed on the RVL by the department of elections, so there may be yet other unknown transactions that we are missing.
For information that is supposed to be publicly available (according to federal NVRA laws), the state has put up significant hurdles in order for citizens and organizations to acquire it for use it for ensuring transparency and integrity of our electoral process. If we are to have elections that are transparent and accountable to the public, then we must insist that the data be made available and accessible.
Building off of our previous work on computing the string distance between all possible pairs of registered voter records in a single state in order to identify potential matches, we’ve updated the code to allow for cross state comparisons. The first states that we ran this on was VA and FL, using the dataset produced by the FL Department of Elections on 05-07-2024, and the dataset from the VA department of elections dated 05-01-2024. There were a total of 2,502 records that matched our constraints between the FL and VA datasets, as detailed below.
Note: All examples of data records given in this writeup have been fictionalized to protect registered voter identities from being published on this website, and only serve as illustrative examples representative of the nature of properties and characteristics discussed. Law enforcement, election or other gov officials, or individuals otherwise authorized to receive and handle voter data as per VA law and the VA Department of Elections are welcome to contact us for specific details and further information.
Each dataset had the First Name, Middle Initial, Last Name, Suffix, Gender, and Year, Month and Day of Birth concatenated into strings that were then compared against each other using the Levenshtein String Distance measure as an initial filtering method to determine potential matches.
Additionally, for each pair we computed the minimum string distance measure between all of the four possible permutations of pairings between the Primary and Mailing addresses in each record between the states. We required that this minimum distance for a set of registration entries be less than or equal to 12 characters. The choice of the value of twelve was empirically determined after review of the data, as it is loose enough to allow for common variations in address presentation while not being so loose as to be overwhelmed with false positive.
We additionally filtered these findings for only those pairings that were of ACTIVE registrations in both datasets AND where the year, month and day of birth were exact matches.
In summary the 2,502 matches were generated according to the following constraints:
Only applied to ACTIVE voter registrations
Required completed DOB (year, month and day) to exactly match
Required [First Name + Middle Initial + Last Name + Suffix + Gender + DOB] strings to be similar to within <=2 characters
Required that the minimum distance between any pairwise combination of the Primary or Mailing address between the records be less than or equal to 12 characters.
It should be noted that it is readily apparent from reviewing the potential matched records that the majority of these matches look to have originated in FL and then were subsequently moved to VA, but the FL record remained listed as active.
Category 1 Matches:
There were 698 matches in Category 1: where the Levenshtein distance measure for the name and DOB was equal to 0 (exact match) and the minimum address distance was also 0 (also an exact match). Examples in this category are exact matches for every considered field. An example is given below.
FL Active Registration Record: SOUXIEE Q SMITH F 08/19/1968 1267 SLEEPY SONG PL SPRINGFIELD VA 22150
VA Active Registration Record: SOUXIEE Q SMITH F 08/19/1968 1267 SLEEPY SONG PL SPRINGFIELD VA 22150
Category 2 Matches:
There were 1,533 matches in Category 2: where the Levenshtein distance measure for the name and DOB was equal to 0 (exact match) and the minimum address distance was greater than 0, but less than or equal to 12. Examples in this category commonly have differences in how the zip code, apartment numbers or state code is presented in either the Primary or Mailing address strings. An example is given below.
FL Active Registration Record: SOUXIEE Q SMITH F 08/19/1968 1267 SLEEPY SONG PLACE SPRINGFIELD VA 22150
VA Active Registration Record: SOUXIEE Q SMITH F 08/19/1968 1267 SLEEPY SONG PL SPRINGFIELD VA 221504259
Category 3 Matches:
There were 44 matches in Category 3: where the Levenshtein distance measure for the name and DOB was equal to 1 and the minimum address distance was equal 0 (exact match). Examples in this category are most often due to hyphenation or misspellings in the name, or a change in Gender (i.e. from “M”->”U”). An example is given below.
FL Active Registration Record: BENNIE DAS M 05/14/1945 12345 PEPPERMINT PATTY CREST APT 1000 ASHBURN VA 201475724
VA Active Registration Record: BENNEE DAS M 05/14/1945 12345 PEPPERMINT PATTY CREST APT 1000 ASHBURN VA 201475724
Category 4 Matches:
There were 140 matches in Category 4: where the Levenshtein distance measure for the name and DOB was equal to 1 and the minimum address distance was greater than 0, but less than or equal to 12. Examples in this category are most often due to hyphenation or misspellings in the name, or a change in Gender (i.e. from “M”->”U”), as well as small differences in how the addresses are presented. An example is given below.
FL Active Registration Record: BENNIE DAS M 05/14/1945 1267 SLEEPY SONG PLACE SPRINGFIELD VA 22150
VA Active Registration Record: BENNEE DAS M 05/14/1945 1267 SLEEPY SONG PL SPRINGFIELD VA 221504259
Category 5 Matches:
There were 19 matches in Category 5: where the Levenshtein sistance measure for the name and DOB was equal to 2 and the minimum address distance was equal 0 (exact match). Examples in this category are most often due to a middle name/initial being present in one record and not being present in the other. An example is given below.
FL Active Registration Record: BENNIE DAS M 05/14/1945 12345 PEPPERMINT PATTY CREST APT 1000 ASHBURN VA 201475724
VA Active Registration Record: BENNIE C DAS M 05/14/1945 12345 PEPPERMINT PATTY CREST APT 1000 ASHBURN VA 201475724
Category 6 Matches:
There were 68 matches in Category 3: where the Levenshtein Distance measure was equal to 1 and the minimum address distance was greater than 0, but less than or equal to 12. Examples in this category are most often due to a middle name/initial being present in one record and not being present in the other, as well as small differences in how the addresses are presented. An example is given below.
FL Active Registration Record: BENNIE C DAS M 05/14/1945 1267 SLEEPY SONG PLACE SPRINGFIELD VA 22150
VA Active Registration Record: BENNIE DAS M 05/14/1945 1267 SLEEPY SONG PL SPRINGFIELD VA 221504259
Table of Results by VA Locality:
Row Labels
LD=0, AD=0
LD=0, 0<AD<=12
LD=1, AD=0
LD=1, 0<AD<=12
LD=2, AD=0
LD=2, 0<AD<=12
ACCOMACK COUNTY
3
8
1
1
0
0
ALBEMARLE COUNTY
13
24
0
1
0
0
ALEXANDRIA CITY
15
52
1
6
1
1
ALLEGHANY COUNTY
1
3
0
1
0
0
AMELIA COUNTY
2
2
0
0
0
0
AMHERST COUNTY
3
2
0
0
0
0
APPOMATTOX COUNTY
5
0
0
0
1
0
ARLINGTON COUNTY
27
53
2
8
2
6
AUGUSTA COUNTY
3
8
0
1
1
0
BEDFORD COUNTY
4
15
0
1
0
0
BOTETOURT COUNTY
7
2
0
0
0
0
BRISTOL CITY
3
2
0
0
0
0
BRUNSWICK COUNTY
1
2
0
0
0
0
BUCHANAN COUNTY
1
0
0
0
0
0
BUCKINGHAM COUNTY
0
1
0
0
0
0
CAMPBELL COUNTY
2
3
1
1
0
0
CAROLINE COUNTY
0
2
0
0
0
0
CARROLL COUNTY
1
6
0
1
0
0
CHARLOTTE COUNTY
1
4
0
0
0
0
CHARLOTTESVILLE CITY
4
6
0
0
0
1
CHESAPEAKE CITY
27
87
4
13
1
4
CHESTERFIELD COUNTY
28
49
2
5
0
3
CLARKE COUNTY
0
2
0
0
0
0
COLONIAL HEIGHTS CITY
0
1
1
0
0
0
CRAIG COUNTY
2
1
0
0
0
0
CULPEPER COUNTY
6
8
0
0
0
0
CUMBERLAND COUNTY
2
0
0
0
0
0
DANVILLE CITY
2
1
0
0
0
0
DICKENSON COUNTY
1
3
0
0
0
0
DINWIDDIE COUNTY
0
3
0
1
0
0
ESSEX COUNTY
2
0
0
0
0
0
FAIRFAX CITY
3
6
0
0
0
0
FAIRFAX COUNTY
108
259
7
14
4
15
FALLS CHURCH CITY
2
2
0
0
0
1
FAUQUIER COUNTY
4
14
1
0
0
0
FLOYD COUNTY
1
1
1
0
0
0
FLUVANNA COUNTY
2
3
0
2
0
0
FRANKLIN CITY
3
1
0
0
0
0
FRANKLIN COUNTY
5
6
0
1
0
1
FREDERICK COUNTY
10
9
0
2
0
0
FREDERICKSBURG CITY
1
7
0
0
0
0
GALAX CITY
2
0
0
0
0
0
GILES COUNTY
0
0
0
1
0
0
GLOUCESTER COUNTY
6
17
0
1
1
0
GOOCHLAND COUNTY
2
2
1
0
1
0
GRAYSON COUNTY
1
3
0
1
0
0
GREENE COUNTY
0
5
0
0
0
0
HALIFAX COUNTY
1
2
0
1
0
0
HAMPTON CITY
10
16
0
6
0
0
HANOVER COUNTY
2
6
1
2
1
0
HARRISONBURG CITY
1
6
0
1
0
0
HENRICO COUNTY
24
33
0
3
0
1
HENRY COUNTY
3
5
0
1
0
0
ISLE OF WIGHT COUNTY
4
13
0
1
0
2
JAMES CITY COUNTY
23
25
1
1
0
0
KING GEORGE COUNTY
2
4
1
0
0
1
KING WILLIAM COUNTY
2
0
0
0
0
0
LANCASTER COUNTY
2
1
1
0
0
1
LEE COUNTY
3
1
0
0
0
0
LEXINGTON CITY
0
2
0
0
0
0
LOUDOUN COUNTY
29
73
1
1
2
2
LOUISA COUNTY
5
2
0
0
0
0
LYNCHBURG CITY
6
15
0
2
0
0
MADISON COUNTY
2
0
0
0
0
0
MANASSAS CITY
3
0
0
0
0
0
MANASSAS PARK CITY
1
0
0
0
0
0
MARTINSVILLE CITY
2
1
0
0
0
0
MATHEWS COUNTY
0
3
0
0
0
0
MECKLENBURG COUNTY
3
2
0
0
0
0
MIDDLESEX COUNTY
0
4
0
1
0
0
MONTGOMERY COUNTY
6
11
1
1
0
0
NELSON COUNTY
1
2
0
1
0
0
NEW KENT COUNTY
0
6
0
0
0
0
NEWPORT NEWS CITY
8
17
0
1
0
2
NORFOLK CITY
14
58
0
11
0
1
NORTHUMBERLAND COUNTY
2
1
1
0
0
0
NOTTOWAY COUNTY
0
1
0
0
0
0
ORANGE COUNTY
5
6
1
0
0
0
PAGE COUNTY
1
2
0
0
0
0
PATRICK COUNTY
0
2
0
0
0
0
PETERSBURG CITY
2
1
0
0
0
0
PITTSYLVANIA COUNTY
3
7
0
1
0
0
POQUOSON CITY
1
0
0
0
0
0
PORTSMOUTH CITY
5
9
1
1
0
0
POWHATAN COUNTY
2
2
0
1
0
0
PRINCE EDWARD COUNTY
0
2
0
0
0
0
PRINCE GEORGE COUNTY
1
1
1
1
0
1
PRINCE WILLIAM COUNTY
40
83
2
11
3
3
PULASKI COUNTY
2
2
0
0
0
0
RADFORD CITY
0
2
0
0
0
0
RAPPAHANNOCK COUNTY
0
2
1
0
0
0
RICHMOND CITY
12
29
1
3
0
0
ROANOKE CITY
14
12
1
2
0
0
ROANOKE COUNTY
14
15
0
0
0
1
ROCKBRIDGE COUNTY
2
2
2
0
0
0
ROCKINGHAM COUNTY
1
5
0
1
0
1
RUSSELL COUNTY
0
3
0
0
0
1
SALEM CITY
2
1
0
0
0
0
SCOTT COUNTY
2
0
0
0
0
0
SHENANDOAH COUNTY
0
1
0
1
0
1
SMYTH COUNTY
1
2
0
0
0
0
SOUTHAMPTON COUNTY
0
2
0
1
0
0
SPOTSYLVANIA COUNTY
10
19
1
1
0
0
STAFFORD COUNTY
20
48
0
4
0
4
STAUNTON CITY
1
2
0
0
0
0
SUFFOLK CITY
12
31
0
0
0
1
TAZEWELL COUNTY
0
5
0
1
0
0
VIRGINIA BEACH CITY
46
177
1
11
1
12
WARREN COUNTY
2
4
0
0
0
0
WASHINGTON COUNTY
3
5
1
1
0
0
WAYNESBORO CITY
1
3
0
0
0
0
WESTMORELAND COUNTY
5
2
0
0
0
1
WILLIAMSBURG CITY
1
1
0
0
0
0
WINCHESTER CITY
0
6
0
0
0
0
WISE COUNTY
0
7
0
0
0
0
WYTHE COUNTY
0
0
0
1
0
0
YORK COUNTY
12
35
2
2
0
0
Grand Total
698
1533
44
140
19
68
Tabulated Results by FL County Code:
Row Labels
LD=0, AD=0
LD=0, 0<AD<=12
LD=1, AD=0
LD=1, 0<AD<=12
LD=2, AD=0
LD=2, 0<AD<=12
MON
2
20
0
1
0
0
ALA
0
23
0
2
0
0
BAK
0
2
0
0
0
0
BAY
7
40
0
4
1
0
BRA
2
2
0
0
0
0
BRE
41
39
1
1
2
3
BRO
12
95
0
6
0
8
CHA
71
14
6
1
2
1
CIT
1
6
0
1
0
0
CLA
7
47
2
5
0
3
CLL
1
52
0
1
0
1
CLM
0
0
0
1
0
0
DAD
50
59
2
6
2
1
DES
1
1
0
0
0
0
DUV
28
114
4
21
1
9
ESC
19
103
1
10
0
3
FLA
5
11
0
1
2
2
FRA
1
1
0
0
0
0
GAD
1
0
0
1
0
0
GLA
1
0
0
0
0
0
GUL
0
4
0
0
0
0
HAM
3
0
0
0
0
0
HAR
3
1
0
0
0
0
HEN
1
0
0
0
0
0
HER
8
16
0
2
0
1
HIG
0
1
0
0
0
0
HIL
29
65
2
10
1
4
HOL
0
1
0
0
0
0
IND
9
11
1
0
1
0
JAC
0
2
0
0
0
0
LAK
1
10
0
1
0
1
LEE
0
46
0
3
0
1
LEO
35
9
2
0
1
0
LEV
3
0
1
0
0
0
MAD
0
0
1
0
0
0
MAN
31
21
1
1
0
1
MRN
26
16
0
1
0
1
MRT
40
6
2
2
1
1
NAS
4
12
0
1
0
0
OKA
50
31
3
0
1
2
OKE
1
0
0
0
0
0
ORA
1
139
0
9
0
4
OSC
4
15
1
0
0
0
PAL
35
89
3
10
0
2
PAS
0
30
0
3
0
1
PIN
4
88
0
6
0
3
POL
0
62
0
9
0
2
PUT
2
1
0
0
0
0
SAN
13
42
0
3
0
2
SAR
17
18
1
1
2
0
SEM
53
34
5
3
0
3
STJ
8
22
1
5
0
3
STL
60
20
4
2
2
1
SUM
2
29
0
3
0
1
SUW
3
3
0
0
0
0
TAY
0
2
0
0
0
0
VOL
0
51
0
3
0
3
WAK
1
1
0
0
0
0
WAL
1
6
0
0
0
0
Grand Total
698
1533
44
140
19
68
Addendum + Updates:
In response to a number of questions we have received on this topic, and continued work to dig into this data:
The number of matches above has been corrected from the original 2,527 to 2,502 (a difference of 25) due to a “fat-finger” error in tallying the total number of category 5 matches.
For the strict constraints given above, the number of matched records where there is a vote recorded for the same election date in both the VA and FL data is 13.
We also computed the number of exact [First Name + Middle Initial + Last Name + Gender + Full DOB] matches without requiring our additional address filter. This criteria is more strict in the initial match, but more loose in the subsequent filtering.
This results in a total of 17,701 matches when considering only Active voters on each of the FL and VA voter lists.
There are 343 of these matches where both FL and VA records have a history of votes cast in the same election.
The number jumps to 81,155 if we consider either Active or Inactive registrations.
There are 382 of these matches where both FL and VA records have a history of votes cast in the same election.
Below you will find the current summary data and graphics from the 2024 VA June Democratic Primary Election Daily Absentee List files. We pull the DAL file everyday and track the count of each specific ballot category in each daily file.
Note: Page may take a moment to load the graphics objects.
Place your cursor over the series name in the legend at right to see the series highlighted in the graphic. Place your cursor over a specific data point to see that data points value.
The logarithmic plot is the same underlying data as the linear scale plot, except with a logarithmic y-scale in order to be able to compress the dynamic range and see the shape of all of the data curves in a single graphic. Place your cursor over the series name in the legend at right to see the series highlighted in the graphic. Place your cursor over a specific data point to see that data points value.
The underlying data for the graphics above is provided in the summary data table.
Additional Data:
Additional CSV datasets stratified by Locality, City, Congressional District, State House District, State Senate District, and Precinct are available here.
Data column descriptions:
“ISSUED” := Number of DAL file records where BALLOT_STATUS= “ISSUED”
“NOT_ISSUED” := Number of DAL file records where BALLOT_STATUS= “NOT ISSUED”
“PROVISIONAL” := Number of DAL file records where BALLOT_STATUS= “PROVISIONAL” and APP_STATUS=”APPROVED”
“DELETED” := Number of DAL file records where BALLOT_STATUS= “DELETED”
“MARKED” := Number of DAL file records where BALLOT_STATUS= “MARKED” and APP_STATUS=”APPROVED”
“ON_MACHINE” := Number of DAL file records where BALLOT_STATUS= “ON_MACHINE” and APP_STATUS=”APPROVED”
“PRE_PROCESSED” := Number of DAL file records where BALLOT_STATUS= “PRE-PROCESSED” and APP_STATUS=”APPROVED”
“FWAB” := Number of DAL file records where BALLOT_STATUS= “FWAB” and APP_STATUS=”APPROVED”
“MAIL_IN” := The sum of “MARKED” + “PRE_PROCESSED”
“COUNTABLE” := The sum of “PROVISIONAL” + “MARKED” + “PRE_PROCESSED” + “ON_MACHINE” + “FWAB”
“MILITARY” := Number of DAL file records where VOTER_TYPE= “MILITARY”
“OVERSEAS” := Number of DAL file records where VOTER_TYPE= “OVERSEAS”
“TEMPORARY” := Number of DAL file records where VOTER_TYPE= “TEMPORARY”
“MILITARY_COUNTABLE” := Number of DAL file records where VOTER_TYPE= “MILITARY” and where COUNTABLE is True
“OVERSEAS_COUNTABLE” := Number of DAL file records where VOTER_TYPE= “OVERSEAS” and where COUNTABLE is True
“TEMPORARY_COUNTABLE” := Number of DAL file records where VOTER_TYPE= “TEMPORARY” and where COUNTABLE is True
All data purchased by Electoral Process Education Corp. (EPEC) from the VA Dept of Elections (ELECT). All processing performed by EPEC.
If you like the work that EPEC is doing, please support us with a donation.
Below you will find the current summary data and graphics from the 2024 VA June Republican Primary Election Daily Absentee List files. We pull the DAL file everyday and track the count of each specific ballot category in each daily file.
Note: Page may take a moment to load the graphics objects.
Place your cursor over the series name in the legend at right to see the series highlighted in the graphic. Place your cursor over a specific data point to see that data points value.
The logarithmic plot is the same underlying data as the linear scale plot, except with a logarithmic y-scale in order to be able to compress the dynamic range and see the shape of all of the data curves in a single graphic. Place your cursor over the series name in the legend at right to see the series highlighted in the graphic. Place your cursor over a specific data point to see that data points value.
The underlying data for the graphics above is provided in the summary data table.
Additional Data:
Additional CSV datasets stratified by Locality, City, Congressional District, State House District, State Senate District, and Precinct are available here.
Data column descriptions:
“ISSUED” := Number of DAL file records where BALLOT_STATUS= “ISSUED”
“NOT_ISSUED” := Number of DAL file records where BALLOT_STATUS= “NOT ISSUED”
“PROVISIONAL” := Number of DAL file records where BALLOT_STATUS= “PROVISIONAL” and APP_STATUS=”APPROVED”
“DELETED” := Number of DAL file records where BALLOT_STATUS= “DELETED”
“MARKED” := Number of DAL file records where BALLOT_STATUS= “MARKED” and APP_STATUS=”APPROVED”
“ON_MACHINE” := Number of DAL file records where BALLOT_STATUS= “ON_MACHINE” and APP_STATUS=”APPROVED”
“PRE_PROCESSED” := Number of DAL file records where BALLOT_STATUS= “PRE-PROCESSED” and APP_STATUS=”APPROVED”
“FWAB” := Number of DAL file records where BALLOT_STATUS= “FWAB” and APP_STATUS=”APPROVED”
“MAIL_IN” := The sum of “MARKED” + “PRE_PROCESSED”
“COUNTABLE” := The sum of “PROVISIONAL” + “MARKED” + “PRE_PROCESSED” + “ON_MACHINE” + “FWAB”
“MILITARY” := Number of DAL file records where VOTER_TYPE= “MILITARY”
“OVERSEAS” := Number of DAL file records where VOTER_TYPE= “OVERSEAS”
“TEMPORARY” := Number of DAL file records where VOTER_TYPE= “TEMPORARY”
“MILITARY_COUNTABLE” := Number of DAL file records where VOTER_TYPE= “MILITARY” and where COUNTABLE is True
“OVERSEAS_COUNTABLE” := Number of DAL file records where VOTER_TYPE= “OVERSEAS” and where COUNTABLE is True
“TEMPORARY_COUNTABLE” := Number of DAL file records where VOTER_TYPE= “TEMPORARY” and where COUNTABLE is True
All data purchased by Electoral Process Education Corp. (EPEC) from the VA Dept of Elections (ELECT). All processing performed by EPEC.
If you like the work that EPEC is doing, please support us with a donation.
Using the data provided by the VA Department of Elections (ELECT), we have identified at least 1,481 unique registrations that were identified as “Determined Non-Citizen” and removed by ELECT from the voter rolls since May of 2023. Of those 1,481 there were 335 that also had corresponding records of recent ballots cast in the official Voter History record. There were 838 associated ballots cast since Feb of 2019.
We submitted a FOIA request to the VA Attorney General’s office requesting any and all documents regarding any prosecutions for non-citizen voters in the same time period as our data covers. We received a response that no relevant records were identified.
Correction Note 2024-08-27: After reviewing this article in response to a question from a local VA electoral board member, it was discovered that there are inaccuracies in the table presented below. I am working to determine the root cause. My best guess at the moment is that these errors are due to (my) human error when I was creating the pivot table to author this blog post. Updates to follow, as I am working to recreate the data analysis that went into generating this blog post from the raw source material and archived code revisions. It should be noted that more recent data and analysis on this topic has been posted here, but for completeness I want to make sure that this historical post is corrected and reviewed as well for any errors or issues.
Background:
The VA Department of Elections continuously tries to identify and remove invalid or out of date registration records from the voter rolls. One category used for removal is if a registrant has been determined to be a non-citizen. It is required by the VA Constitution that only citizens are allowed to vote in VA elections.
In elections by the people, the qualifications of voters shall be as follows: Each voter shall be a citizen of the United States, shall be eighteen years of age, shall fulfill the residence requirements set forth in this section, and shall be registered to vote pursuant to this article. …
Additionally, according to VA Code Section 24.2-1004, the act of knowingly casting a ballot by someone who is not eligible to vote is a Class 6 felony.
A. Any person who wrongfully deposits a ballot in the ballot container or casts a vote on any voting equipment, is guilty of a Class 1 misdemeanor.
B. Any person who intentionally (i) votes more than once in the same election, whether those votes are cast in Virginia or in Virginia and any other state or territory of the United States, (ii) procures, assists, or induces another to vote more than once in the same election, whether those votes are cast in Virginia or in Virginia and any other state or territory of the United States, (iii) votes knowing that he is not qualified to vote where and when the vote is to be given, or (iv) procures, assists, or induces another to vote knowing that such person is not qualified to vote where and when the vote is to be given is guilty of a Class 6 felony.
ELECT makes available for purchase by qualifying parties various different data sets, including the registered voter list (RVL) and the voter history list information file (VHL). Additionally, ELECT makes available a Monthly Update Service (MUS) subscription that is published at the beginning of each month and contains (almost) all of the Voter List changes and transactions for the previous period.
In the MUS data there is a “NVRAReasonCode” field that is associated with each transaction that gives the reason for the update or change in the voter record. This is in accordance with the disclosure and transparency requirements in the NVRA. One of the possible reason codes given for records that are removed is “Determined Non-Citizen.”
EPEC has been consistently purchasing and archiving all of these official records as part of our ongoing work to document and educate the public as to the ongoing operations of our elections. (If your interested in supporting this work, please head on over to our donation page, or to our give-send-go campaign to make a tax-deductible donation, as these data purchases are not cheap!)
EPEC looked at the number of records associated with unique voter identification numbers that had been identified for removal from the voter record due to non-citizenship status, per the entries in the MUS, and correlated those results with our accumulated voter history list information in order to determine how many non-citizen registrations had corresponding records of ballots cast in previous elections. We only considered those records that are currently in a non-active state as of the latest MUS transaction log, as some determinations of non-citizenship status in the historical MUS transaction log might have been due to error and subsequently corrected and reinstated to active status. That is, we are not considering those records that had a “Determined Non-Citizen” disqualification, but were then subsequently reinstated and reactivated by ELECT.
Results:
There were 1,481 unique voter records marked for removal with the reason of “Determined Non-Citizen” and not subsequently reinstated in the accumulated MUS record that EPEC began collecting in mid-2023. Of those 1,481 records there were 335 unique voter ID’s that also had a record of casting one or more ballots in the accumulated vote history data that EPEC has been gathering, for a total of 838 ballots cast that can be identified since Feb of 2019. Figure 1 shows the distribution of non-citizen voters in the cumulative MUS file history. The blue trace represent the total identified and CANCELED non-citizen registrations, and the yellow trace represents the number of those records that also had corresponding records in the accumulated voter history data.
Note that the data contained in the MUS updates often covers more than a single month period. In other words, the individual MUS files are oversampled. Subsequent MUS files can therefore also have repeated entries from previous versions, as their data may overlap. Our analysis used the first unique entry for a given voter ID marked as “Determined Non-Citizen” in the cumulative MUS record in order to build Figure 1. This data oversampling in the MUS helps explain the relative increase in the May 2023 bin, and similar decrease in Feb 2024 that can be observed in Figure 1.
The distribution of identified unique voter ID’s for the 335 identified non-citizen voters per VA locality is given below in Table 1. It should be noted that each ballot record has a specific locality associated with where the ballot was cast, whereas unique individuals might move between localities over time. The assignment of unique identified individuals to each locality in table 1 is therefore based on the locality listed in the specific MUS “Determined Non-Citizen” record for that individual, while the assignment of ballot cast to Localities is based on the individual VHL records. A person could have lived and voted multiple times in one county, then moved to another county and voted again before finally being determined as a non-citizen. The same person would have generated multiple VHL records for each ballot cast, and associated with potentially different localities. This should be kept in mind when attempting to interpret Table 1.
Locality Name
Individuals
Ballots
FAIRFAX COUNTY
58
135
LOUDOUN COUNTY
36
103
PRINCE WILLIAM COUNTY
31
74
RICHMOND CITY
21
67
CHESTERFIELD COUNTY
20
48
ALEXANDRIA CITY
16
33
NORFOLK CITY
13
20
VIRGINIA BEACH CITY
12
22
ARLINGTON COUNTY
10
32
CHESAPEAKE CITY
9
24
POWHATAN COUNTY
9
1
YORK COUNTY
8
28
NORTHUMBERLAND COUNTY
8
4
HARRISONBURG CITY
8
3
SUFFOLK CITY
7
18
STAFFORD COUNTY
4
12
WARREN COUNTY
4
11
RUSSELL COUNTY
4
1
CLARKE COUNTY
3
4
HENRY COUNTY
3
2
NEWPORT NEWS CITY
2
33
PORTSMOUTH CITY
2
31
JAMES CITY COUNTY
2
9
HENRICO COUNTY
2
7
CHARLOTTESVILLE CITY
2
6
FAIRFAX CITY
2
6
WASHINGTON COUNTY
2
6
CAROLINE COUNTY
2
5
SPOTSYLVANIA COUNTY
2
5
NEW KENT COUNTY
2
4
ALBEMARLE COUNTY
2
3
PRINCE EDWARD COUNTY
2
3
LYNCHBURG CITY
2
2
HAMPTON CITY
1
14
MECKLENBURG COUNTY
1
9
ROCKINGHAM COUNTY
1
9
MANASSAS CITY
1
4
PETERSBURG CITY
1
4
AMELIA COUNTY
1
3
ORANGE COUNTY
1
3
SOUTHAMPTON COUNTY
1
3
SUSSEX COUNTY
1
3
BRUNSWICK COUNTY
1
2
FAUQUIER COUNTY
1
2
GREENE COUNTY
1
2
AUGUSTA COUNTY
1
1
BEDFORD COUNTY
1
1
CULPEPER COUNTY
1
1
DANVILLE CITY
1
1
DINWIDDIE COUNTY
1
1
FRANKLIN COUNTY
1
1
FREDERICK COUNTY
1
1
FREDERICKSBURG CITY
1
1
LOUISA COUNTY
1
1
PRINCE GEORGE COUNTY
1
1
SHENANDOAH COUNTY
1
1
WINCHESTER CITY
1
1
FRANKLIN CITY
1
0
CAMPBELL COUNTY
0
6
335
838
Table 1: Distribution of unique individuals determined to be non-citizens that voted in each locality, and the number of total non-citizen identified ballots cast.
The distribution of the 838 ballots that were identified as being cast by non-citizen voters (yellow trace in Figure 1) in previous elections is shown in Figure 2a. The most significant spikes are in the 2019, 2020, 2021 and 2022 November General elections, as well as the 2020 March Democratic presidential primary. Figure 2b, which shows this distribution as a percentage of votes cast, was added on 3/24/2024 per feedback on X/Twitter after the initial posting of this article.
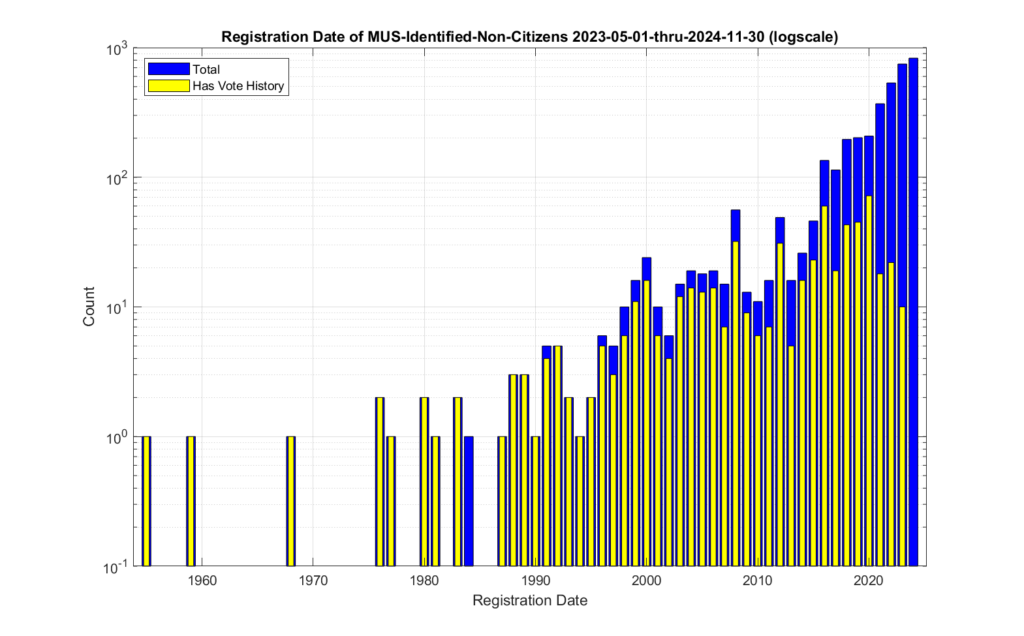
Figures 3 and 4 show the distribution of the registration dates of the identified non-citizen records. The same data is plotted in figure 3 and 4, with the only difference being the scale of the Y-axis in order to better observe the dynamic range of the values. When we look at the registration date of these identified records, we see that there is a distinct relative increase starting around 1996, and then again around 2012.
EPEC made a FOIA request to the VA Attorney General’s office on March 11, 2024 inquiring for any records regarding how many prosecutions for non-citizen voting had occurred since June of 2023. We received a response that the AG had no such relevant records.
It should be noted for completeness that if we consider records that have been “Determined Non-Citizen” at any point in the MUS logs, regardless of their current status, we find 1,532 individual records that have been determined non-citizens. Of the 1,532 there was 379 with corresponding vote histories, accounting for 1,019 ballots cast. Omitting the reinstated and reactivated records results in a percent difference of (1532-1481)/1532*100 = 3.33% diff in total determined non-citizen records, (379-335)/379*100 = 11.6% diff in number of determined non-citizen voters, and (1019-838)/1019*100 = 17.76% diff in number of determined non-citizen ballots.
Discussion
It appears from the MUS data, that the VA Department of Elections (ELECT) is doing routine identification, cleanup and removal of non-citizen registrations, which is a good thing and we commend them for their continued efforts to maintain clean voter registration lists.
However, the fact that a small number of these identified non-citizen registrations are also associated with (presumably … if the data from ELECT is accurate) illegally cast ballots in previous elections does raise a number of questions that citizens should be (politely) asking and discussing with their legislators, elected and appointed government officials. Each act of non-citizen voting is a de-facto disenfranchisement of legal voters rights, and is a punishable offense under VA law.
Q: How did these registrants get placed onto the voter rolls in the first place?
Q: What method and/or data sources are used by the state to identify non-citizen registrations for removal? If that process is exhaustive, and covers all registrations, then these numbers might be considered to represent a statistical complete picture of the problem. If that process is not exhaustive, in that it only uses serendipitous corroborating data sources, then these results likely under-represent the scale of the issues.
Q: As noted above, we are only considering here those individuals who have not had their records re-instated or reactivated after a determination of non-citizen status. We do not have enough information to determine how or why some records were first determined to be non-citizen, canceled and then subsequently re-instated. One potential area of concern is determining whether or not registrants might be falsely or errantly claiming to not be a citizen on official documents in order to be excused from jury duty, for example, and then work to re-instate their voting status once those documents percolate through the system to ELECT and are flagged for removal. This is a wholly separate but serious issue, as making false claims on official documents is itself a punishable offense.
Q: What procedures, processes and technical solutions are in place to prevent current or future registration and casting of ballots by non-citizens? This is especially pertinent given the current state of the flow of illegal immigrants crossing our national borders. According to a recent report by Yahoo Finance, VA is one of the top 30 destinations for illegal migrants, with both Loudoun County and Fairfax making the list.
Q: Why have none of the identified non-citizens who also cast ballots been investigated or prosecuted under VA Code 24.2-1004? As the identification of these ballots comes directly from looking at the official records produced by ELECT, it seems prudent for these to be forwarded by ELECT to the AG’s office with a recommendation to investigate and prosecute. Yet our FOIA request to the VA AG’s office inquiring as to any records associated with these types of investigations or prosecutions produced a “no relevant records exist” response.
Additionally, this evidence which is derived from only official state records, directly contradicts multiple news media reports and attestations that non-citizen voting is a “Myth”, and that non-citizen voting happens “almost never”. If the data from ELECT is accurate, then there are at least 838 ballots that have been cast by non-citizen voters just since 2019. Now, that is still very infrequent, but it is not “almost never.” It is a legitimate concern … and these discoveries are only the registrations that have been found and removed from the voter roles by ELECT and that we can observe in the data. We do not know how many exist that we do not know about.
Last week I got asked a question as to what information is actually contained in the 2D barcode on VA drivers licenses. I didn’t know the answer, so I did some digging.
EPEC has identified at least 28 individual voter IDs in the 2024 VA March Primaries who, according to the Daily Absentee List (DAL) files purchased from the VA Department of Elections (a.k.a. “ELECT”), have a record showing they voted in both the Republican and Democratic primaries.
All of the records identified have the same voter ID and voter information appearing in both the Democratic and Republican DAL files and are recorded as having voted In-Person Early (a.k.a. an “On Machine” ballot). 26 of the individual voter IDs identified have nearly identical timestamps associated with their duplicated ballots, while 2 have significantly differing timestamps.
The number of identified records fall into a small handful of localities:
Hanover County had 1 identified record (different timestamps)
Northampton County had 1 identified record (different timestamps)
Bath County had 12 identified records
Norfolk County had 11 identified records
Franklin County had 1 identified record
Harrisonburg City had 1 identified record
Staunton City had 1 identified record
Note that the localities with identified records utilize differing poll-book or poll-pad vendors and optical scanners, so it is unlikely that these errors are due to being associated with a particular vendor.
It is not clear at this point if these records are simply errant due to technology, policy, and/or procedural issues, or if these records truly reflect individuals that cast ballots in both primaries, which is a felony according to VA law. Section 24.2-1004 of the VA code states:
B. Any person who intentionally (i) votes more than once in the same election, whether those votes are cast in Virginia or in Virginia and any other state or territory of the United States, (ii) procures, assists, or induces another to vote more than once in the same election, whether those votes are cast in Virginia or in Virginia and any other state or territory of the United States, (iii) votes knowing that he is not qualified to vote where and when the vote is to be given, or (iv) procures, assists, or induces another to vote knowing that such person is not qualified to vote where and when the vote is to be given is guilty of a Class 6 felony.
The VA Department of Elections (“ELECT”) also states:
Virginia will have a dual presidential primary election, which means both the Democratic Party and the Republican Party will have primaries on the same day.
In a dual primary, officers of election will ask voters if they want to cast their ballot in the Democratic Party Primary or the Republican Party Primary. All qualified voters may vote in either primary, but voters may not vote in both primaries.
Examining the Election Night Reporting data from the VA 2024 March Democratic and Republican primaries provides supporting evidence that the Republican primary was impacted and skewed by a large number of Democratic “crossover” voters, resulting in an irregular election fingerprint when the data is plotted.
Background
The US National Academy of Sciences (NAS) published a paper in 2012 titled “Statistical detection of systematic election irregularities.” [1] The paper asked the question, “How can it be distinguished whether an election outcome represents the will of the people or the will of the counters?” The study reviewed the results from elections in Russia and other countries, where widespread fraud was suspected. The study was published in the proceedings of the National Academy of Sciences as well as referenced in multiple election guides by USAID [2][3], among other citations.
The study authors’ thesis was that with a large sample sample of the voting data, they would be able to see whether or not voting patterns deviated from the voting patterns of elections where there was no suspected fraud. The results of their study proved that there were indeed significant deviations from the expected, normal voting patterns in the elections where fraud was suspected, as well as provided a number of interesting insights into the associated “signatures” of various electoral mechanism as they present themselves in the data.
Statistical results are often graphed, to provide a visual representation of how normal data should look. A particularly useful visual representation of election data, as utilized in [1], is a two-dimensional histogram of the percent voter turnout vs the percent vote share for the winner, or what I call an “election fingerprint”. Under the assumptions of a truly free and fair election, the expected shape of the fingerprint is of that of a 2D Gaussian (a.k.a. a “Normal”) distribution [4]. The obvious caveat here is that no election is ever perfect, but with a large enough sample size of data points we should be able to identify large scale statistical properties.
In many situations, the results of an experiment follow what is called a ‘normal distribution’. For example, if you flip a coin 100 times and count how many times it comes up heads, the average result will be 50. But if you do this test 100 times, most of the results will be close to 50, but not exactly. You’ll get almost as many cases with 49, or 51. You’ll get quite a few 45s or 55s, but almost no 20s or 80s. If you plot your 100 tests on a graph, you’ll get a well-known shape called a bell curve that’s highest in the middle and tapers off on either side. That is a normal distribution.
In a free and fair election, the plotted graphs of both the Turnout percentage and the percentage of Vote Share for Election Winner should (again … ideally) both resemble Gaussian “Normal” distributions; and their combined distribution should also follow a 2-dimensional Gaussian (or “normal”) distribution. Computing this 2 Dimensional joint distribution of the % Turnout vs. % Vote Share is what I refer to as an “Election Fingerprint”.
Figure 1 is reprinted examples from the referenced National Academy of Sciences paper. The actual election results in Russia, Uganda and Switzerland appear in the left column, the right column is the modeled expected appearance in a fair election with little fraud, and the middle column is the researchers’ model of the as-collected data, with any possible fraud mechanisms included.
As you can see, the election in Switzerland (assumed fair) shows a range of voter turnout, from approximately 30 – 70% across voting districts, and a similar range of votes for the winner. The Switzerland data is consistent across models, and does not show any significant irregularities.
What do the clusters mean in the Russia 2011 and 2012 elections? Of particular concern are the top right corners, showing nearly 100% turnout of voters, and nearly 100% of them voted for the winner.
Both of those events (more than 90% of registered voters turning out to vote and more than 90% of the voters voting for the winner) are statistically improbable, even for very contested elections. Election results that show a strong linear streak away from the main fingerprint lobe indicates ‘ballot stuffing,’ where ballots are added at a specific rate. Voter turnout over 100% indicates ‘extreme fraud’. [1][5]
Note that election results with ‘outliers’ – results that fall outside of expected normal voting patterns – while evidentiary indicators, are not in and of themselves definitive proof of outright fraud or malfeasance. For example, in rare but extreme cases, where the electorate is very split and the split closely follows the geographic boundaries between voting precincts, we could see multiple overlapping Gaussian lobes in the 2D image. Even in that rare case, there should not be distinct structures visible in the election fingerprint, linear streaks, overly skewed or smeared distributions, or exceedingly high turnout or vote share percentages. Additional reviews of voting patterns and election results should be conducted whenever deviations from normal patterns occur in an election.
Additionally it should be noted that “the absence of evidence is not the evidence of absence”: Election Fingerprints that look otherwise normal might still have underlying issues that are not readily apparent with this view of the data.
Results on 2024 VA March Primaries:
Figure 2 and Figure 3 are the computed election fingerprints for the Democratic and Republican VA 2024 March Primaries, respectively. They were computed according to the NAS paper and using official state reported voter turnout and votes for the statewide winner and reported per voting Locality with combined In-Person Early, Election Day, Absentee and Provisional votes. Figures 4 and 5 perform the same process, except each data point is generated per individual precinct in a locality. The color scale moves from precincts with low counts as deep blue, to precincts with high numbers represented as bright yellow. Note that a small blurring filter was applied to the computed image for ease of viewing small isolated Locality or Precinct results.
The upper right inset in each graphic image was computed per the NAS paper; the bottom left inset shows what an idealized model of the data could or should look like, based on the reported voter turnout and vote share for the winner. This ideal model is allowed to have up to 3 Gaussian lobes based on the peak locations and standard deviations in the reported results. The top-left and bottom-right inset plots show the sum of the rows and columns of the fingerprint image. The top-left graph corresponds to the sum of the rows in the upper right image and is the histogram of the vote share for the winner across precincts. The bottom right graph shows the sum of the columns of the upper right image, and is the histogram of the percentage turnout across voting localities.
Figure 2 Democratic primary, accumulated per Locality:
Figure 3 Republican primary, accumulated per Locality:
Figure 4 Democratic primary, accumulated per Precinct:
Figure 5 Republican primary, accumulated per Precinct:
Analysis:
As can be seen in Figure 2 and 4, the Democratic primary fingerprint looks to fall within expected normal distribution. Even though the total vote share for the winner (Biden) is up around 90%, this was not unexpected given the current set of contestants and the fact that Biden is the incumbent.
The Republican primary results, as shown in Figure 3 and 5, show significant “smearing” of the percent of total vote share for the winner. The percent of voter turnout (x-axis) does however show a near Gaussian distribution, which is what one would expect. The republican primary data does not show the linear streaking pattern that the authors in [1] correlate with extreme fraud, but significant smearing of the distribution is observed.
A consideration that might partially explain this smearing of the histogram, is that there was at least 17% of “crossover voters” who historically lean Democrat but voted in the Republican primary (see here for more information). Multiple news reports and exit polling suggest that this was due in part to loosely organized efforts by the opposing party to cast “Protest Votes” and artificially inflate the challenger (Haley) and dilute the expected (Trump) margin of victory for the winner, with no intention of supporting a Republican candidate in the General Election. (This is completely legal in VA, by the way, as VA does not require by-party voter registration.)
If we categorize each locality as being either Democratic or Republican leaning based on the average results of the last four presidential elections, and then split the computation of the per precinct results into separate parts accordingly, we can see this phenomenon much clearer.
Figure 6 shows the per-precinct results for only those locality precincts that belong to historic Republican leaning localities. It depicts a much tighter distribution and has much less smearing or blurring of the distribution tails. We can see from the data that Republican base in historically Republican leaning localities seems solidly behind candidate Trump.
Figure 7 shows the per-precinct results for only those locality precincts that belong to historic Democratic leaning localities. It can clearly be seen by comparing the two plots that the major contributor to the spread of the total republican primary distribution is the votes from historically Democratic leaning localities.
Figure 6 Republican primary, accumulated per Precinct in Republican leaning localities:
Figure 7 Republican primary, accumulated per Precinct in Democratic leaning localities:
References:
[1] “Statistical detection of election irregularities” Peter Klimek, Yuri Yegorov, Rudolf Hanel, Stefan Thurner Proceedings of the National Academy of Sciences Oct 2012, 109 (41) 16469-16473; DOI: 10.1073/pnas.1210722109 (https://www.pnas.org/content/109/41/16469)
[5] Mebane, Walter R. and Kalinin, Kirill, Comparative Election Fraud Detection (2009). APSA 2009 Toronto Meeting Paper, Available at SSRN: https://ssrn.com/abstract=1450078