I finally had some time to put this together.
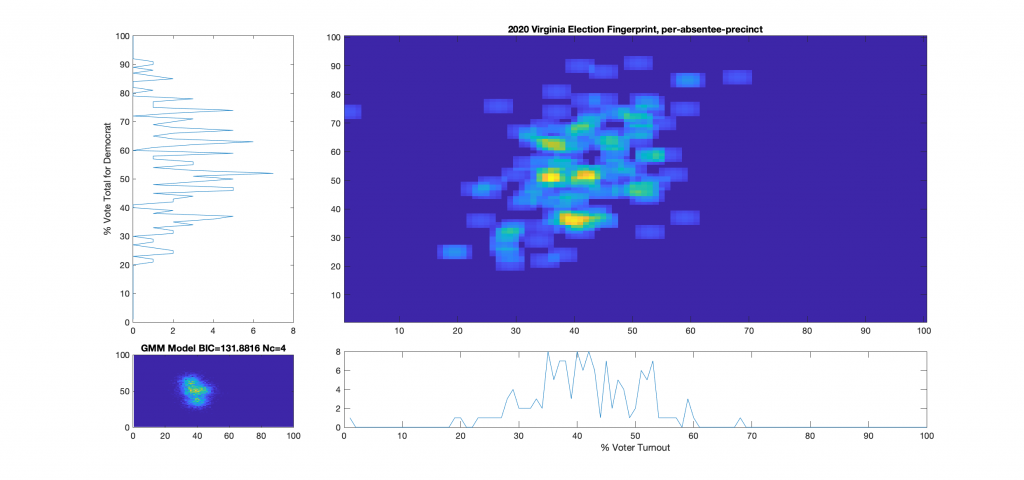
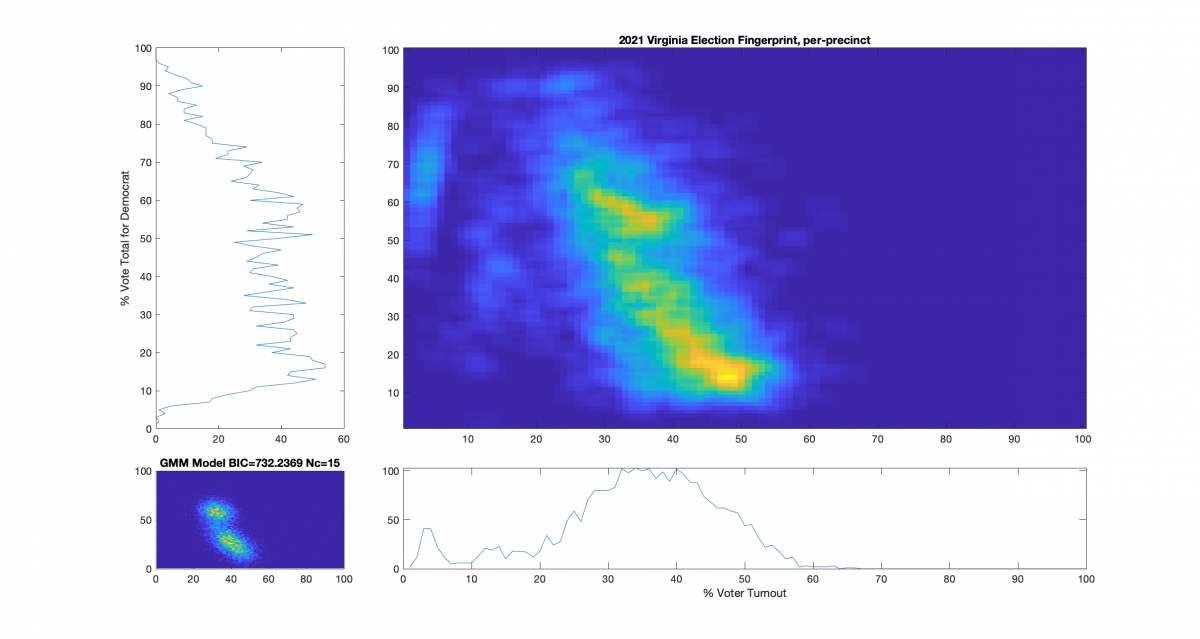
For additional background information, see here, here and here. As a reminder and summary, according to the published methods in the USAID funded National Academy of Sciences paper (here) that I based this work off of, an ideal “fair” election should look like one or two (depending on how split the electorate is) clean, compact Gaussian distributions (or “bulls-eye’s”). Other structural artifacts, while not conclusive, can be evidence and indicators of election irregularities. One such indicator with an attributed cause is that of a highly directional linear streaking, which implies an incremental fraud and linear correlation. Another known and attributed indicator is that of large distinct and extreme peaks near 100% or 0% votes for the candidate (the vertical axis) that are disconnected from the main Gaussian lobe which the authors label a sign of “extreme fraud”. In general, for free and fair elections, we expect these 2D histograms to show a predominantly uncorrelated relationship between the variables of “% Voter Turnout” (x-axis) and “% Vote Share” (y-axis).
The source data for this analysis comes directly from the VA Department of Elections servers, and was downloaded shortly after the conclusion and certification of the 2021 election results on 12/11/2021 (results file) and 12/12/2021 (turnout file). A link to the current version of these files, hosted by ELECT is here: https://apps.elections.virginia.gov/SBE_CSV/ELECTIONS/ELECTIONRESULTS/2021/2021%20November%20General%20.csv and https://apps.elections.virginia.gov/SBE_CSV/ELECTIONS/ELECTIONTURNOUT/Turnout-2021%20November%20General%20.csv. The files actually used for this analysis, as downloaded from the ELECT servers on the dates mentioned are posted at the end of this article.
Note that even though the republican (Youngkin) won in VA, the y-axis of these plots presented here was computed as the % vote share for the democratic candidate (McCauliffe) in order to more easily compare with the 2020 results. I can produce Yougkin vote share % versions as well if people are interested, and am happy to do so.
While the 2021 election fingerprints look to have less correlations between the variables as compared to 2020 data, they still look very non-gaussian and concerning. While there is no clearly observable “well-known” artifacts as called out in the NAS paper, there is definitely something irregular about the Virginia 2021 election data. Specifically, I find the per-precinct absentee [mail-in + post-election + early-in-person] plot (Figure 6) interesting as there is a diffuse background as well as a linearly correlated set of virtual precincts that show low turnout but very high vote share for the democratic candidate.
One of the nice differences about 2021 VA data is that they actually identified the distinctions between mail-in, early-in-person, and post-election vote tallies in the CAP’s this year. I have broken out the individual sub-groups as well and we can see that the absentee early-in-person (Figure 9) has a fairly diffuse distribution, while the absentee mail-in (Figure 7) and absentee post-election (Figure 8) ballots show a very high McAuliffe Vote %, and what looks to be a linear correlation.
For comparison I’ve also included the 2020 fingerprints. All of the 2020 fingerprints have been recomputed using the exact same MATLAB source code that processed the 2021 data. The archive date of the “2020 November General.csv” and “Turnout 2020 November General.csv” files used was 11/30/2020.
I welcome any and all independent reviews or assistance in making and double checking these results, and will gladly provide all collated source data and MATLAB code to anyone who is interested.
Figure 1 : VA 2021 Per locality, absentee (CAP) + physical precincts
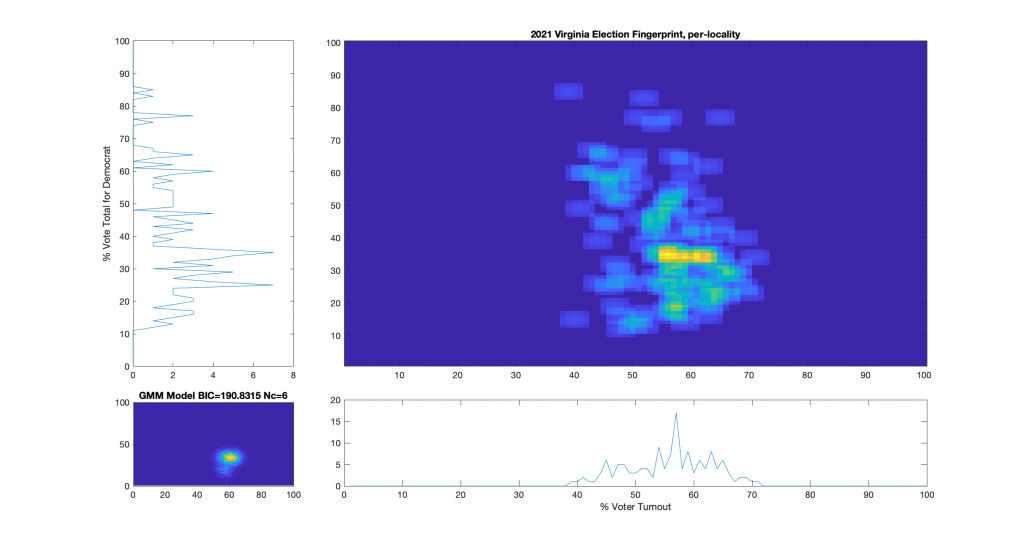
Figure 2 : VA 2021 Per locality, physical precincts only:
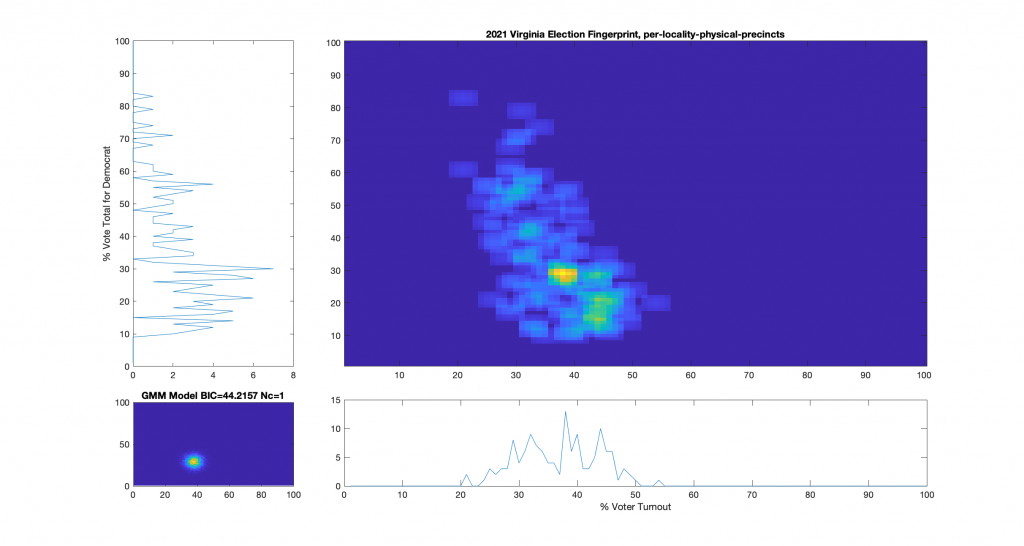
Figure 3 : VA 2021 Per locality, absentee precincts only:
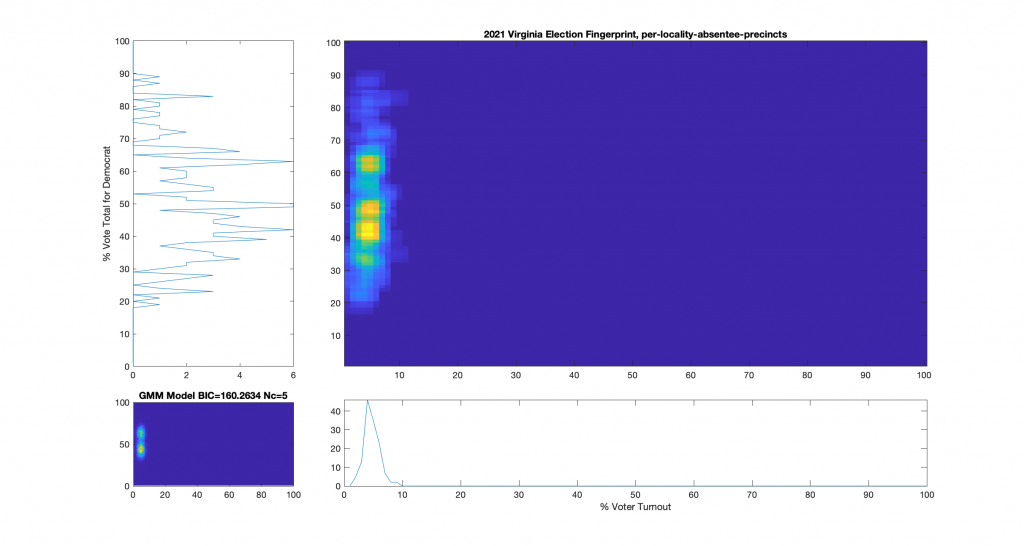
Figure 4 : VA 2021 Per precinct, absentee (CAP) + physical precincts:
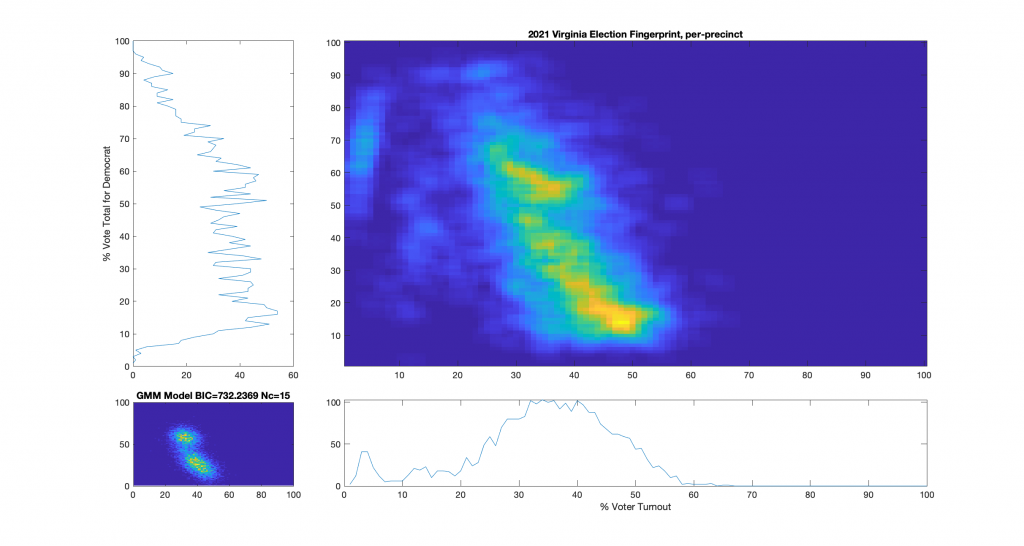
Figure 5 : VA 2021 Per precinct, physical precincts only:
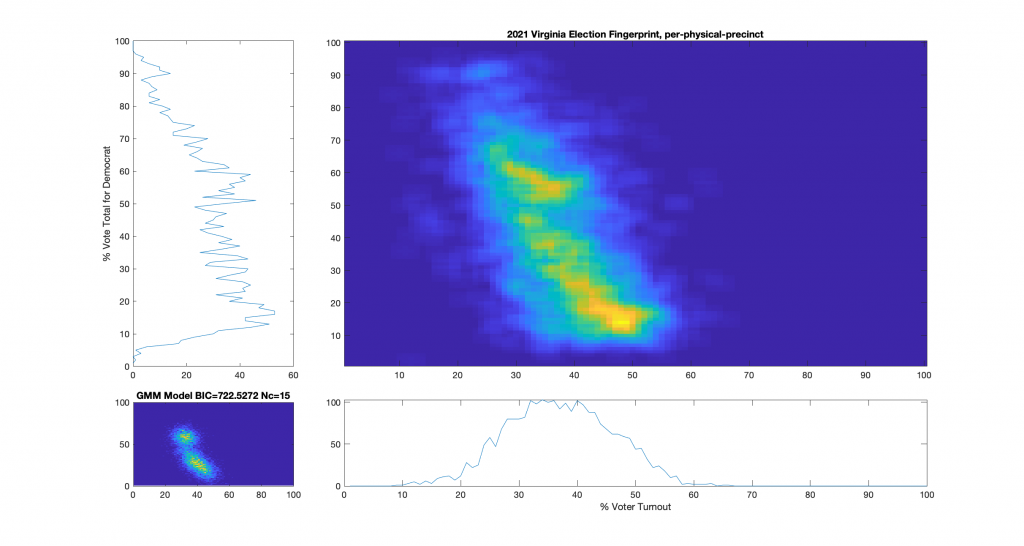
Figure 6 : VA 2021 Per precinct, absentee (CAP) precincts only:
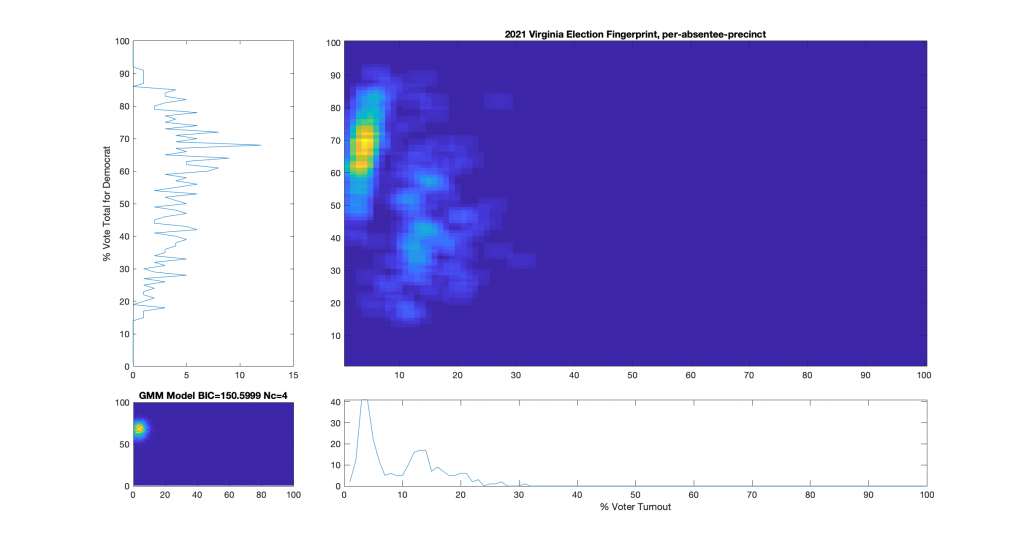
Figure 7 : VA 2021 Per precinct, CAP precincts, mail-in ballots only:
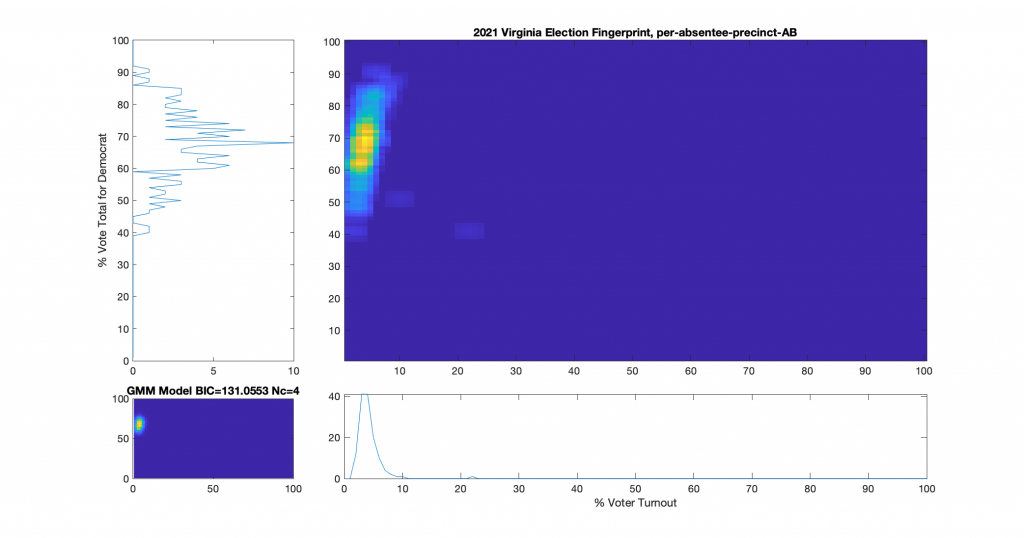
Figure 8 : VA 2021 Per precinct, CAP precincts, post-election ballots only:
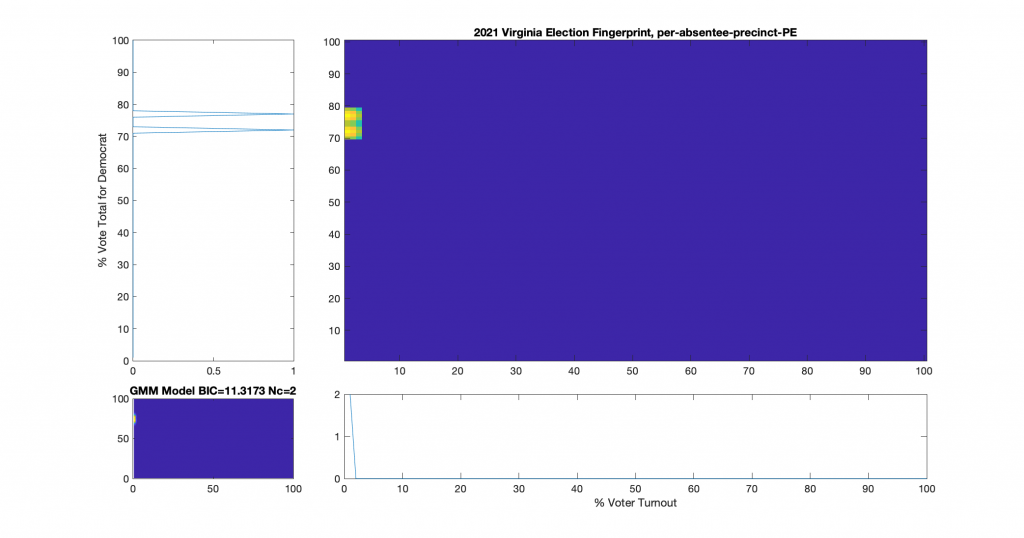
Figure 9 : VA 2021 Per precinct, CAP precincts, early-in-person ballots only:
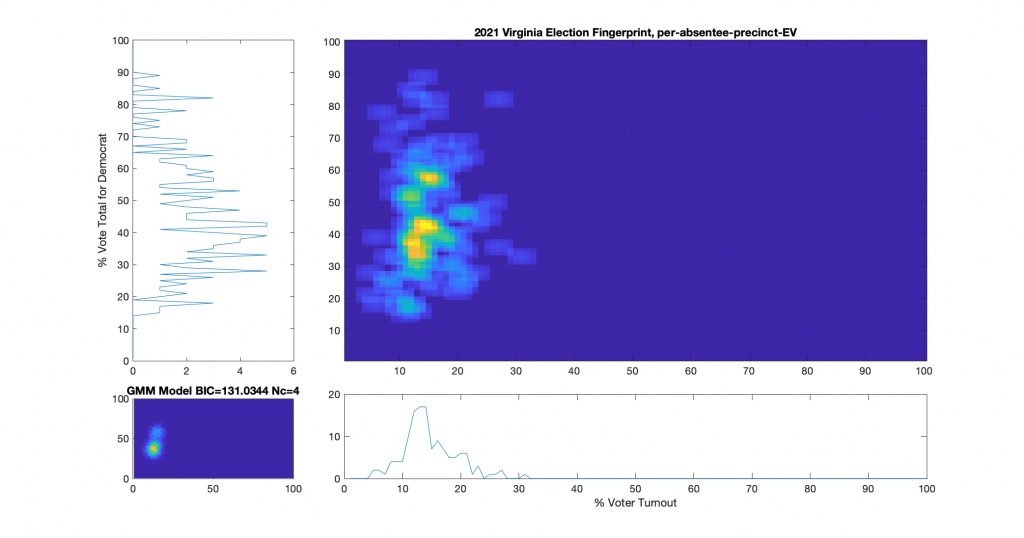
Comparison to VA 2020 Fingerprints
Figure 10 : VA 2020 Per locality, absentee (CAP) + physical precincts:
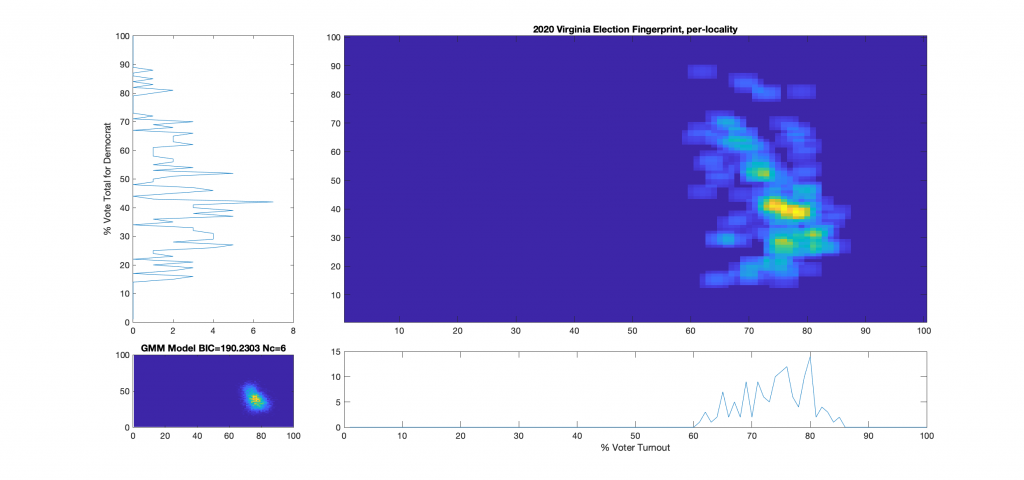
Figure 11 : VA 2020 Per locality, physical precincts only:
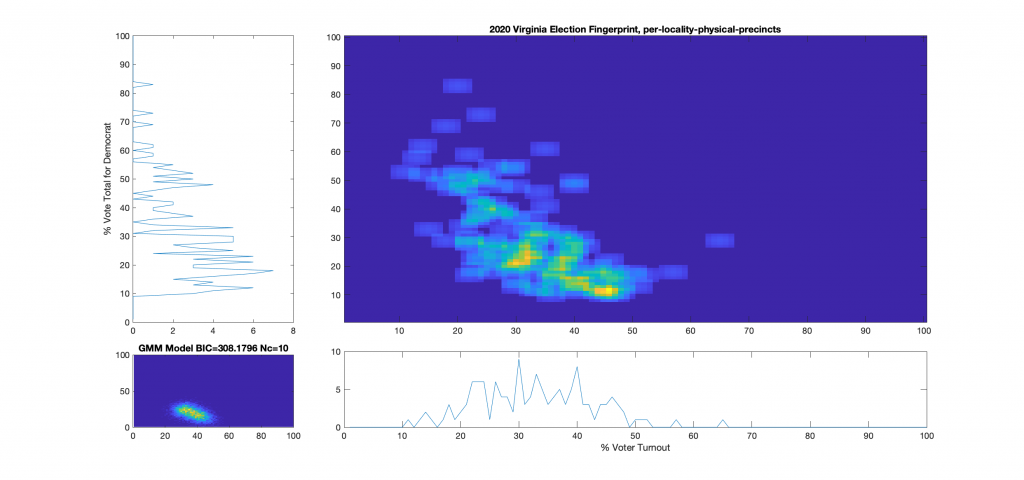
Figure 12 : VA 2020 Per locality, absentee precincts only:
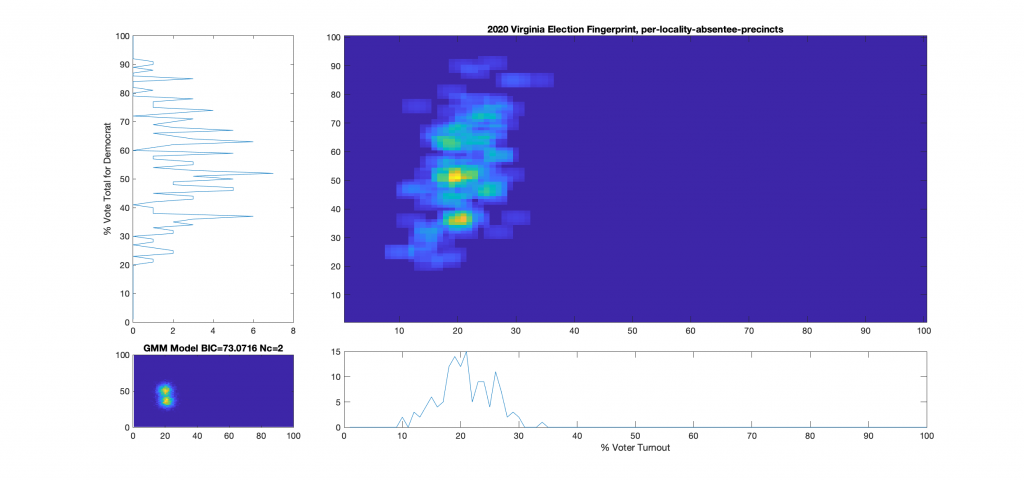
Figure 13 : VA 2020 Per precinct, absentee (CAP) + physical precincts:
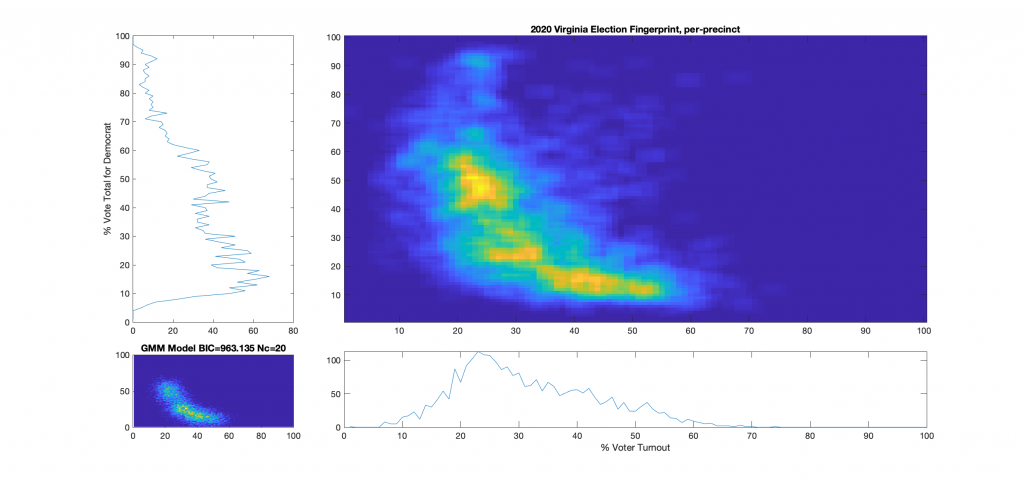
Figure 14 : VA 2020 Per precinct, physical precincts only:
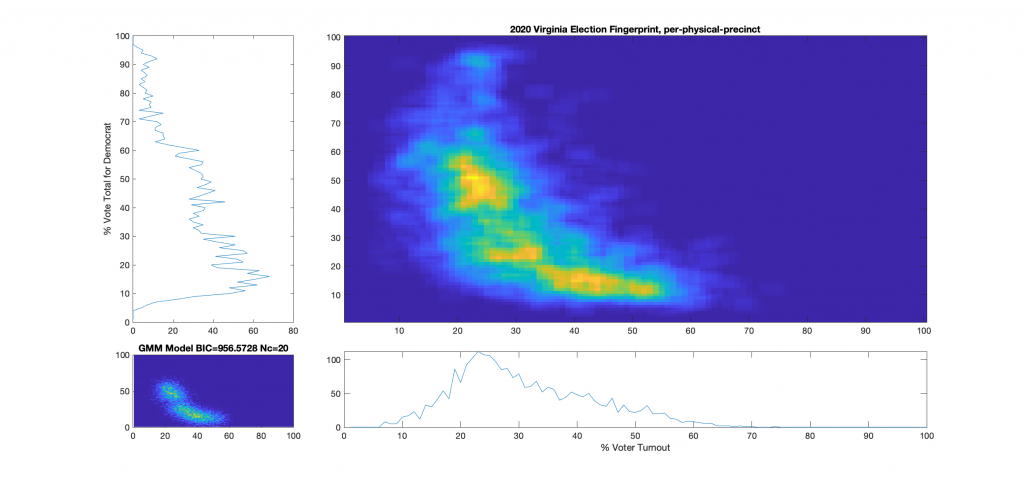
Figure 15 : VA 2020 Per precinct, absentee (CAP) precincts only:
