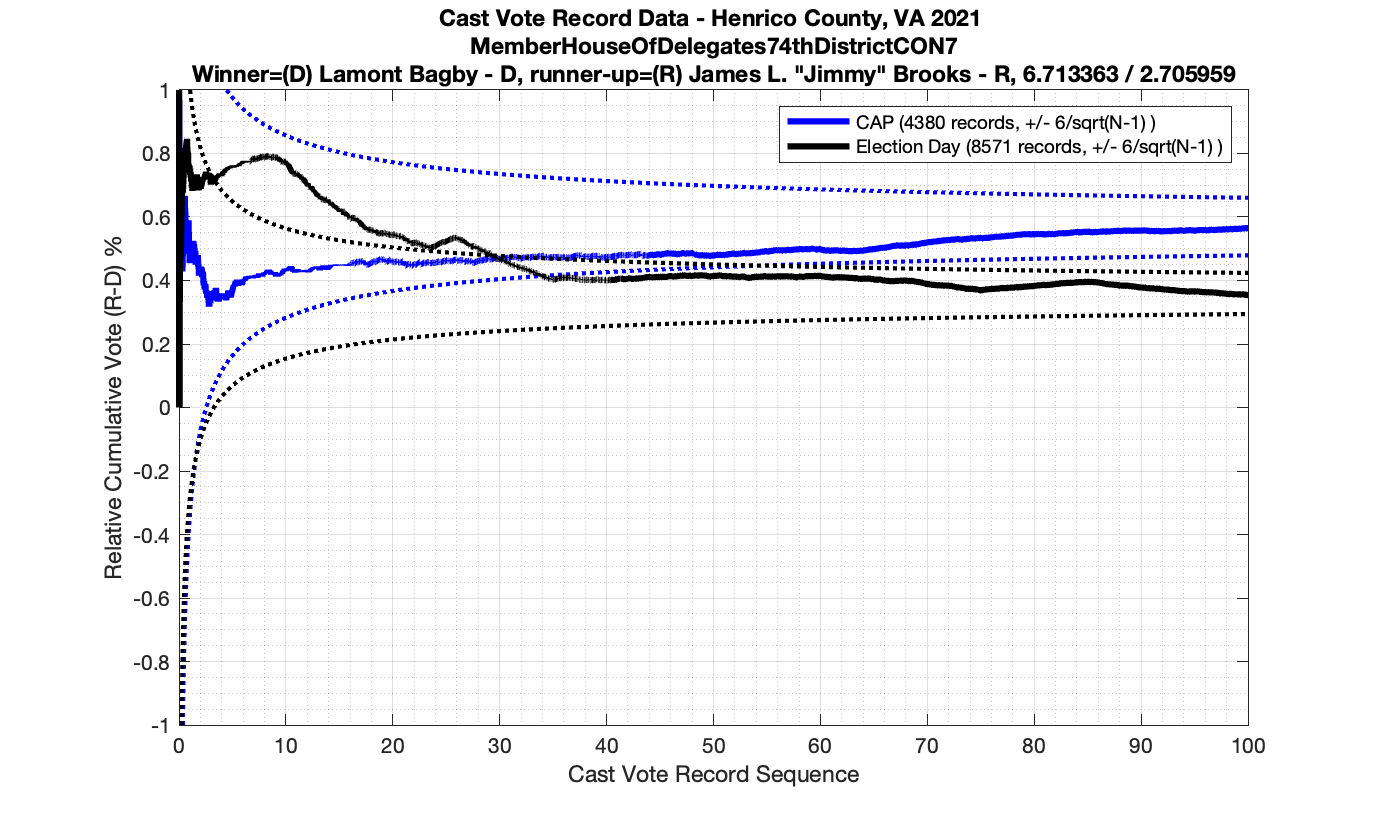
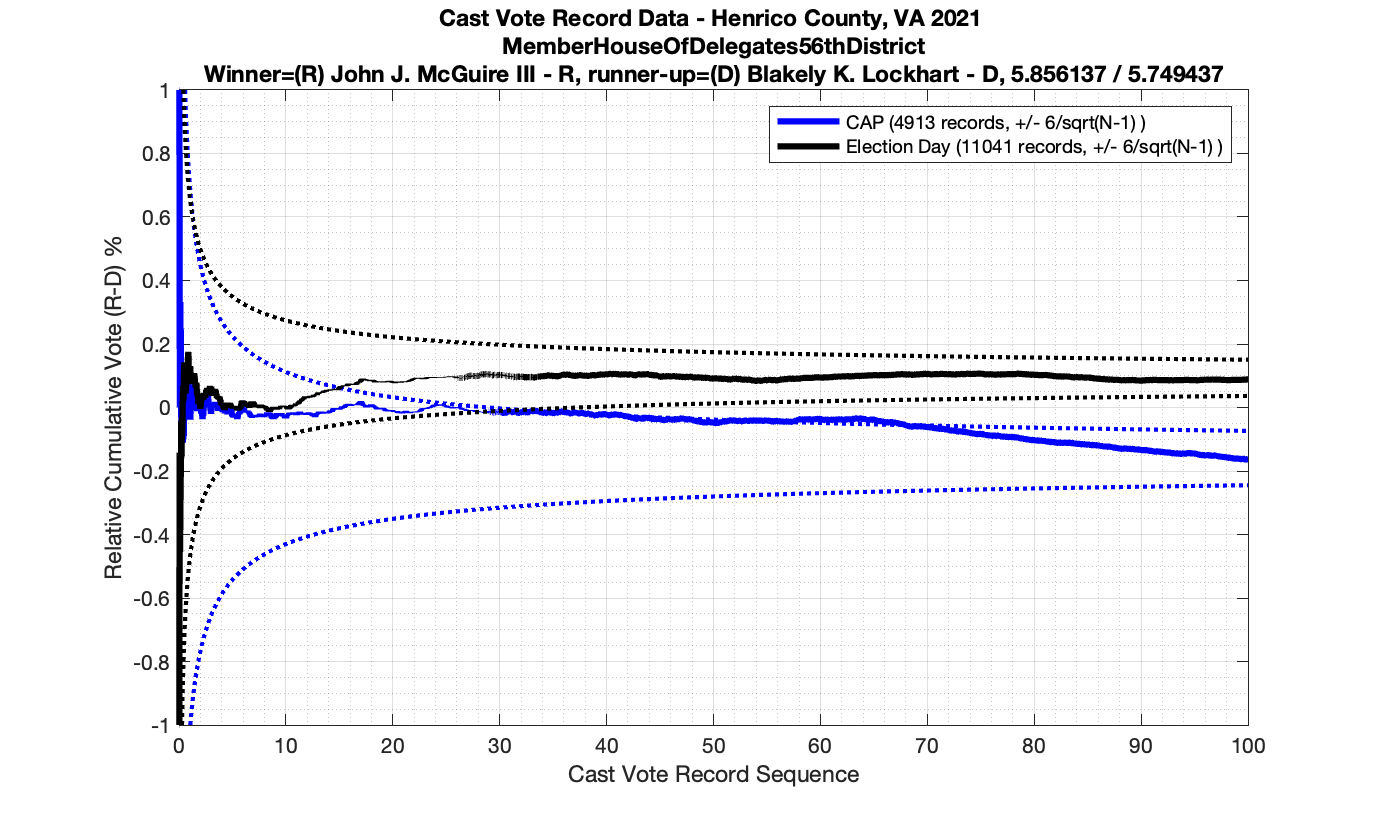
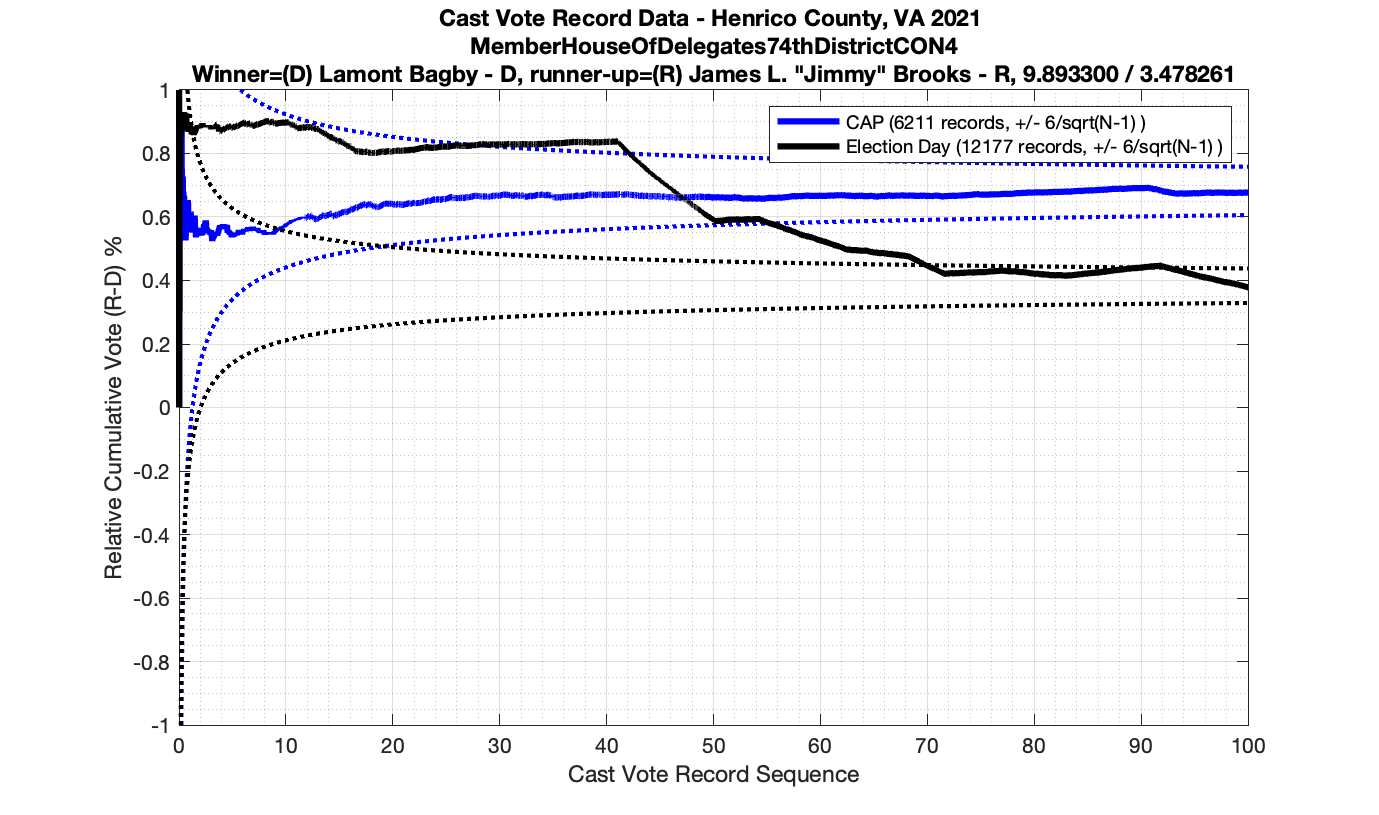
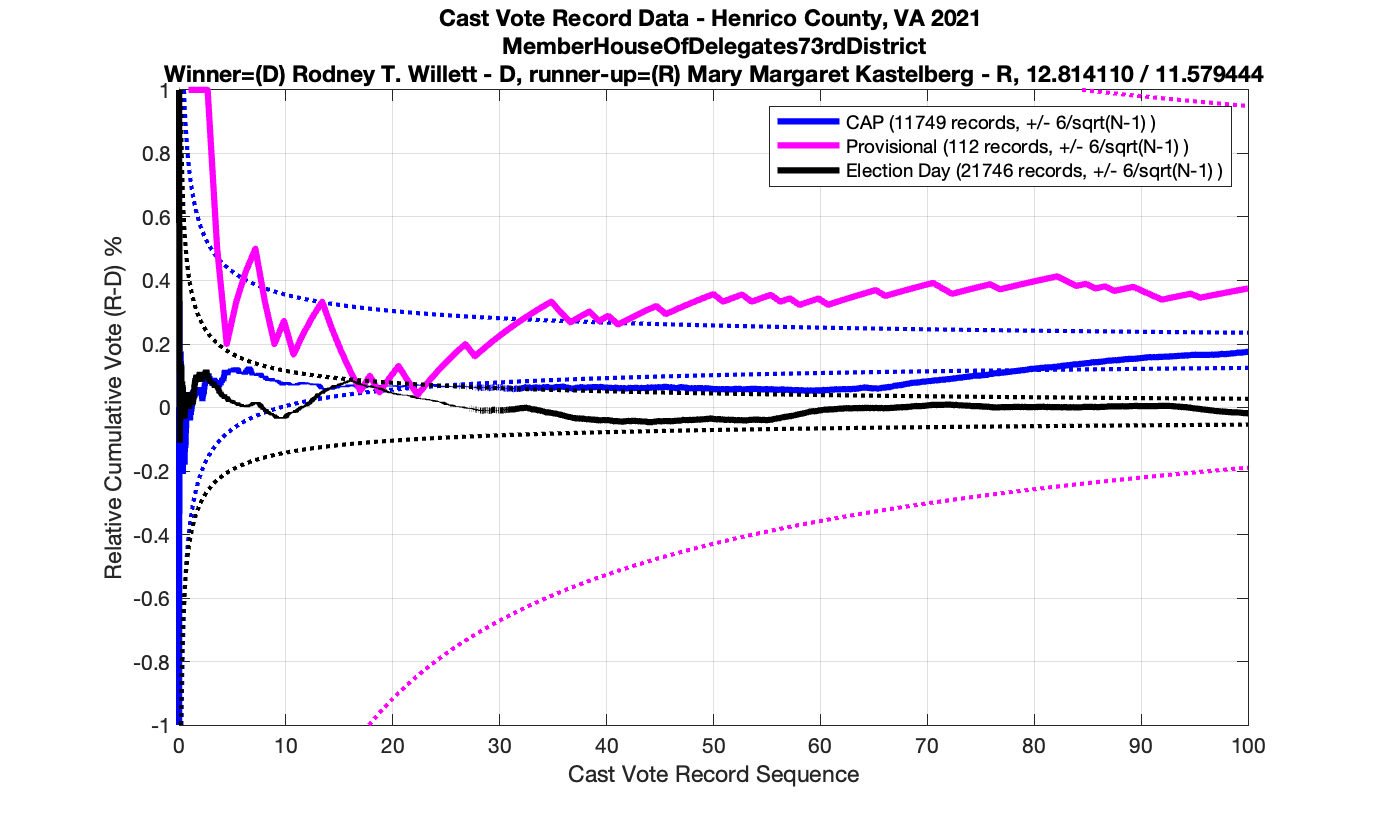
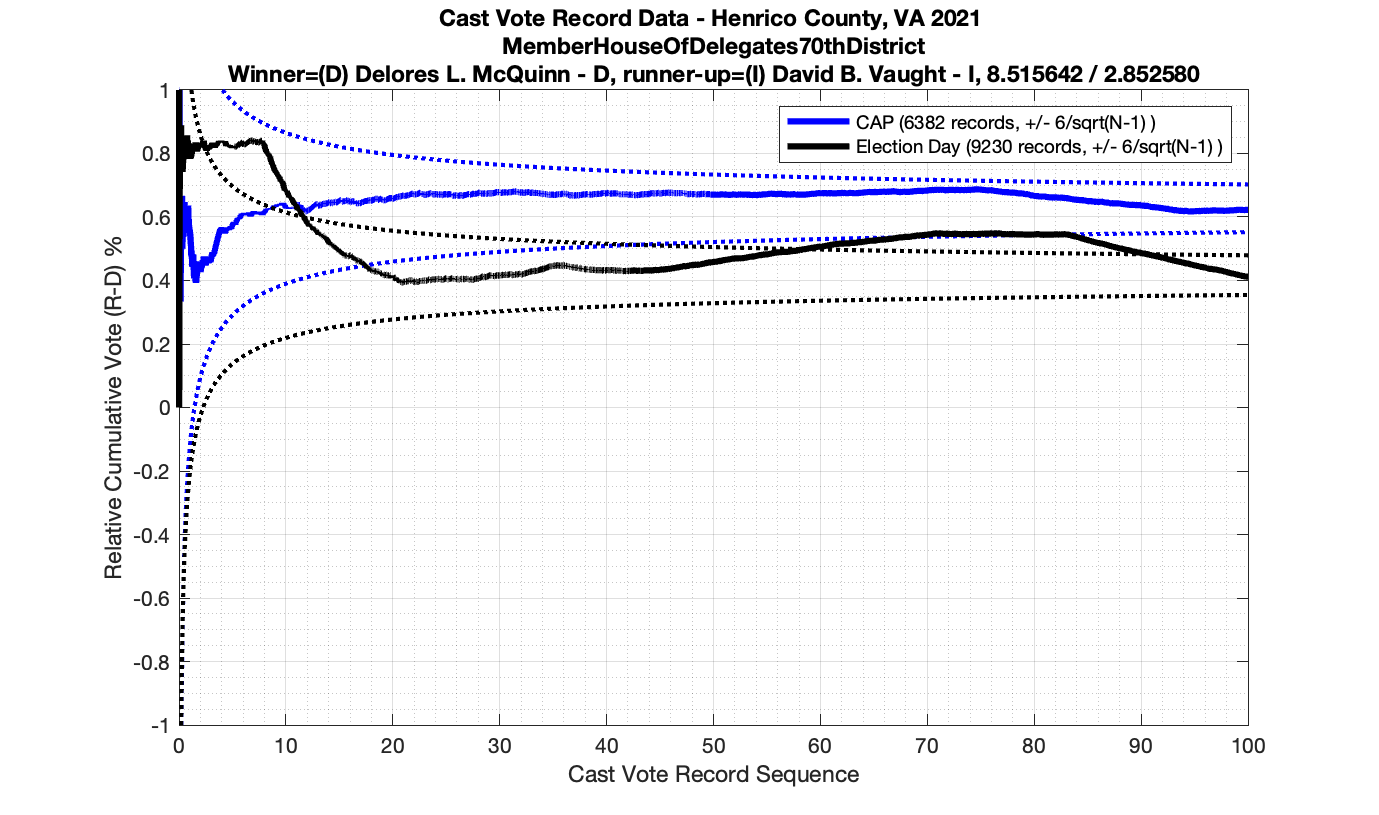
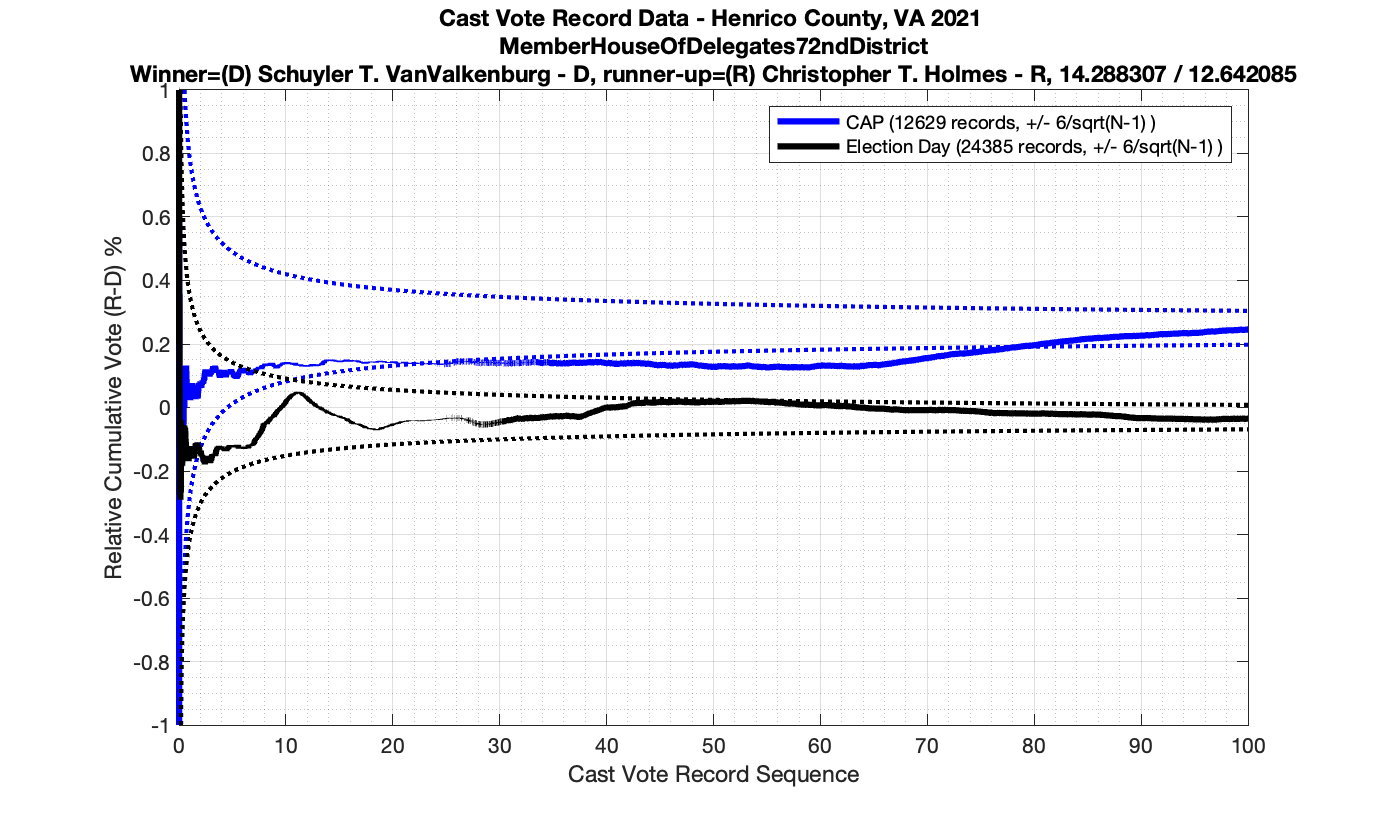
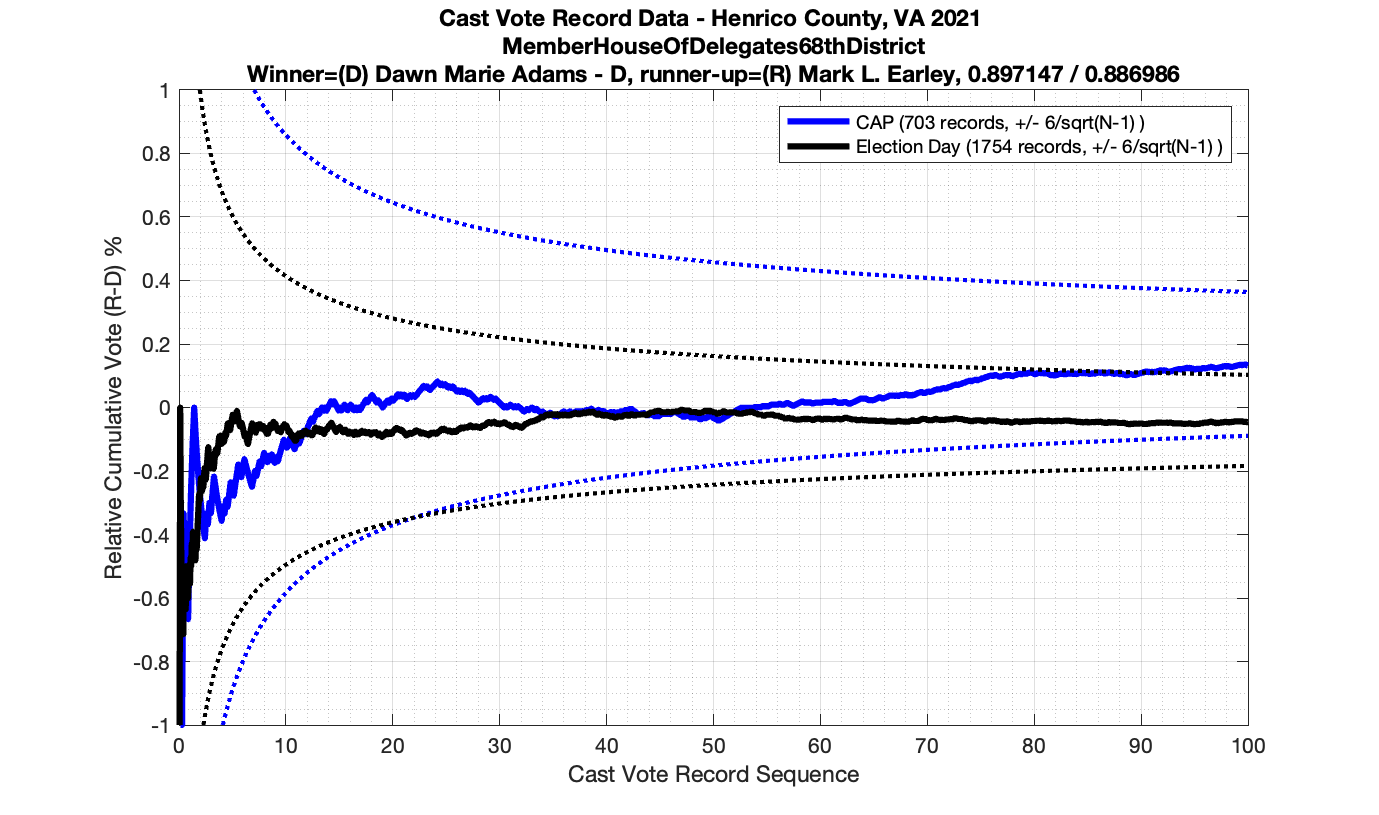
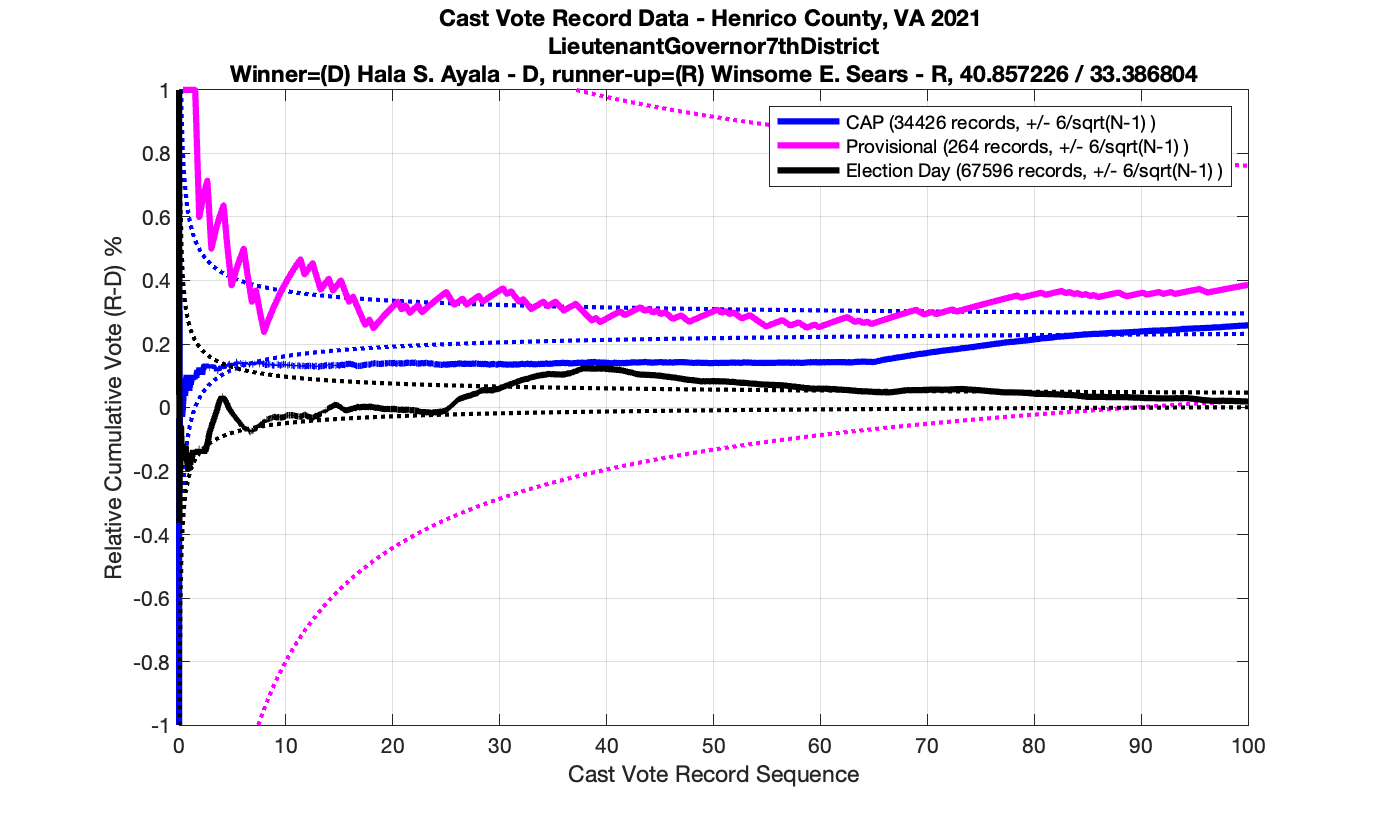
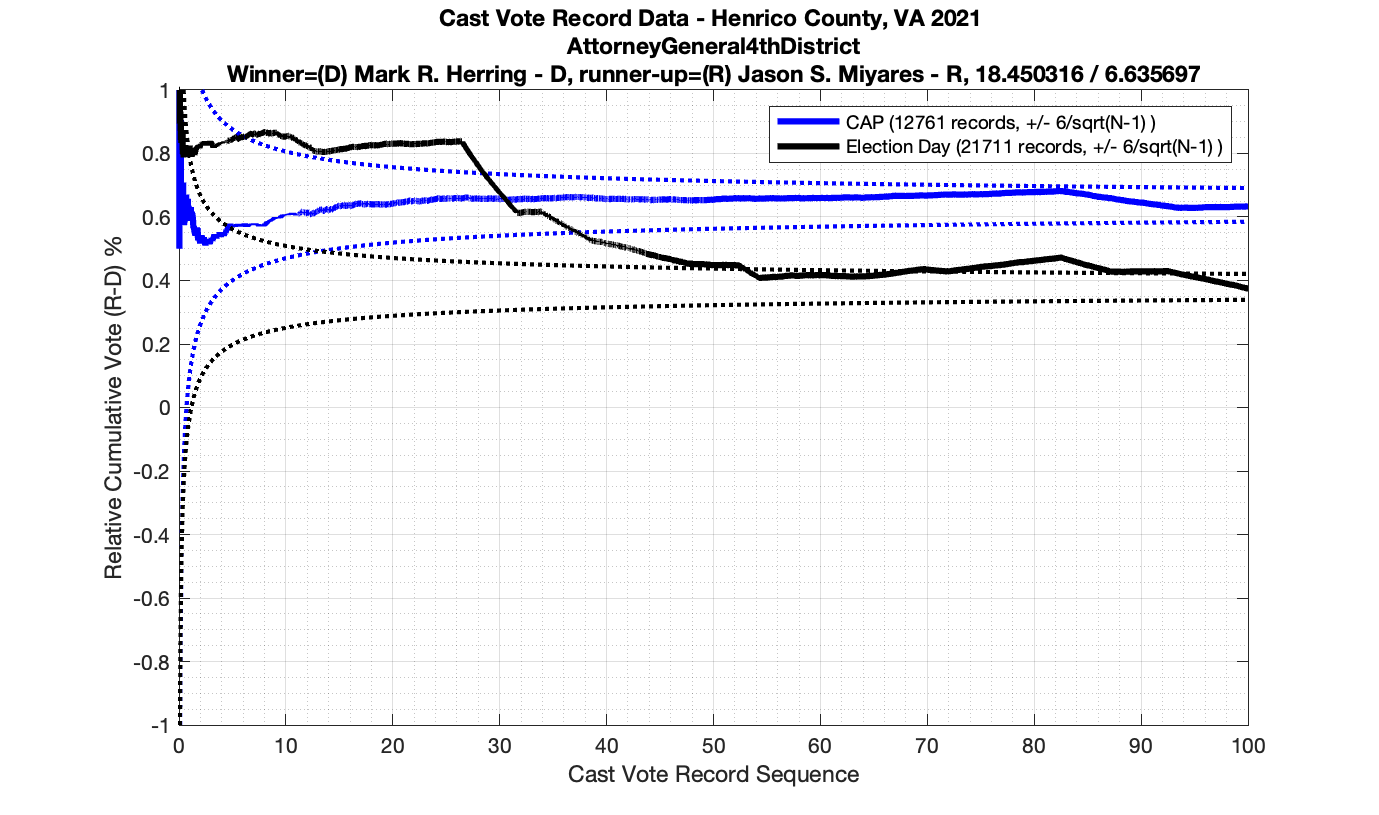
Update 2022-08-29 per observations by members of the Texas team I am working with, we’ve been able to figure out that (a) the vendor was simply concatenating data records from each machine and not sorting the CVR results and (b) how to mostly unwrap this affect on the data to produce much cleaner results. The results below are left up for historical reference.
For background information, please see my introduction to Cast Vote Records processing and theory here: Statistical Detection of Irregularities via Cast Vote Records. This entry will be specifically documenting the results from processing the Henrico County Virginia CVR data from the 2021 election.
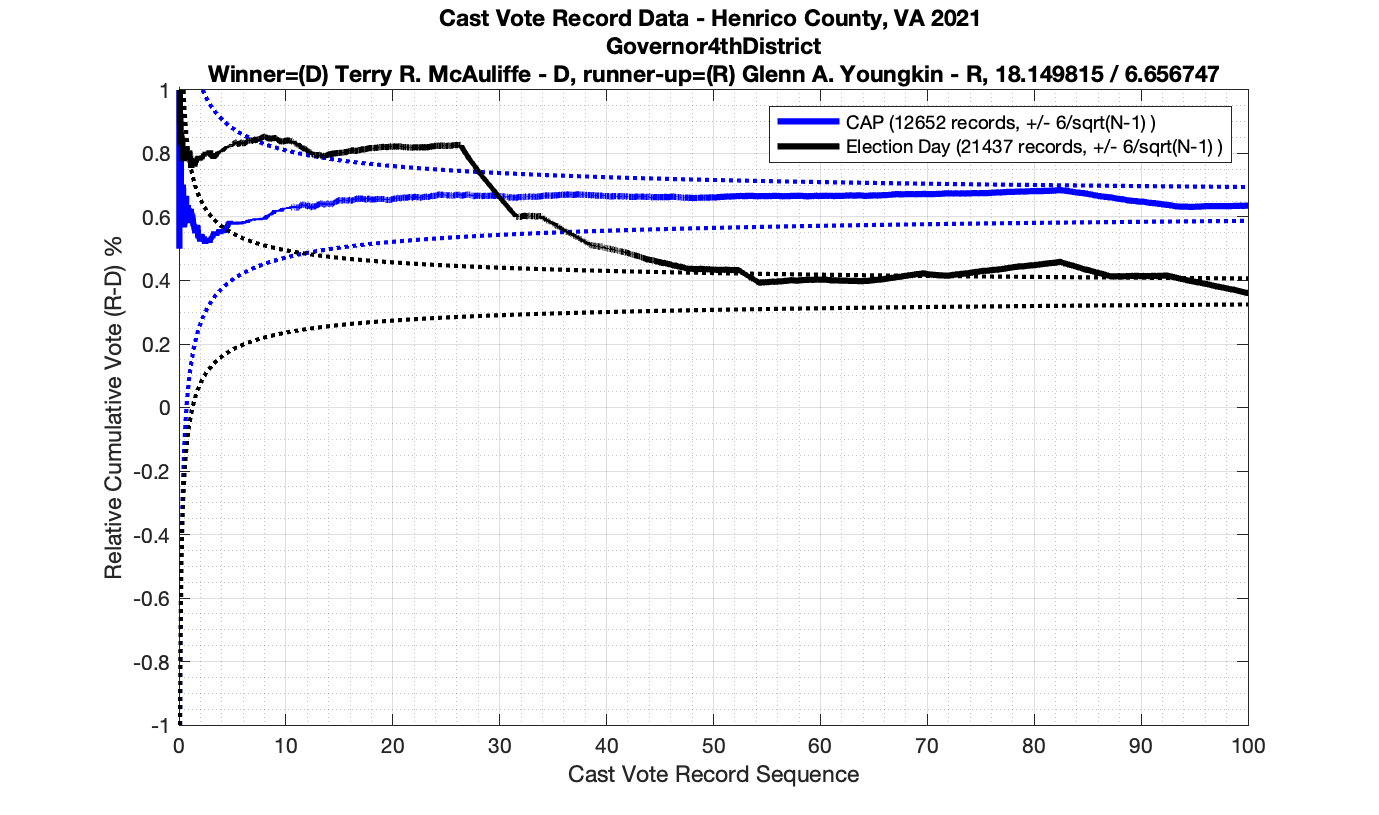
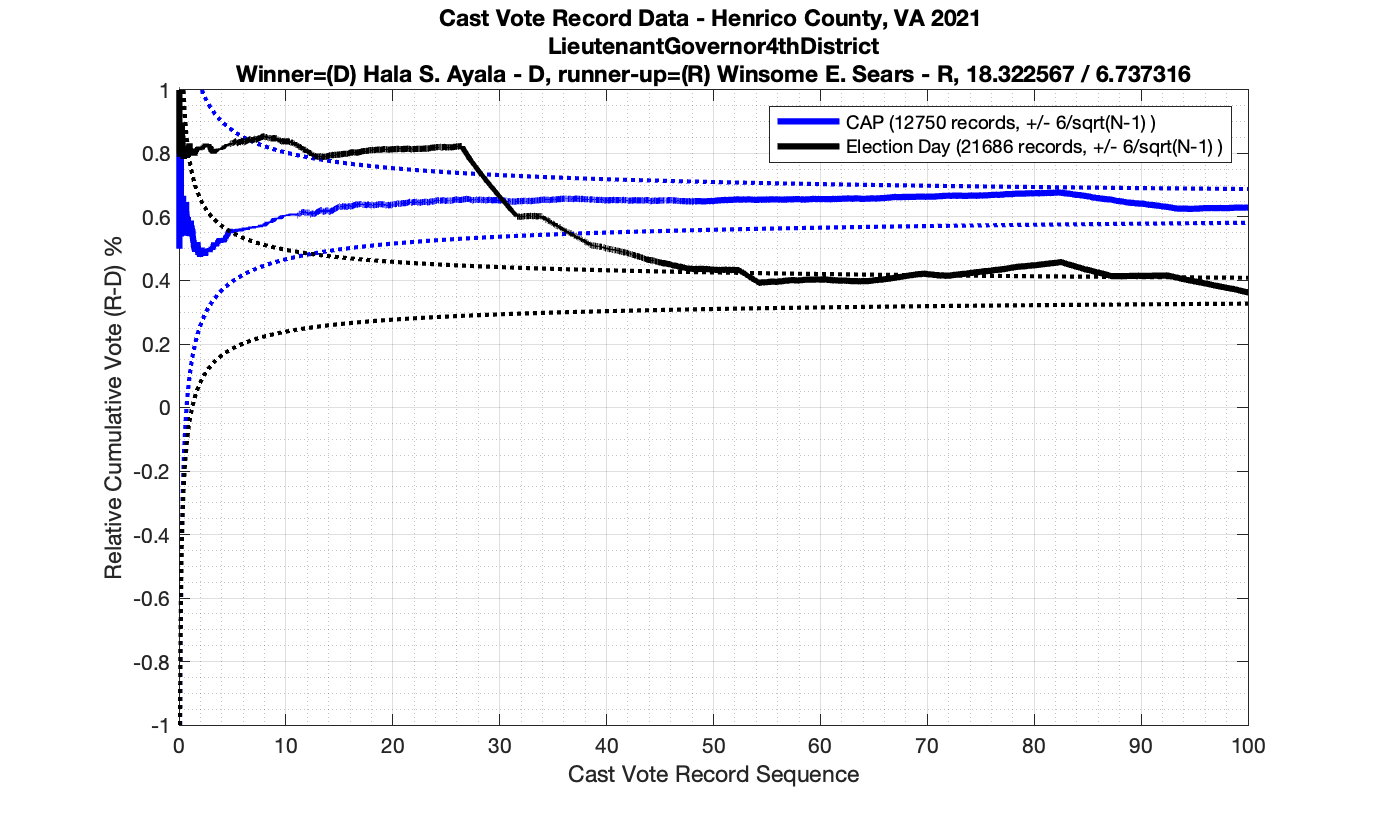
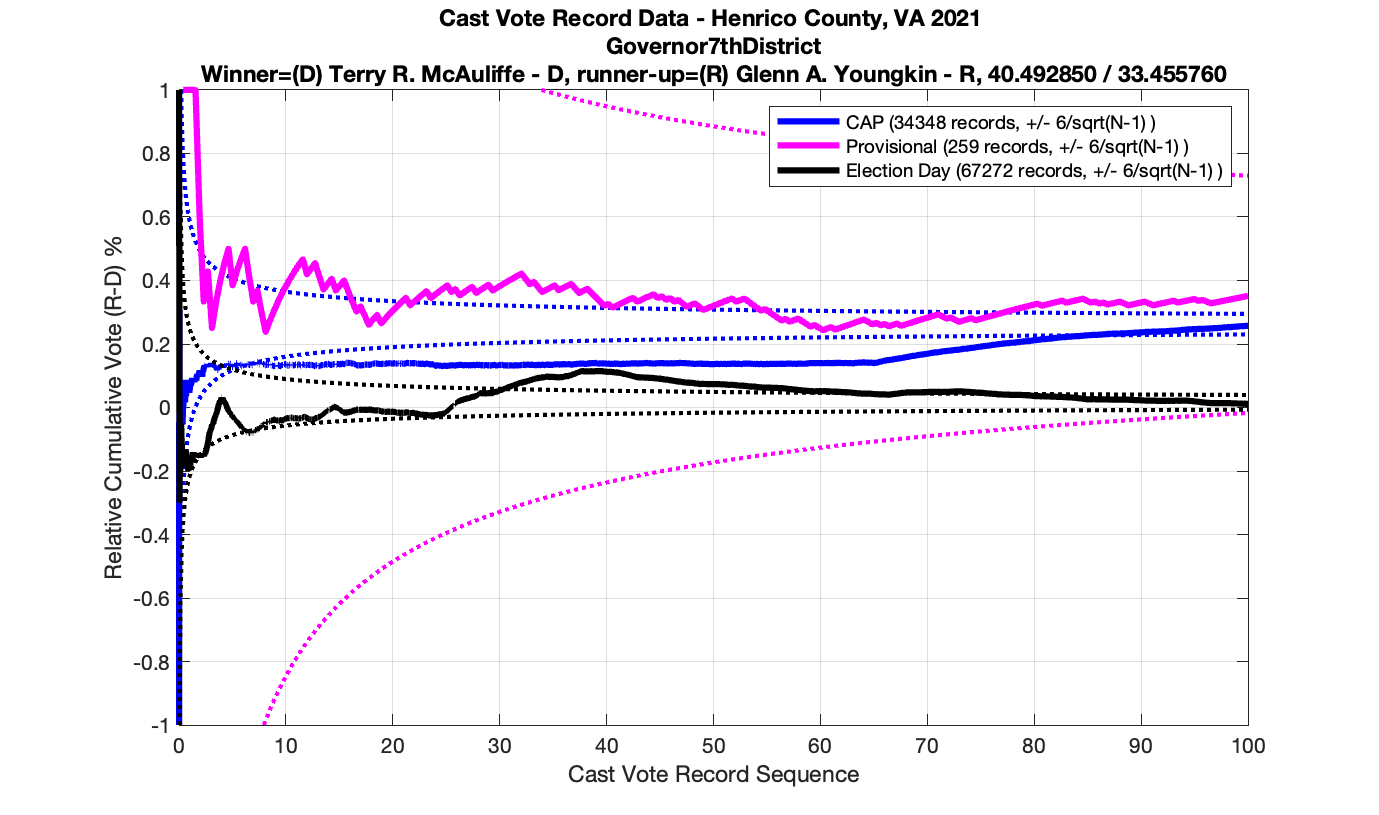
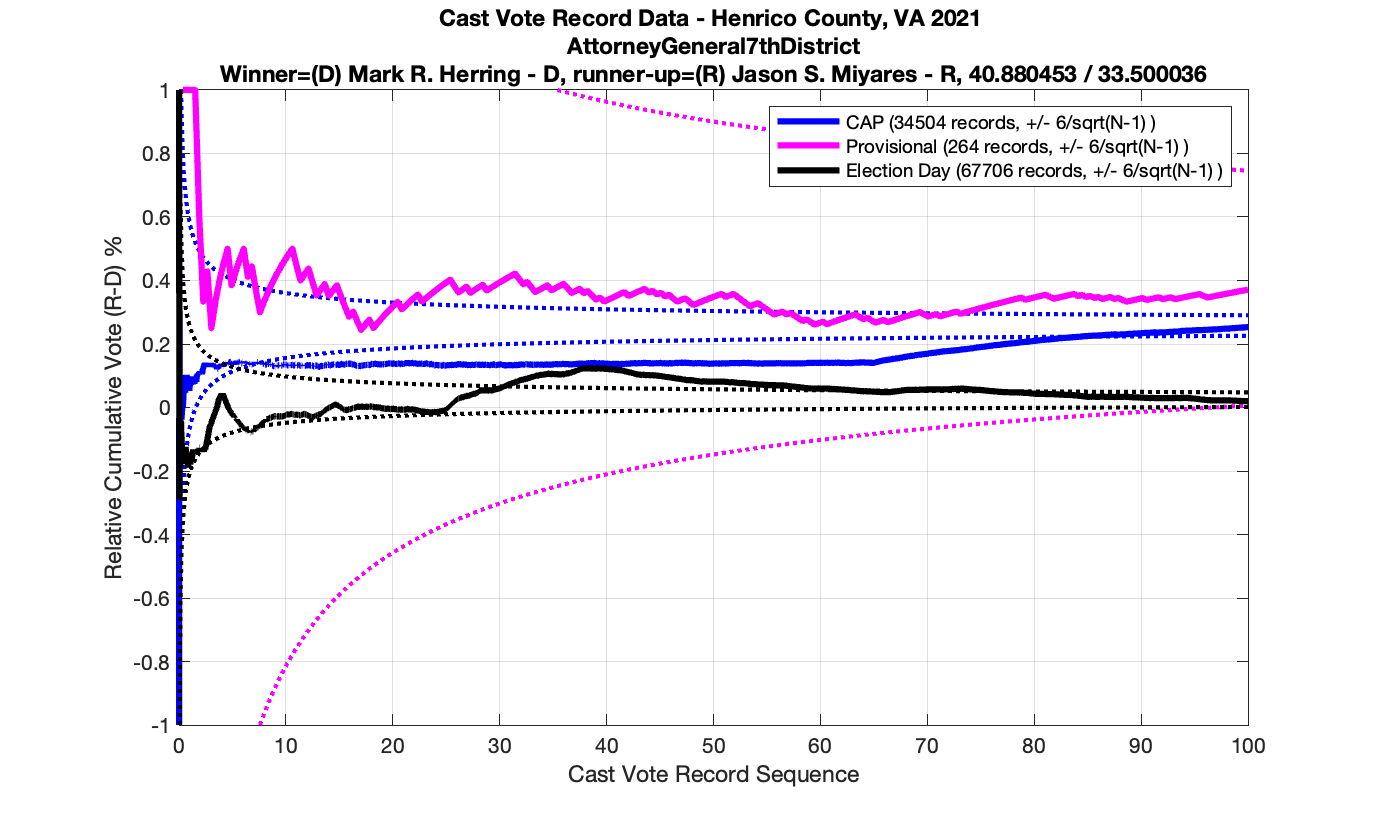
As in the results from the previous post, I expanded the theoretical error bounds out to 6/sqrt(N) instead of 3/sqrt(N) in order to give a little bit of extra “wiggle room” for small fluctuations.
However the Henrico dataset could only be broken up by CAP, Non-CAP or Provisional. So be aware that the CAP curves presented below contain a combination of both early-vote and mail-in ballots.
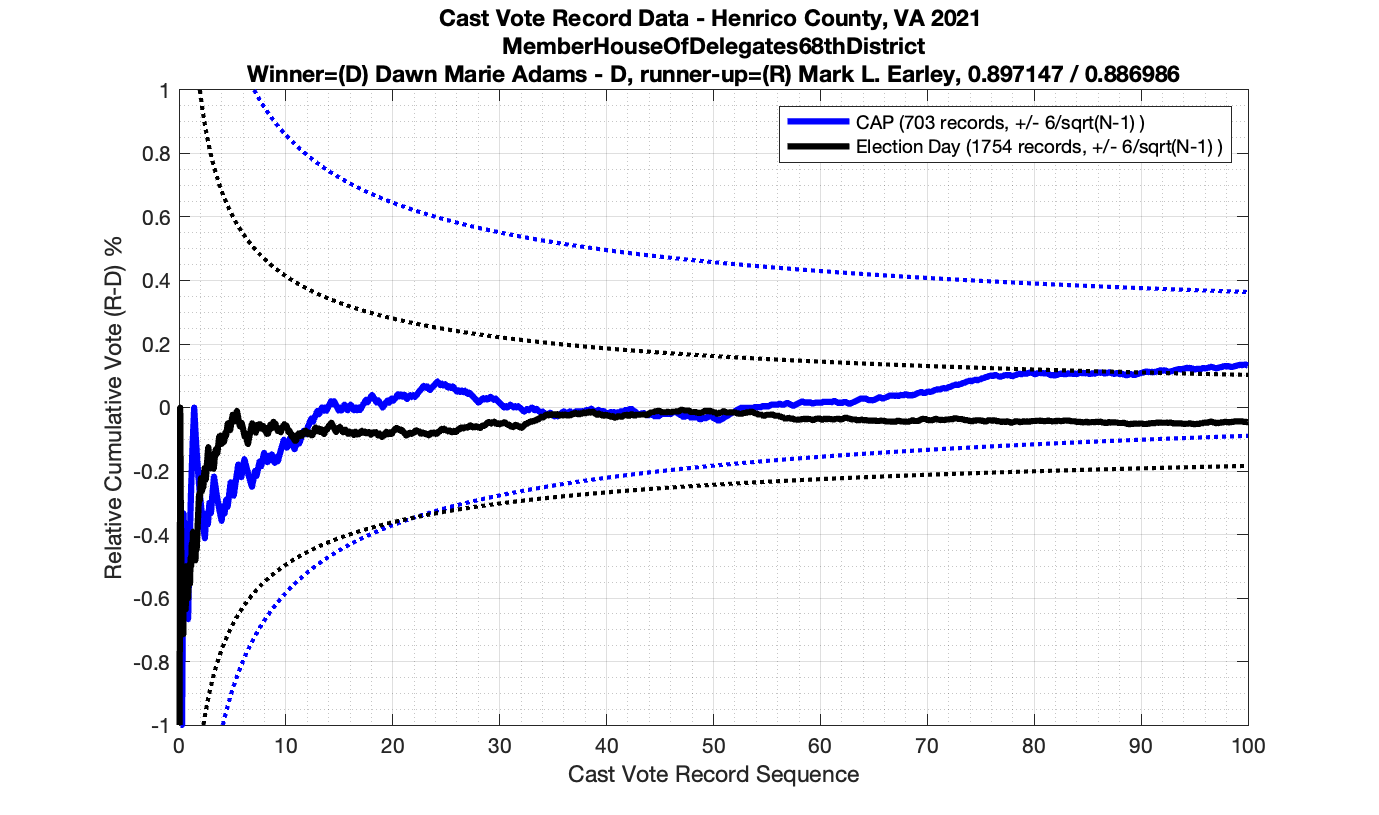
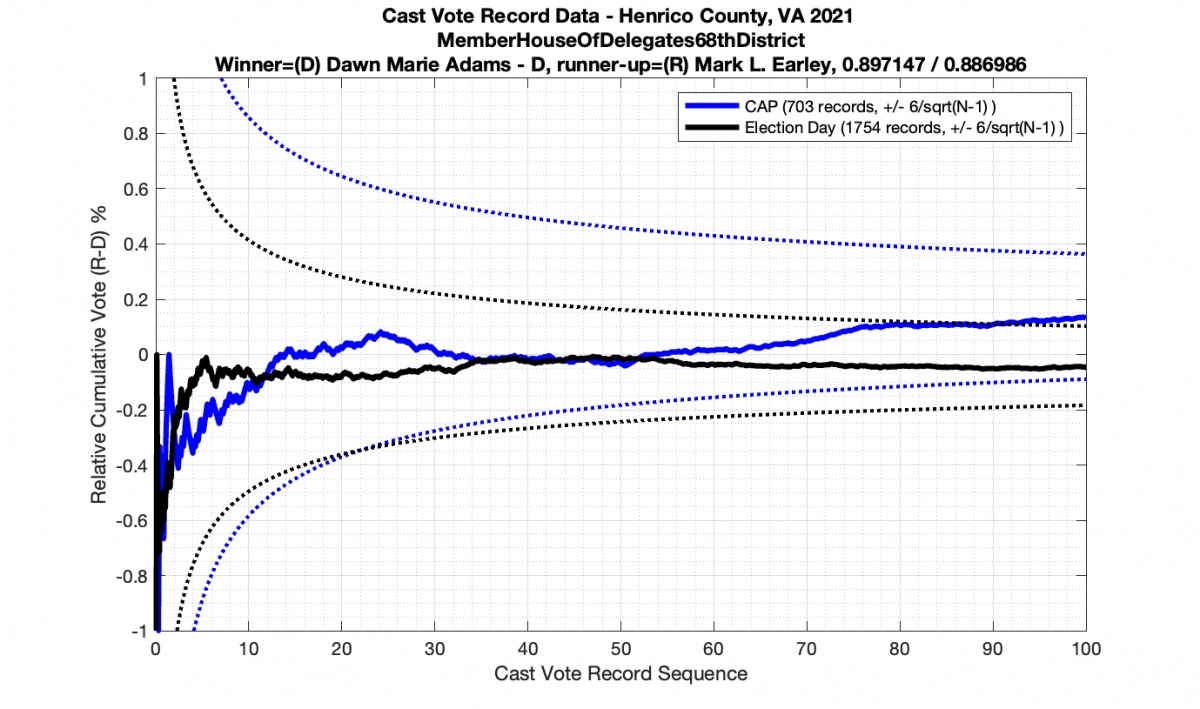
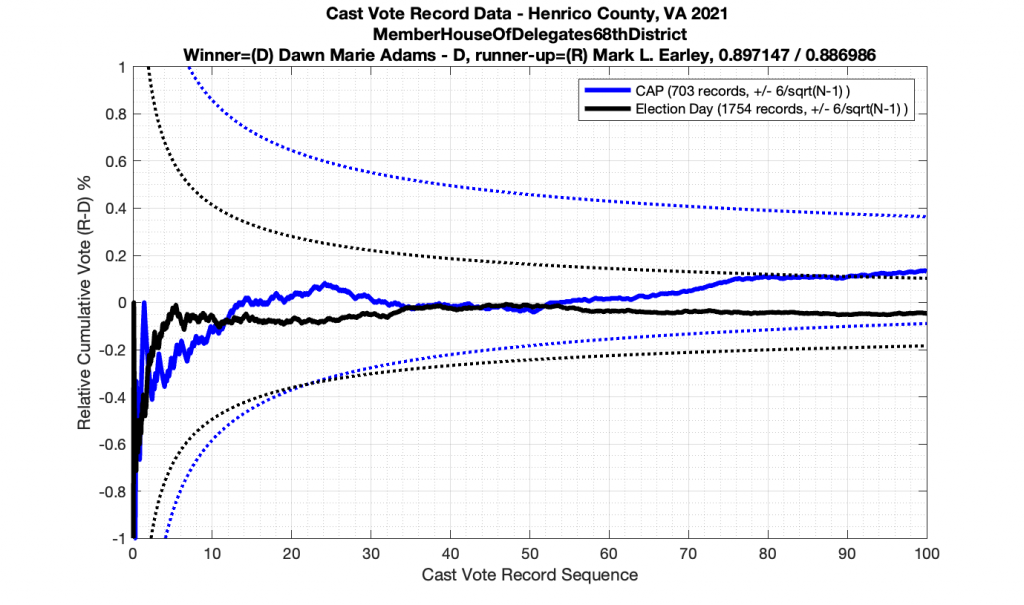
The good news is that I’ve at least found one race that seems to not have any issues with the CVR curves staying inside the error boundaries. MemberHouseOfDelegates68thDistrict did not have any parts of the curves that broke through the error boundaries.
The bad news … is pretty much everything else doesn’t. I cannot tell you why these curves have such differences from statistical expectation, just that they do. We must have further investigation and analysis of these races to determine root cause. I’ve presented all of the races that had sufficient number of ballots below (1000 minimum for the race a whole, and 100 ballot minimum for each ballot type).
