One of our volunteers brought to our attention the following press release: https://www.honestelections.org/honest-elections-project-supports-new-pre-litigation-notices-against-arizona-and-virginia/. They claim that “… 43 counties and independent cities in Virginia and four counties in Arizona claim to have more voters than voting-age adult citizens.”
Attempt to directly validate the claim
After reading through the press release we decided to independently try to verify the claims in the release. Note that an analysis like this has been on our list of things-to-do, but there are only so many hours in the day! The fact this press release was issued gave us a well deserved prod to complete this analysis.
EPEC has purchased the entire statewide registered voter list data from the VA Department of Elections (ELECT) and has current records as of 2023-08-01. Eligible parties can purchase data from ELECT via their website here.
The necessary data from the US Census office can be downloaded here and included the estimates of the eligible voting age citizens in each county. From the documentation on the census site, the “cvap_est” field in the census data represents “The rounded estimate of the total number of United States citizens 18 years of age or older for that geographic area and group.”
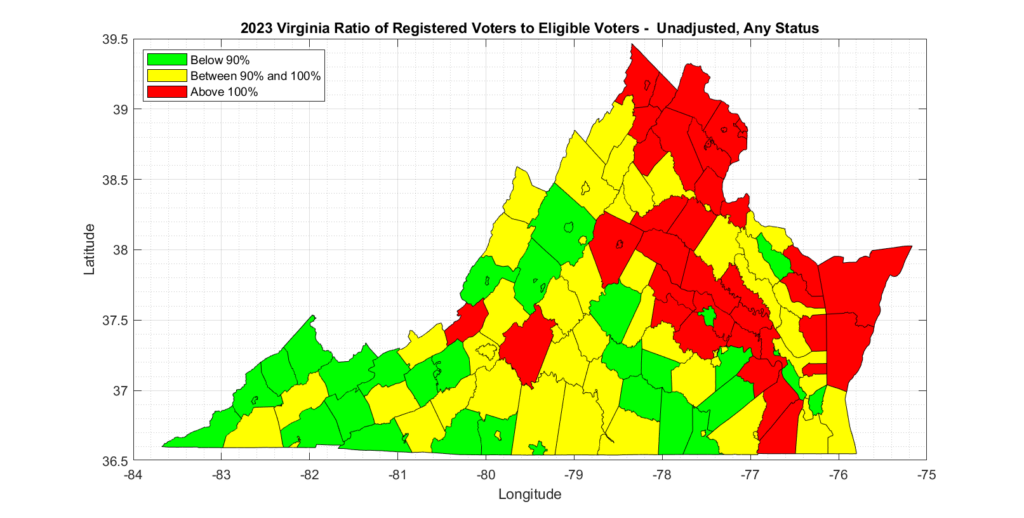
It is therefore a straightforward process to accumulate the number of registrant records in each county, as well as accumulating the number of eligible voting age citizens and compute the registration percent “REG_PCT” as (# Registered / # Eligible * 100). The below table has the results of this direct computation for each county.
The results are only slightly different than the results presented by Honest Elections Project, but still show significant issues with 38 counties being over 100%.
Adjusting for population growth since 2020 census
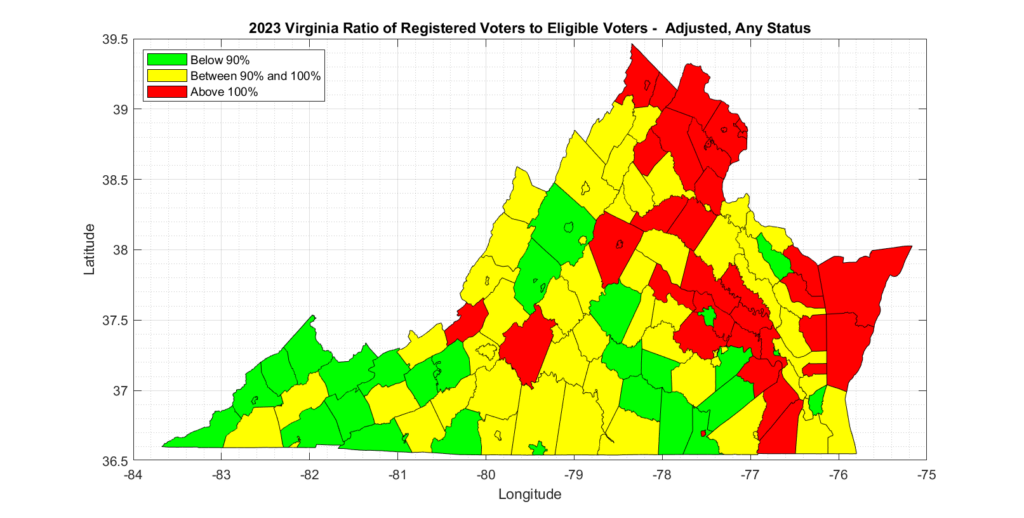
As the census redistricting data is circa 2020, and the eligible voter data was estimated for 2021, we can attempt to account for population shifts since the 2020 census data was collected and the voter eligibility data was computed. The US Census bureau also makes available the estimates of population growth by county year-over-year since the date of the last census here, which we can use to find the recent rates of growth or decline for each county. We can then use these rates to adjust the number of eligible voter estimates to scale with the most recent rates of population change. This is admittedly an approximation and assumes a linear relationship, but it is arguably better than taking the 2020 census and 2021 eligible voter estimates and applying them directly to the latest (2023) RVL.
The REG_PCT_ADJ column in the table below represents this adjusted estimate.
Active vs inactive registrations
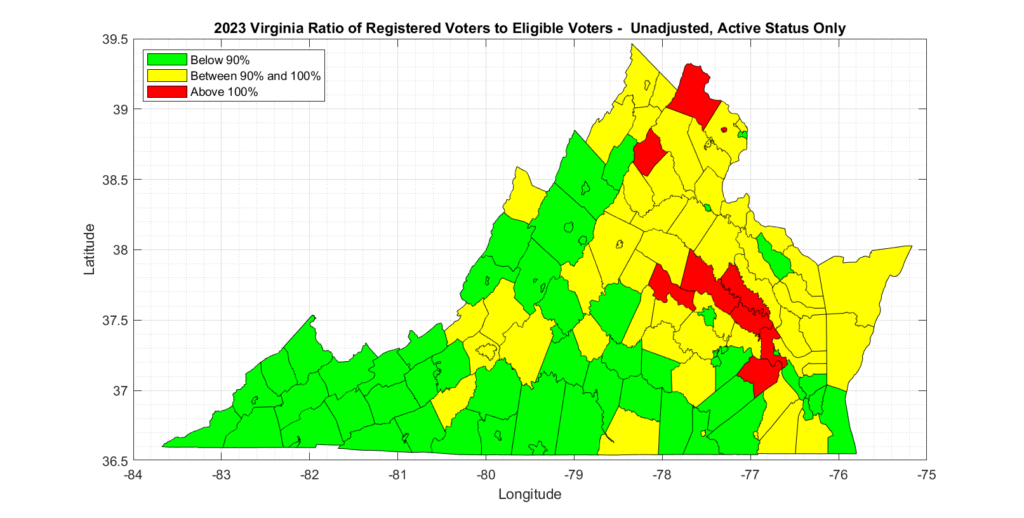
An additional consideration that can be made with this data, is to attempt to consider only “Active” voter registrations vs registrations with any status assigned. Note that “Inactive” voter registrations can be immediately returned to “Active” status by simply having any type of interaction with the department of elections (or through DMV, etc), and the registrant will then be allowed to vote. Because of this easy ability to change “Inactive” records to “Active”, it is most appropriate (IMO) to include them in this analysis. However, for completeness, and in order to bound the scope of the issue, the corresponding REG_PCT_ACTIVE and REG_PCT_ADJ_ACTIVE columns have also been computed which only consider “Active” voters.
Results
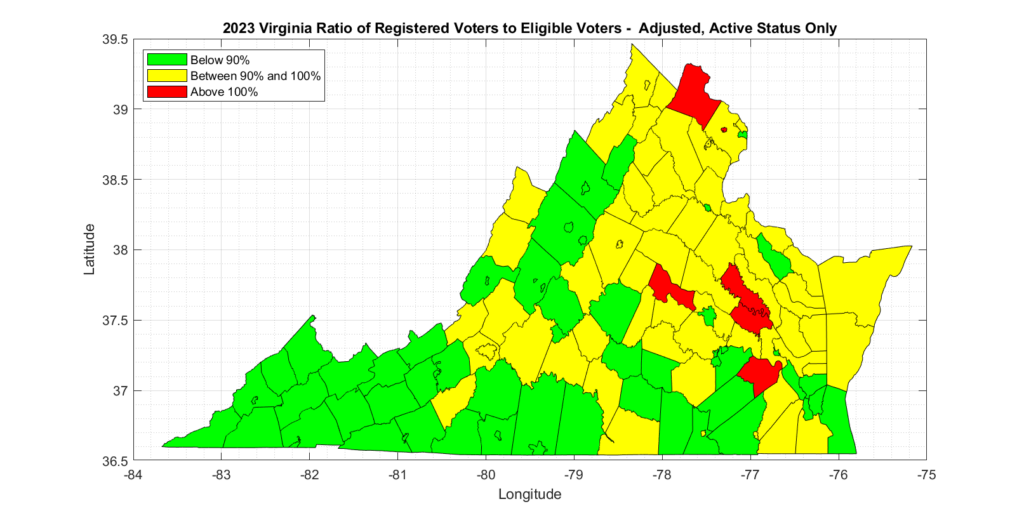
Even the most forgiving analysis we could compute with the official data from US Census and VA ELECT, which only considers active voters and attempts to adjust for population change since the census, still results in multiple (6) counties in VA having more than 100% registered voters than eligible voters, and many counties that had over 90%.
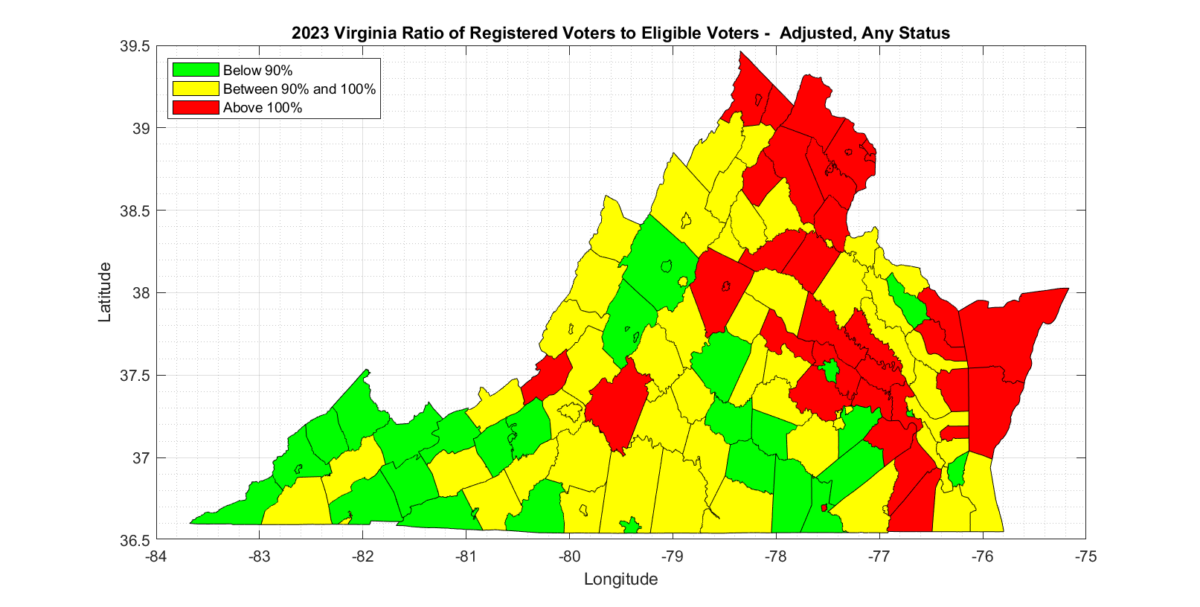
The most appropriate metric to consider, in my opinion, is the Adjusted and either Active or Inactive status results, as inactive status registrations can still be converted to active status and voted. There were 36 localities with over 100% in this category and 59 between 90% and 100%. There are 133 voting localities in total in VA.
The summary tabulated data and graphics for each of the methods of analyzing the data is presented below.
Tabulated Data Results:
| LOCALITY_NAME | N_REG | N_REG_ACTIVE | N_ELIGIBLE | N_ELIGIBLE_ADJ | REG_PCT | REG_PCT_ADJ | REG_PCT_ACTIVE | REG_PCT_ADJ_ACTIVE |
| GOOCHLAND COUNTY | 22032 | 21308 | 19840 | 20314.622534217 | 111.048387096774 | 108.453897988458 | 107.399193548387 | 104.889962705976 |
| LOUDOUN COUNTY | 291468 | 272527 | 259775 | 261988.121593707 | 112.200173226831 | 111.252372140753 | 104.908863439515 | 104.022655050994 |
| FAIRFAX CITY | 17867 | 16578 | 15890 | 16179.2525931696 | 112.441787287602 | 110.431553603056 | 104.32976714915 | 102.464560118177 |
| SURRY COUNTY | 5635 | 5449 | 5325 | 5327.44865113427 | 105.821596244131 | 105.772957545076 | 102.328638497653 | 102.281605264085 |
| NEW KENT COUNTY | 19258 | 18686 | 17545 | 18281.8036615372 | 109.763465374751 | 105.339715689632 | 106.503277286976 | 102.210921558649 |
| KING WILLIAM COUNTY | 14025 | 13592 | 13380 | 13590.9343586927 | 104.820627802691 | 103.193788078519 | 101.584454409567 | 100.007840824473 |
| MATHEWS COUNTY | 7353 | 7092 | 7145 | 7099.01111761264 | 102.911126662001 | 103.577806516702 | 99.25822253324 | 99.9012381091326 |
| NORTHAMPTON COUNTY | 9801 | 9306 | 9435 | 9326.0652878146 | 103.879173290938 | 105.092551869714 | 98.6327503974563 | 99.7848472298299 |
| HANOVER COUNTY | 86583 | 83800 | 83280 | 84111.898838322 | 103.96613832853 | 102.937873470706 | 100.624399615754 | 99.6291858314583 |
| RAPPAHANNOCK COUNTY | 6194 | 5952 | 5945 | 5996.95979561651 | 104.188393608074 | 103.285668256898 | 100.117746005046 | 99.250290194552 |
| JAMES CITY COUNTY | 63840 | 60418 | 60100 | 61066.3951247591 | 106.222961730449 | 104.541949577299 | 100.529118136439 | 98.9382128690675 |
| FAUQUIER COUNTY | 56031 | 52805 | 52965 | 53424.3705925266 | 105.788728405551 | 104.879101763041 | 99.6979137166053 | 98.840659074394 |
| FALLS CHURCH CITY | 11130 | 10253 | 10345 | 10373.4476832119 | 107.588206863219 | 107.293161732647 | 99.1106814886419 | 98.8388847479627 |
| ACCOMACK COUNTY | 25327 | 24192 | 24650 | 24522.1840906366 | 102.74645030426 | 103.28199114071 | 98.1419878296146 | 98.6535290273647 |
| CRAIG COUNTY | 3917 | 3747 | 3830 | 3807.2210828548 | 102.271540469974 | 102.883439515493 | 97.8328981723238 | 98.4182404555912 |
| CHARLES CITY COUNTY | 5728 | 5584 | 5700 | 5677.65042979943 | 100.491228070175 | 100.886802927075 | 97.9649122807018 | 98.3505425182942 |
| ISLE OF WIGHT COUNTY | 31039 | 29665 | 29710 | 30281.6797400553 | 104.473241332885 | 102.50091892671 | 99.8485358465163 | 97.9635220194221 |
| SPOTSYLVANIA COUNTY | 105580 | 100062 | 100440 | 102345.441485999 | 105.117483074472 | 103.160432420865 | 99.6236559139785 | 97.7688879418126 |
| LANCASTER COUNTY | 9201 | 8736 | 9065 | 8943.53432452276 | 101.50027578599 | 102.878791159456 | 96.3706563706564 | 97.6795043548532 |
| CLARKE COUNTY | 12213 | 11489 | 11610 | 11882.4255832663 | 105.193798449612 | 102.782044915133 | 98.9577950043066 | 96.6890128576076 |
| POWHATAN COUNTY | 24346 | 23624 | 24195 | 24441.048216348 | 100.62409588758 | 99.6111123569388 | 97.6400082661707 | 96.6570655680737 |
| LOUISA COUNTY | 29799 | 28775 | 29005 | 29810.5293092847 | 102.737459058783 | 99.9613247079075 | 99.2070332701258 | 96.5262968042565 |
| FAIRFAX COUNTY | 784080 | 721354 | 749510 | 747334.300776511 | 104.612346733199 | 104.916902540845 | 96.2434123627437 | 96.523603861148 |
| HENRICO COUNTY | 239597 | 227831 | 236070 | 236137.172406976 | 101.494048375482 | 101.465177023065 | 96.5099334943025 | 96.4824799406588 |
| BEDFORD COUNTY | 62932 | 60599 | 62435 | 62871.2603534819 | 100.796027868984 | 100.096609557653 | 97.059341715384 | 96.3858520718266 |
| NELSON COUNTY | 11827 | 11384 | 11955 | 11835.45 | 98.9293182768716 | 99.9286043200723 | 95.2237557507319 | 96.1856118694262 |
| FREDERICK COUNTY | 68222 | 63868 | 65715 | 66439.8543302061 | 103.814958533059 | 102.682344336483 | 97.189378376322 | 96.1290488124432 |
| NORTHUMBERLAND COUNTY | 10395 | 9904 | 10090 | 10304.4313465051 | 103.022794846383 | 100.878929175705 | 98.1565906838454 | 96.1139888942937 |
| POQUOSON CITY | 9547 | 9109 | 9500 | 9479.6573875803 | 100.494736842105 | 100.710390783827 | 95.8842105263158 | 96.0899706347414 |
| ORANGE COUNTY | 28633 | 27351 | 27865 | 28465.9231224287 | 102.756145702494 | 100.586936446265 | 98.1553920689037 | 96.0833059316801 |
| PRINCE WILLIAM COUNTY | 317403 | 289258 | 300255 | 301330.510742882 | 105.711145526303 | 105.333840644777 | 96.3374465038051 | 95.9935982874356 |
| CHESTERFIELD COUNTY | 268258 | 253920 | 259725 | 264714.168974025 | 103.285398017134 | 101.33873870058 | 97.7649436904418 | 95.9223304835323 |
| STAFFORD COUNTY | 111503 | 103640 | 106940 | 108128.634023171 | 104.266878623527 | 103.120696018509 | 96.9141574714793 | 95.8488016946475 |
| AMELIA COUNTY | 10180 | 9903 | 10280 | 10370.9529879283 | 99.0272373540856 | 98.1587710584496 | 96.3326848249027 | 95.4878496848553 |
| BOTETOURT COUNTY | 26424 | 25671 | 26910 | 27035.1370044442 | 98.1939799331104 | 97.7394713984852 | 95.3957636566332 | 94.9542071703948 |
| GREENE COUNTY | 14956 | 14432 | 15215 | 15272.1611660643 | 98.2977325008216 | 97.9298203926316 | 94.8537627341439 | 94.4987408335423 |
| ALBEMARLE COUNTY | 84004 | 79107 | 83265 | 83844.7847760722 | 100.887527772774 | 100.189892817249 | 95.0063051702396 | 94.3493387349904 |
| CULPEPER COUNTY | 37104 | 35479 | 37200 | 37612.2190201729 | 99.741935483871 | 98.648792776889 | 95.3736559139785 | 94.3283882851241 |
| EMPORIA CITY | 3987 | 3710 | 4035 | 3933.80202774813 | 98.8104089219331 | 101.352329676903 | 91.9454770755886 | 94.3107958618791 |
| KING AND QUEEN COUNTY | 5385 | 5157 | 5430 | 5470.71685662867 | 99.171270718232 | 98.433169566712 | 94.9723756906077 | 94.2655256184836 |
| GLOUCESTER COUNTY | 30265 | 29068 | 30580 | 30862.8948915182 | 98.9699149771092 | 98.0627387883742 | 95.0555918901243 | 94.1842950966615 |
| WESTMORELAND COUNTY | 14199 | 13604 | 14470 | 14454.5505018151 | 98.1271596406358 | 98.2320411708203 | 94.015203870076 | 94.1156904069188 |
| WARREN COUNTY | 30580 | 28871 | 30360 | 30718.0311057939 | 100.724637681159 | 99.5506511946729 | 95.0955204216074 | 93.9871435788555 |
| MADISON COUNTY | 10409 | 10065 | 10770 | 10808.6021505376 | 96.6480965645311 | 96.3029247910864 | 93.4540389972145 | 93.1202745722244 |
| FLUVANNA COUNTY | 20994 | 20197 | 21415 | 21693.8872899953 | 98.0340882558954 | 96.7738041567216 | 94.3123978519729 | 93.0999582048827 |
| KING GEORGE COUNTY | 19822 | 18577 | 19745 | 19984.620303757 | 100.389972144847 | 99.1862727373088 | 94.084578374272 | 92.9564821229435 |
| APPOMATTOX COUNTY | 12256 | 11745 | 12415 | 12679.9865837297 | 98.7192911800242 | 96.6562536882037 | 94.6033024567056 | 92.6262809699701 |
| ROANOKE COUNTY | 73141 | 69136 | 74800 | 74926.0183357278 | 97.7820855614973 | 97.6176255253155 | 92.427807486631 | 92.2723528297154 |
| SUFFOLK CITY | 71421 | 65488 | 69495 | 71088.6638879661 | 102.77142240449 | 100.467495228997 | 94.2341175624146 | 92.1215794732158 |
| HIGHLAND COUNTY | 1879 | 1815 | 1920 | 1971.40562248996 | 97.8645833333333 | 95.3127037157757 | 94.53125 | 92.0662891134289 |
| ARLINGTON COUNTY | 175053 | 155984 | 169220 | 169528.629042616 | 103.446992081314 | 103.258665505987 | 92.178229523697 | 92.0104178750769 |
| YORK COUNTY | 50591 | 47465 | 51590 | 51709.595790716 | 98.0635782128319 | 97.8367732843179 | 92.0042643923241 | 91.7914736601402 |
| FLOYD COUNTY | 11879 | 11477 | 12425 | 12513.1262492746 | 95.6056338028169 | 94.9323115851135 | 92.3702213279678 | 91.7196851639319 |
| SHENANDOAH COUNTY | 32321 | 30958 | 33660 | 33764.3686006826 | 96.0219845513963 | 95.7251722436965 | 91.9726678550208 | 91.6883723375006 |
| CUMBERLAND COUNTY | 7381 | 7134 | 7750 | 7789.9649339934 | 95.2387096774194 | 94.750105585087 | 92.0516129032258 | 91.579359604933 |
| CAROLINE COUNTY | 23033 | 21805 | 23400 | 23813.5723839246 | 98.4316239316239 | 96.7221533529698 | 93.1837606837607 | 91.565430202818 |
| ESSEX COUNTY | 8291 | 7901 | 8610 | 8673.64480667172 | 96.2950058072009 | 95.5884196874491 | 91.7653890824623 | 91.0920400374546 |
| MIDDLESEX COUNTY | 8708 | 8308 | 8995 | 9137.79103230598 | 96.8093385214008 | 95.2965543774586 | 92.3624235686492 | 90.9191288203865 |
| DINWIDDIE COUNTY | 20876 | 19932 | 21840 | 21966.3645130183 | 95.5860805860806 | 95.0362085980494 | 91.2637362637363 | 90.7387291519602 |
| FRANKLIN CITY | 5877 | 5564 | 6060 | 6148.72293307087 | 96.980198019802 | 95.5808232696678 | 91.8151815181518 | 90.4903353194541 |
| CHESAPEAKE CITY | 176334 | 164440 | 181540 | 182080.136649466 | 97.1323124380302 | 96.8441716075112 | 90.5805883000992 | 90.3118830125735 |
| CHARLOTTE COUNTY | 8391 | 8099 | 9005 | 8968.26722791182 | 93.1815657967796 | 93.5632244976465 | 89.9389228206552 | 90.3073001080252 |
| CAMPBELL COUNTY | 40938 | 39080 | 43505 | 43321.1594582393 | 94.0995287897943 | 94.4988557830808 | 89.828755315481 | 90.2099585715667 |
| MECKLENBURG COUNTY | 22837 | 21907 | 24125 | 24290.6105610561 | 94.6611398963731 | 94.0157512409894 | 90.8062176165803 | 90.1871113734884 |
| BATH COUNTY | 3353 | 3207 | 3590 | 3556.62099339369 | 93.3983286908078 | 94.2748751196175 | 89.3314763231198 | 90.1698552068635 |
| HALIFAX COUNTY | 25042 | 24178 | 27030 | 26938.7203033355 | 92.645209027007 | 92.9591298993492 | 89.44876063633 | 89.7518505992518 |
| WYTHE COUNTY | 20849 | 20188 | 22580 | 22508.7368794326 | 92.333923826395 | 92.6262549146007 | 89.406554472985 | 89.6896174500436 |
| VIRGINIA BEACH CITY | 328860 | 303604 | 342075 | 339791.417436993 | 96.1368121026091 | 96.7829036061454 | 88.7536358985603 | 89.3501084547837 |
| RUSSELL COUNTY | 19126 | 18589 | 20935 | 20829.4123626696 | 91.3589682350131 | 91.8220815210206 | 88.7938858371149 | 89.2439963083892 |
| ALEXANDRIA CITY | 111216 | 97404 | 109245 | 109471.650837935 | 101.804201565289 | 101.593425465601 | 89.1610600027461 | 88.976460347894 |
| SCOTT COUNTY | 15973 | 15535 | 17470 | 17465.1205660553 | 91.4310246136234 | 91.4565687627983 | 88.9238694905552 | 88.9487131866319 |
| PITTSYLVANIA COUNTY | 44900 | 43260 | 48845 | 48732.8247628557 | 91.9234312621558 | 92.1350244285919 | 88.565871634763 | 88.7697362312001 |
| PAGE COUNTY | 17104 | 16549 | 18785 | 18744.7481198269 | 91.0513707745542 | 91.246891612849 | 88.0968858131488 | 88.286062283737 |
| CARROLL COUNTY | 21244 | 20645 | 23330 | 23390.9913659661 | 91.0587226746678 | 90.8212895623998 | 88.4912130304329 | 88.2604746288714 |
| FRANKLIN COUNTY | 39895 | 38563 | 43750 | 43800.8998363934 | 91.1885714285714 | 91.0826036657173 | 88.144 | 88.0415702509351 |
| GILES COUNTY | 12058 | 11549 | 13255 | 13150.2963699952 | 90.9694454922671 | 91.6937509295421 | 87.1293851376839 | 87.8231157310733 |
| COLONIAL HEIGHTS CITY | 12913 | 11965 | 13585 | 13641.6725216819 | 95.0533676849466 | 94.6584810585087 | 88.0750828119249 | 87.7091865457335 |
| SOUTHAMPTON COUNTY | 13173 | 12667 | 14545 | 14460.3282142263 | 90.5672052251633 | 91.0975173235707 | 87.0883465108285 | 87.5982883122804 |
| HOPEWELL CITY | 15555 | 14490 | 16780 | 16647.3259883344 | 92.699642431466 | 93.4384297568279 | 86.3528009535161 | 87.0410059258396 |
| AMHERST COUNTY | 22734 | 21897 | 25030 | 25187.8777356567 | 90.8270075908909 | 90.2577034817708 | 87.4830203755493 | 86.9346763939621 |
| PATRICK COUNTY | 12896 | 12527 | 14475 | 14454.5180552411 | 89.0915371329879 | 89.217779179597 | 86.5423143350604 | 86.664944151893 |
| MANASSAS CITY | 23663 | 21629 | 25055 | 24982.9372150123 | 94.4442227100379 | 94.7166451900655 | 86.3260826182399 | 86.5750884848044 |
| PORTSMOUTH CITY | 68285 | 63085 | 73500 | 73041.5565660911 | 92.9047619047619 | 93.4878762314065 | 85.8299319727891 | 86.3686413130011 |
| AUGUSTA COUNTY | 54910 | 53003 | 61185 | 61409.985342899 | 89.7442183541718 | 89.4154259985496 | 86.627441366348 | 86.310067823732 |
| ROCKINGHAM COUNTY | 56871 | 54263 | 62240 | 62923.0410796733 | 91.3737146529563 | 90.3818363260444 | 87.1834832904884 | 86.2370906887544 |
| ALLEGHANY COUNTY | 10965 | 10395 | 12265 | 12110.7078674121 | 89.4007337953526 | 90.5397117992166 | 84.7533632286996 | 85.8331330736759 |
| WASHINGTON COUNTY | 39282 | 37831 | 44075 | 44210.1918465228 | 89.125354509359 | 88.8528150621215 | 85.8332387975043 | 85.5707664226648 |
| WAYNESBORO CITY | 15564 | 14292 | 16550 | 16705.2752699593 | 94.0422960725076 | 93.1681744148711 | 86.356495468278 | 85.5538132059456 |
| HAMPTON CITY | 99929 | 89709 | 105410 | 105555.290793416 | 94.8003035765108 | 94.6698164051036 | 85.1048287638744 | 84.9876868565225 |
| ROCKBRIDGE COUNTY | 16203 | 15651 | 18455 | 18417.5014355758 | 87.7973448929829 | 87.9761028208844 | 84.806285559469 | 84.9789536042499 |
| HENRY COUNTY | 36321 | 34247 | 40650 | 40334.7960076348 | 89.3505535055351 | 90.0488005272791 | 84.2484624846248 | 84.9068382384221 |
| FREDERICKSBURG CITY | 19199 | 17549 | 20570 | 20786.1230585424 | 93.3349538162372 | 92.3645065793539 | 85.3135634419057 | 84.4265183583041 |
| BUCHANAN COUNTY | 14607 | 14009 | 17030 | 16593.5531947032 | 85.7721667645332 | 88.0281626762295 | 82.2607163828538 | 84.4243534559663 |
| CHARLOTTESVILLE CITY | 33751 | 30439 | 36565 | 36279.5483271375 | 92.3041159578832 | 93.0303753940449 | 83.2462737590592 | 83.9012650475344 |
| MARTINSVILLE CITY | 9035 | 8269 | 9780 | 9907.04111004502 | 92.3824130879346 | 91.19776429351 | 84.5501022494888 | 83.4658896450509 |
| STAUNTON CITY | 18003 | 16879 | 20050 | 20246.1778349511 | 89.7905236907731 | 88.9204873471048 | 84.1845386533666 | 83.3688221925113 |
| DICKENSON COUNTY | 10071 | 9453 | 11470 | 11364.839012417 | 87.8029642545771 | 88.6154215558763 | 82.4149956408021 | 83.1775970576605 |
| LUNENBURG COUNTY | 8036 | 7764 | 9320 | 9346.41326998416 | 86.2231759656652 | 85.9795064466866 | 83.3047210300429 | 83.069299160288 |
| PULASKI COUNTY | 23605 | 22821 | 27645 | 27561.5940014198 | 85.3861457768132 | 85.6445385516674 | 82.5501899077591 | 82.8000006052786 |
| LEE COUNTY | 15524 | 14913 | 18140 | 18075.0410226191 | 85.5788313120176 | 85.8863887532718 | 82.2105843439912 | 82.5060368125189 |
| BRISTOL CITY | 12449 | 11090 | 13545 | 13449.9195671249 | 91.9084533038021 | 92.5581743286302 | 81.87523071244 | 82.4540246850758 |
| SMYTH COUNTY | 20124 | 19429 | 23735 | 23613.9194256757 | 84.7861807457342 | 85.2209226144769 | 81.8580155887929 | 82.277743265587 |
| GRAYSON COUNTY | 10885 | 10488 | 12740 | 12750.803652968 | 85.4395604395604 | 85.3671681899538 | 82.3233908948195 | 82.253638950504 |
| BLAND COUNTY | 4624 | 4319 | 5285 | 5258.4851917786 | 87.4929044465468 | 87.9340690590782 | 81.7218543046358 | 82.1339196077333 |
| MANASSAS PARK CITY | 8938 | 8188 | 10210 | 9983.46973422316 | 87.5416258570029 | 89.5279921504714 | 80.1958863858962 | 82.0155739234795 |
| NEWPORT NEWS CITY | 122432 | 110842 | 136045 | 135707.766502132 | 89.9937520673307 | 90.2173863410214 | 81.4745121099636 | 81.6769760913118 |
| PETERSBURG CITY | 23678 | 20626 | 25315 | 25335.4844606947 | 93.5334781749951 | 93.4578536942283 | 81.4773849496346 | 81.411508163576 |
| BRUNSWICK COUNTY | 11073 | 10706 | 13200 | 13152.0871143376 | 83.8863636363636 | 84.1919605895016 | 81.1060606060606 | 81.4015289507093 |
| COVINGTON CITY | 3797 | 3576 | 4435 | 4394.75920432734 | 85.6144306651635 | 86.3983627649325 | 80.6313416009019 | 81.369645838135 |
| WISE COUNTY | 24615 | 23581 | 29215 | 28980.9985437029 | 84.254663700154 | 84.9349616538607 | 80.7153859318843 | 81.3671066731541 |
| DANVILLE CITY | 28416 | 26010 | 32135 | 32023.525462526 | 88.426948809709 | 88.734764800498 | 80.9397852808464 | 81.2215383045099 |
| WINCHESTER CITY | 18077 | 15867 | 19730 | 19604.3848479459 | 91.6218955904714 | 92.2089631488439 | 80.4206791687785 | 80.9359749008522 |
| ROANOKE CITY | 65501 | 58902 | 73540 | 72871.9555618569 | 89.0685341310851 | 89.8850586552461 | 80.0951862931738 | 80.8294487856874 |
| NORTON CITY | 2600 | 2443 | 3055 | 3036.48994767282 | 85.1063829787234 | 85.6251805474493 | 79.9672667757774 | 80.4547369528534 |
| SALEM CITY | 17727 | 16271 | 20090 | 20223.9122032026 | 88.2379293180687 | 87.6536637515305 | 80.9905425584868 | 80.4542654087636 |
| RICHMOND CITY | 158141 | 142368 | 177060 | 178454.840906495 | 89.3149214955382 | 88.6168171155757 | 80.4066418163334 | 79.778166440773 |
| LYNCHBURG CITY | 55508 | 49029 | 61460 | 61591.2816299704 | 90.3156524568825 | 90.1231449176237 | 79.7738366417182 | 79.6037989508931 |
| GALAX CITY | 4016 | 3765 | 4730 | 4780.43249737198 | 84.9048625792812 | 84.0091352028876 | 79.5983086680761 | 78.7585642527071 |
| TAZEWELL COUNTY | 27315 | 25371 | 32495 | 32303.552312954 | 84.0590860132328 | 84.5572639670542 | 78.0766271734113 | 78.5393499581963 |
| BUCKINGHAM COUNTY | 11026 | 10436 | 13620 | 13653.7685950413 | 80.9544787077827 | 80.7542615304345 | 76.6226138032305 | 76.4331102241624 |
| SUSSEX COUNTY | 7121 | 6836 | 9185 | 9072.86348501665 | 77.5285792052259 | 78.4867975998972 | 74.4256940664126 | 75.3455621953234 |
| RICHMOND COUNTY | 5629 | 5442 | 7200 | 7224.66570891811 | 78.1805555555556 | 77.9136395619187 | 75.5833333333333 | 75.3252845080764 |
| BUENA VISTA CITY | 4380 | 3900 | 5225 | 5206.04308390023 | 83.8277511961722 | 84.1329956247427 | 74.6411483253589 | 74.9129413097024 |
| NOTTOWAY COUNTY | 9651 | 9272 | 12435 | 12415.0516555441 | 77.6115802171291 | 77.7362855005938 | 74.5637314032971 | 74.6835394427009 |
| PRINCE EDWARD COUNTY | 13443 | 12710 | 17880 | 17855.5704331193 | 75.1845637583893 | 75.2874294907171 | 71.0850111856823 | 71.182268007663 |
| PRINCE GEORGE COUNTY | 24912 | 22751 | 32440 | 32542.6057025908 | 76.7940813810111 | 76.5519523165187 | 70.132552404439 | 69.9114269088438 |
| NORFOLK CITY | 138210 | 126445 | 184395 | 182802.310498883 | 74.9532254128366 | 75.6062653818834 | 68.5729005667182 | 69.170351104929 |
| MONTGOMERY COUNTY | 60377 | 54593 | 79030 | 79093.9692416654 | 76.3975705428318 | 76.3357820815931 | 69.0788308237378 | 69.02296157776 |
| WILLIAMSBURG CITY | 10127 | 8721 | 12985 | 13178.843062201 | 77.9899884482095 | 76.8428605773891 | 67.1621101270697 | 66.174245788033 |
| GREENSVILLE COUNTY | 6395 | 6154 | 9595 | 9438.61461619348 | 66.6492965085982 | 67.7535873647001 | 64.137571651902 | 65.2002465429811 |
| HARRISONBURG CITY | 25205 | 22833 | 38720 | 38443.4607770834 | 65.0955578512397 | 65.5638162915473 | 58.9695247933884 | 59.3937162223725 |
| RADFORD CITY | 9171 | 8418 | 14315 | 14484.6131060331 | 64.0656653859588 | 63.315464022854 | 58.8054488298987 | 58.1168439804149 |
| LEXINGTON CITY | 4087 | 3410 | 6470 | 6490.89062289789 | 63.1684698608965 | 62.9651651436292 | 52.7047913446677 | 52.5351634792698 |