Second time’s the charm! See here for my (corrected) first attempt. My apologies for the coding error in my first effort to compute the 2020 CSV Estimates.
Per a question that I received I took a look at the difference between the number of voters that the VA department of elections (“ELECT”) says participated in a given election (via their Voter History List files), the number of ballots that ELECT says were counted in an election (via the public CSV Election Results files), and the amount of turnout that occurred in a given election (via the ELECT public Turnout CSV files).
Theoretically, all of these sources should give the same (or extremely similar) results. Note that the VHL is counting people, and the CSV is counting votes cast in the respective races, but the numbers should still be roughly similar between the two sources. Also the Results CSV “Total Vote” field, and the Turnout CSV files used for this analysis should be including overvotes, write-ins, etc so that should not the source of the discrepancies. Furthermore, the 11-06-2021 VHL data file is identical to the VHL datafile I downloaded on 12-14-2021, so there is no “missing data” from the VHL file for the 2021 election, unless ELECT has a significant lag in their updating of voter credit. From my conversations with multiple registrars and elections staff, the voter credit is applied when the canvas is completed and the results are certified, so this also should not be a source of error. Update 2022-07-31 23:05 per email discussion with ELECT staff there IS a significant lag in the updating of the VHL data from the time of canvas and certification. This explains the incomplete 2021 VHL. The voter credit is supposed to be applied as of the canvas and certification, but there is often lag in the data being entered and/or replicated. I am not exactly sure how long of a lag is to be expected. Also, while the links for the DAL file given out by ELECT after a user purchases the data are “live” and updated daily over a 30 day window, the links for the RVL and VHL are NOT! So all of this data should be considered as of Nov 6 2021.
Finally, note that by definition the Voter History List information will slightly undercount the number of voters that participated in previous elections, because voters that have been removed from the registered voter list in between the end of an election period and when the a given VHL file is downloaded (11-6-2021 and 12-14-2021 in this case) will have had their corresponding records also deleted from the VHL. This means that as the date of the VHL file you are using gets further and further away from the election that you are interested in, the VHL data becomes more and more inaccurate by design. This seems like a pretty bad way to do record keeping in my opinion, but thats the way ELECT is handling the data.
Results:
One interesting thing to note, is that even though ELECT and registrars state that the “Voter Credit” (i.e. updates to the VHL) are applied at the conclusion of the canvas and before certification of the election, it appears that there are significant differences with the VHL for 2021 from the Turnout and Result CSV files. The VHL file I am using was first downloaded on 11-06-2021 after the canvas and certification was completed, and I continued to download and archive versions of the the live URL link I received from ELECT until 12-14-2021. There was no change in the content of the VHL file for that entire period. (See my update note above) An example from King George County is shown below.

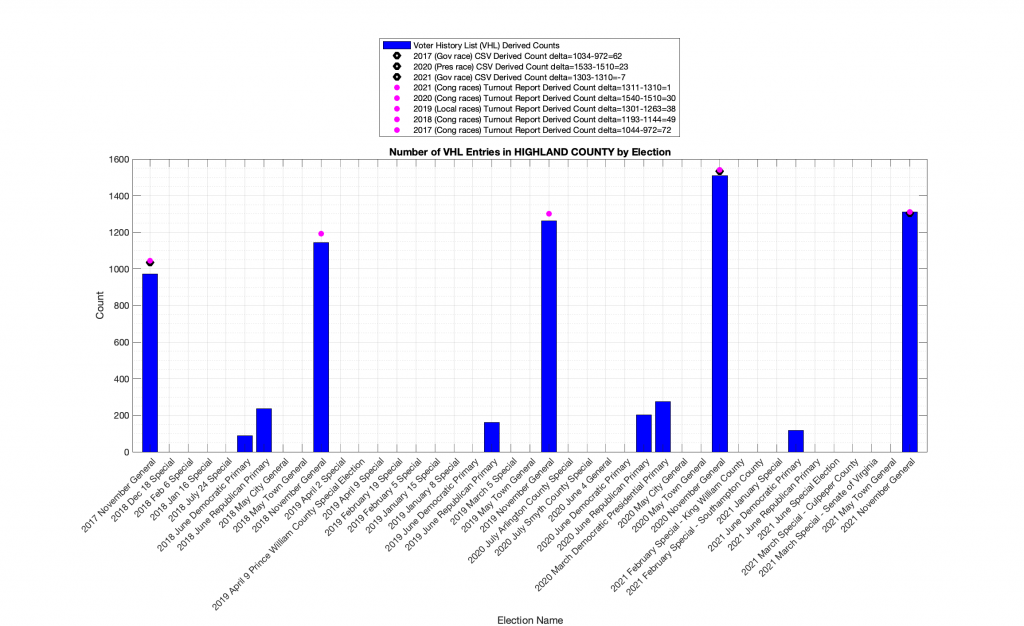
Another interesting thing to observe is that the CSV Election Results and CSV Turnout Results tend to agree for the most part, while the VHL data discrepancies trend negatively as we move further and further away from past elections. As discussed above, this might be attributable to the fact that changes to the voter registrations are mirrored in updates to the Voter History List. An example from Highland County that shows this small but increasing deviation as we move into the past is shown below.

One specific interesting datapoint is the below plot from Page county, where the 2020 Results CSV and Turnout CSV numbers significantly deviate, with a much smaller deviation between the VHL numbers and the Results CSV. I don’t have any explanation as to why this occurs in the data.

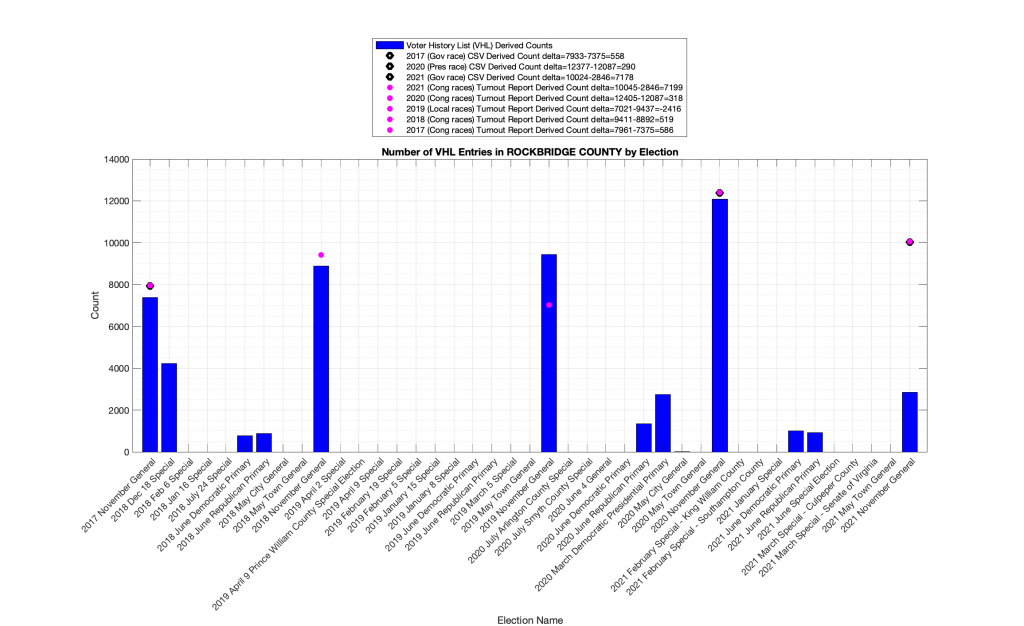
Another specifically interesting datapoint is that the turnout numbers from 2019 in Rockbridge County are significantly less than the number of voters that supposedly participated in the elections according to the VHL. (Note that there were no congressional district races in 2019 November General.) This is particularly interesting considering that we presume, per discussion above, that the VHL undercounts the number of participating voters as we look further and further into the past, as the VHL has voters removed as they are purged from the voter roles. So how does the number of participating voters (from VHL) outnumber the number of votes tallied by ~2400?
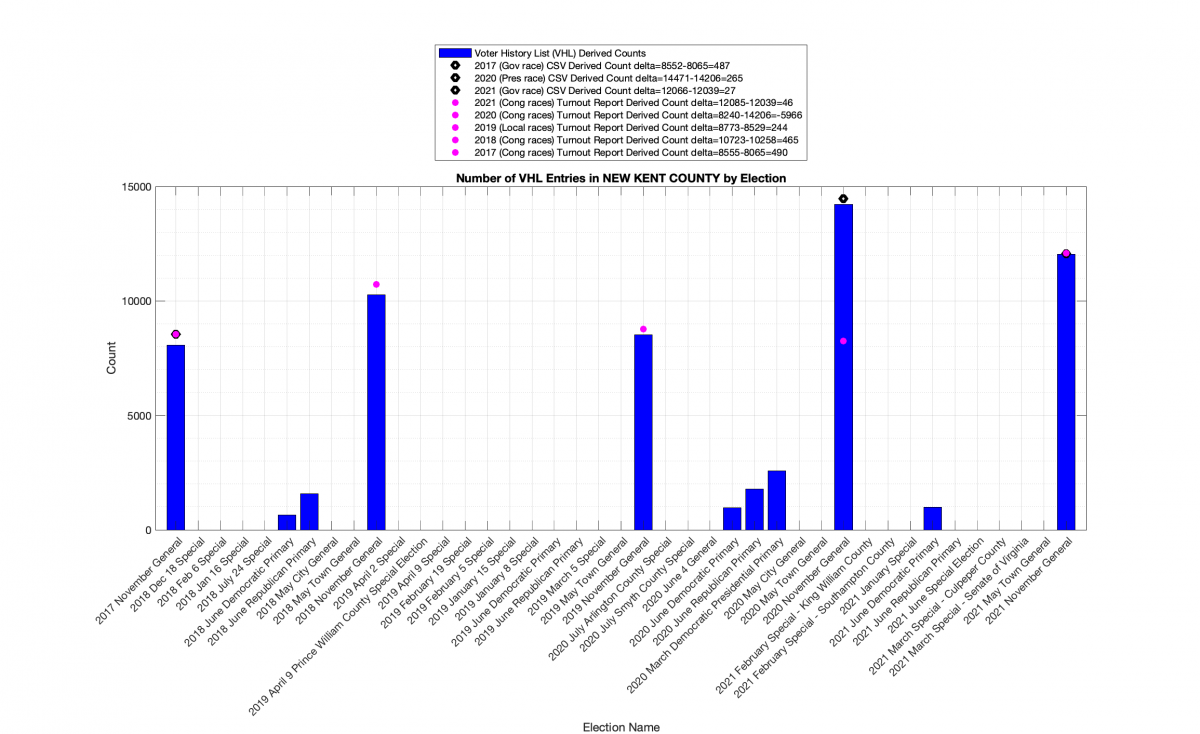
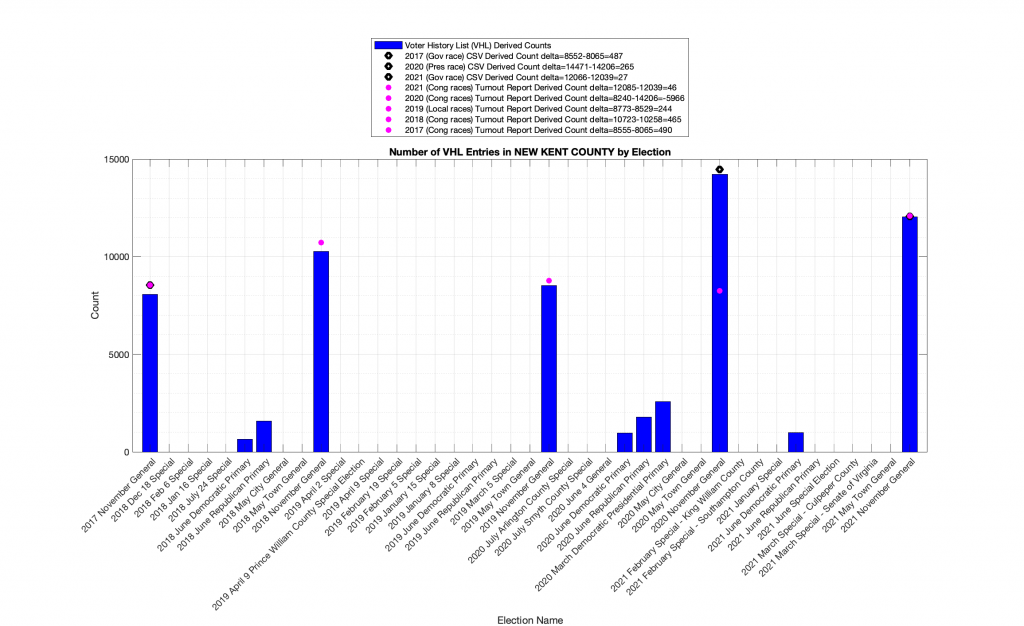
A similar occurrence in New Kent County in 2020 can be observed below, with a deviation of nearly -6000 estimated ballots. The VHL file shows there were ~6000 more voters that participated in the election than the Turnout CSV file records, yet the CSV file for the number of votes cast is within 265 votes of the VHL estimate. Whats going on here?
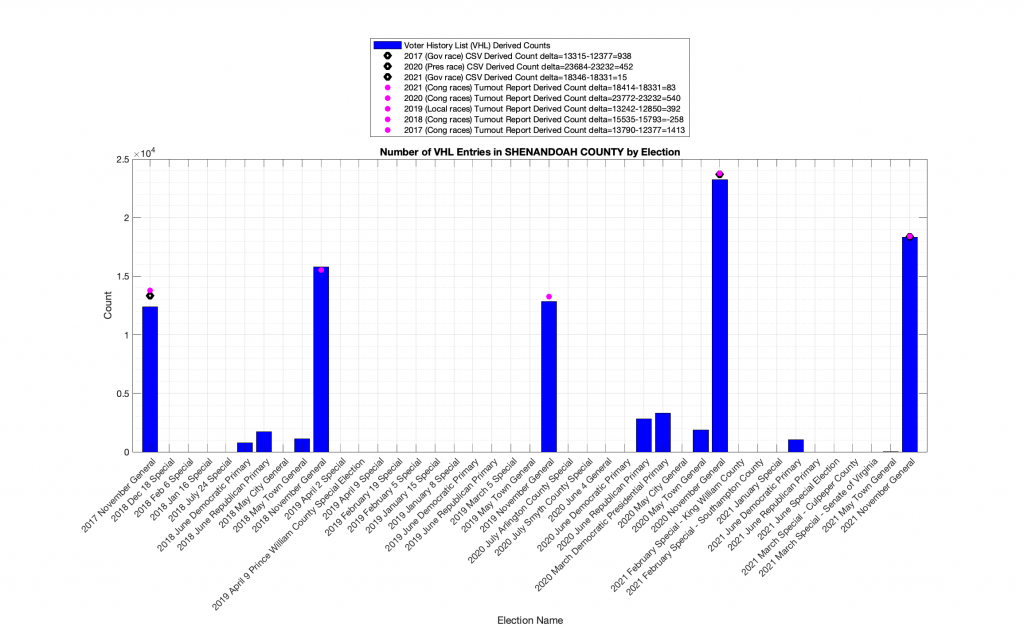
A similar situation occurs in Shenandoah County in 2018, but by a much smaller margin.
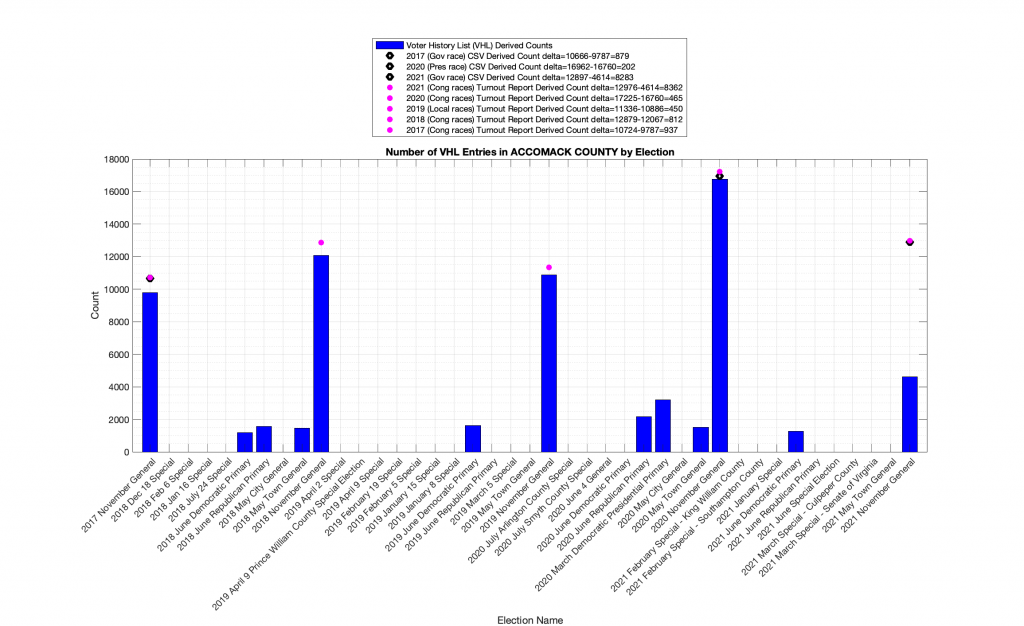
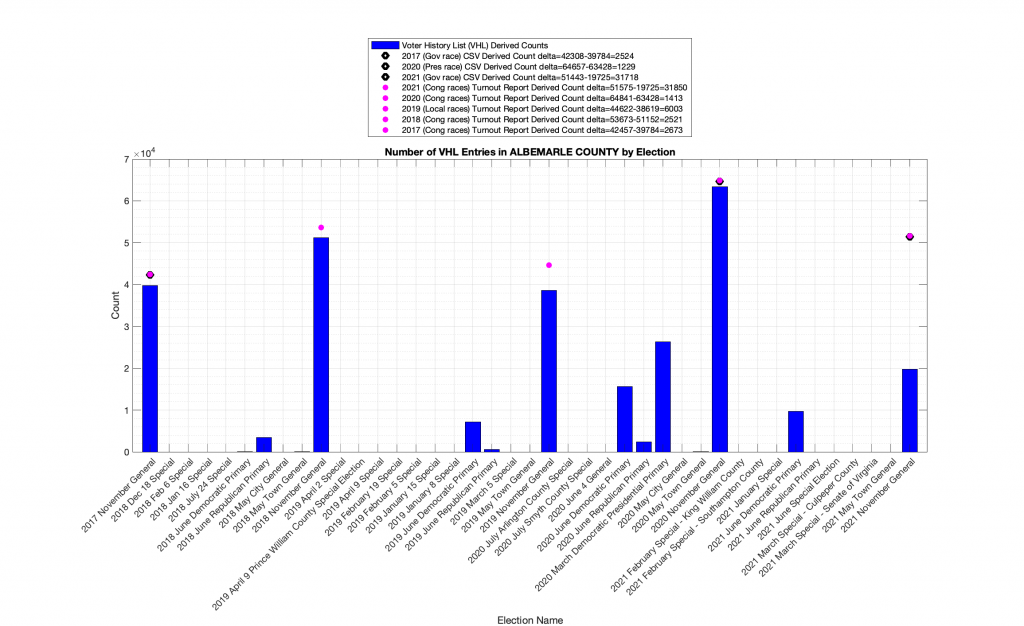
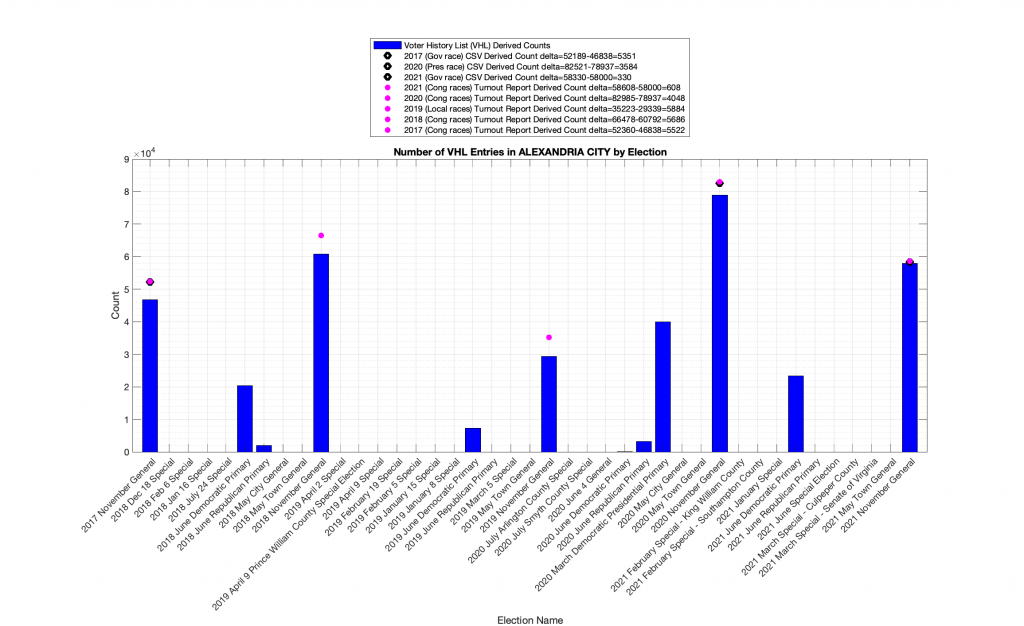
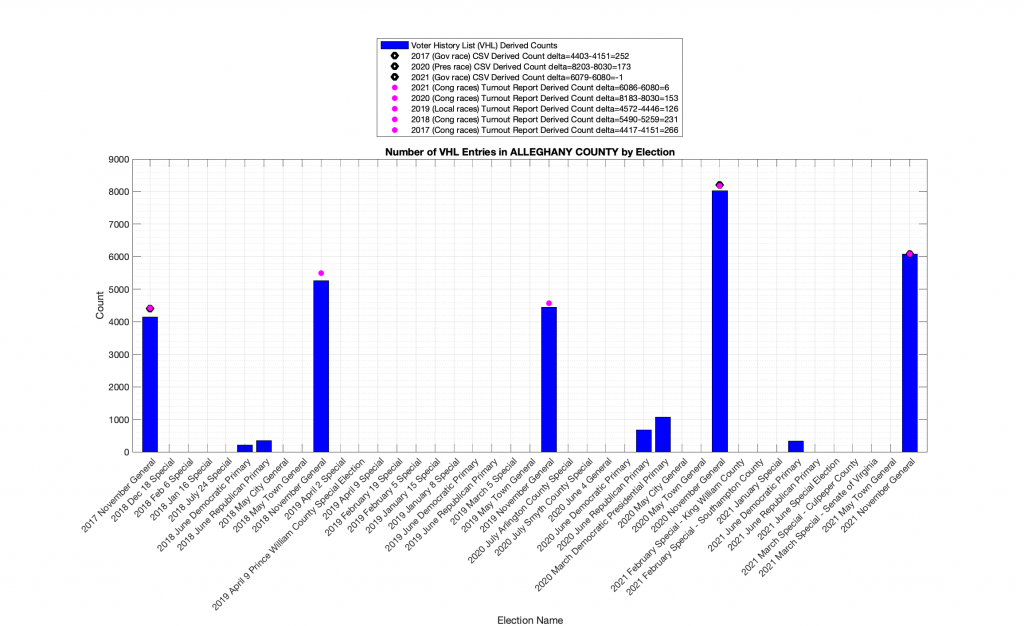
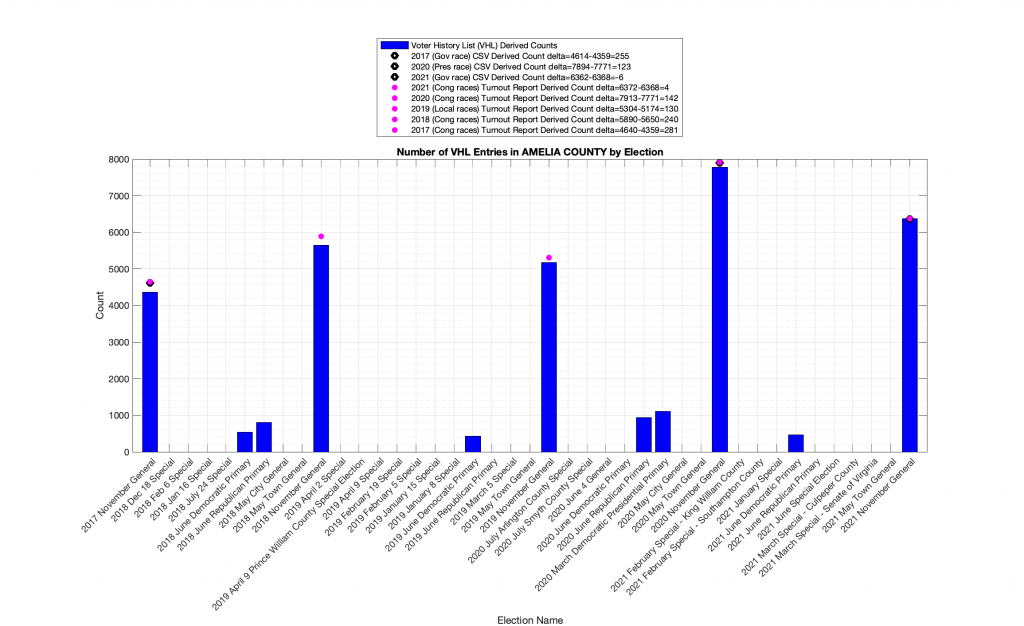
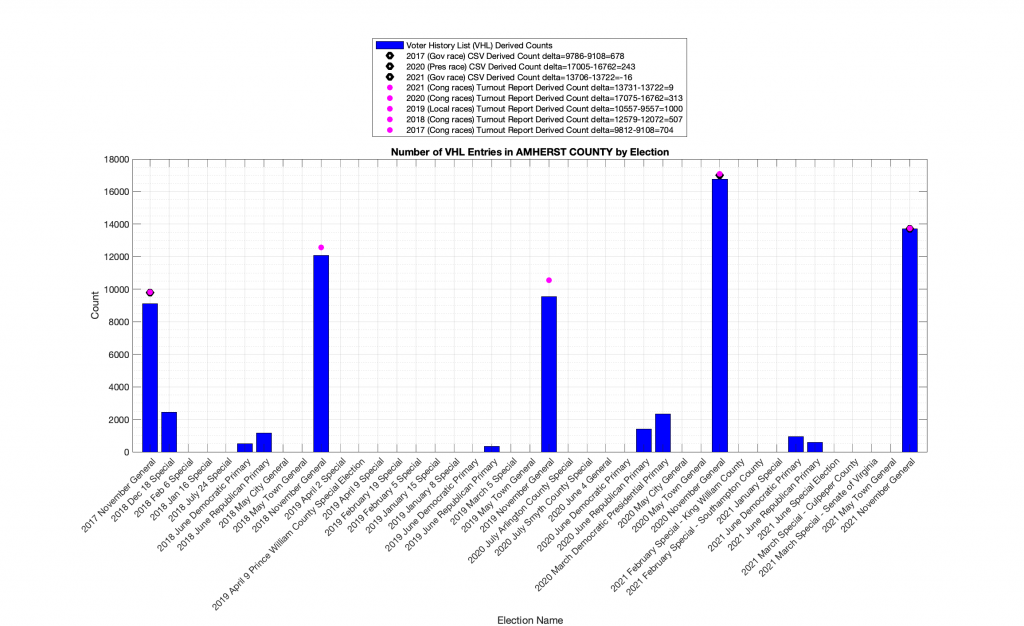
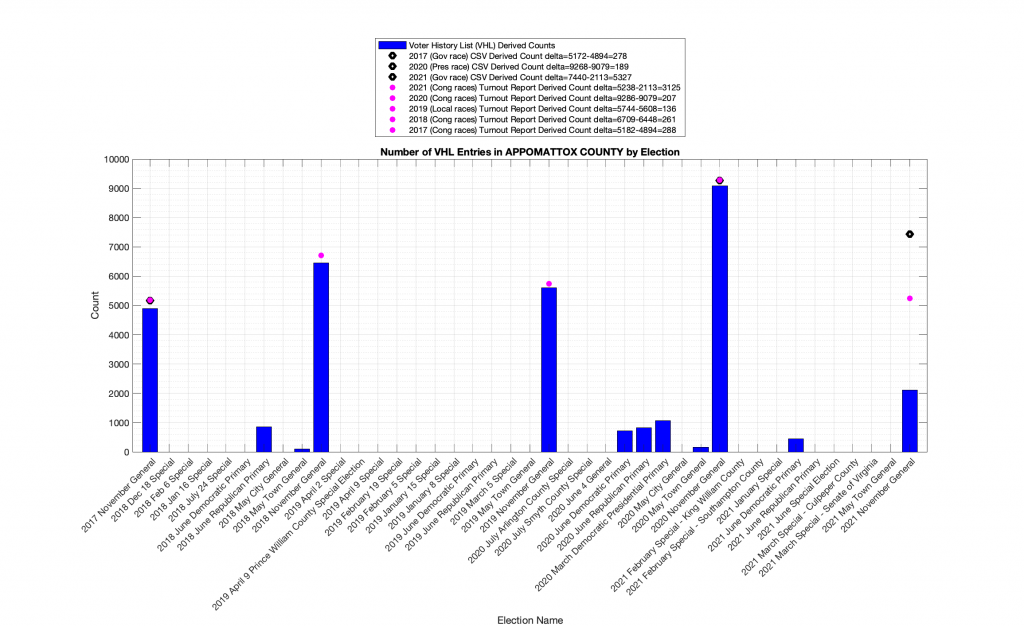
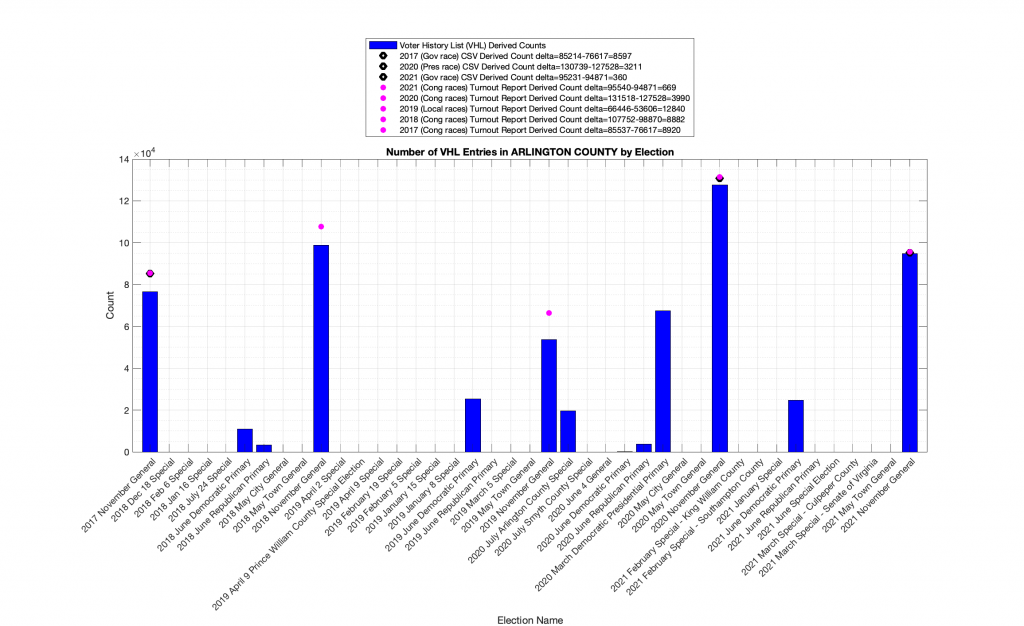
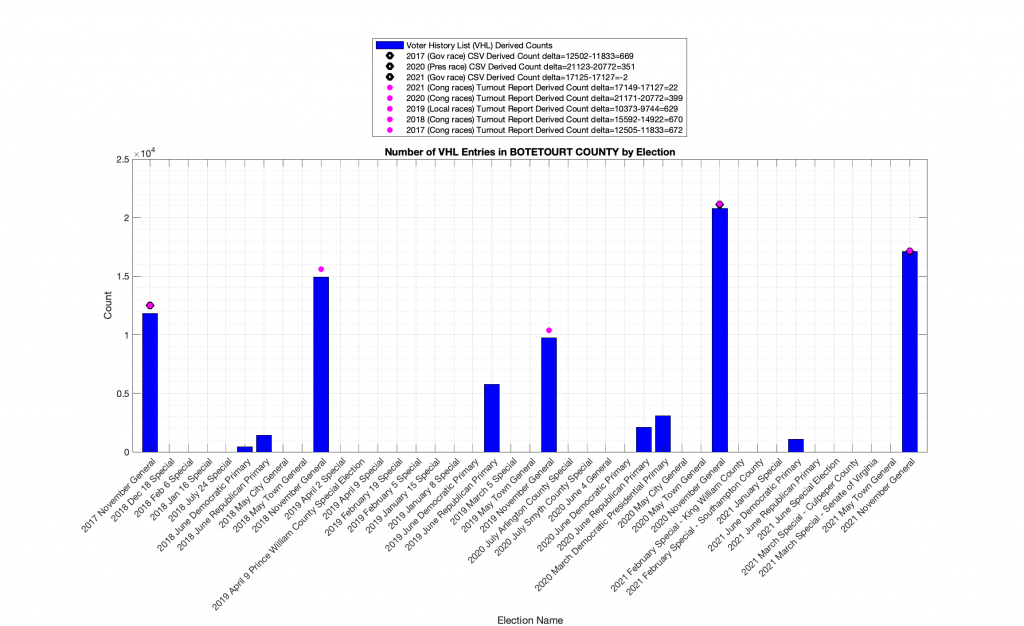
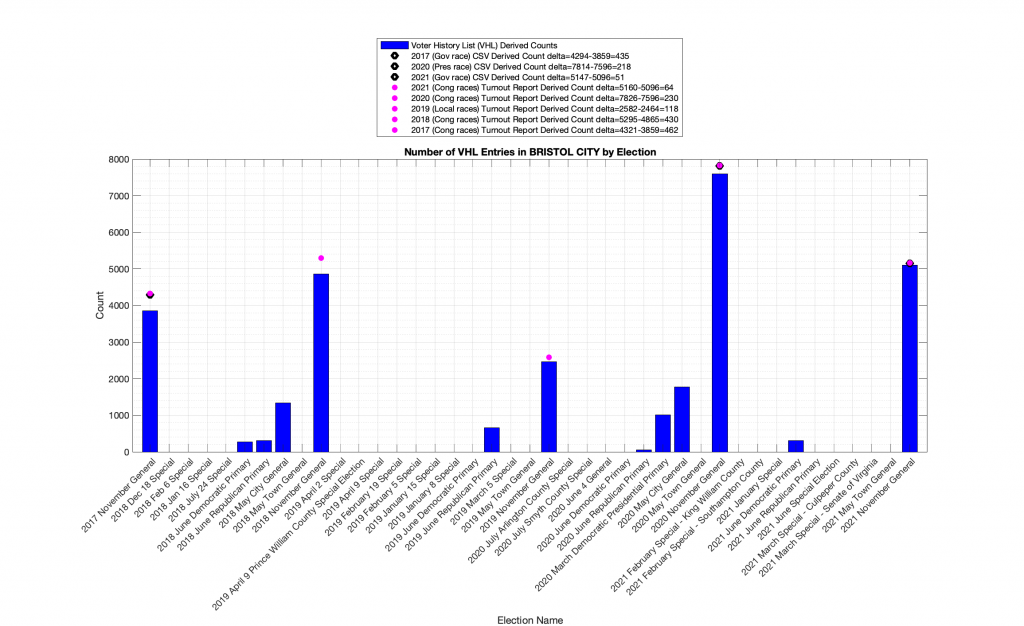
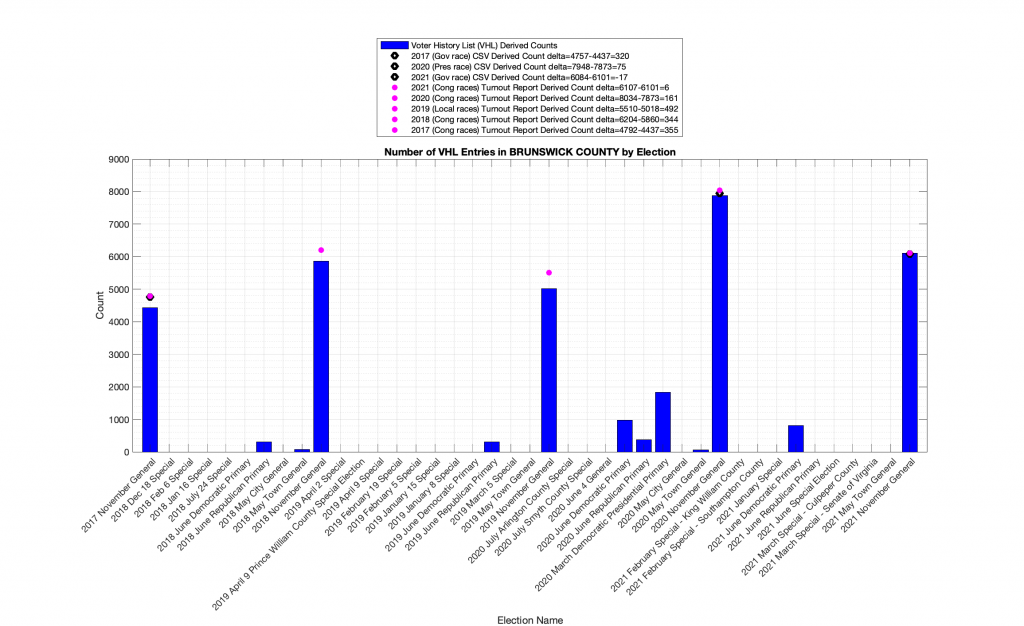
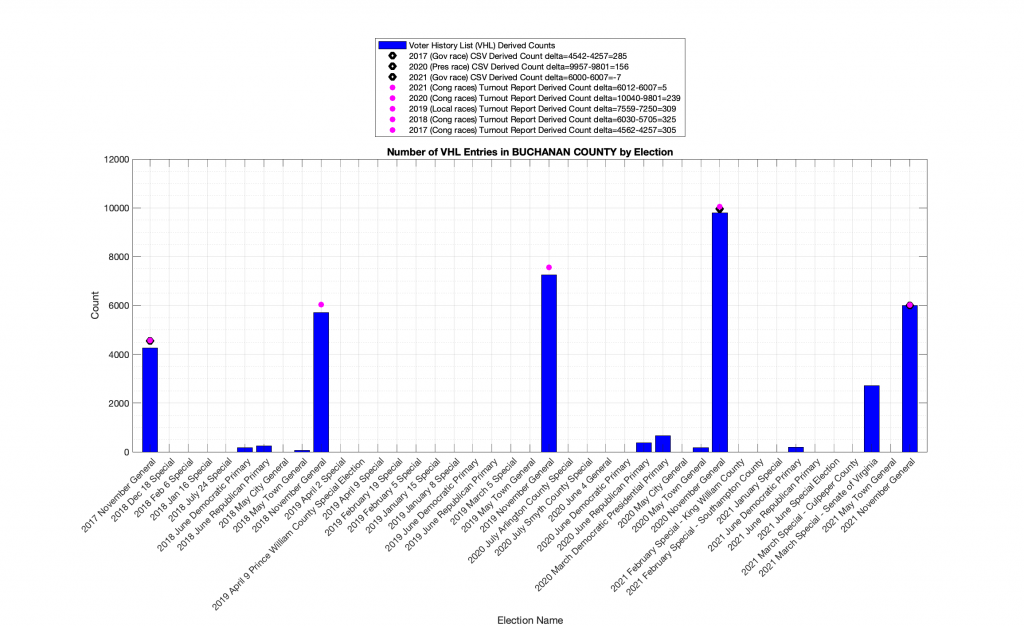
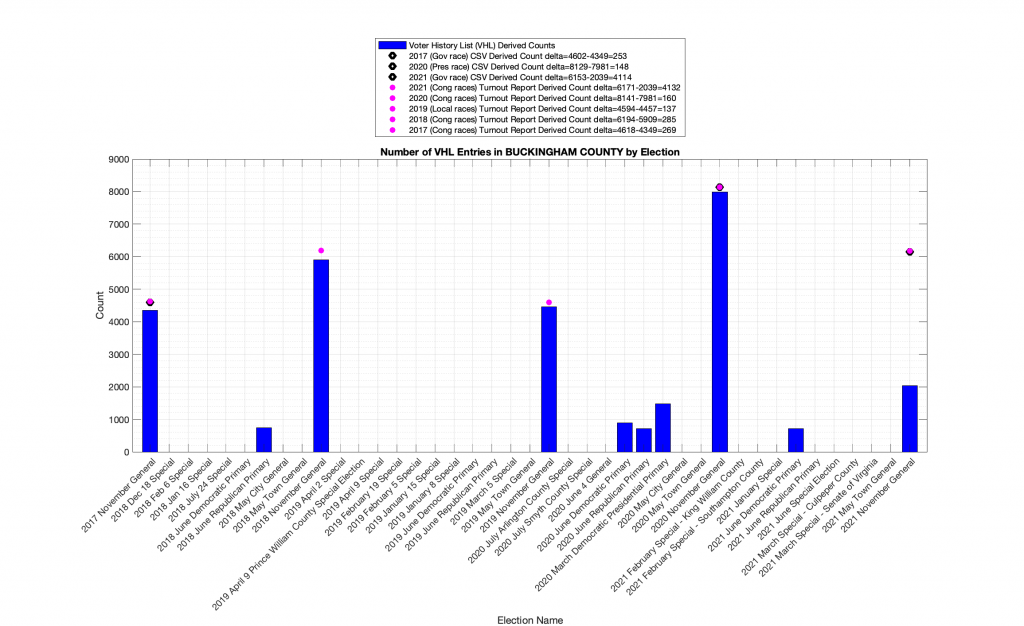
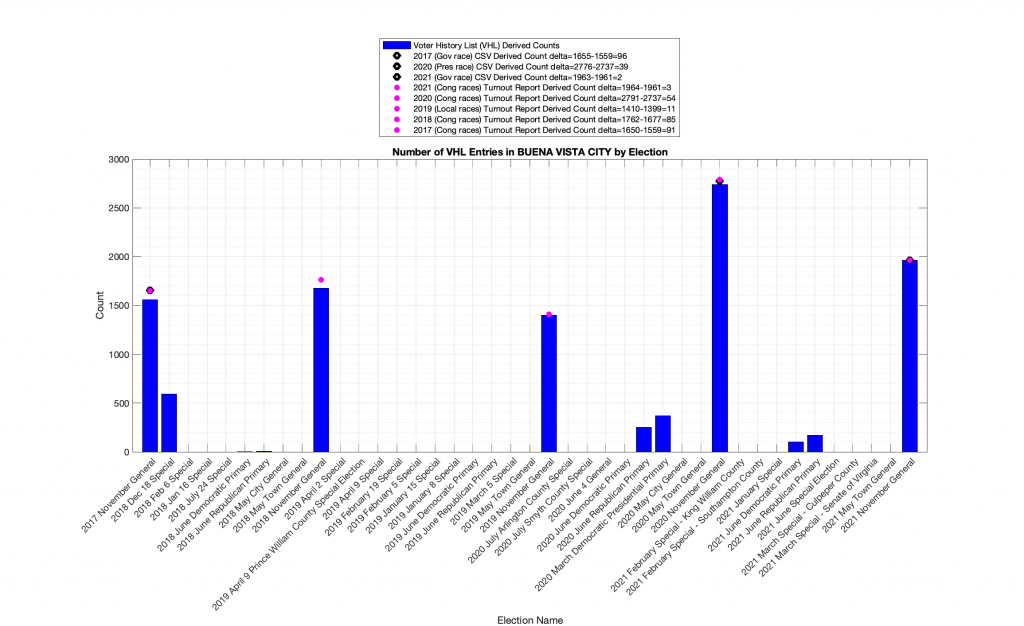
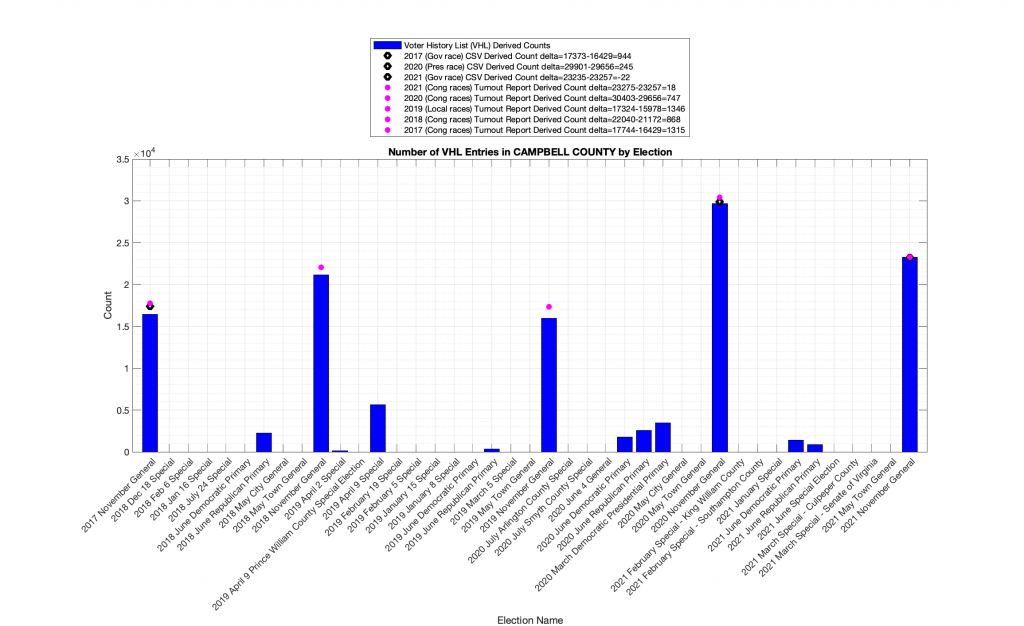
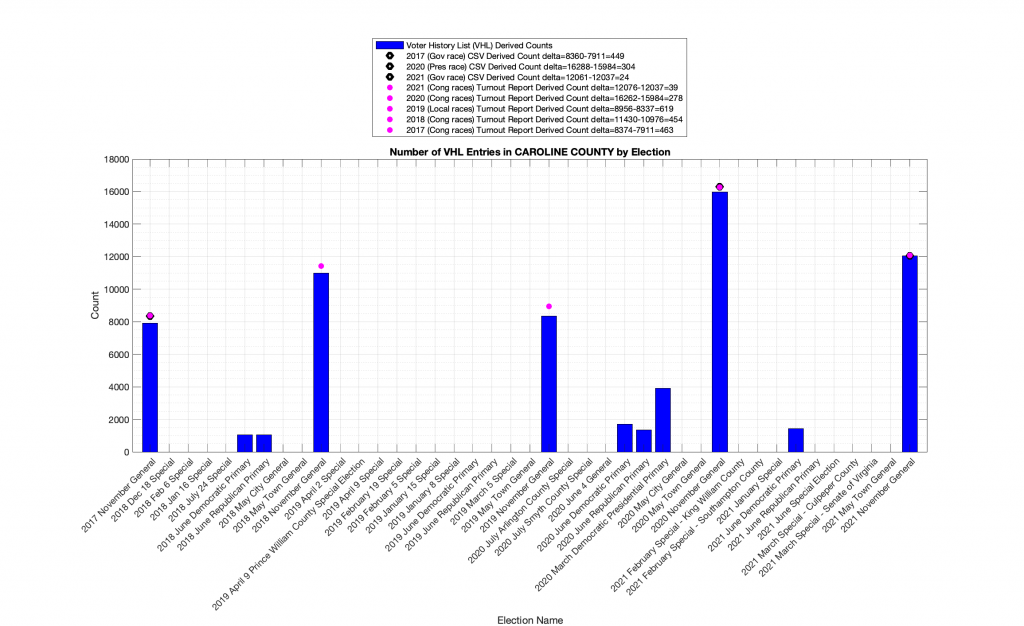
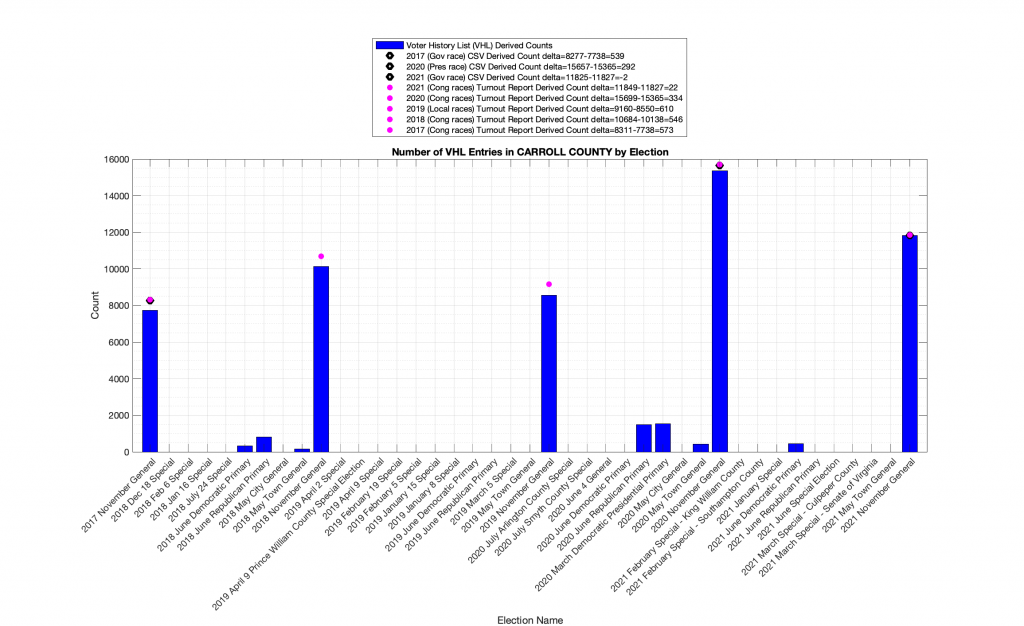
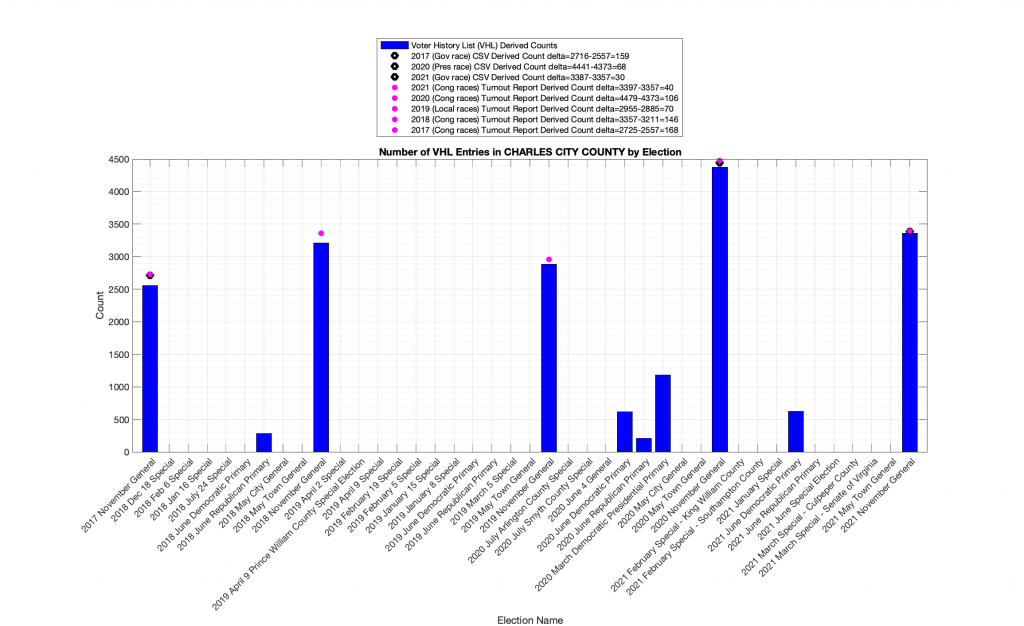
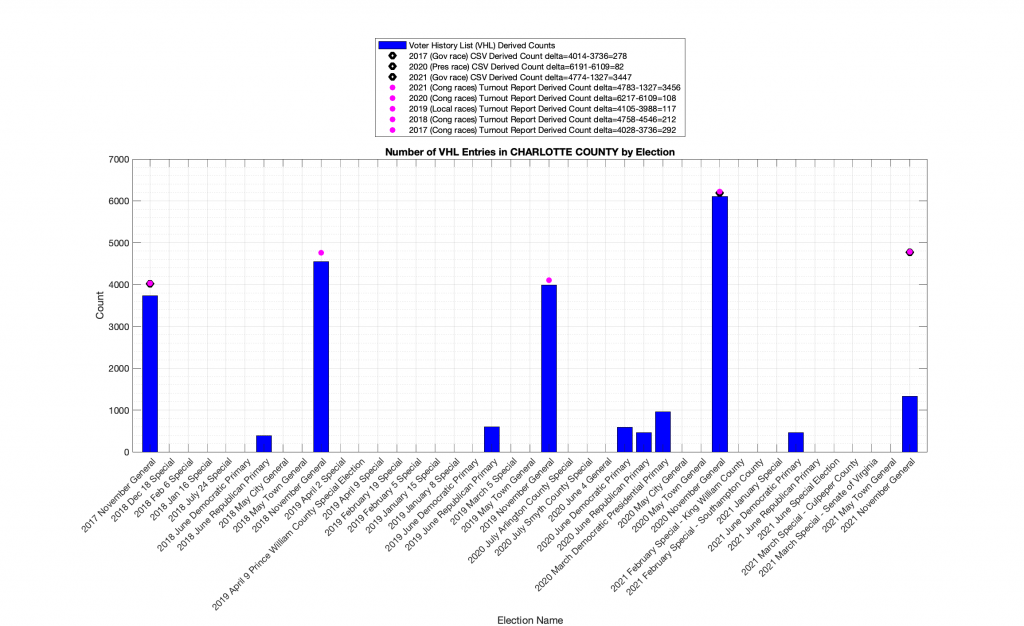
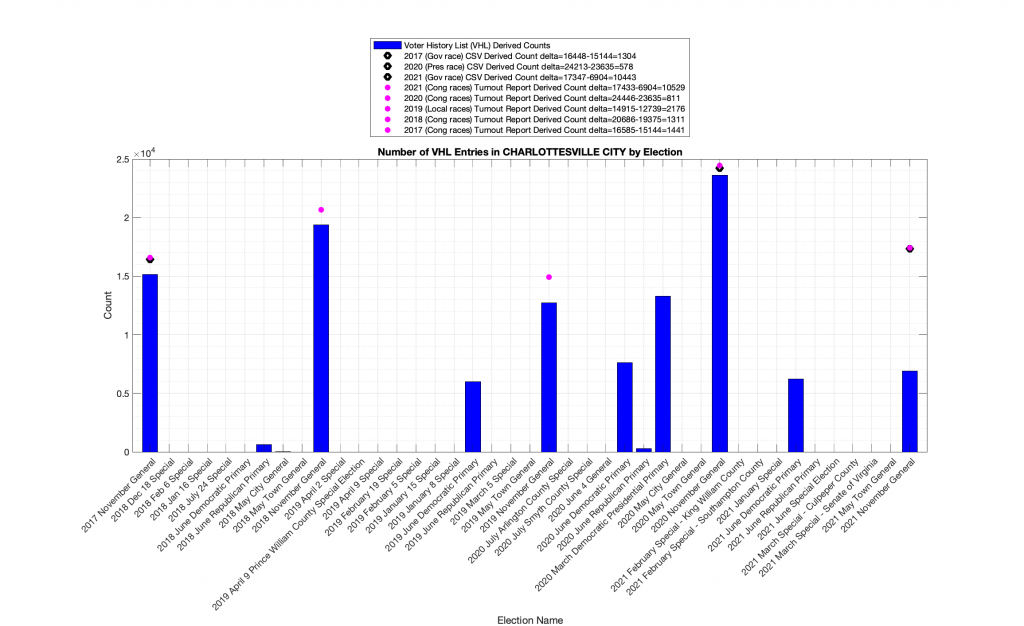
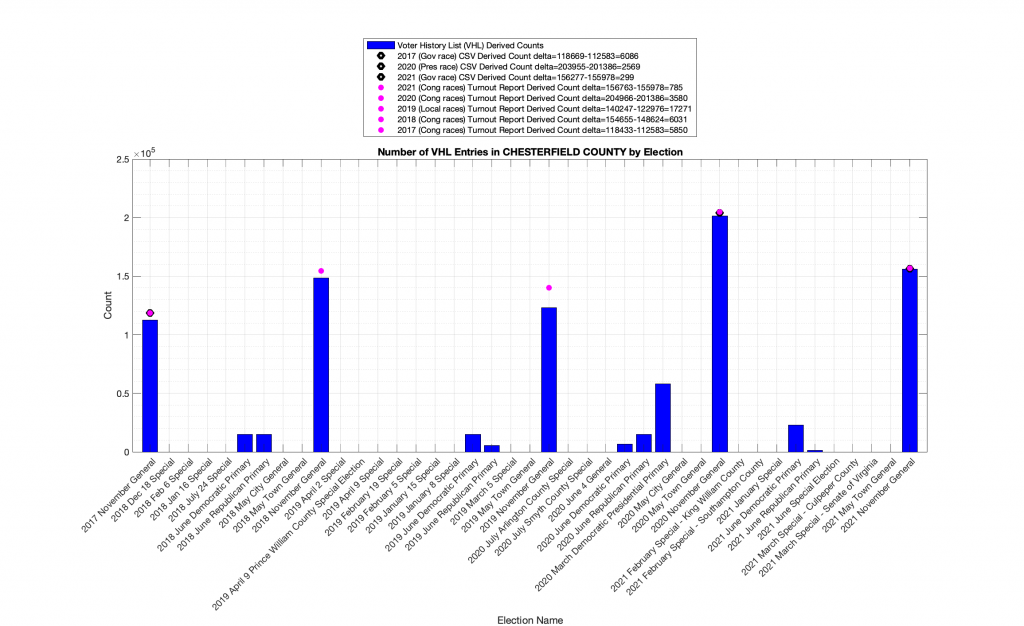
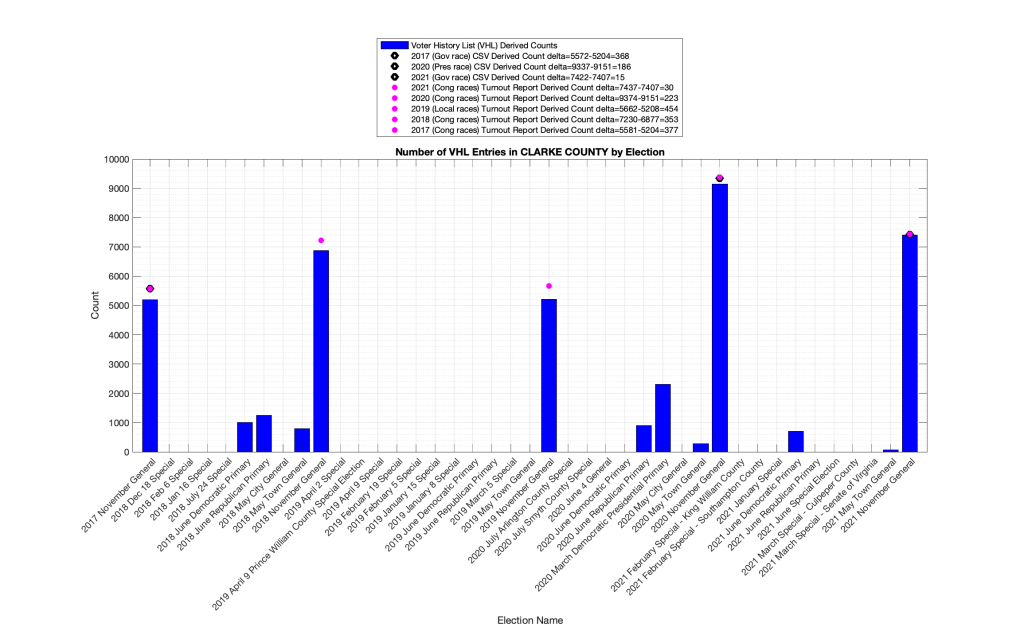
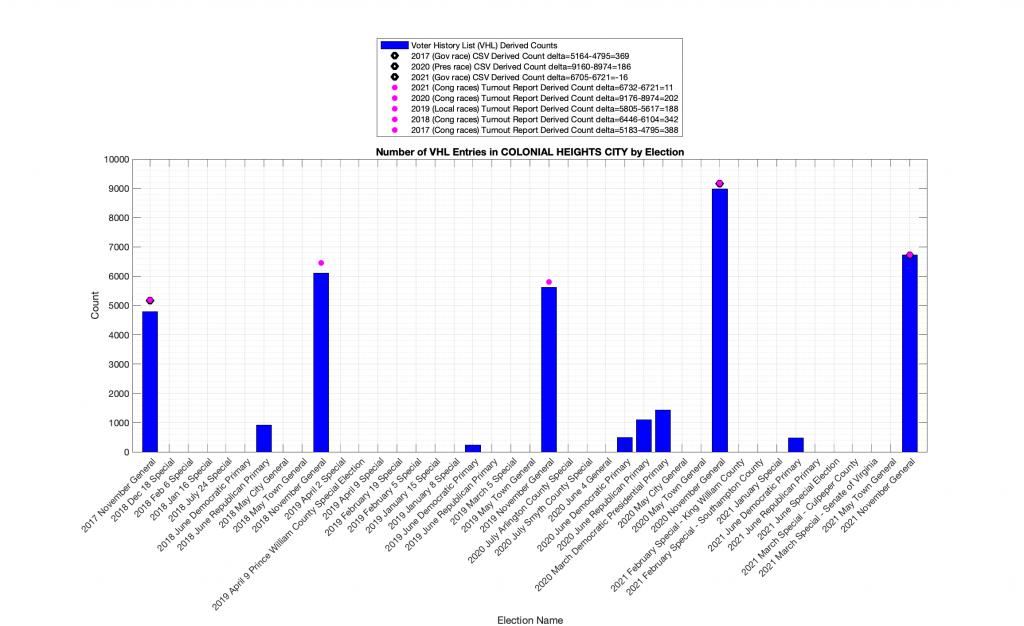
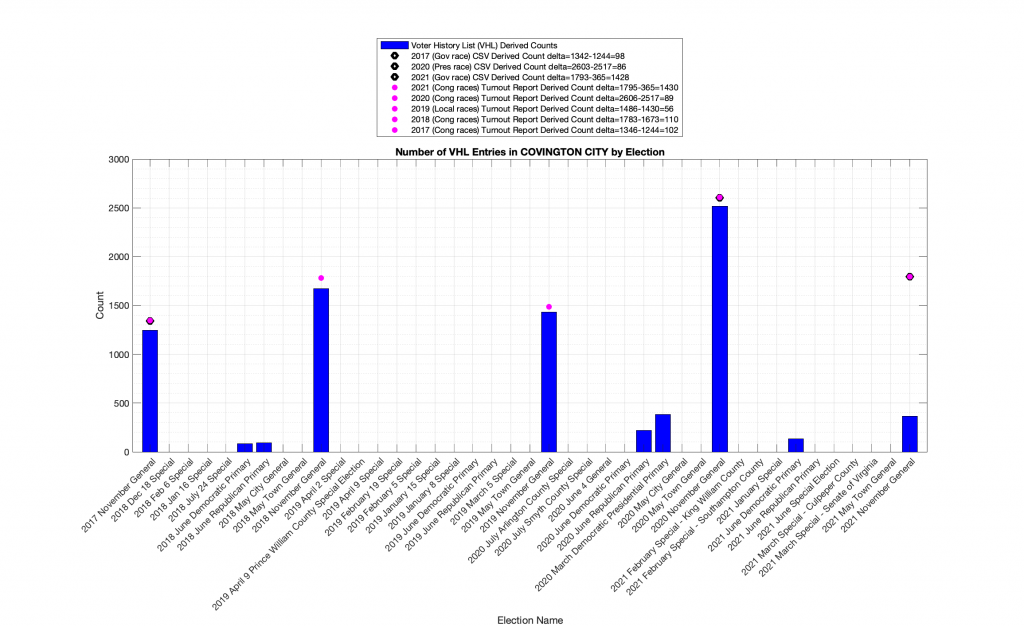
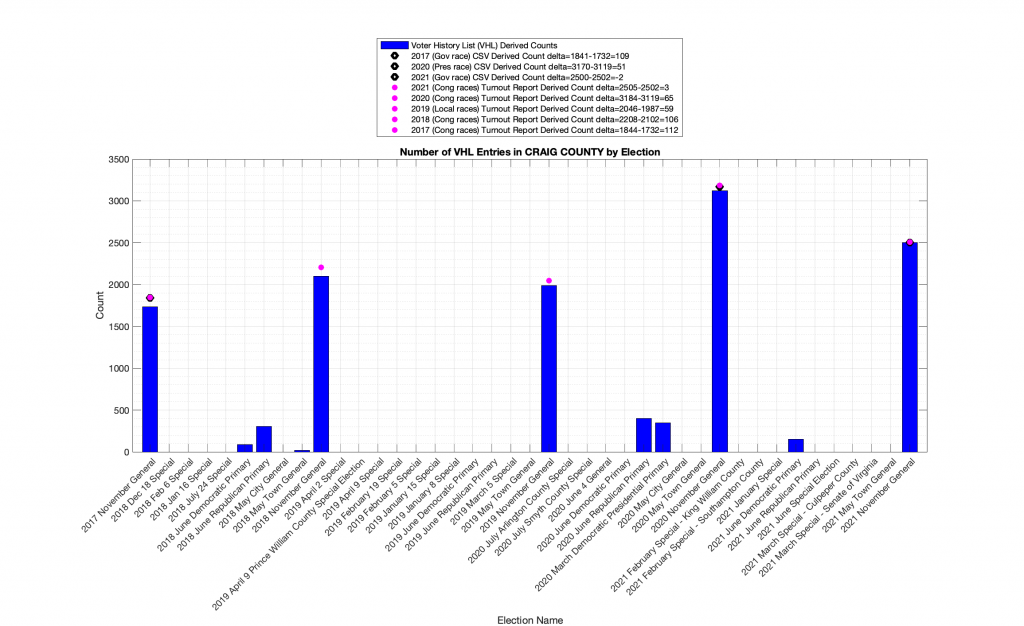
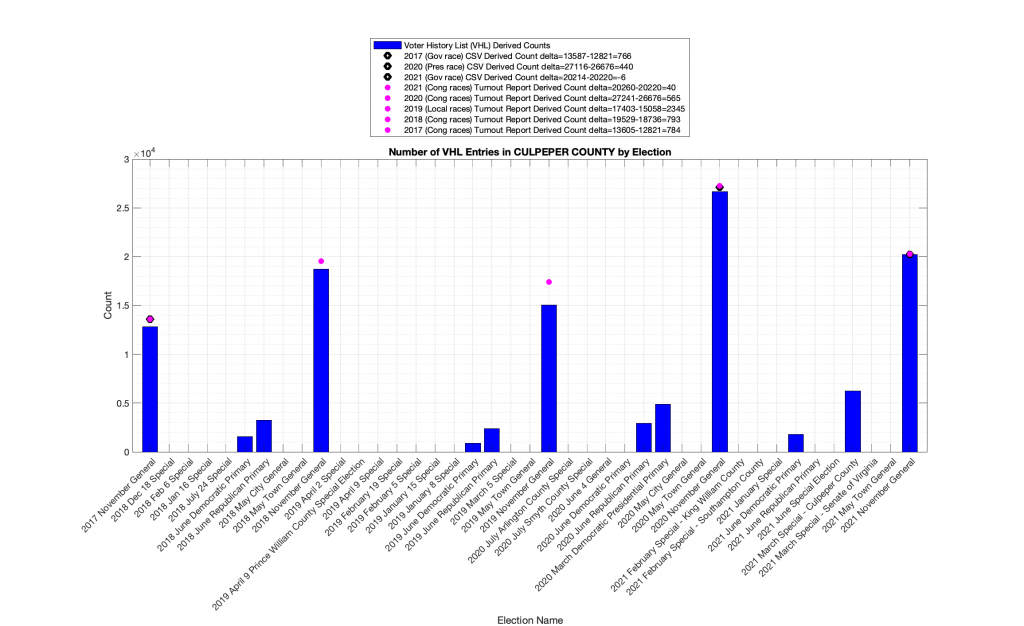
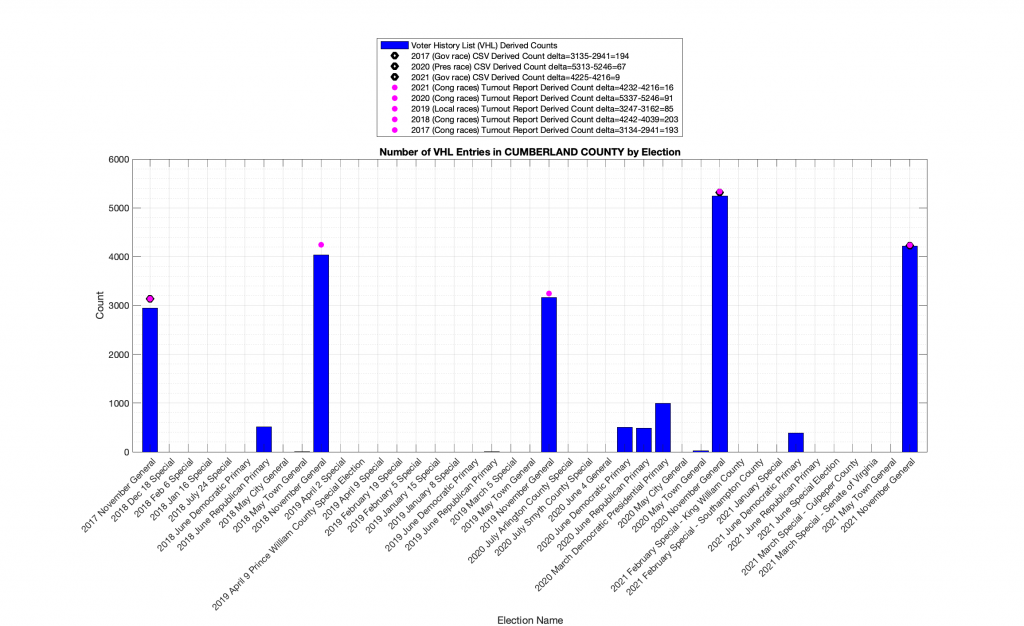
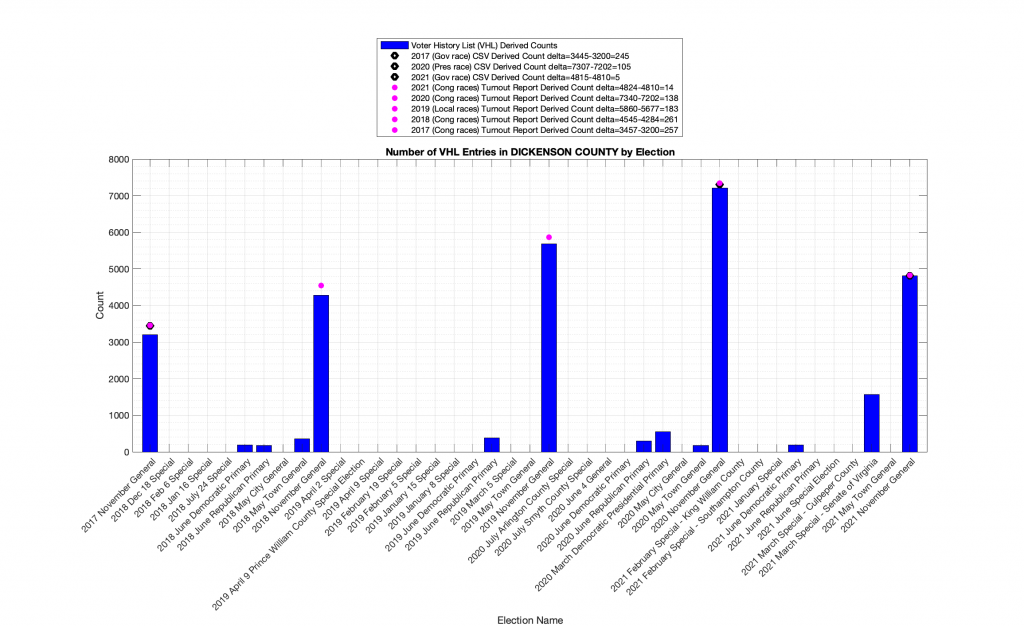
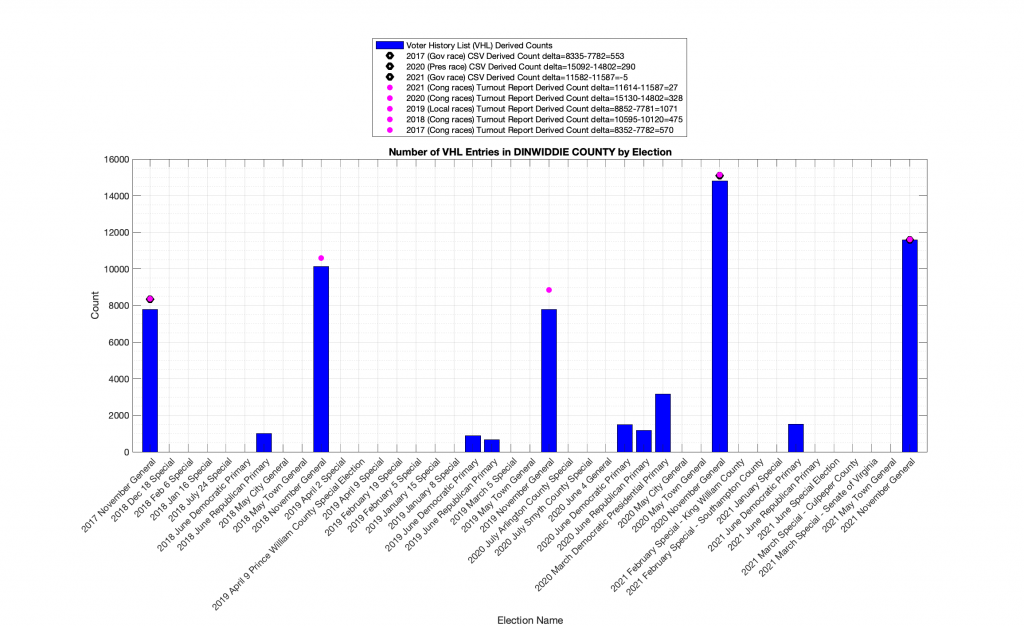
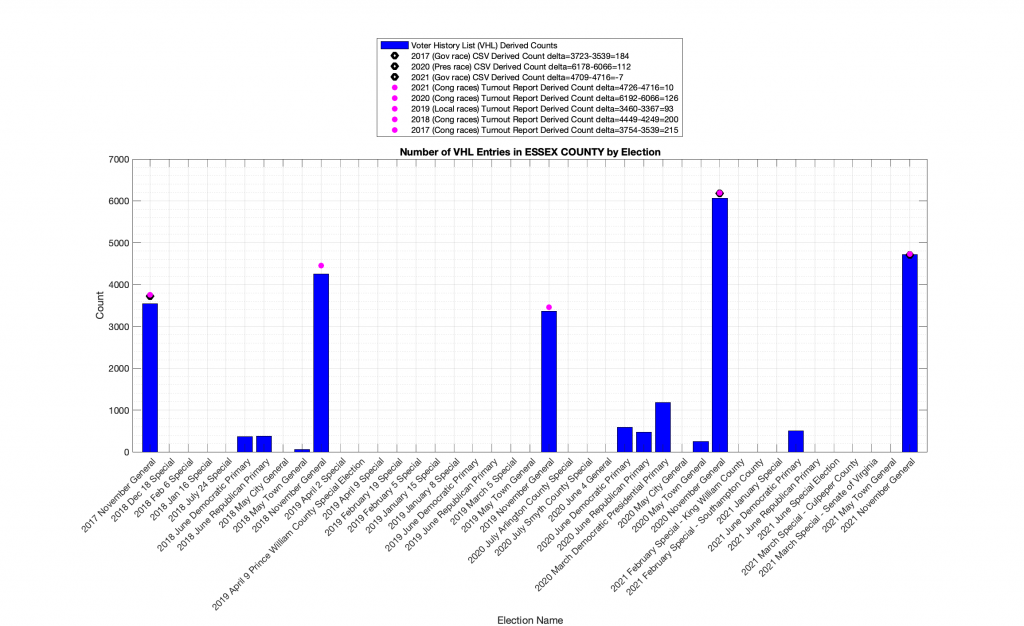
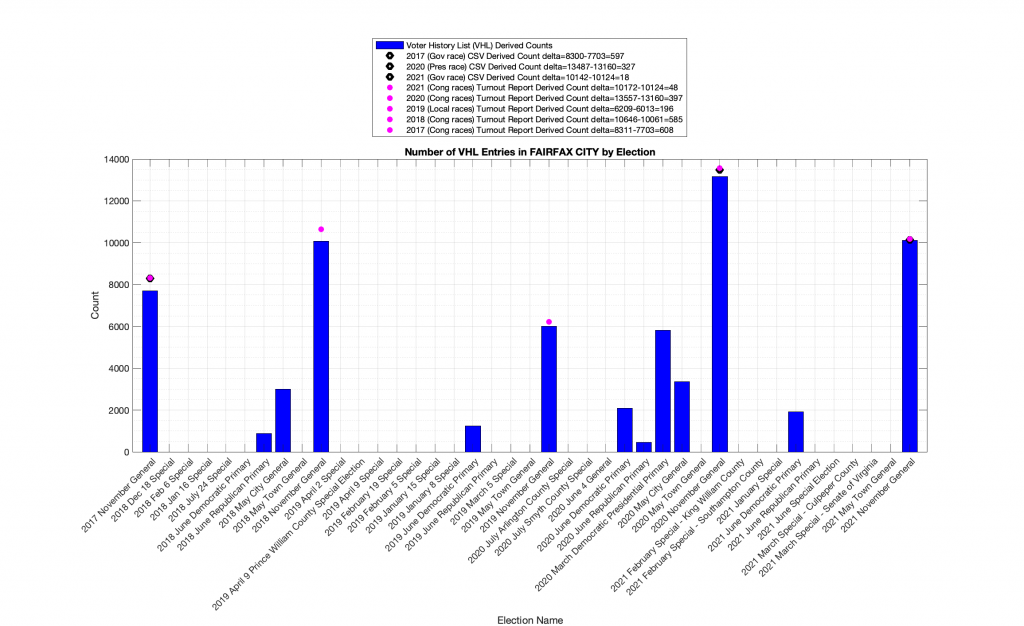
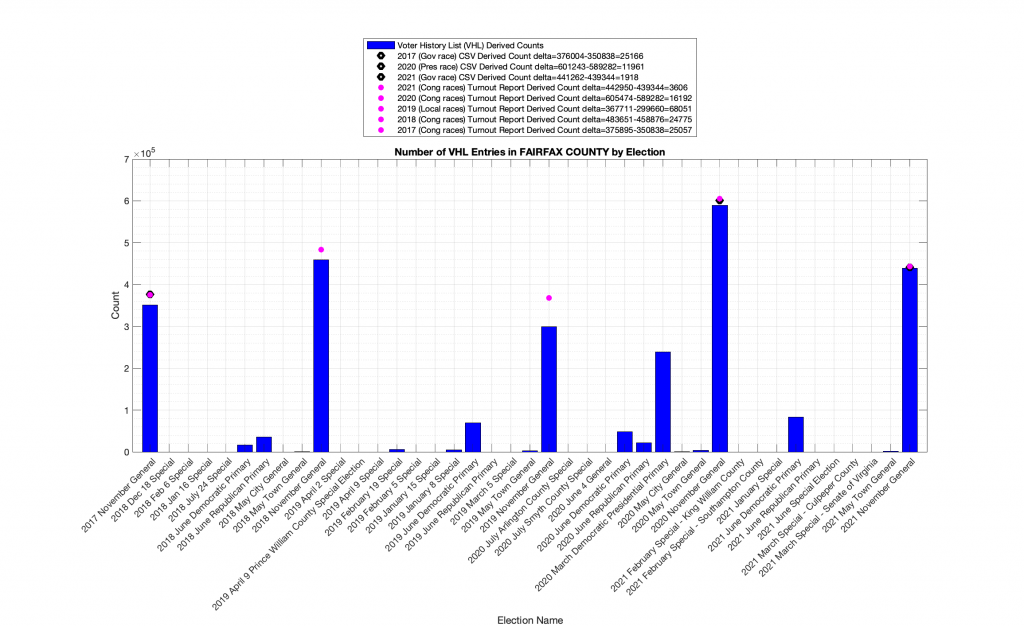
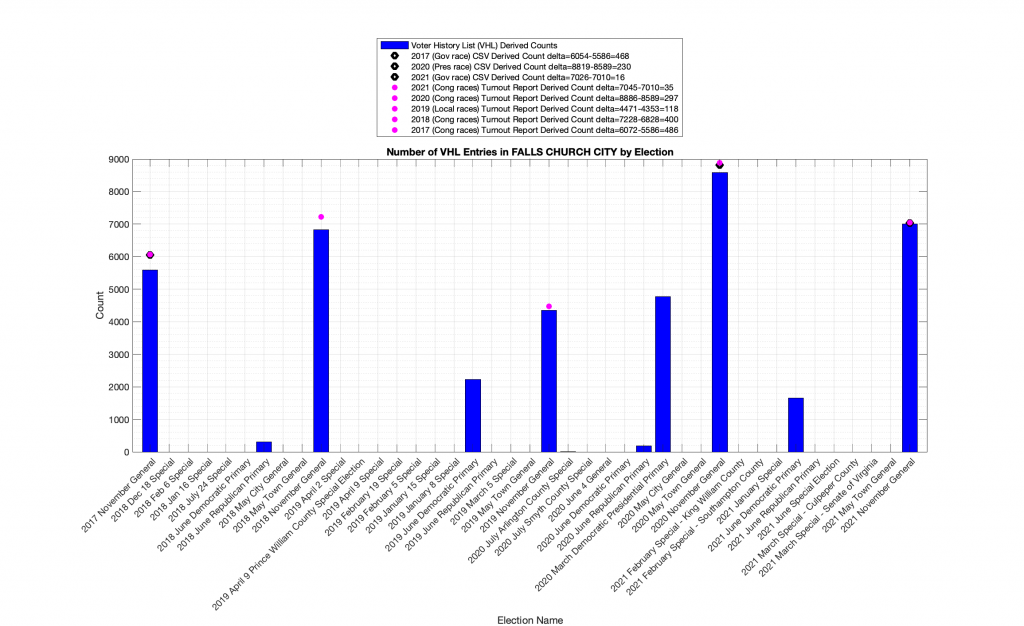
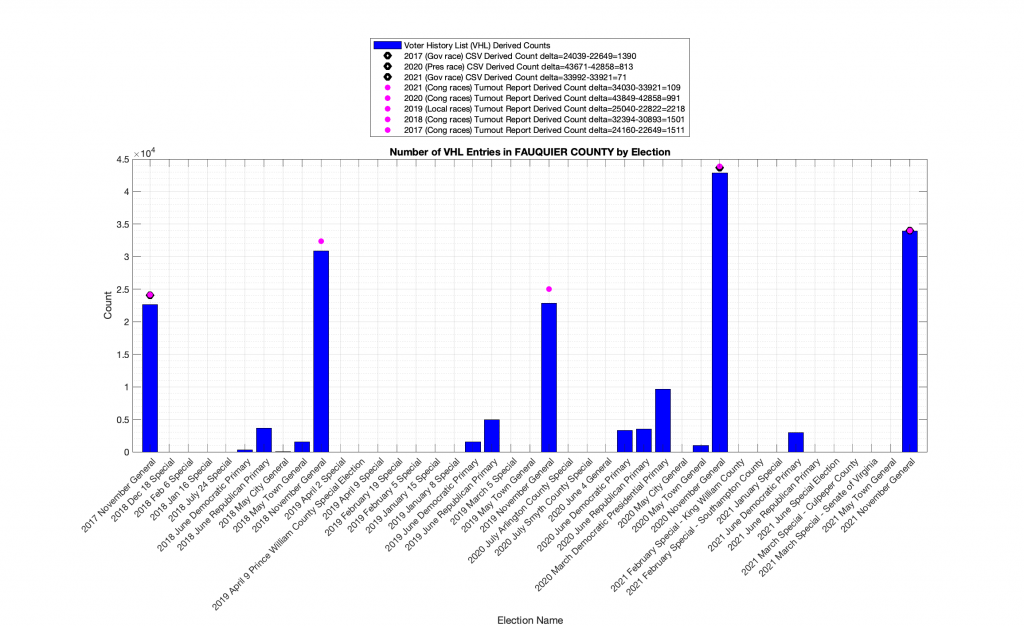
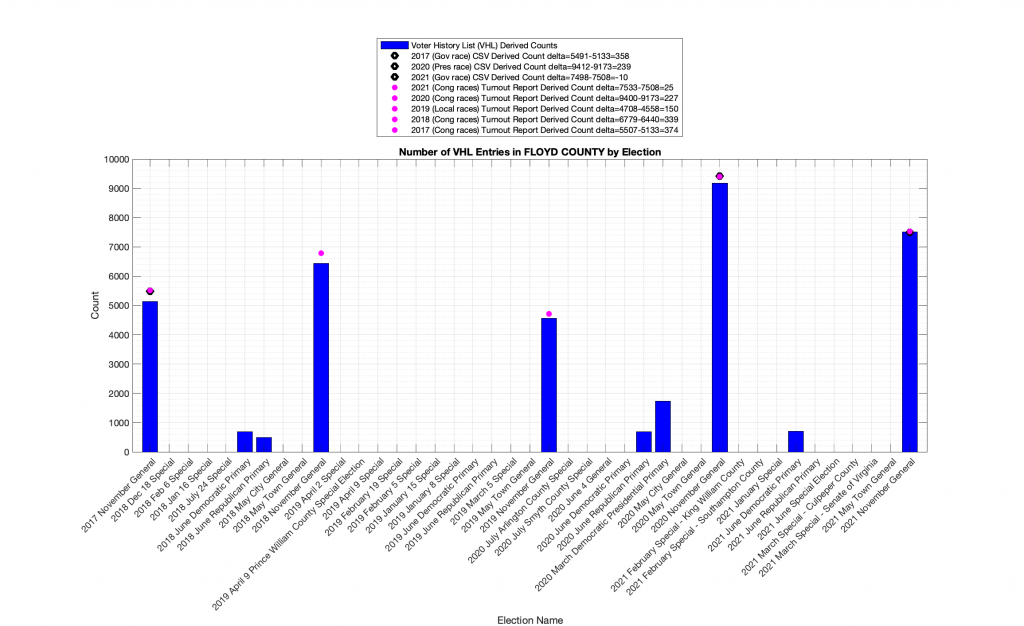
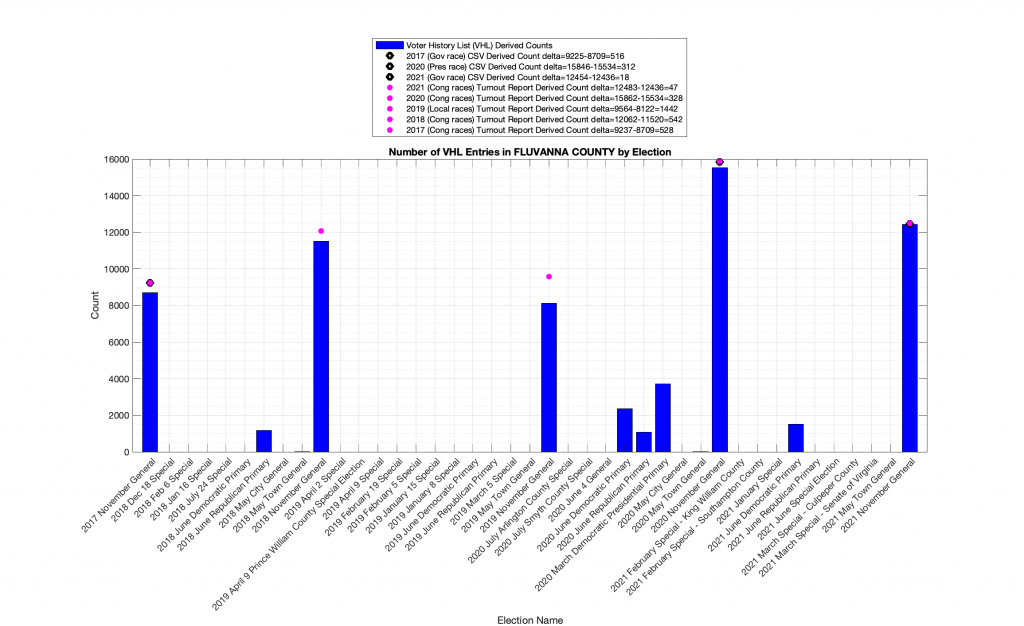
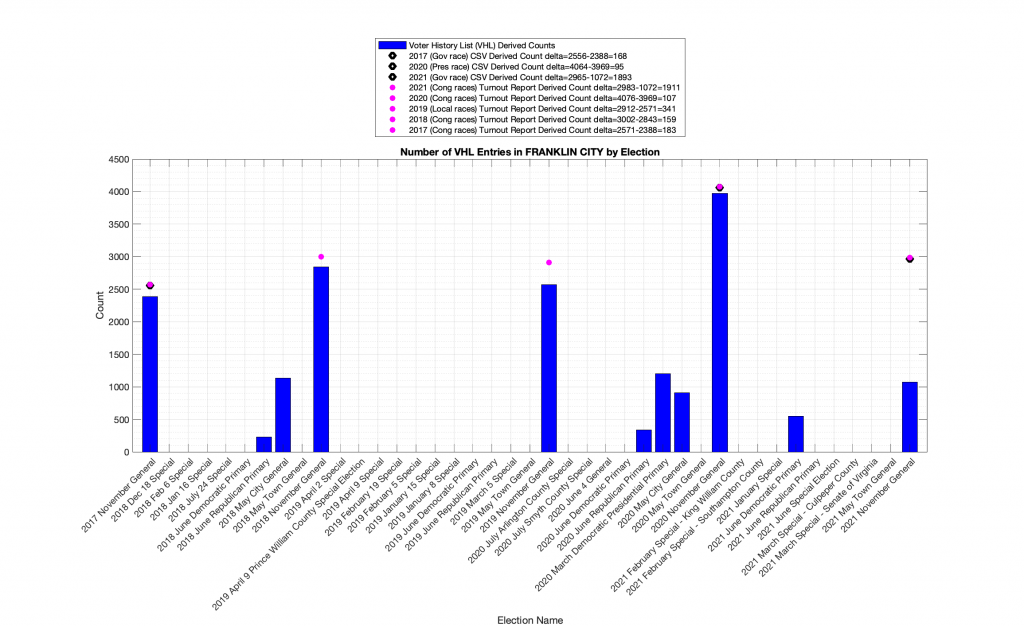
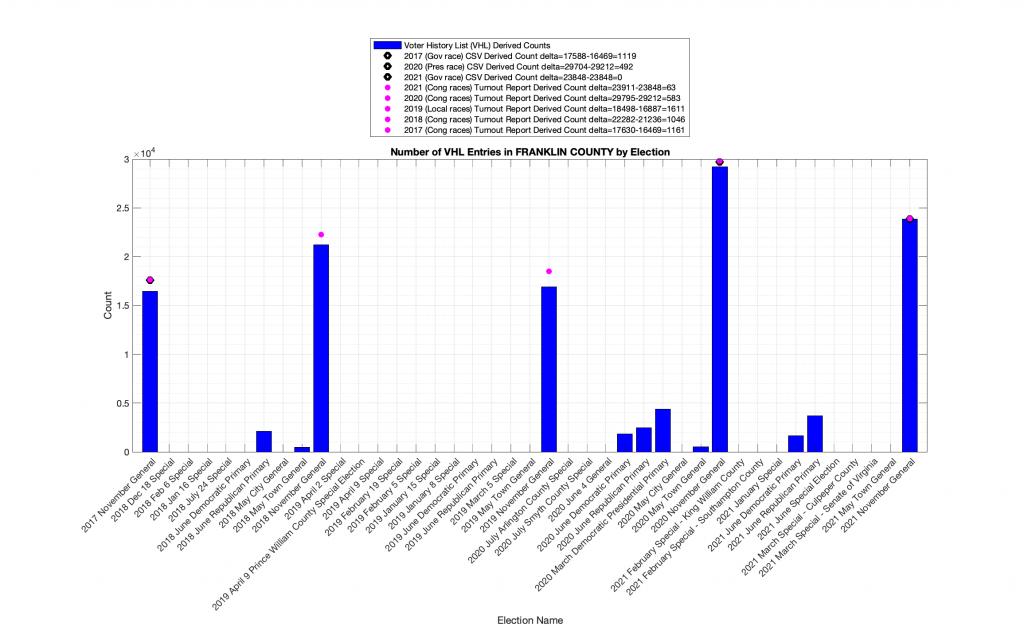
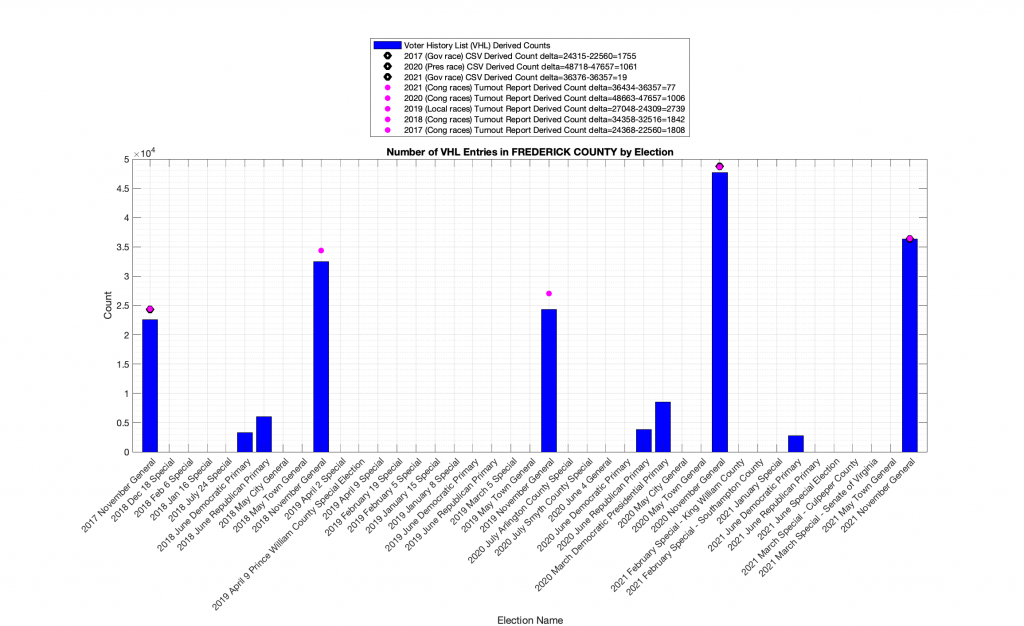
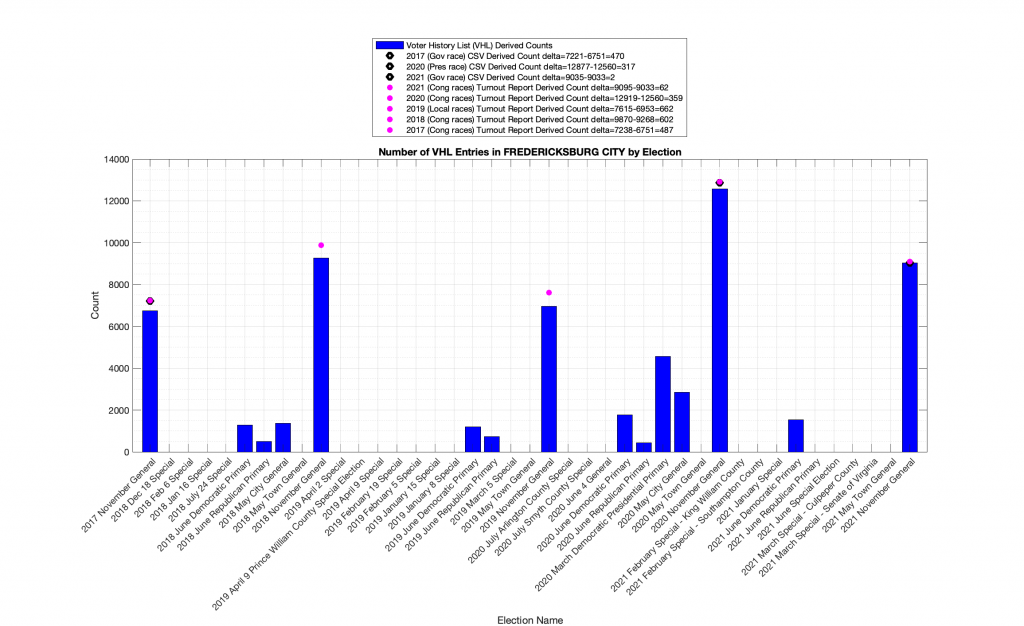
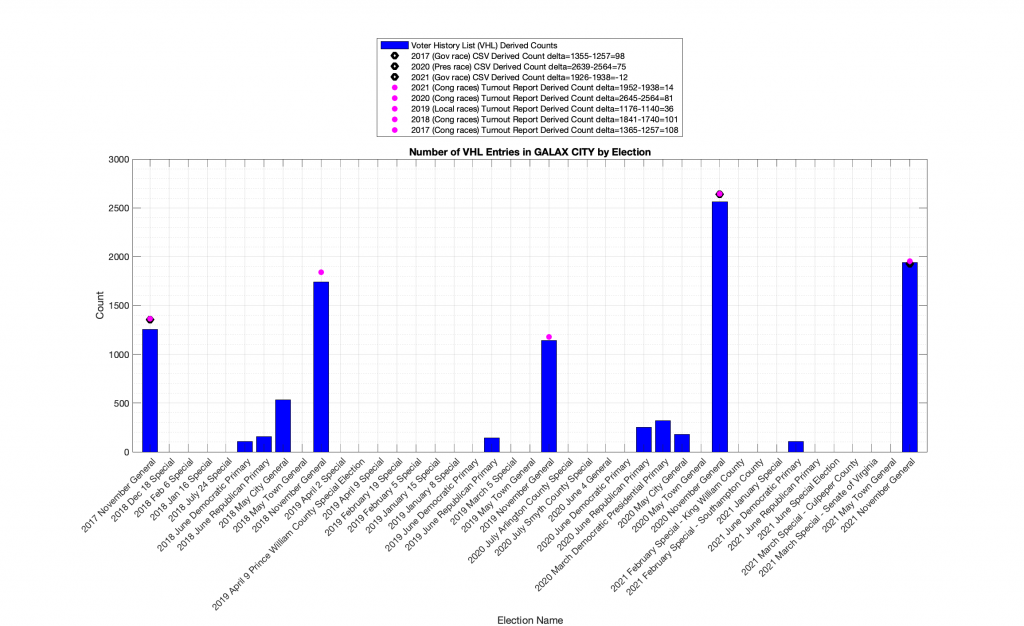
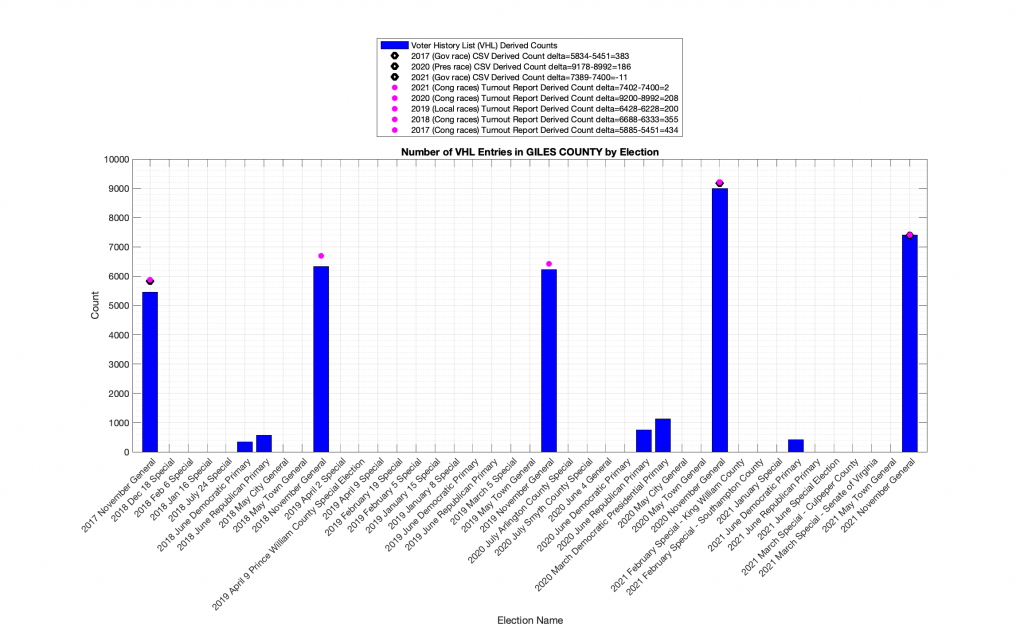
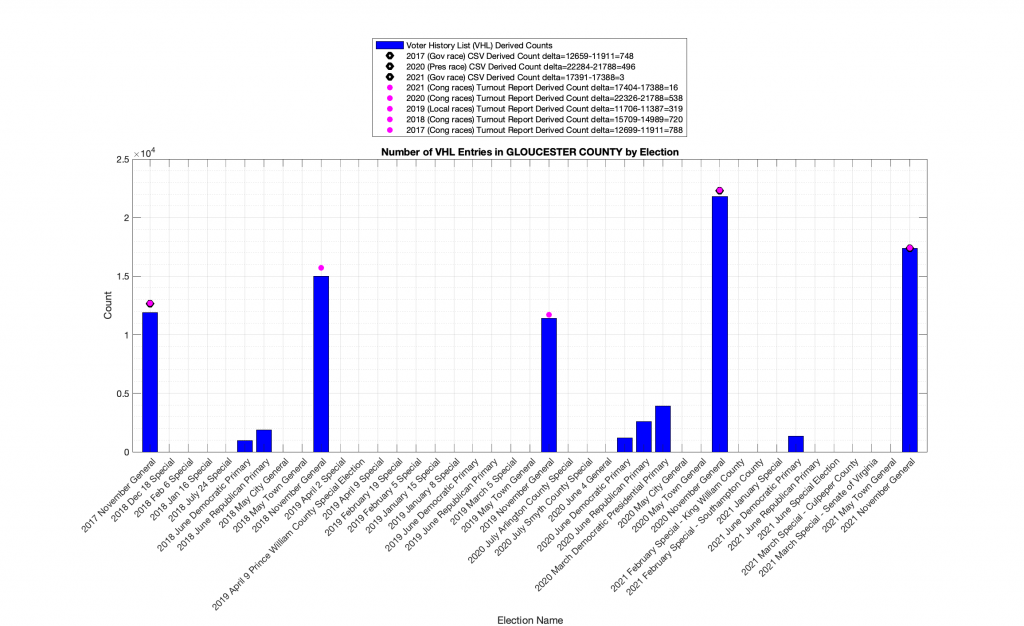
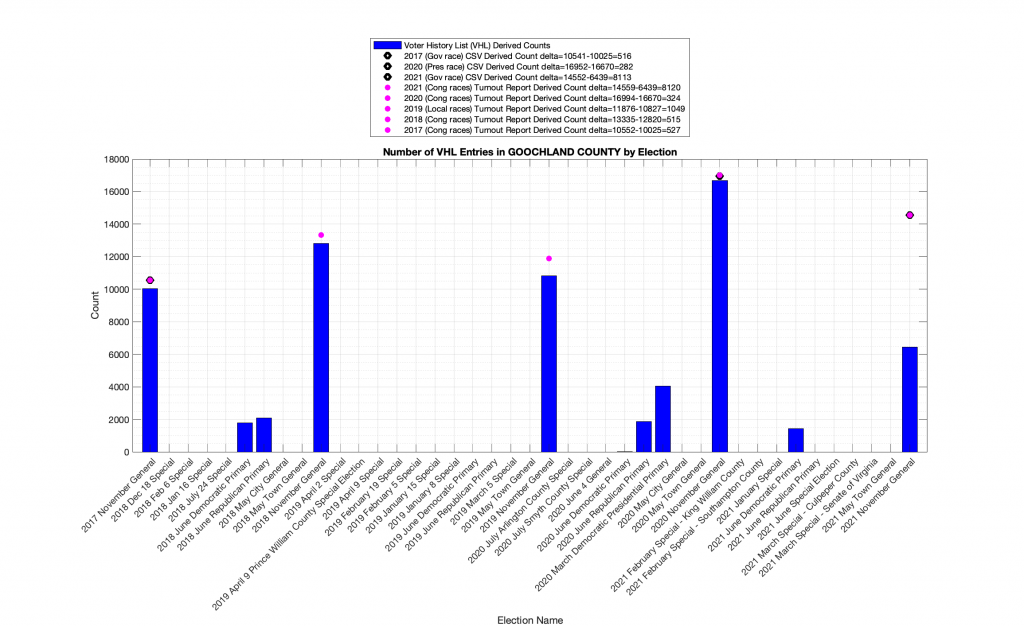
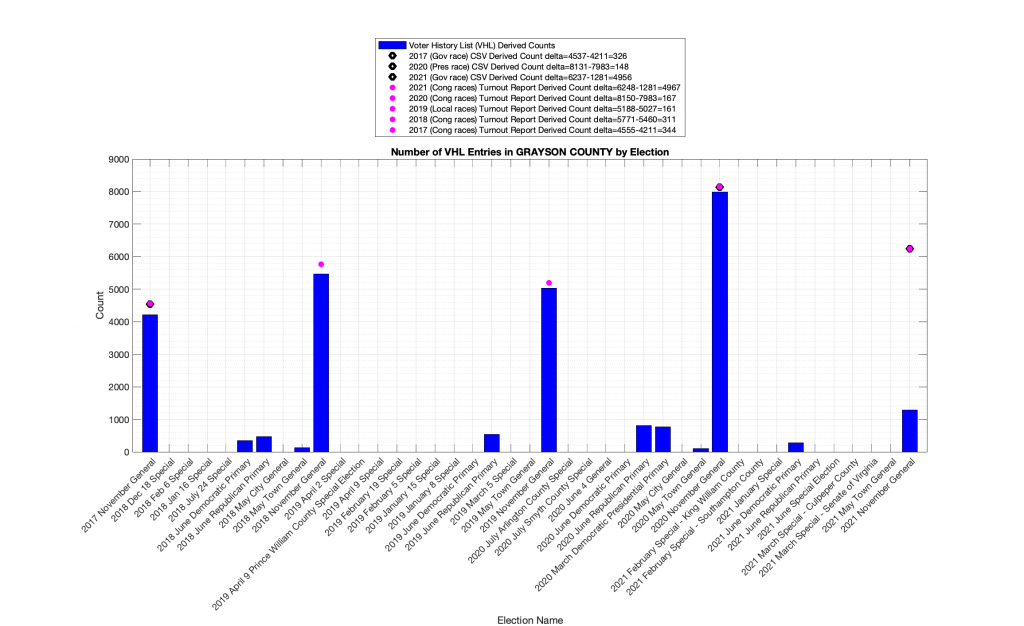
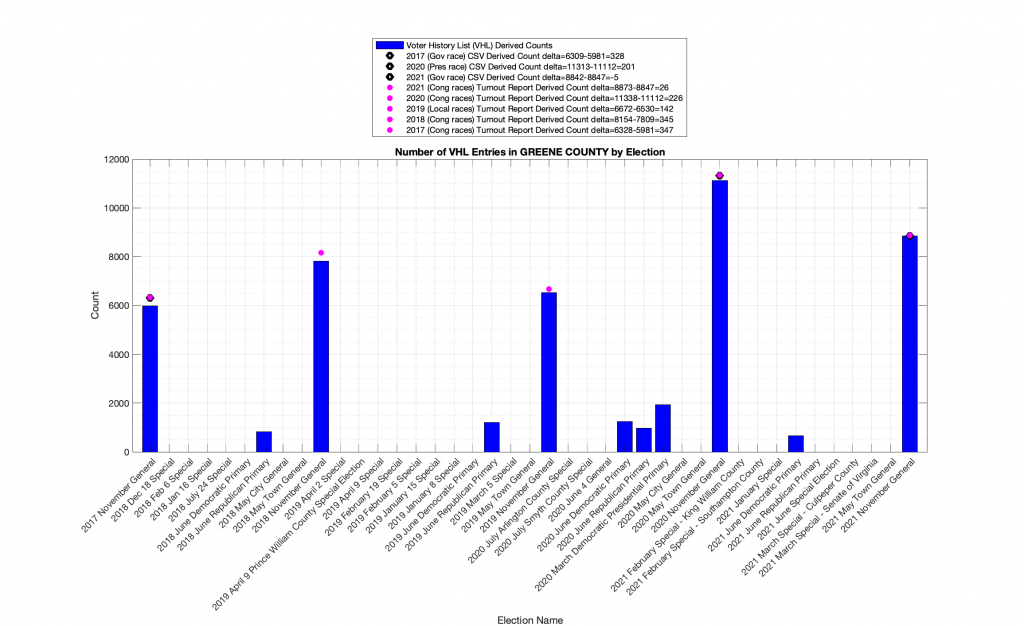
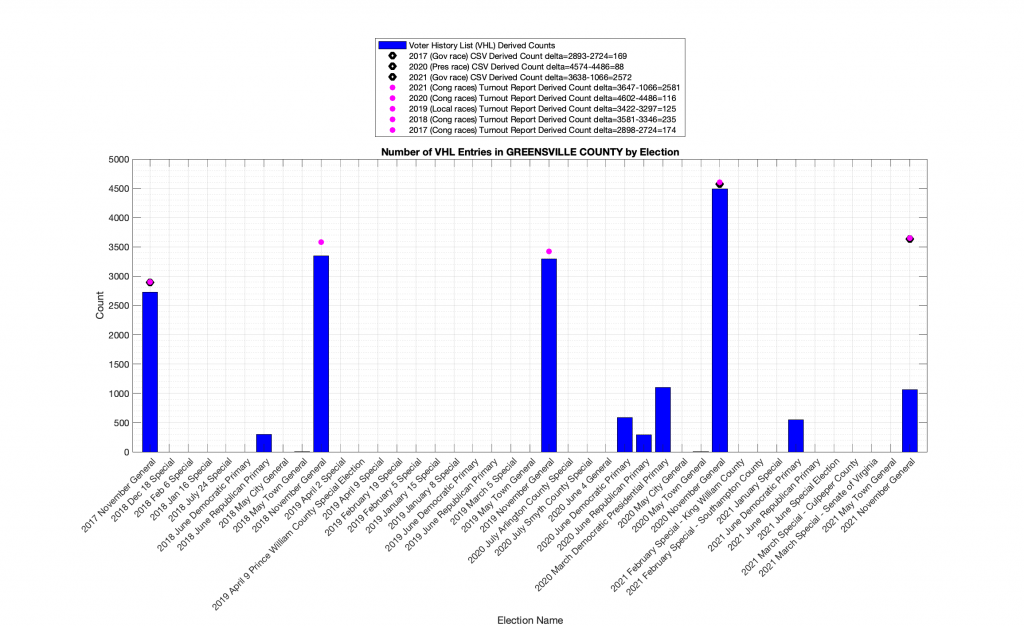
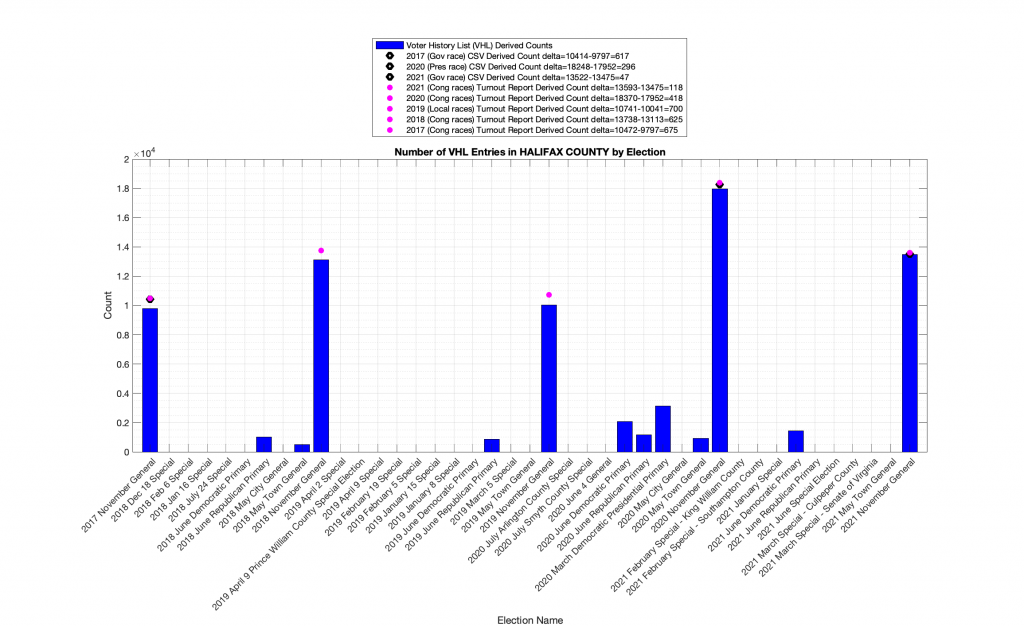
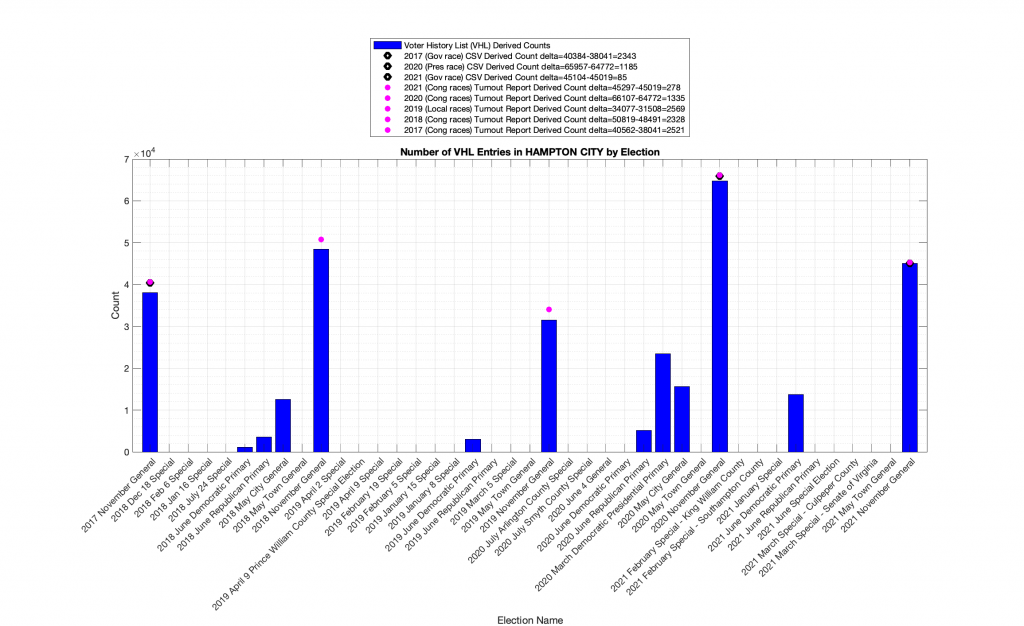
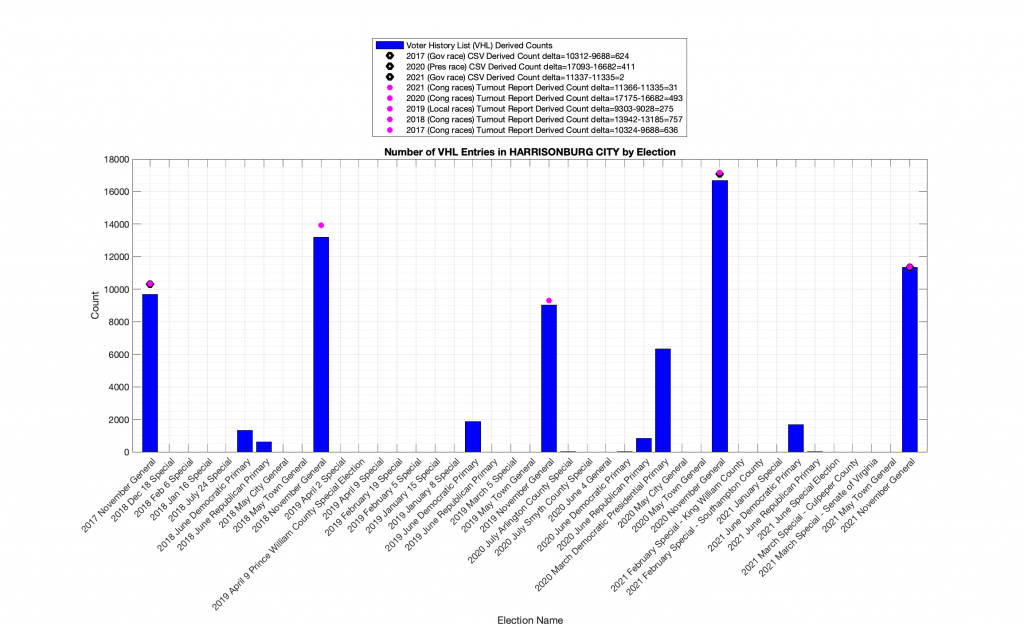
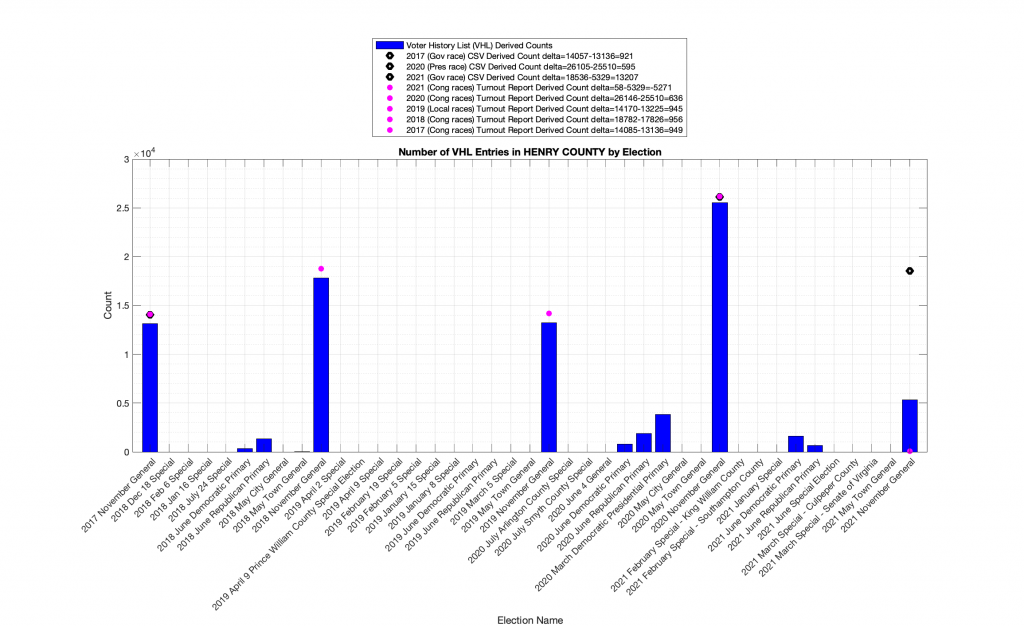
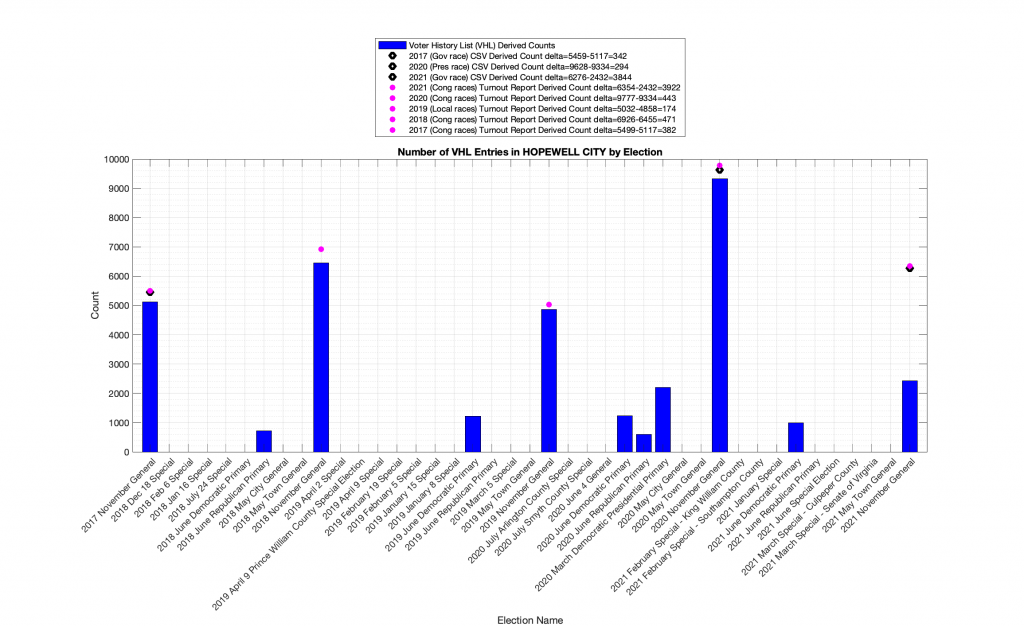
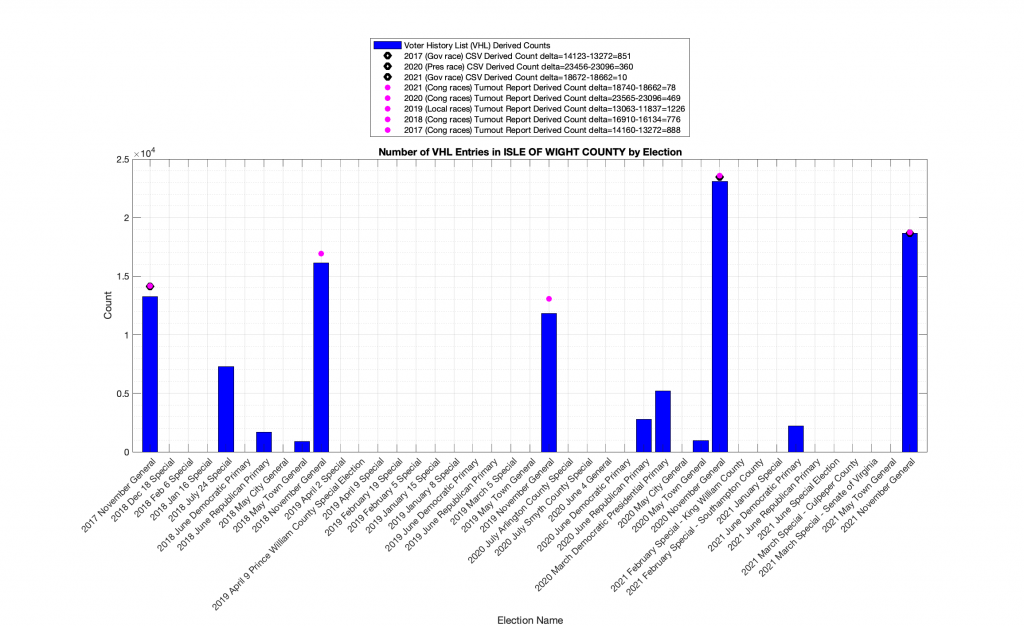
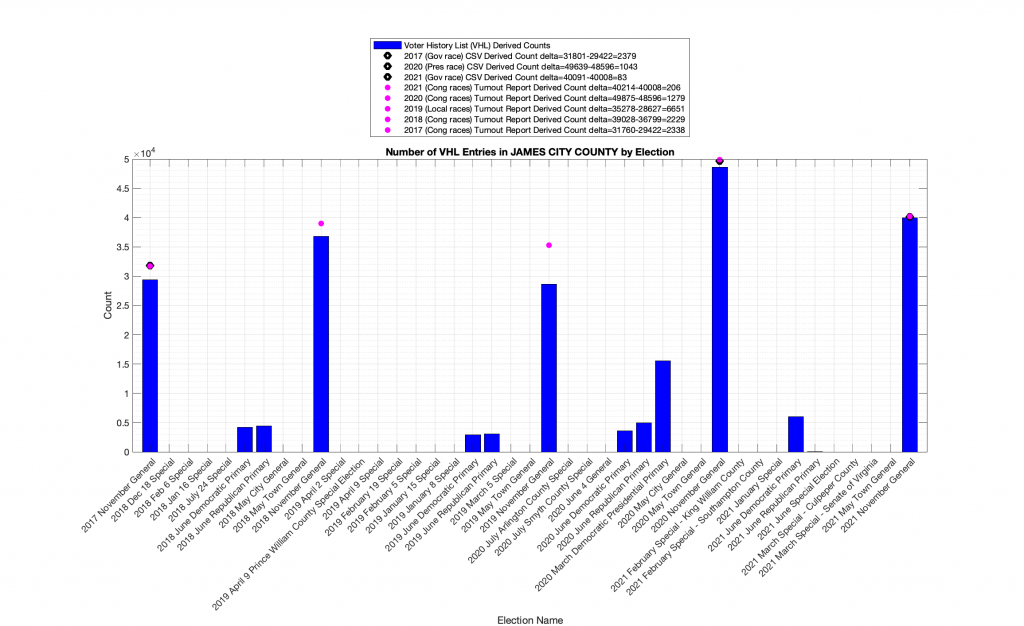
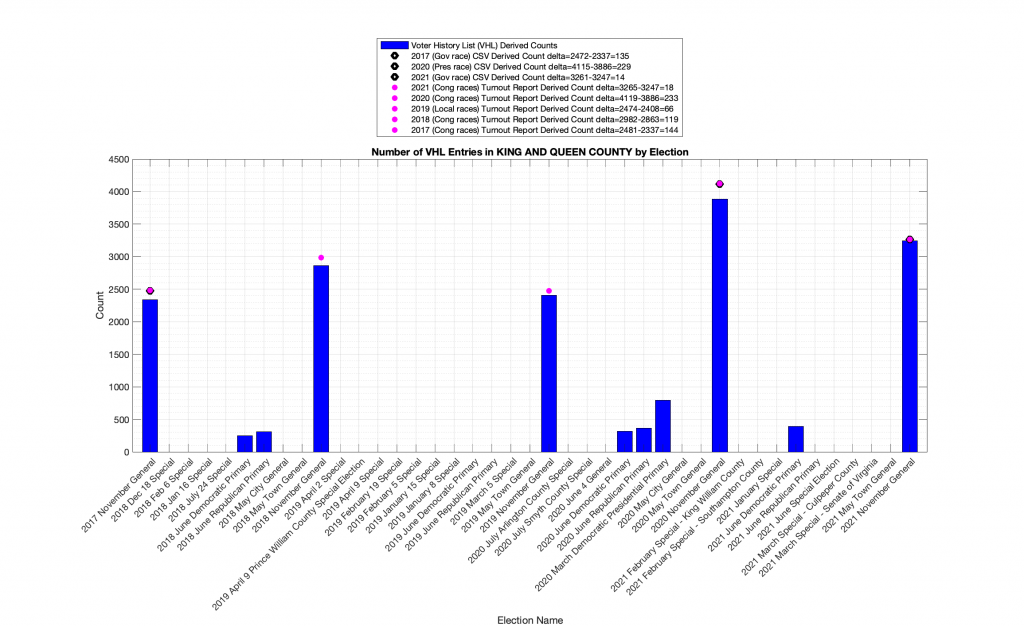
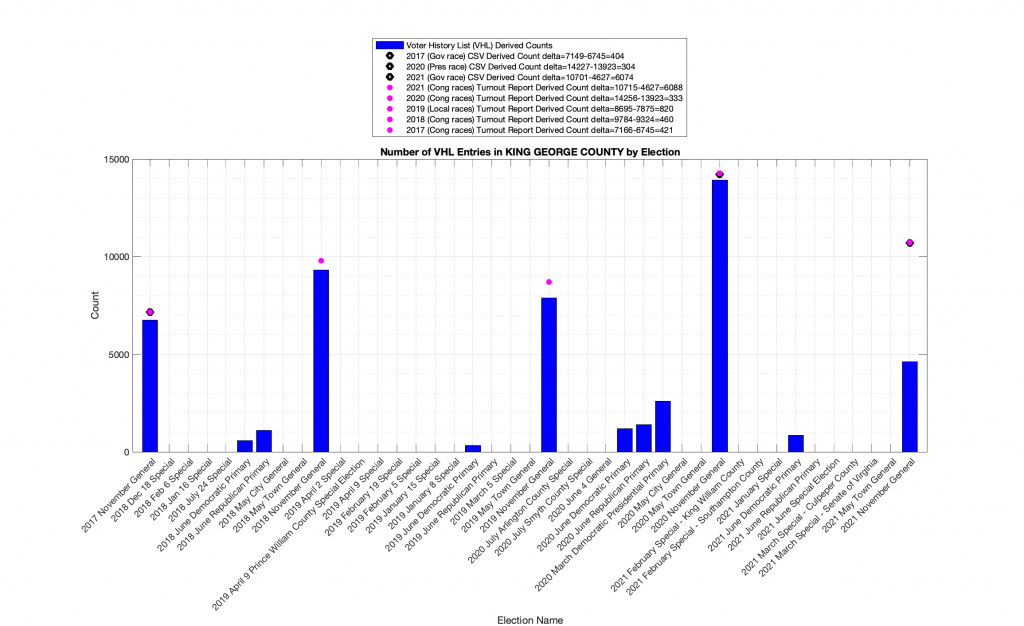
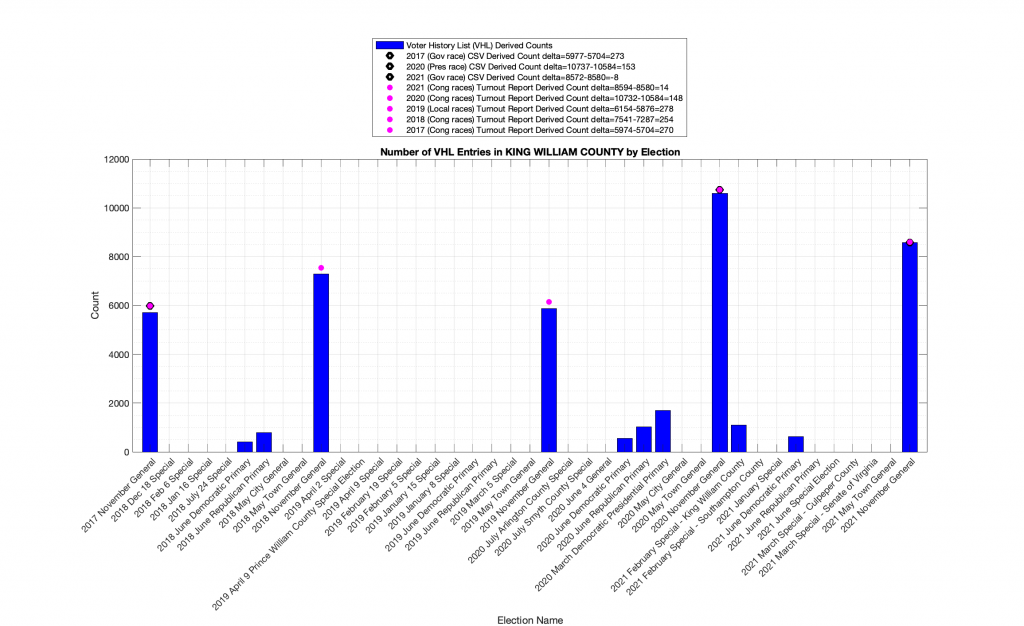
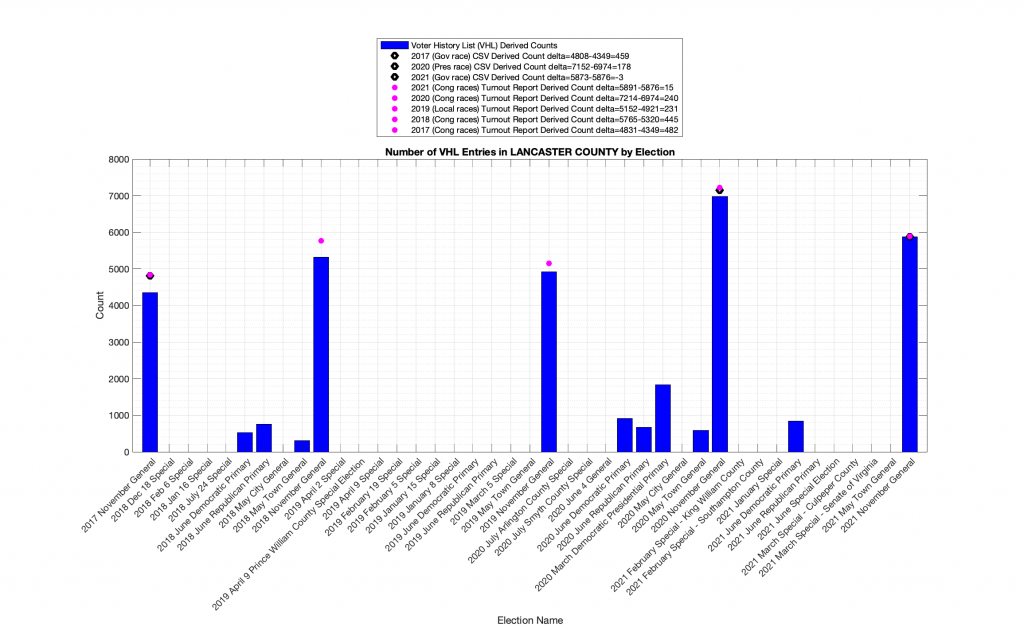
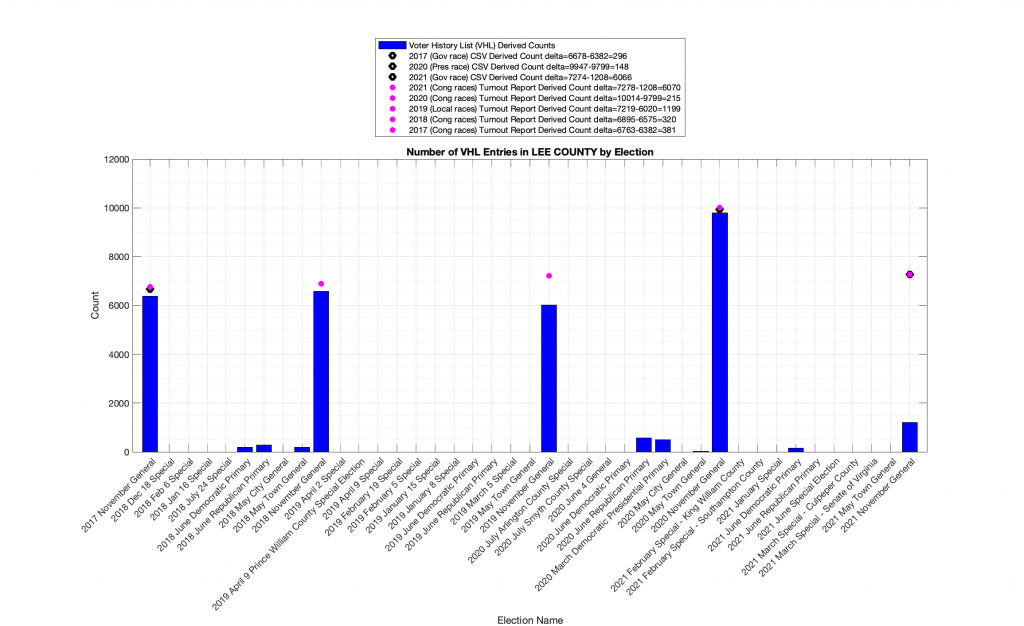
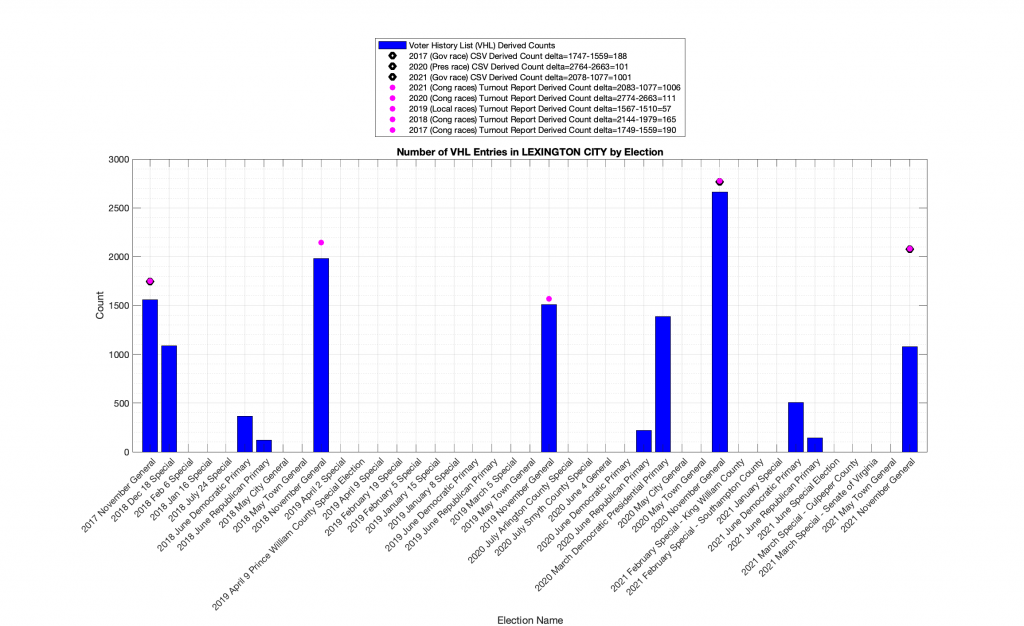
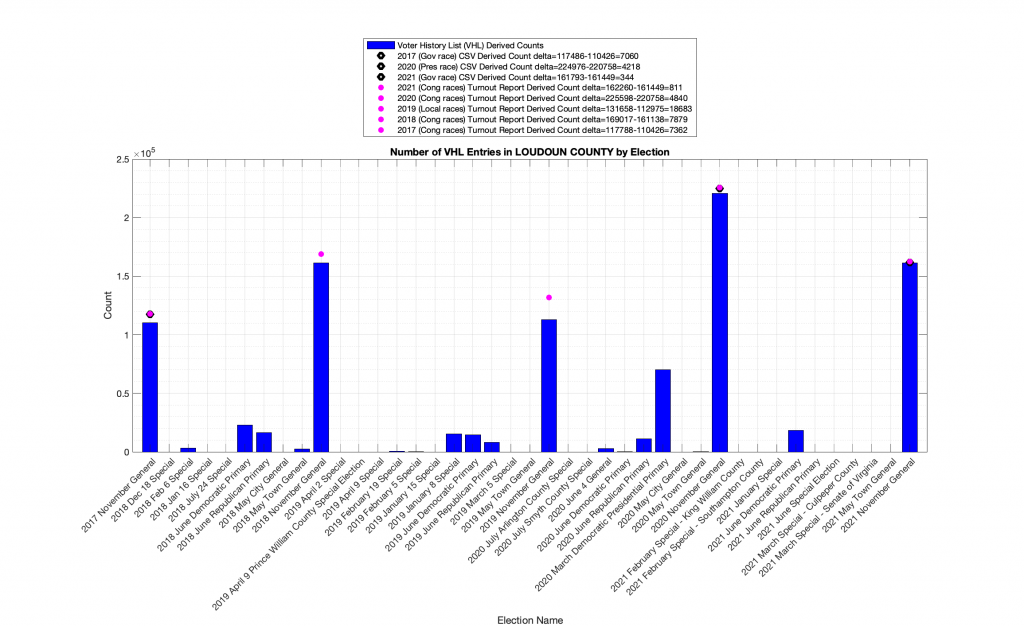
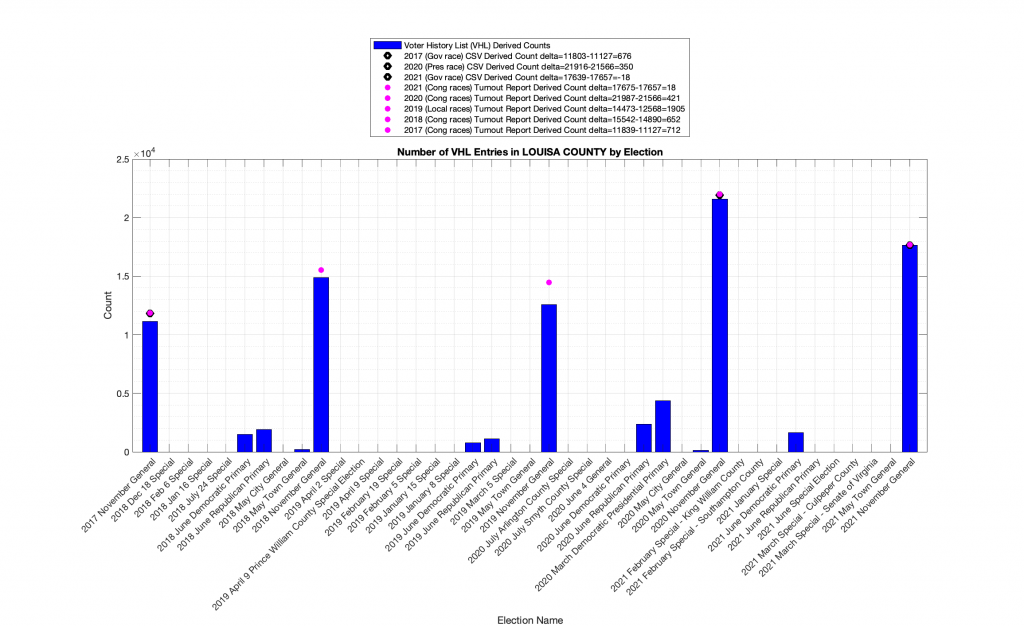
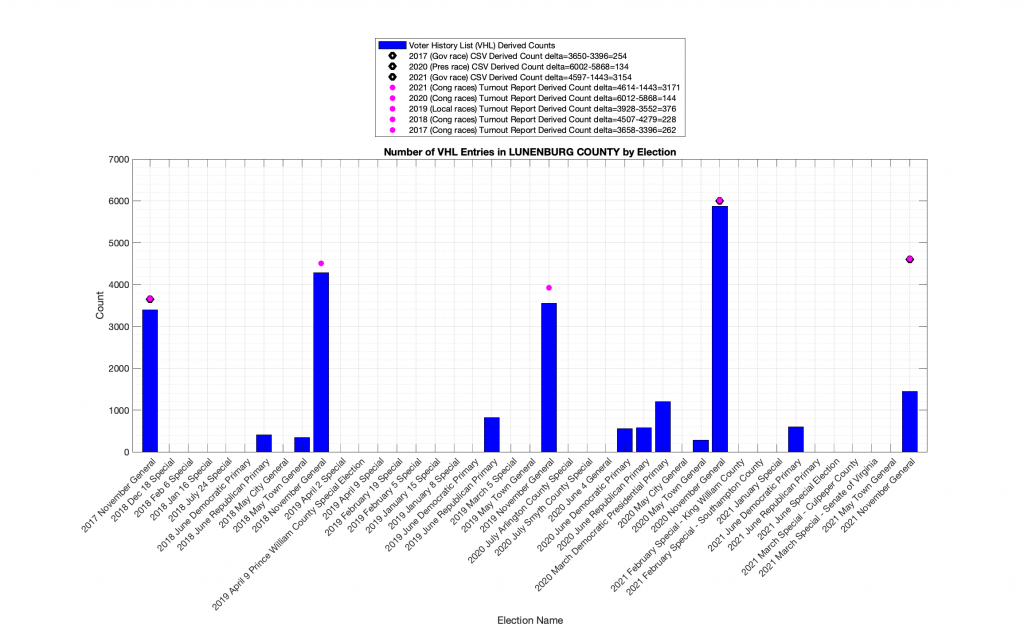
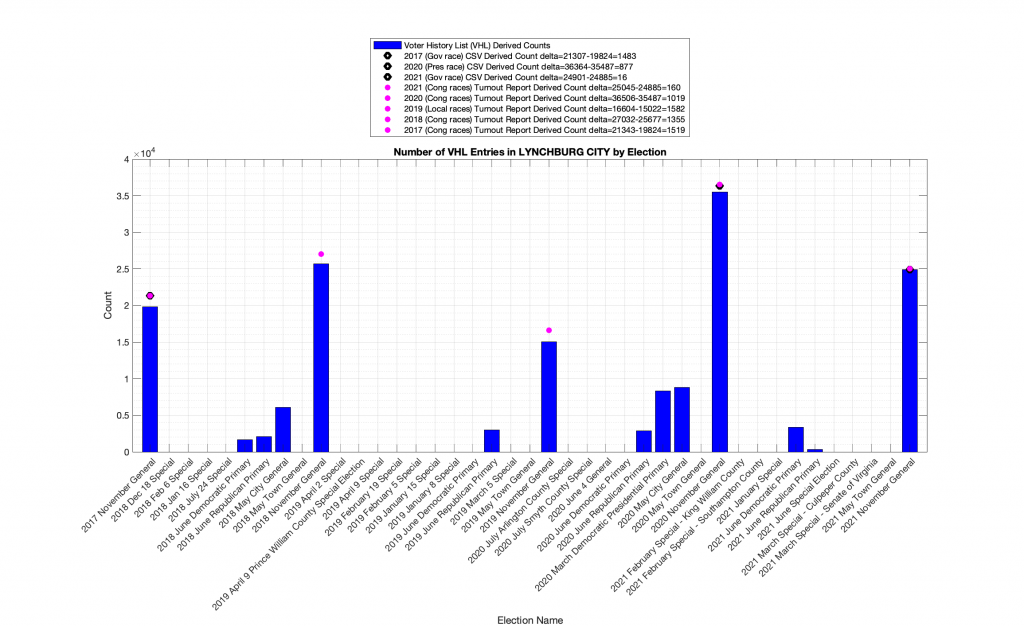
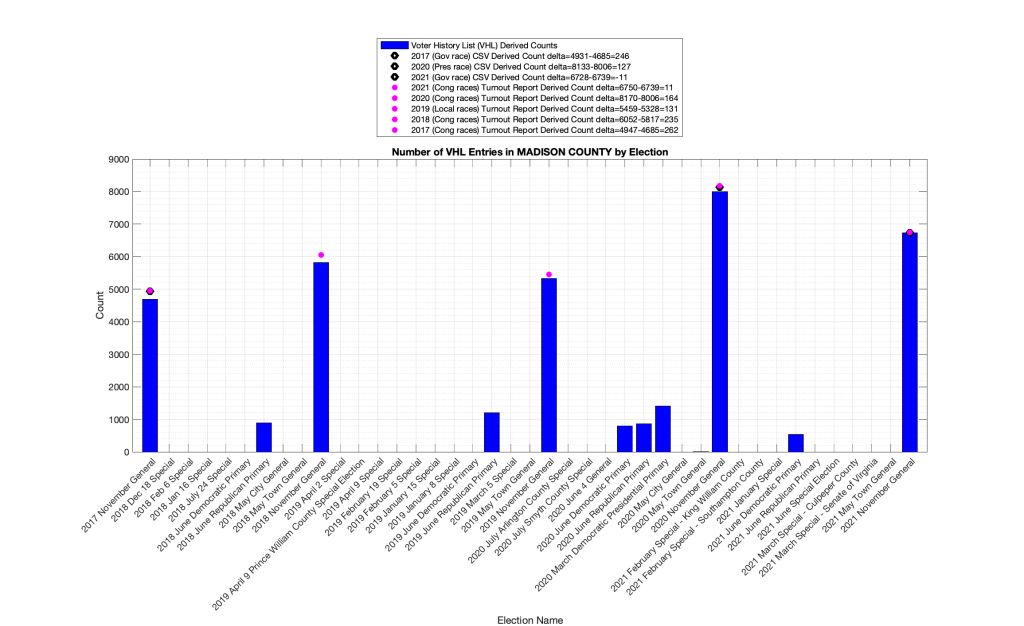
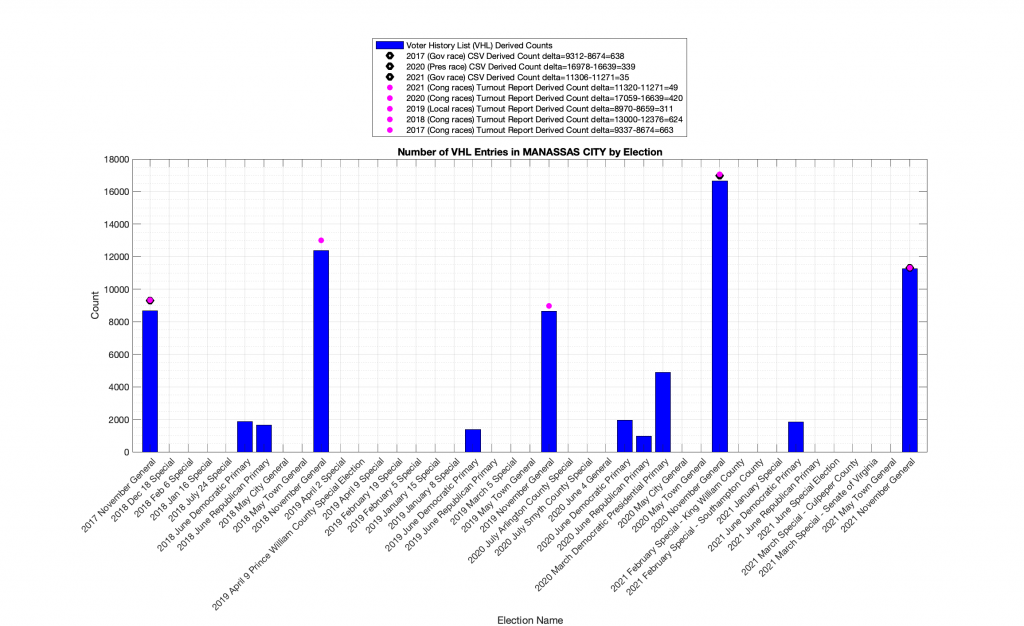
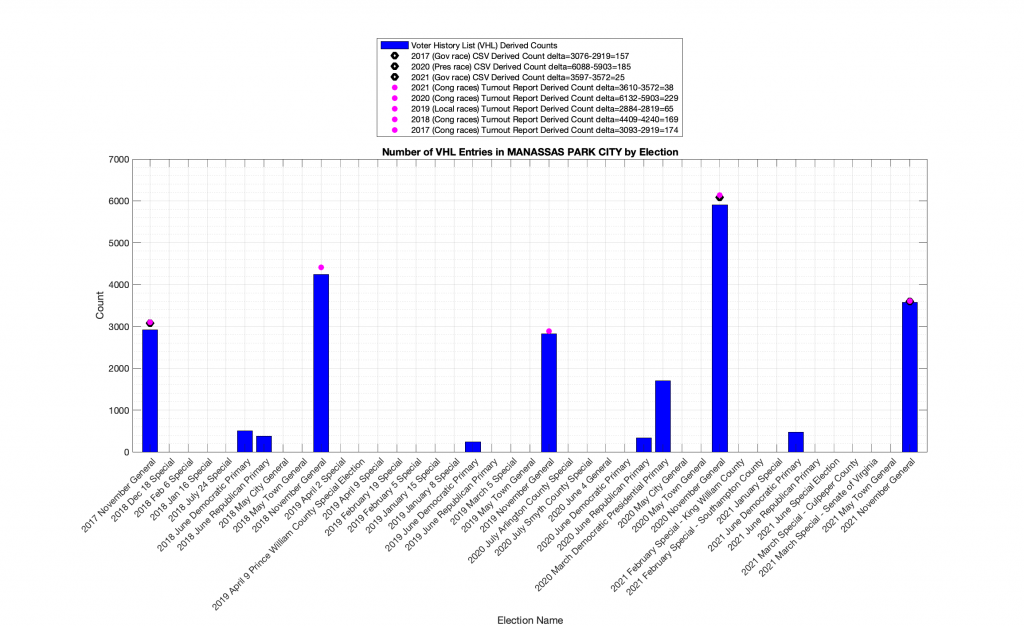
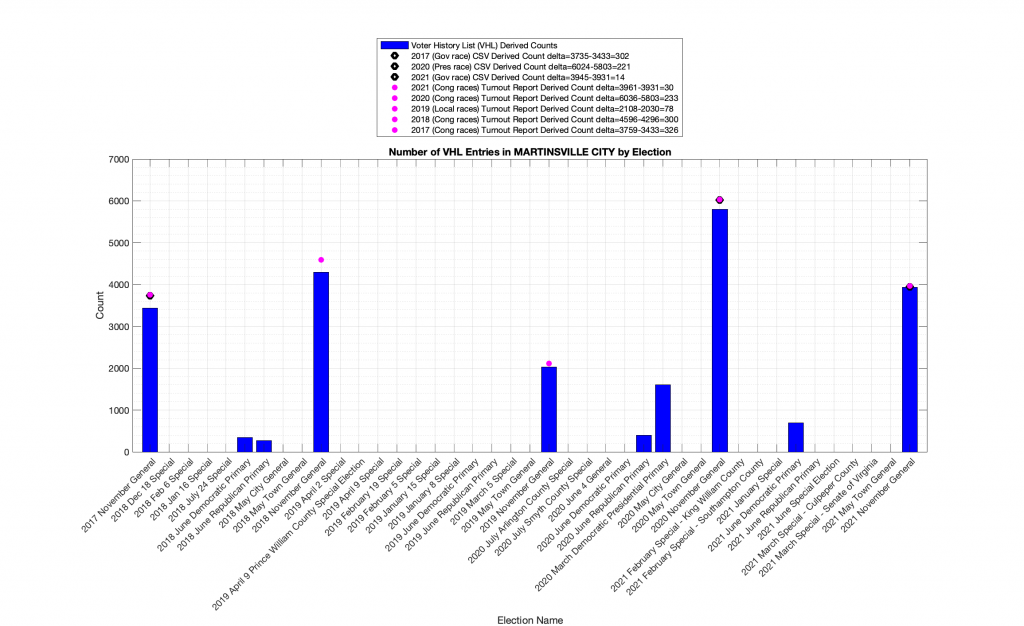
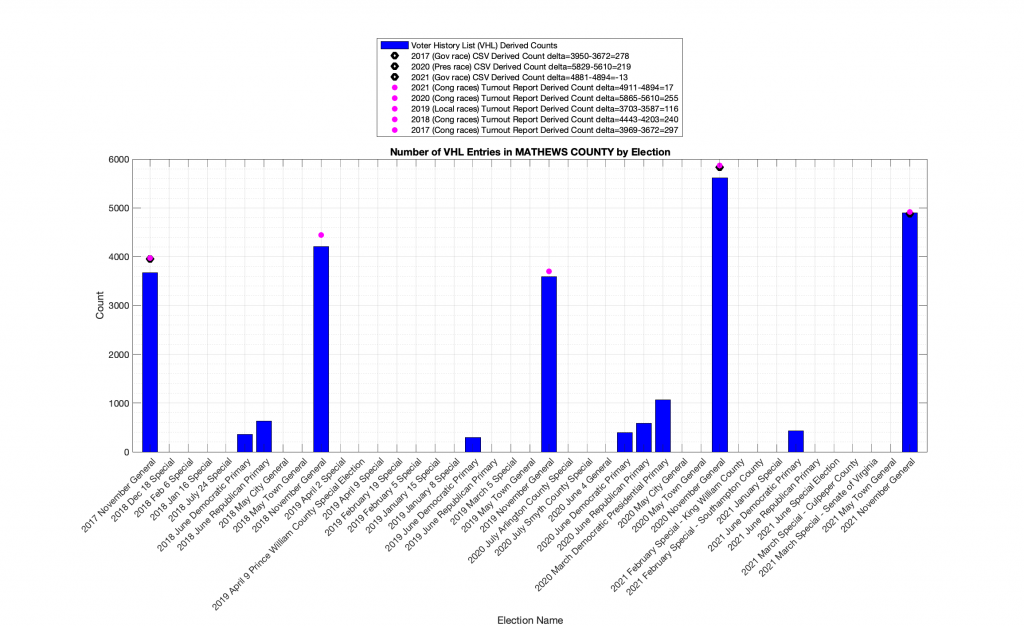
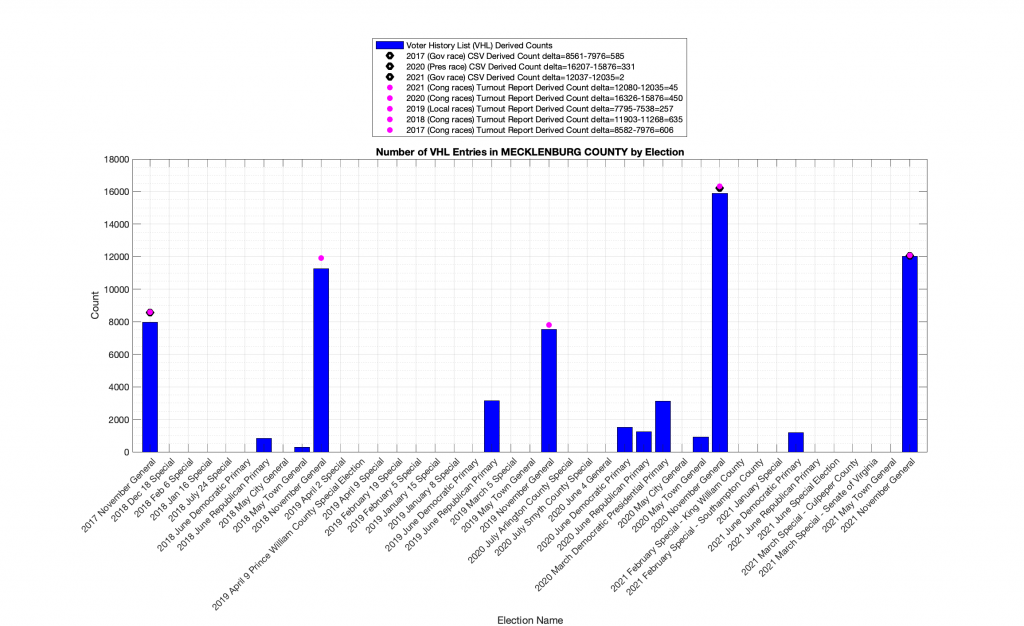
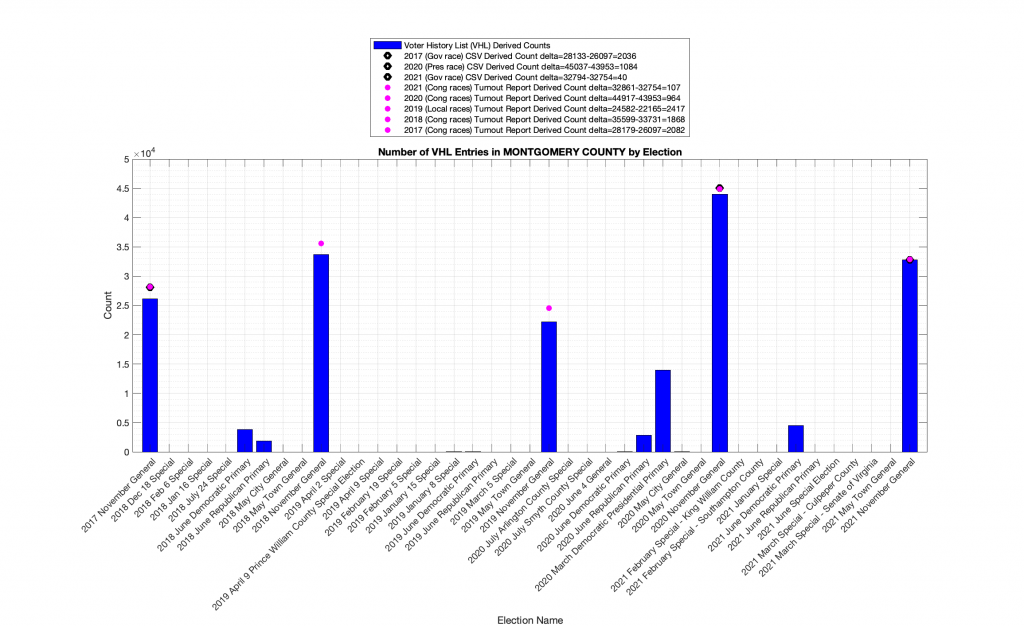
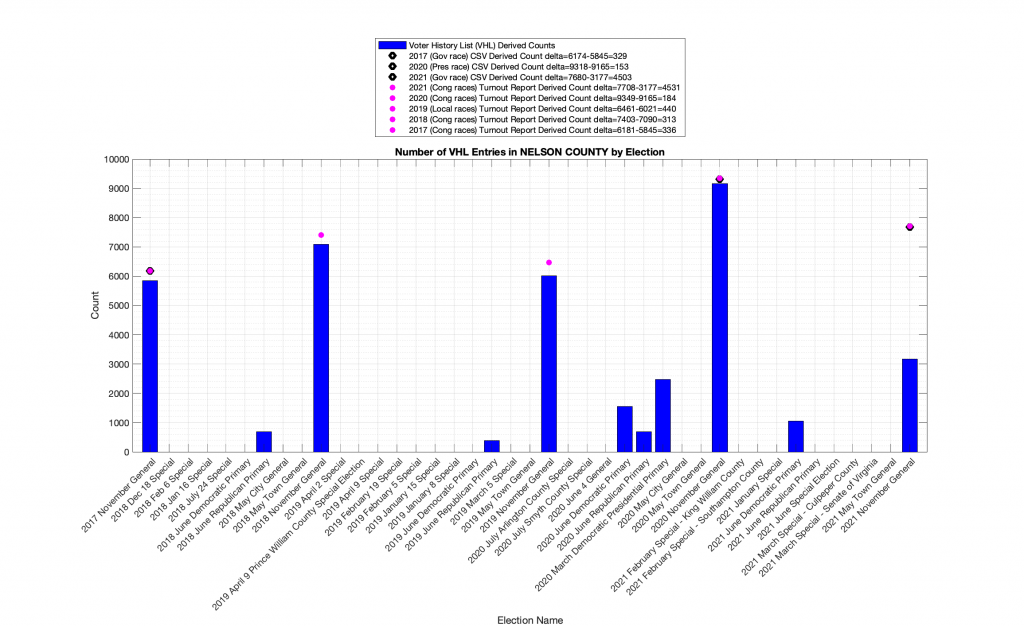
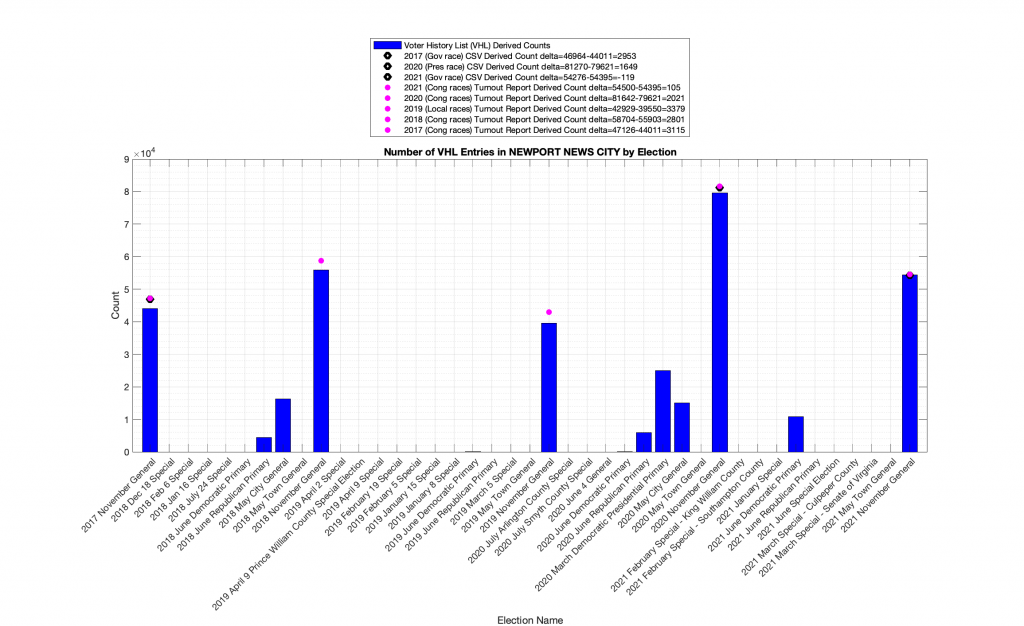
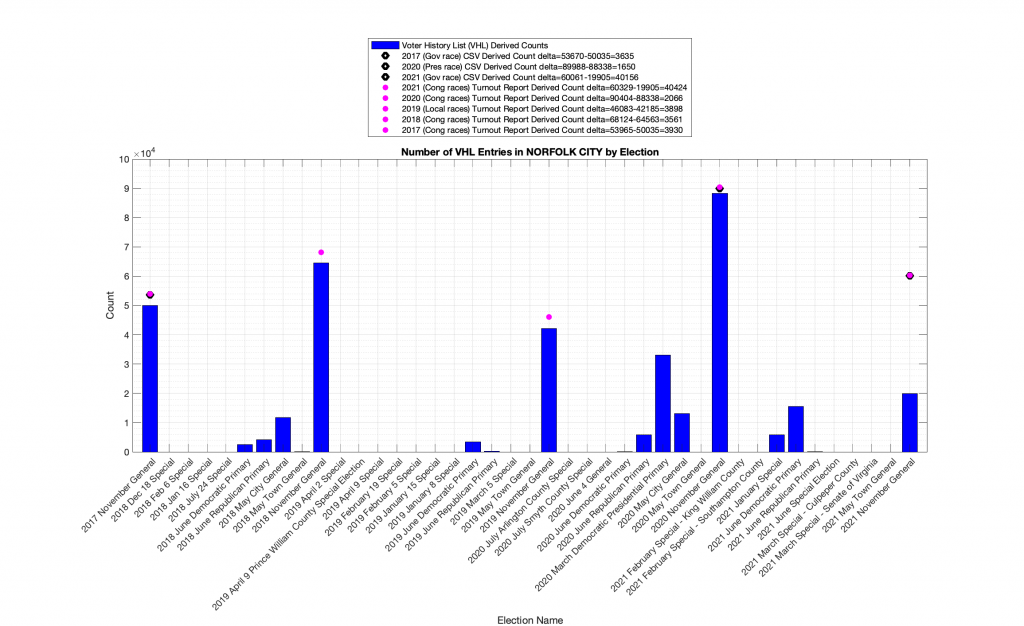
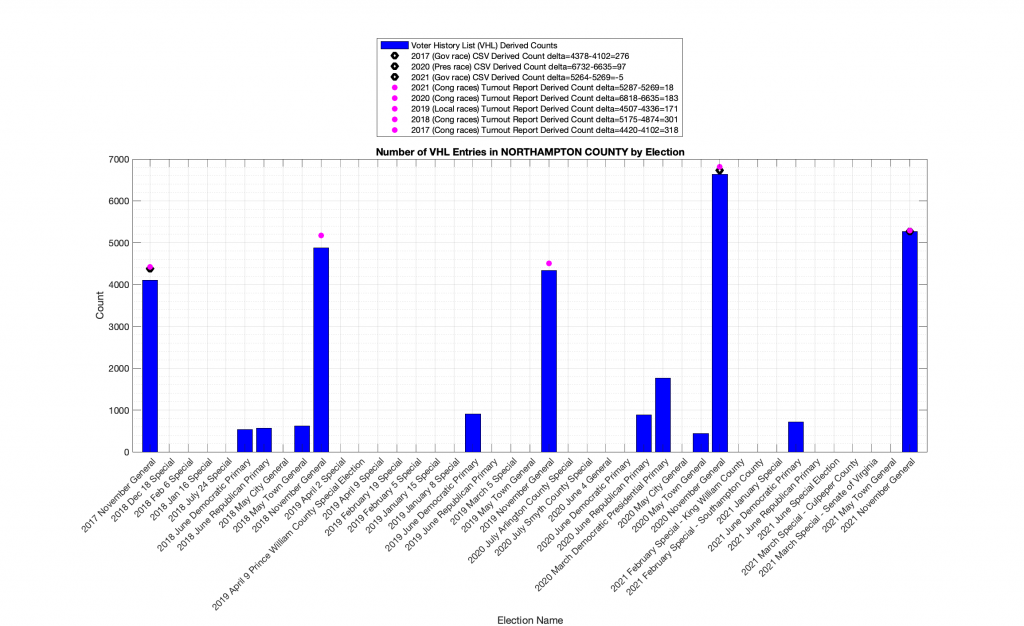
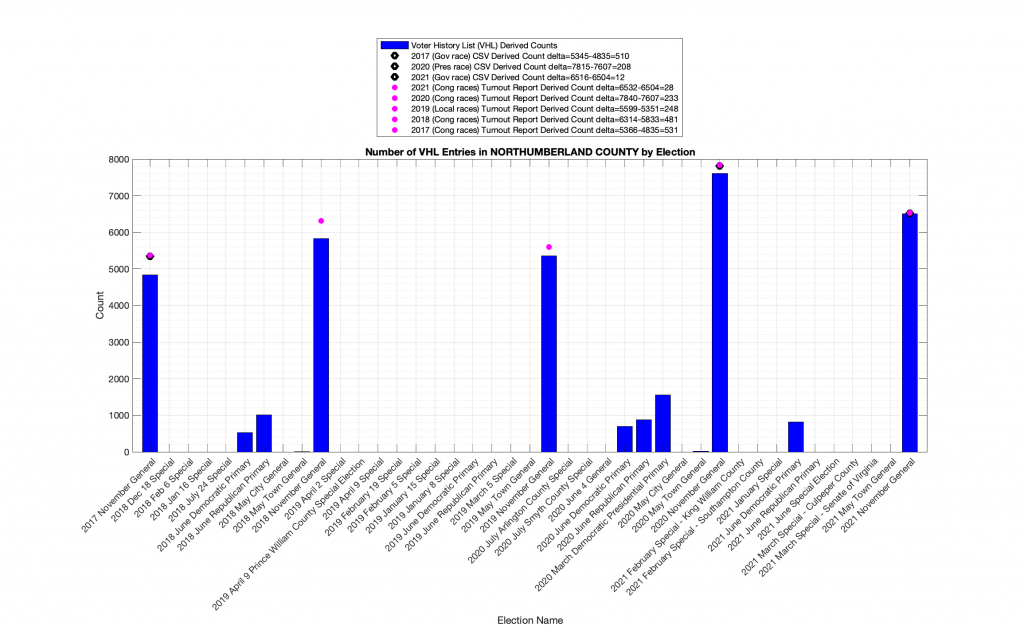
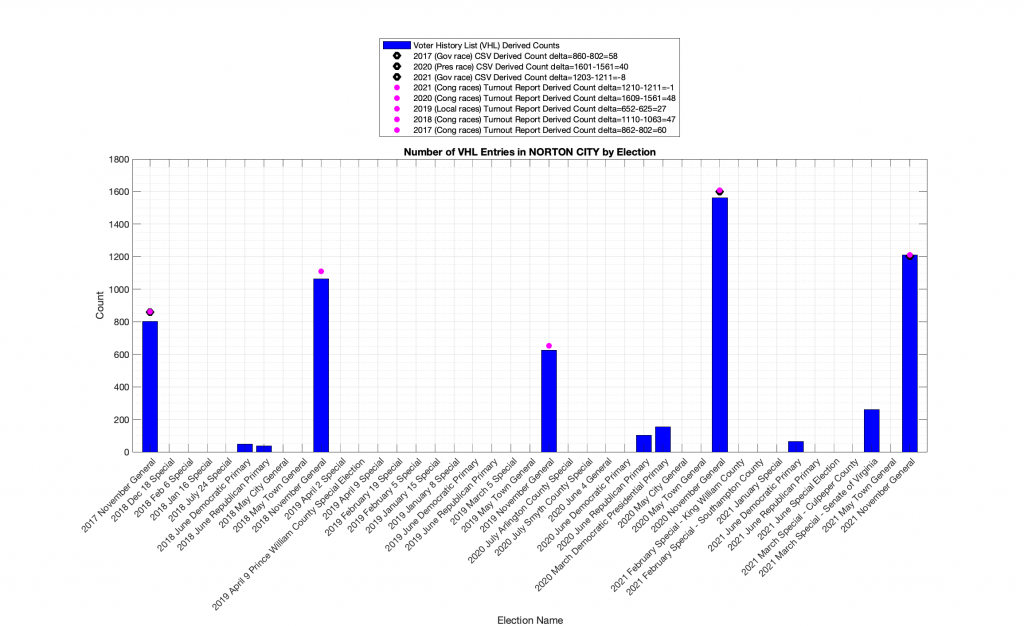
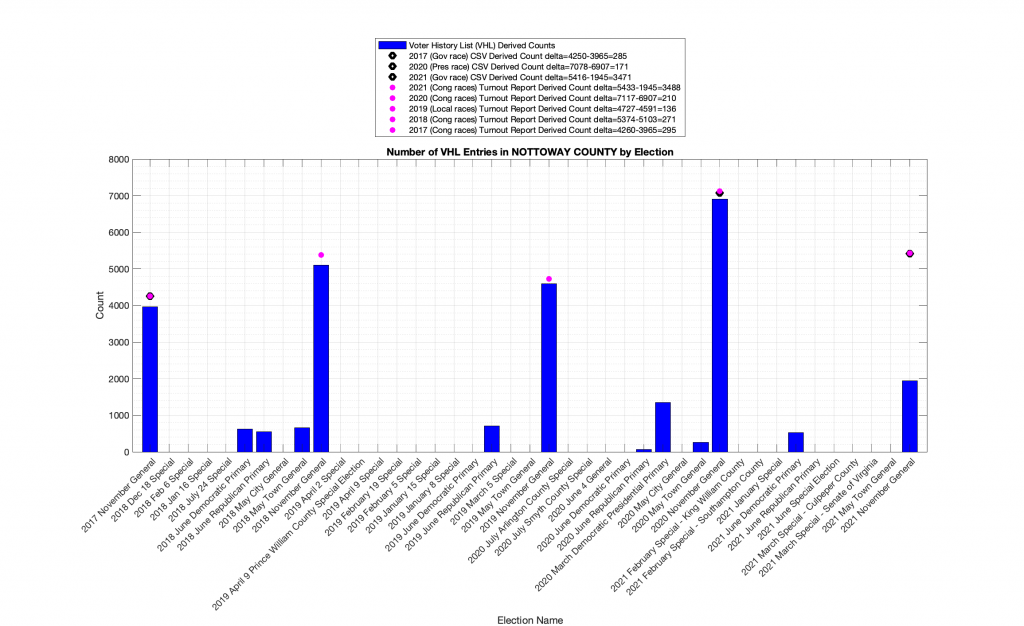
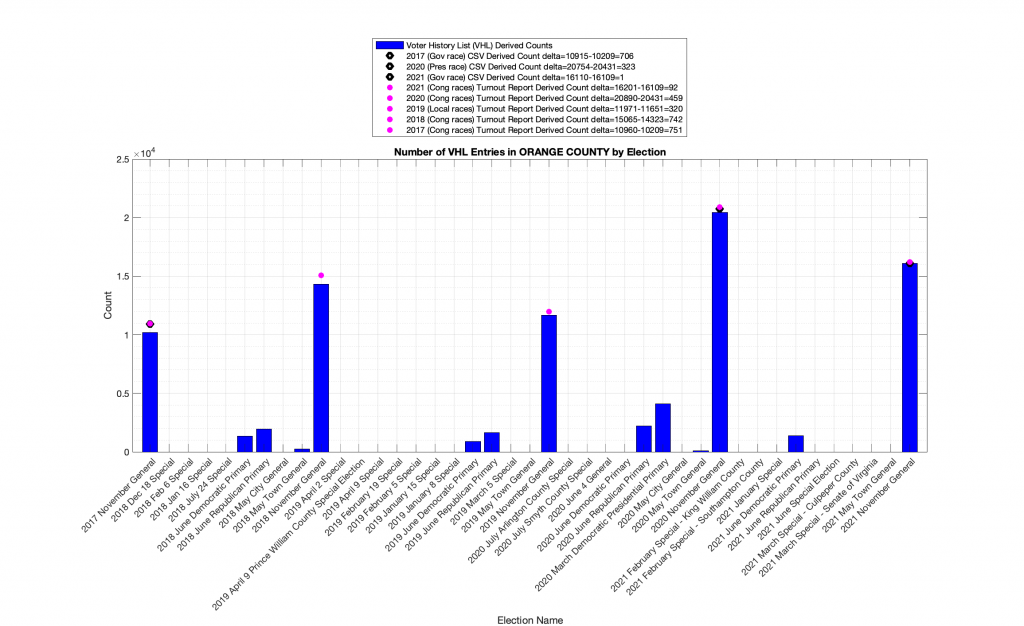
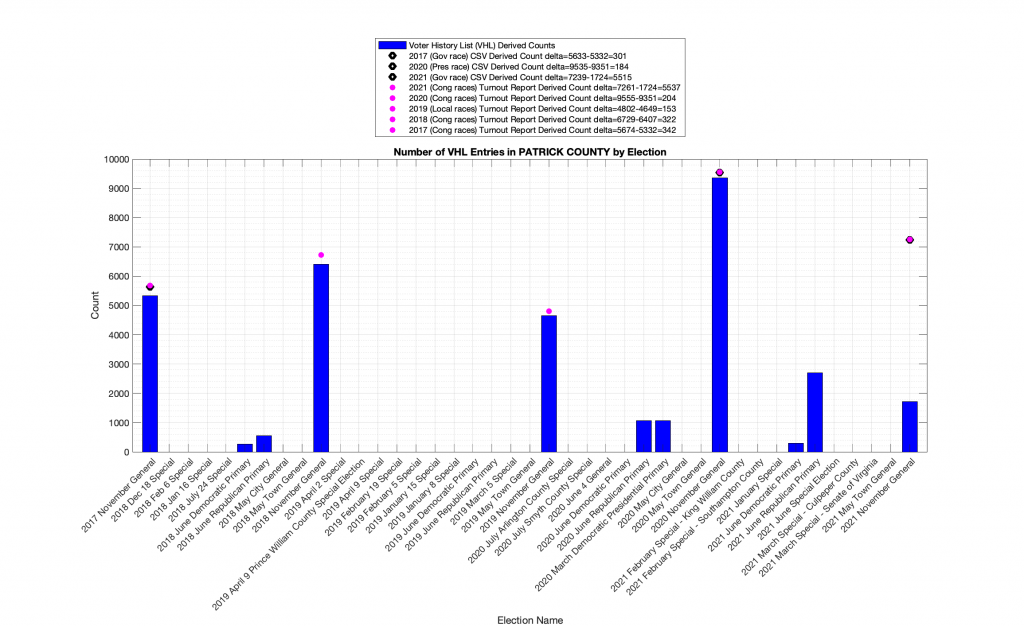
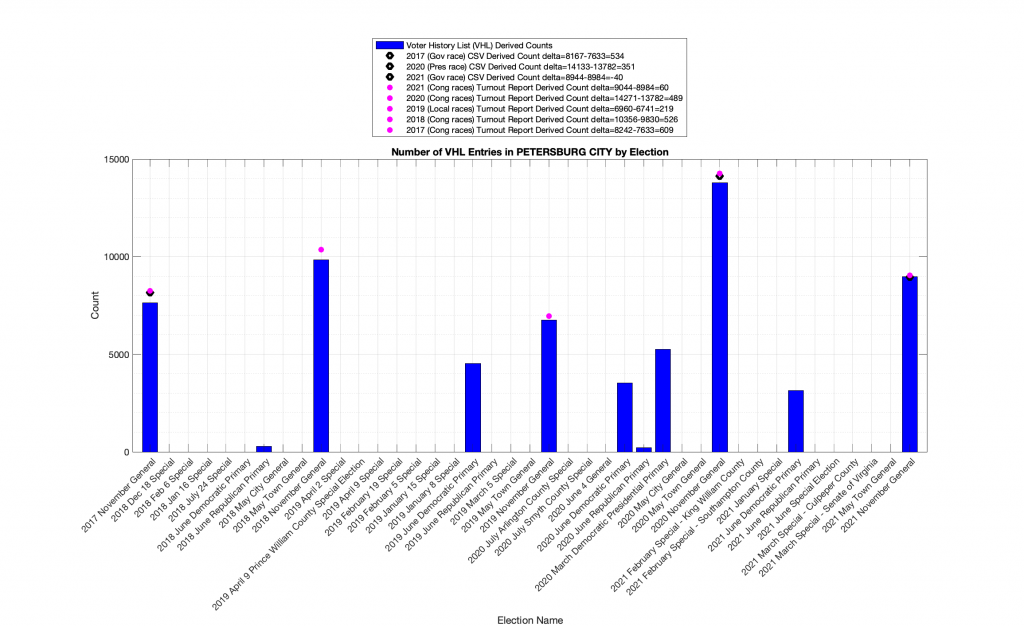
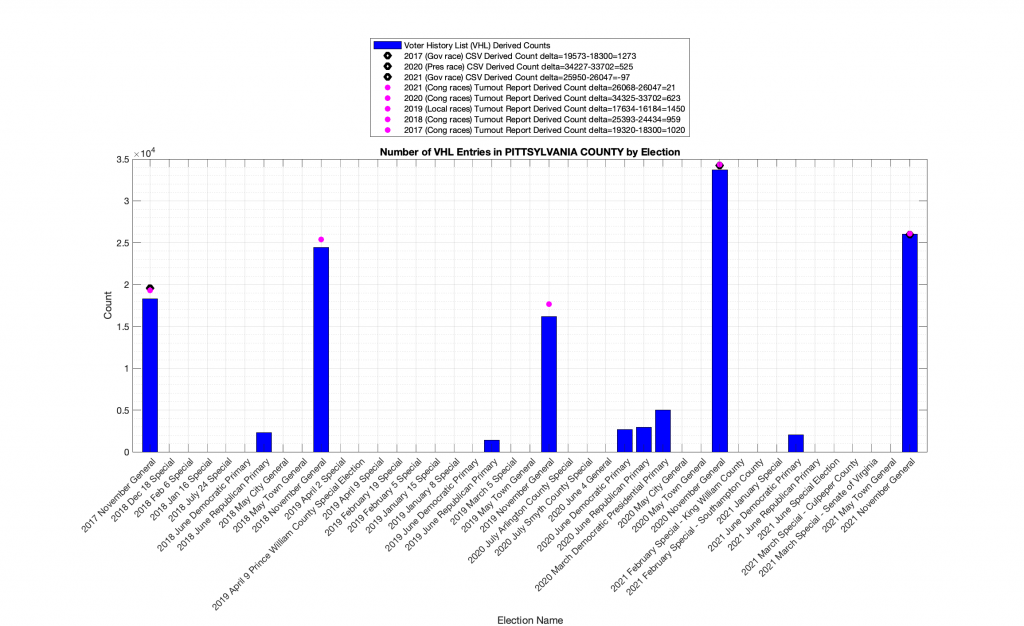
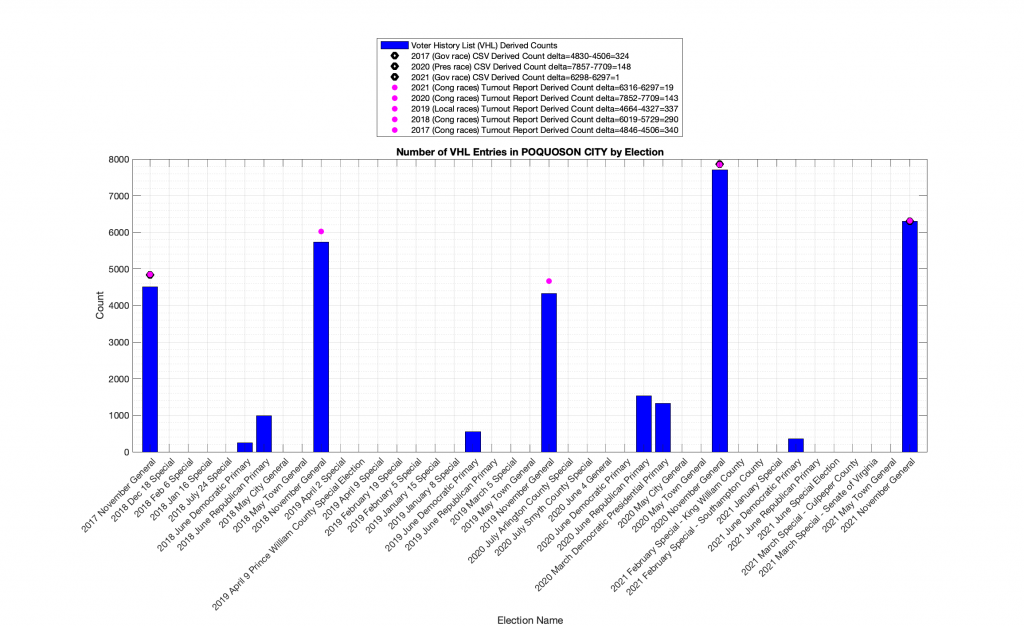
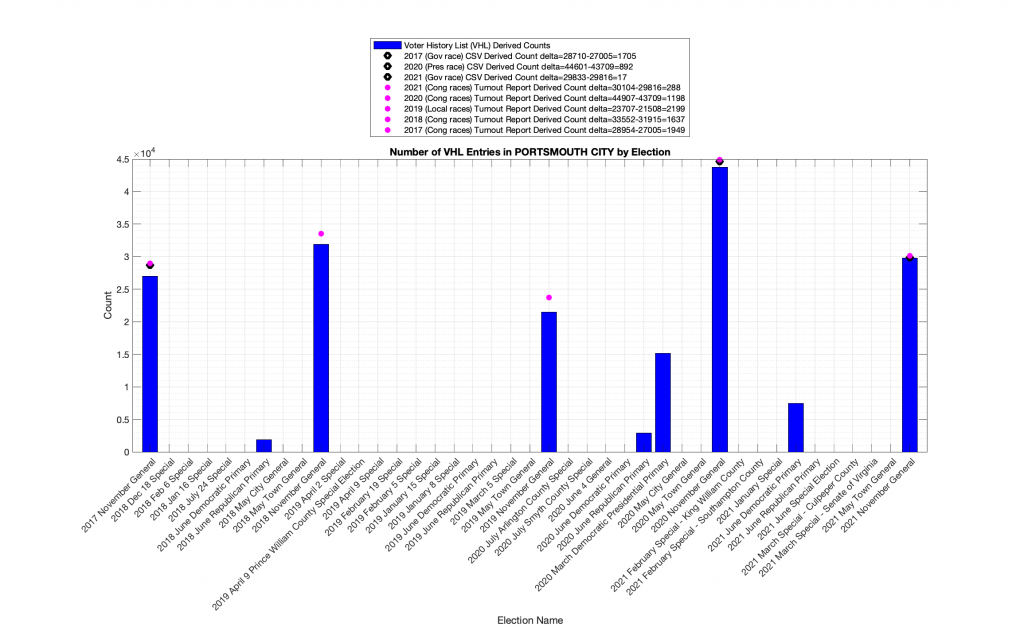
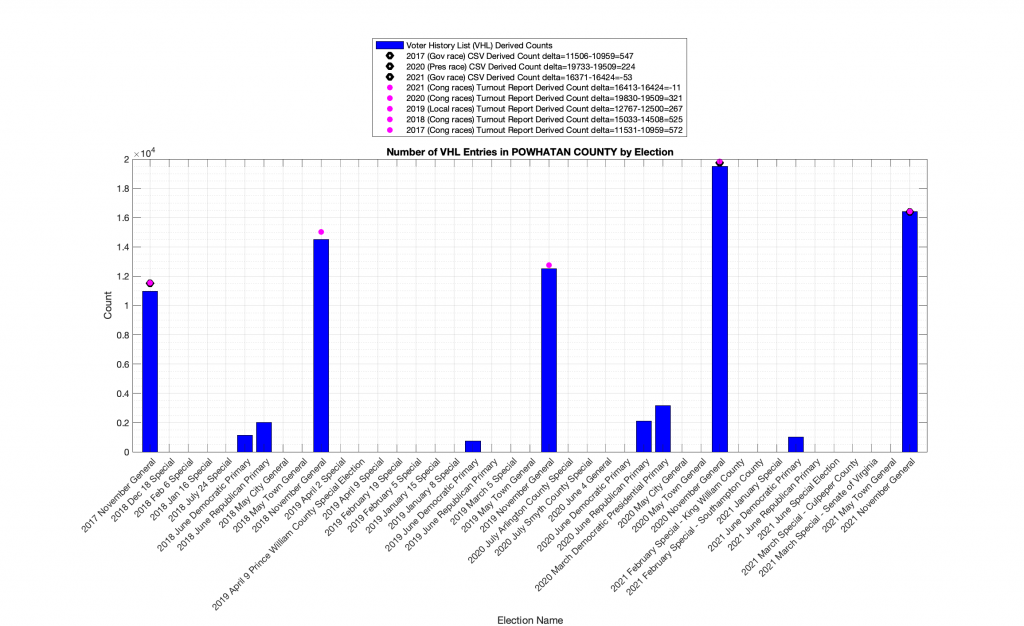
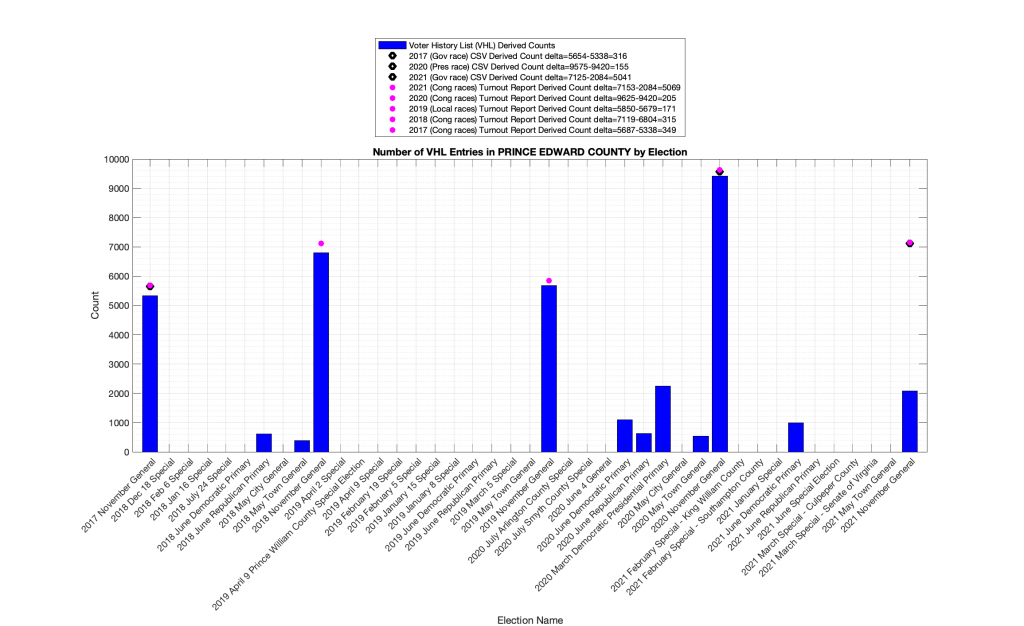
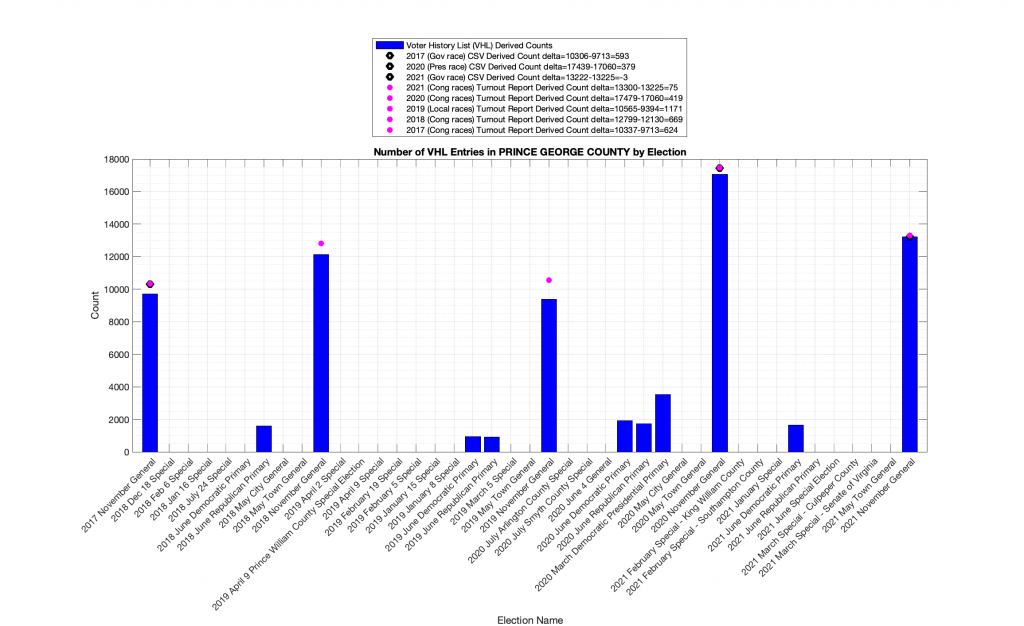
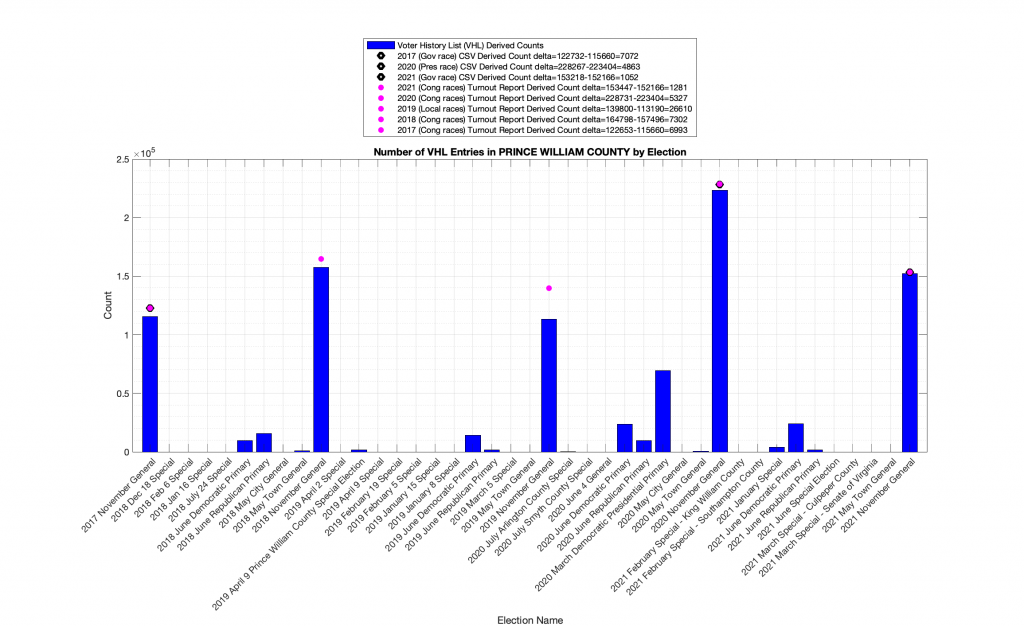
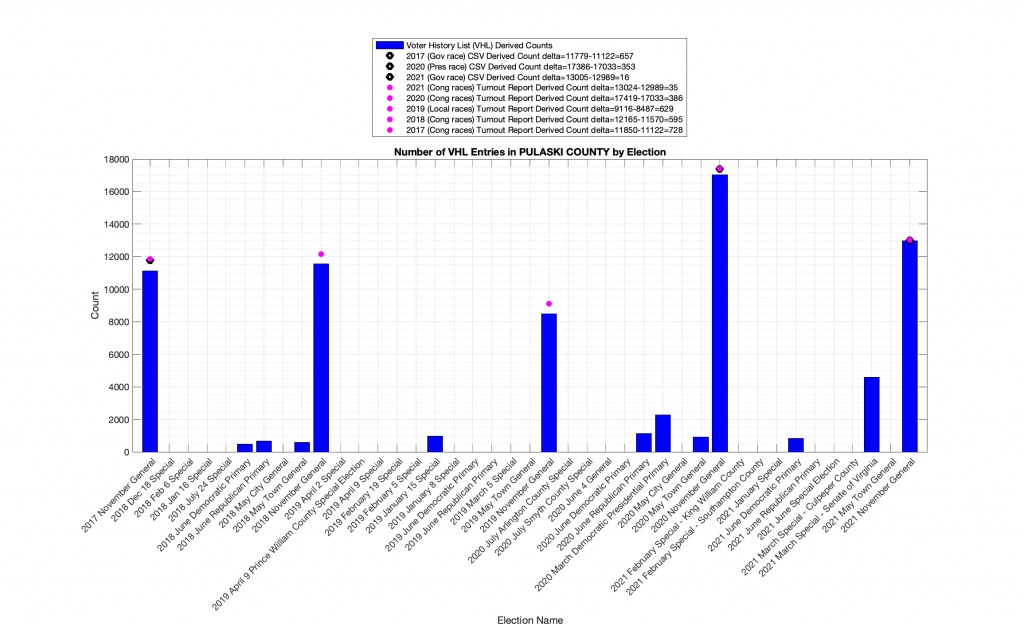
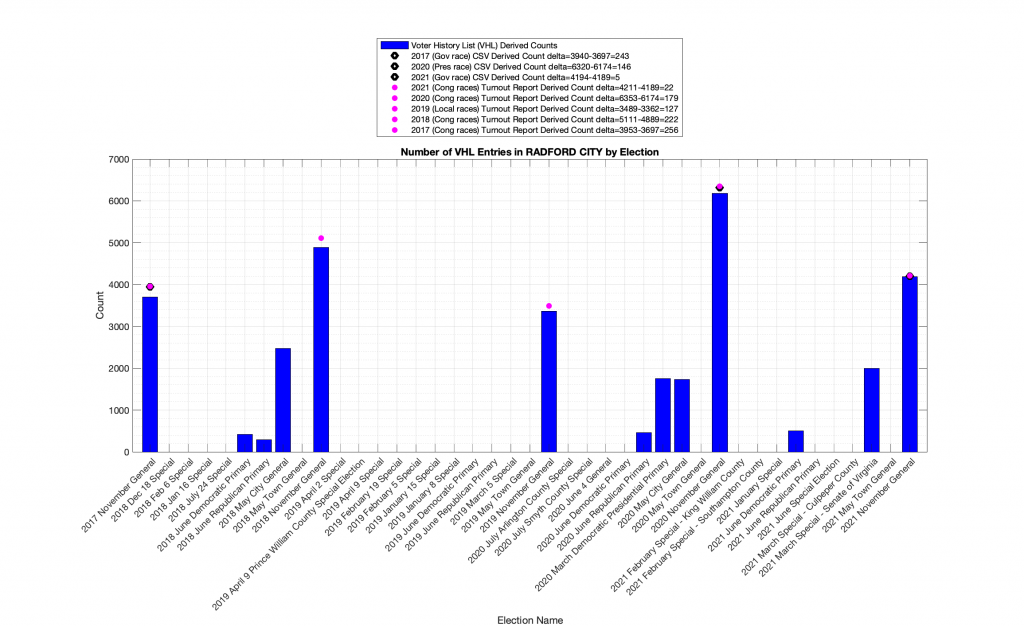
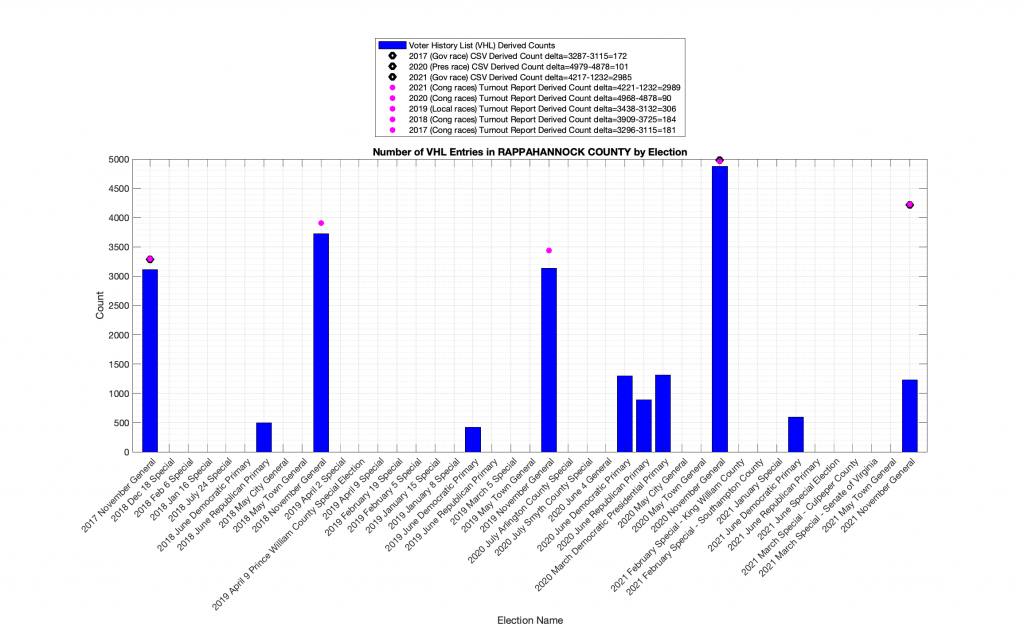
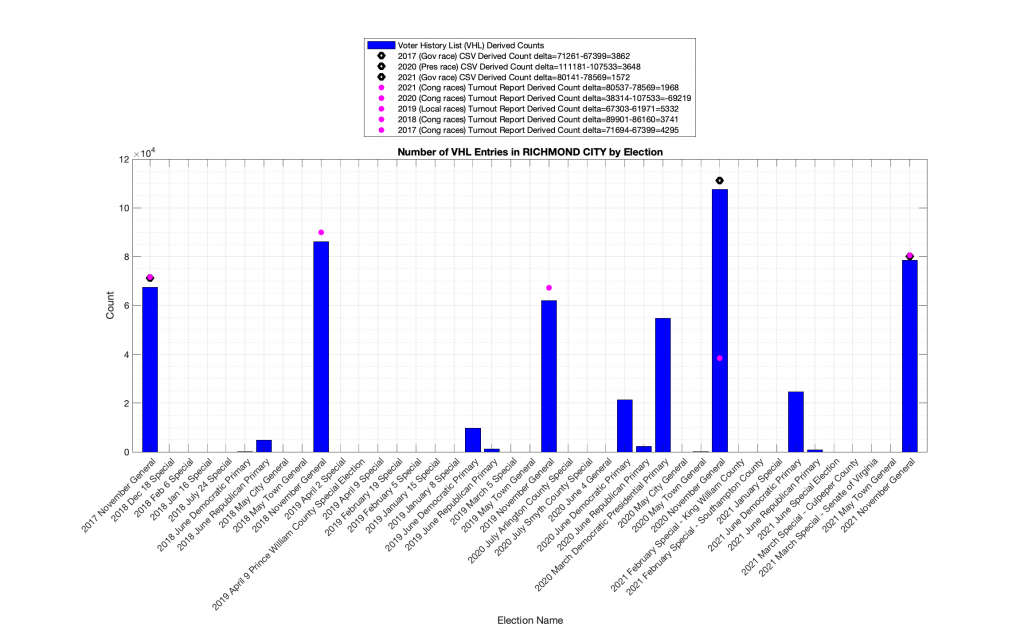
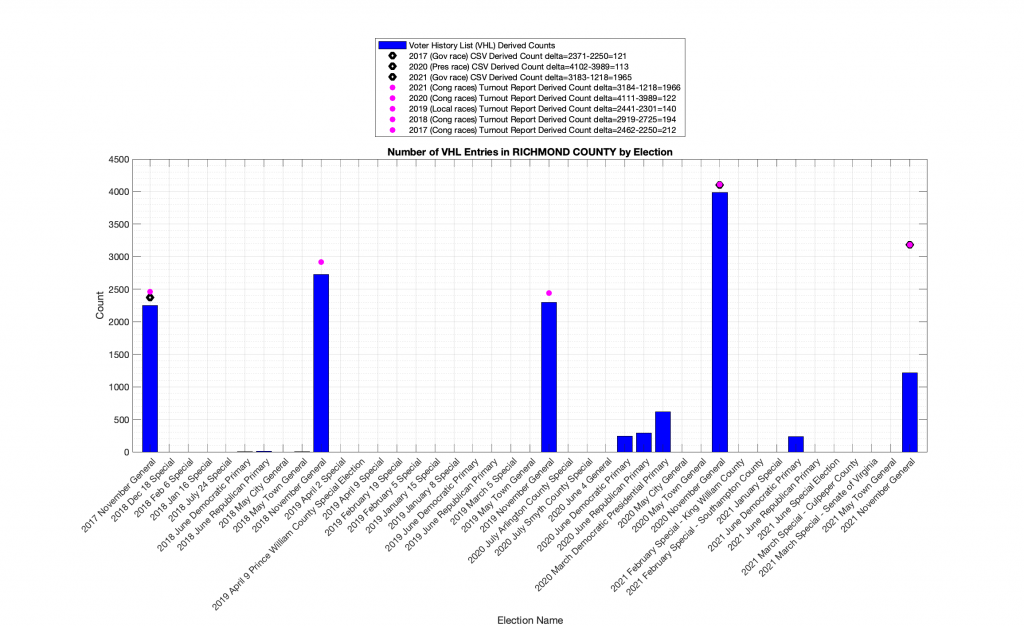
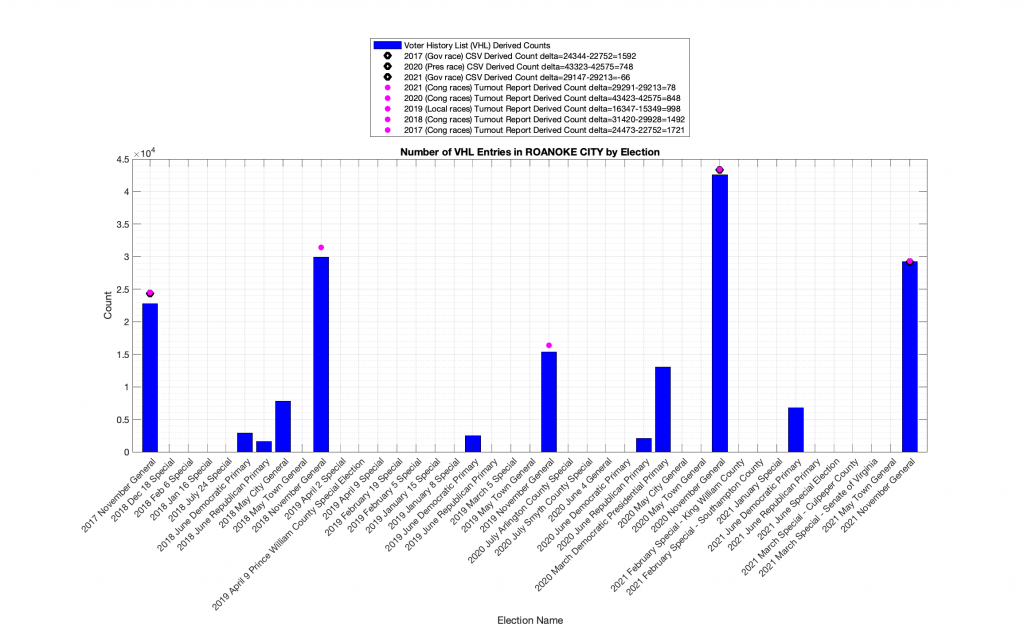
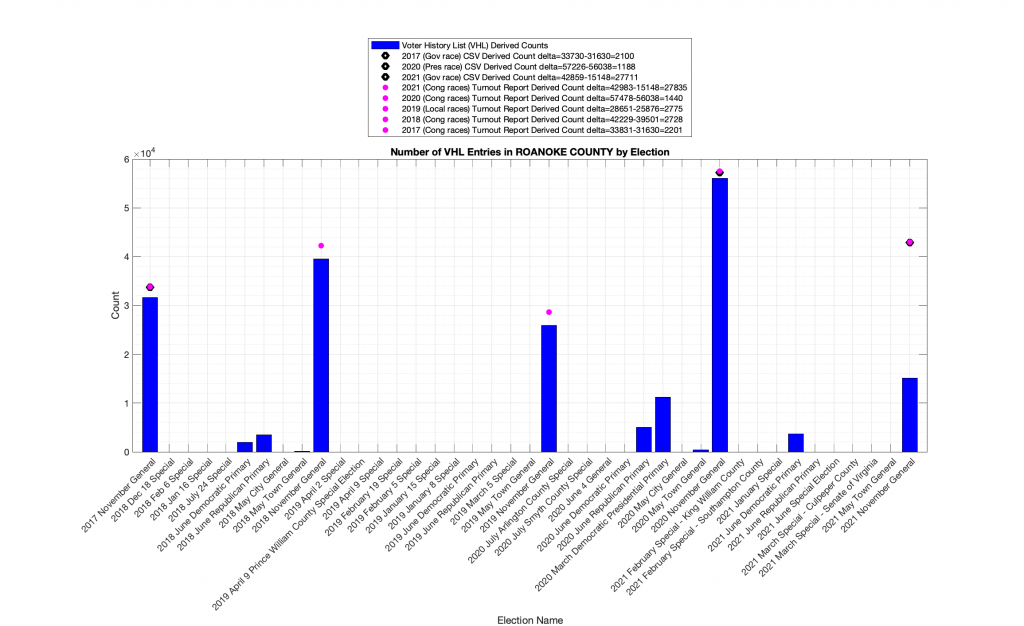
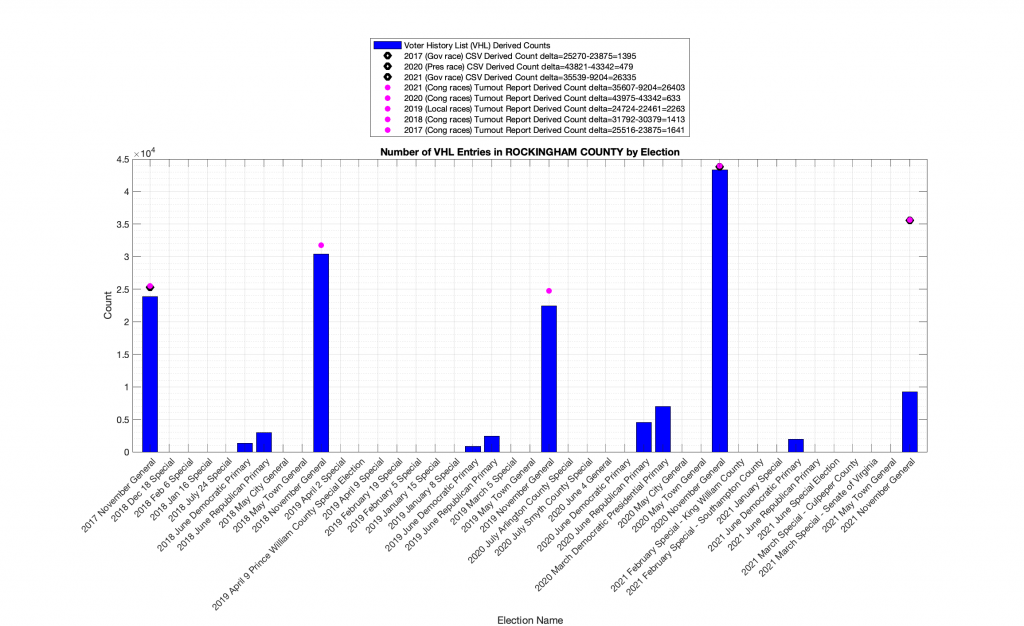
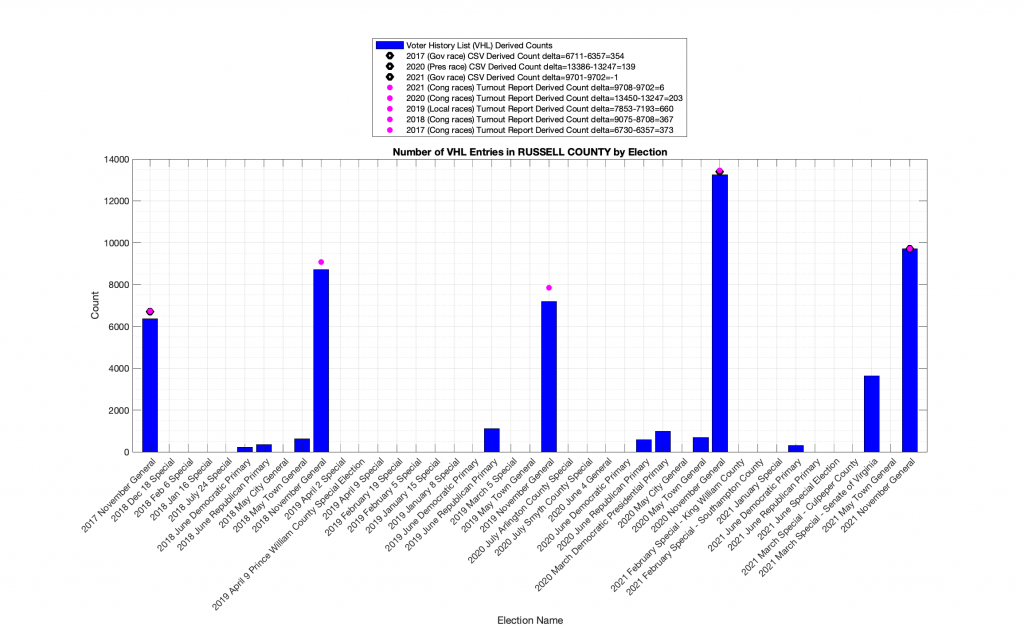
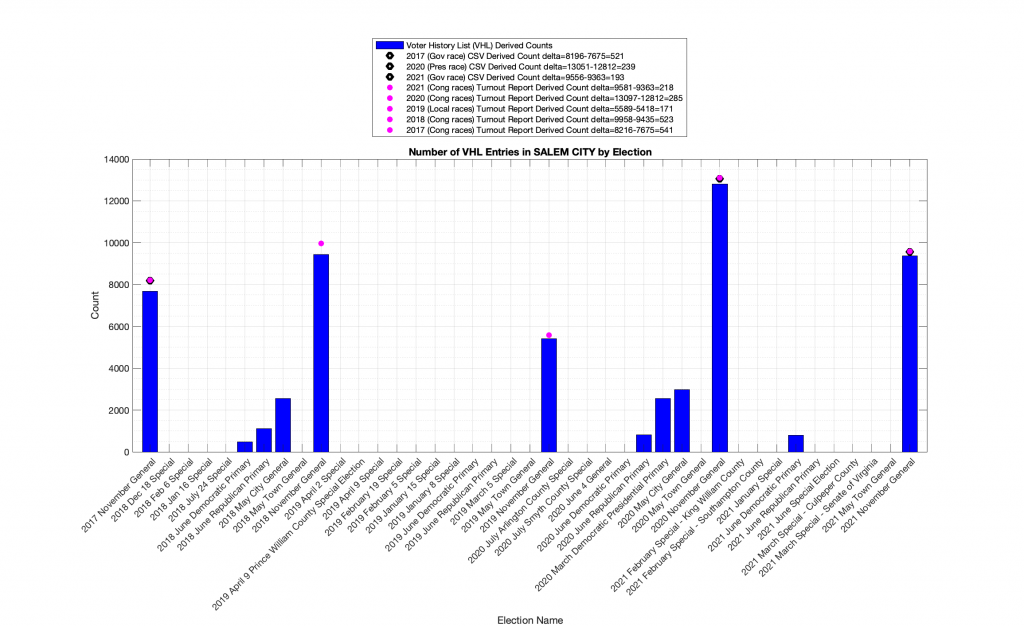
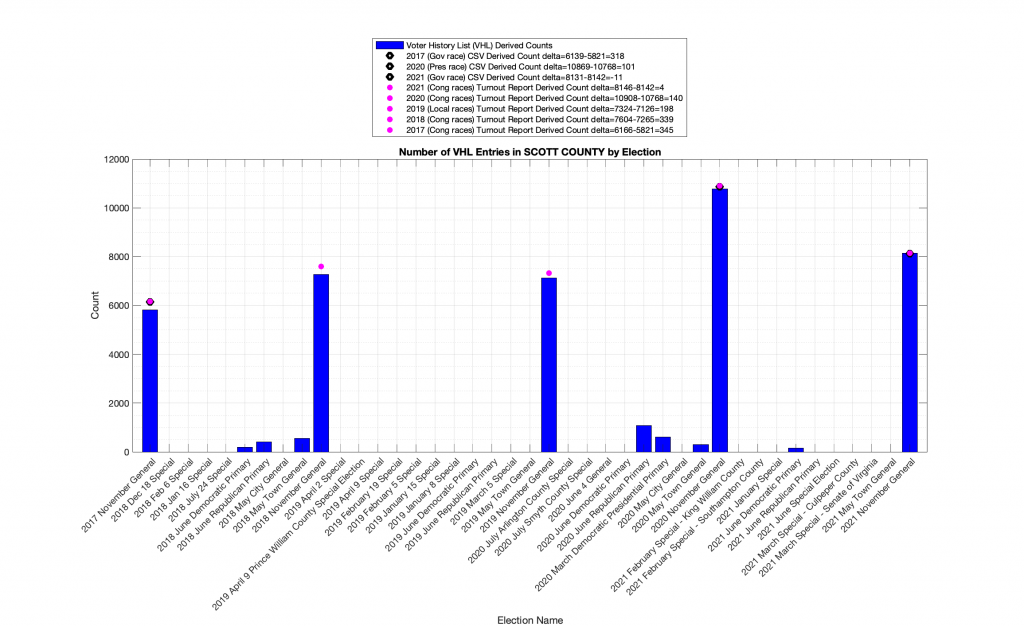
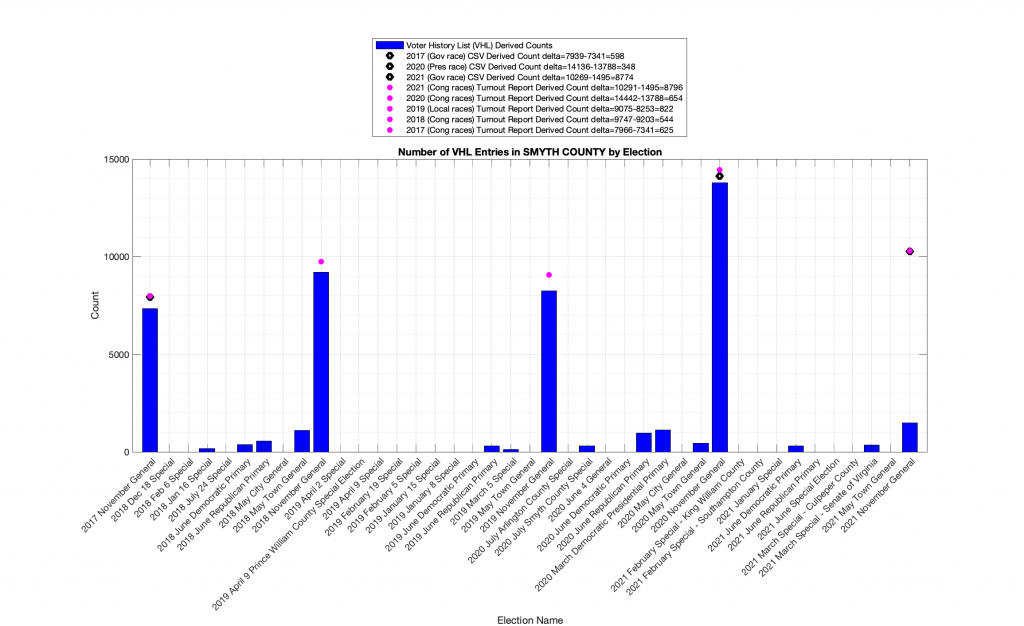
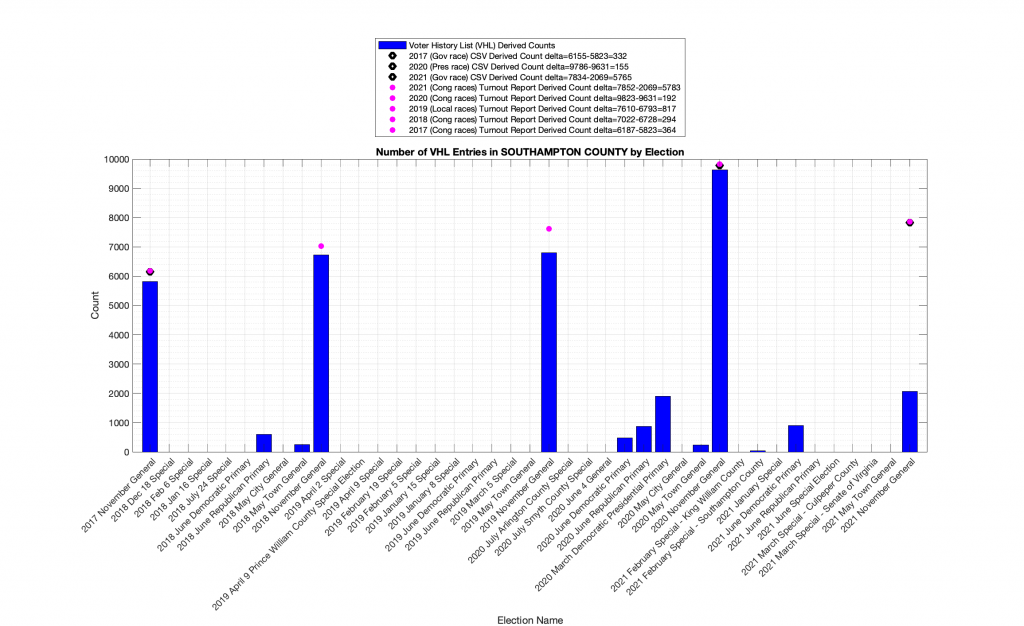
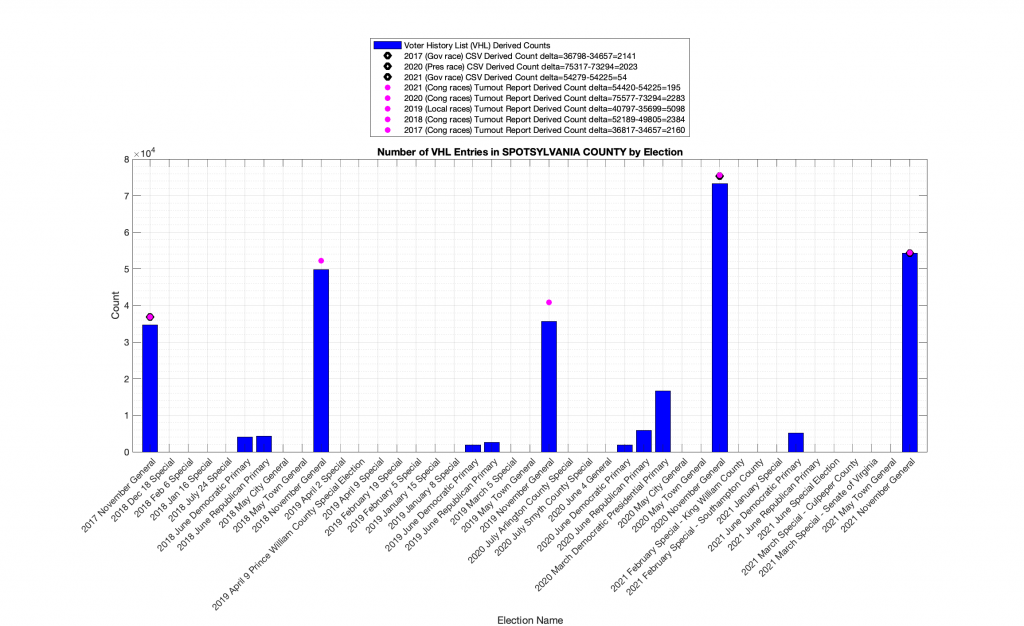
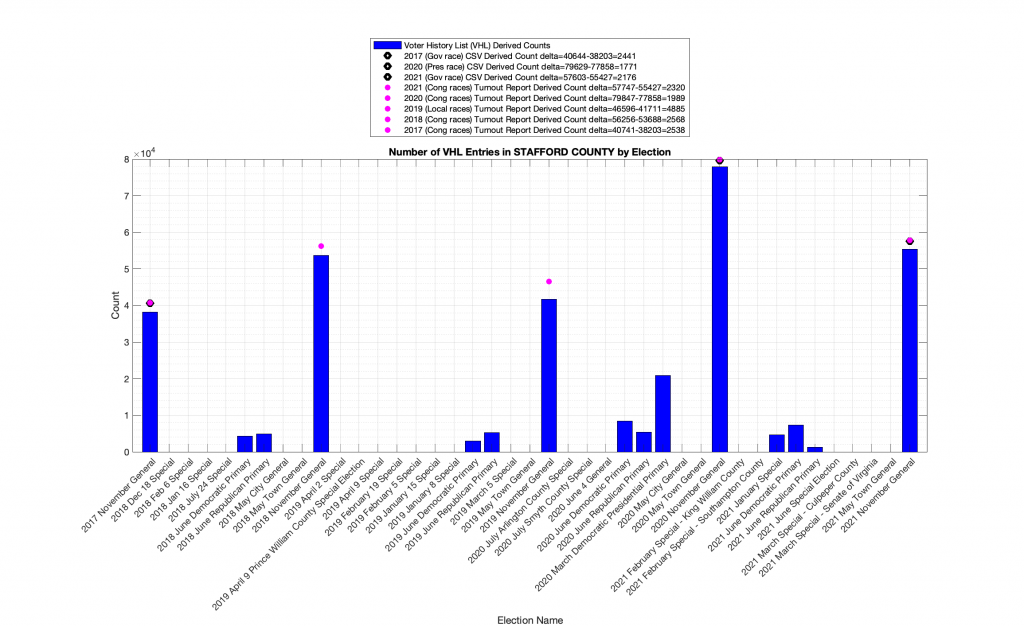
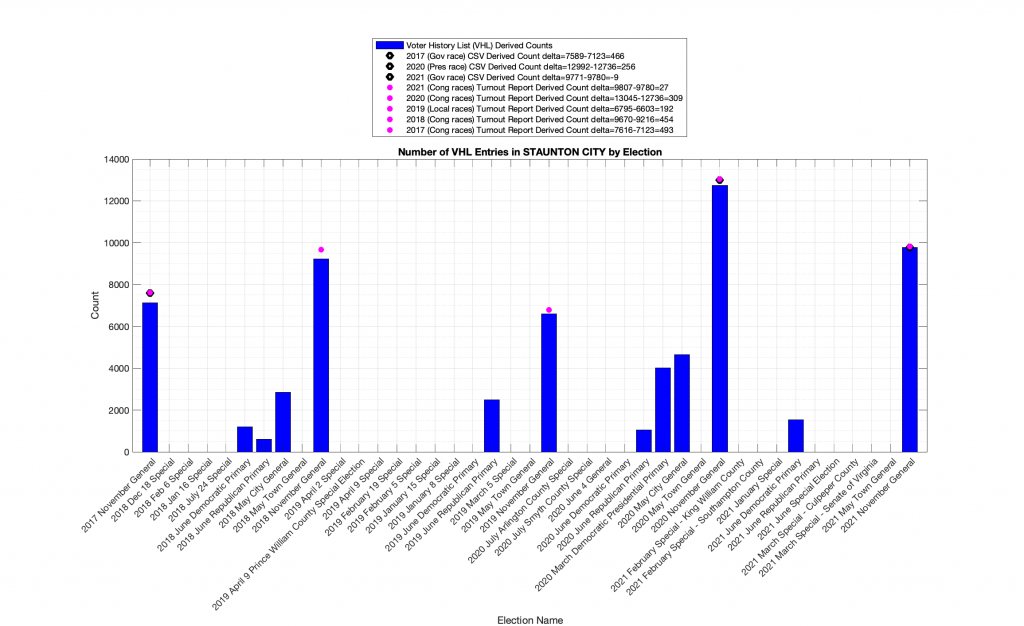
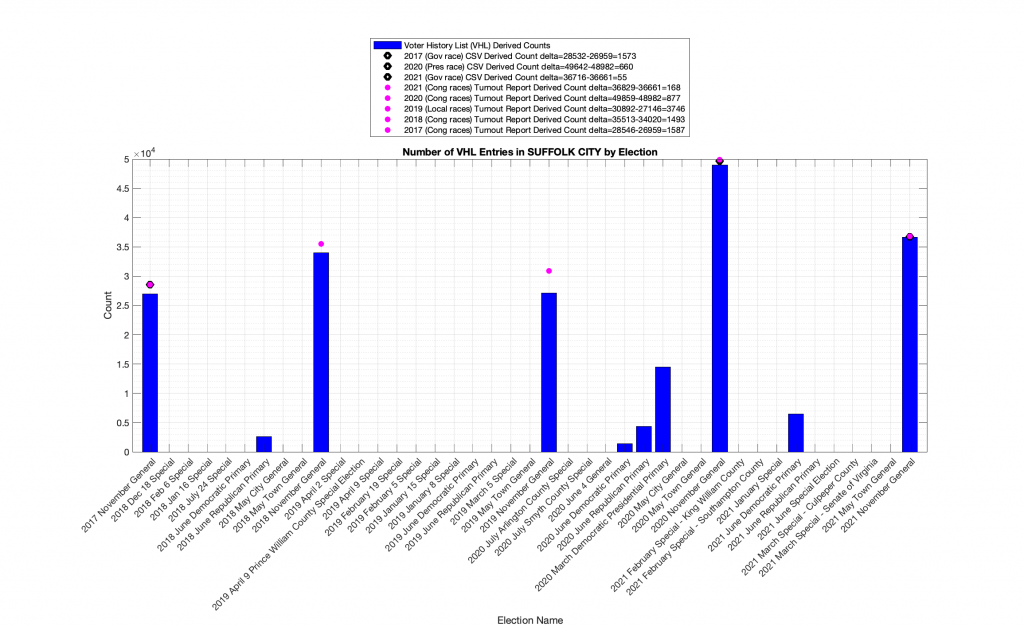
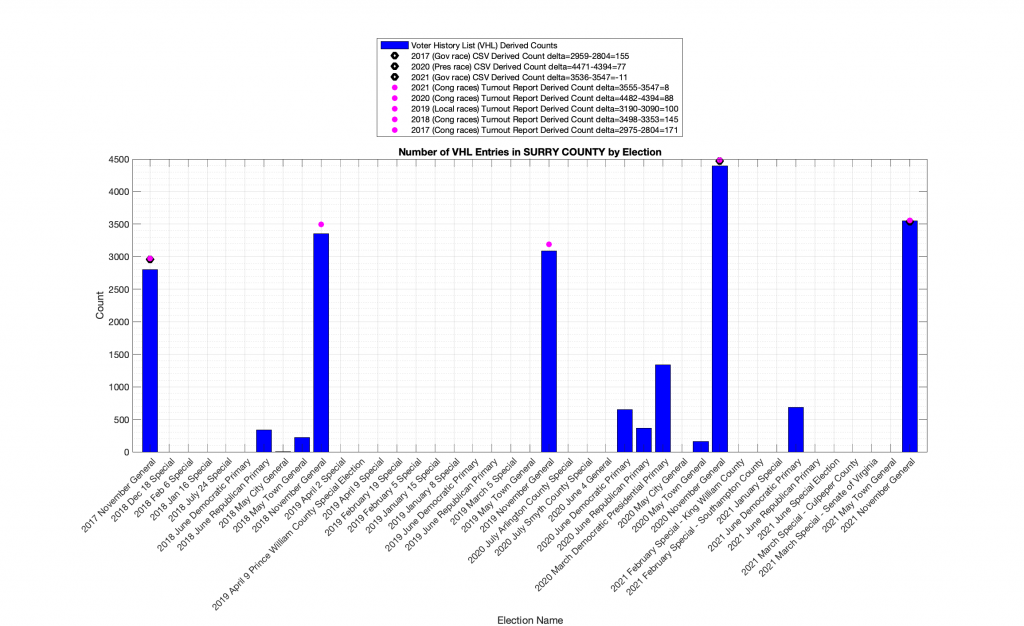
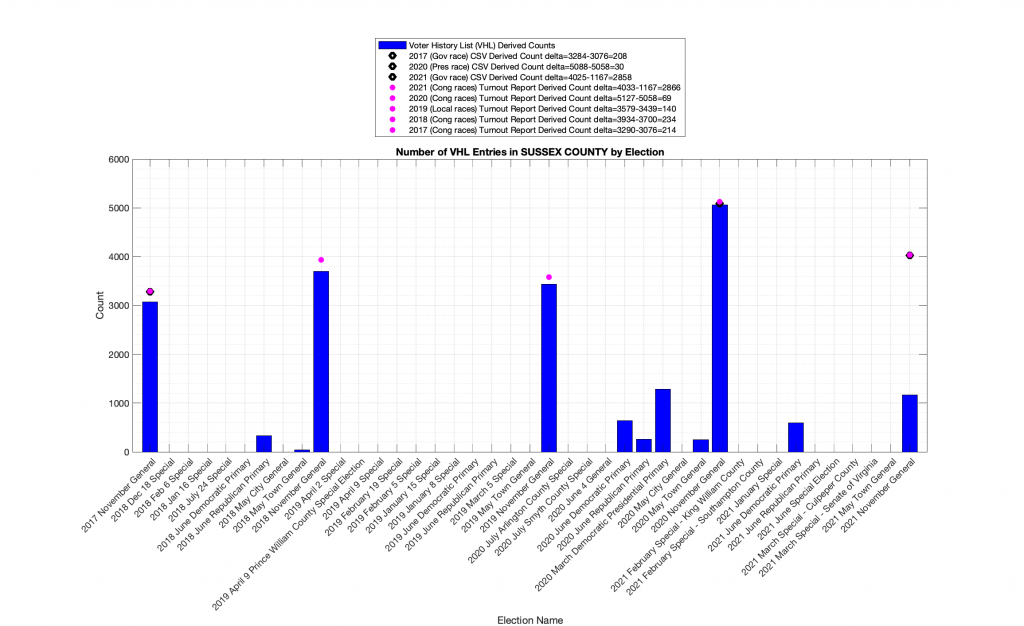
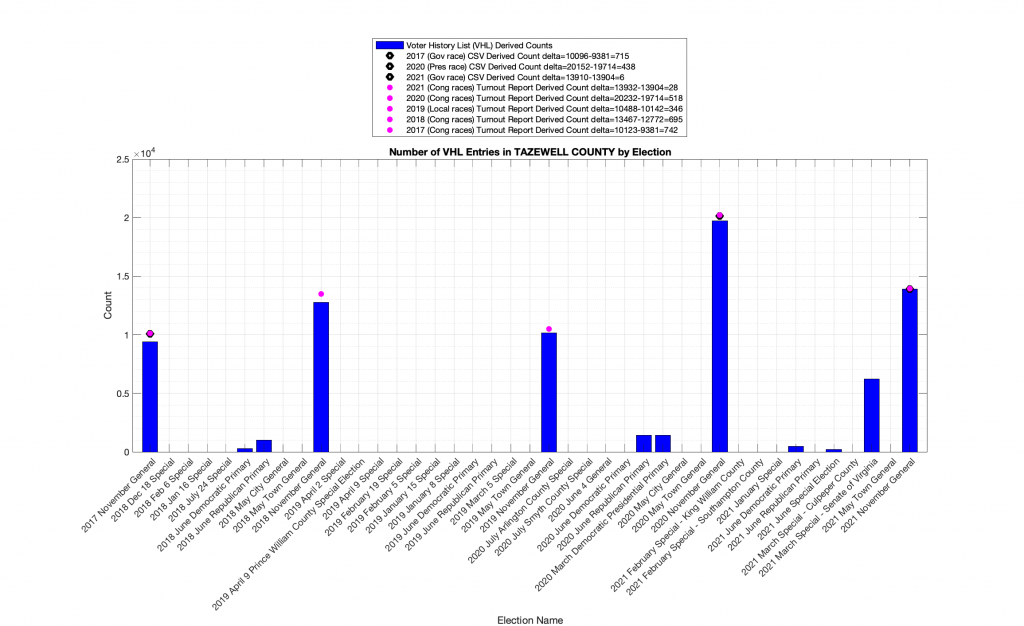
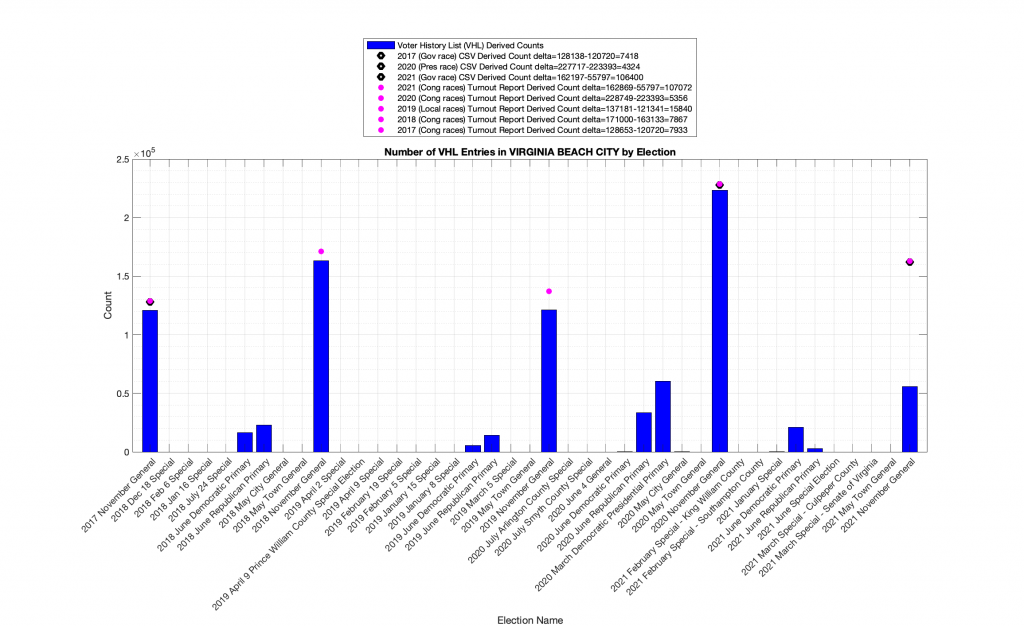
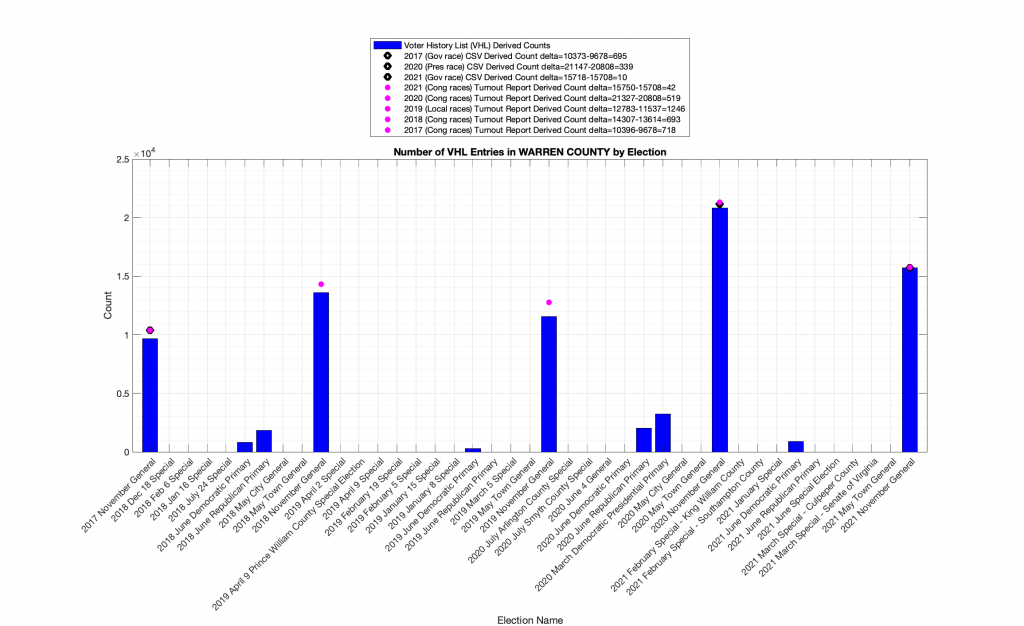
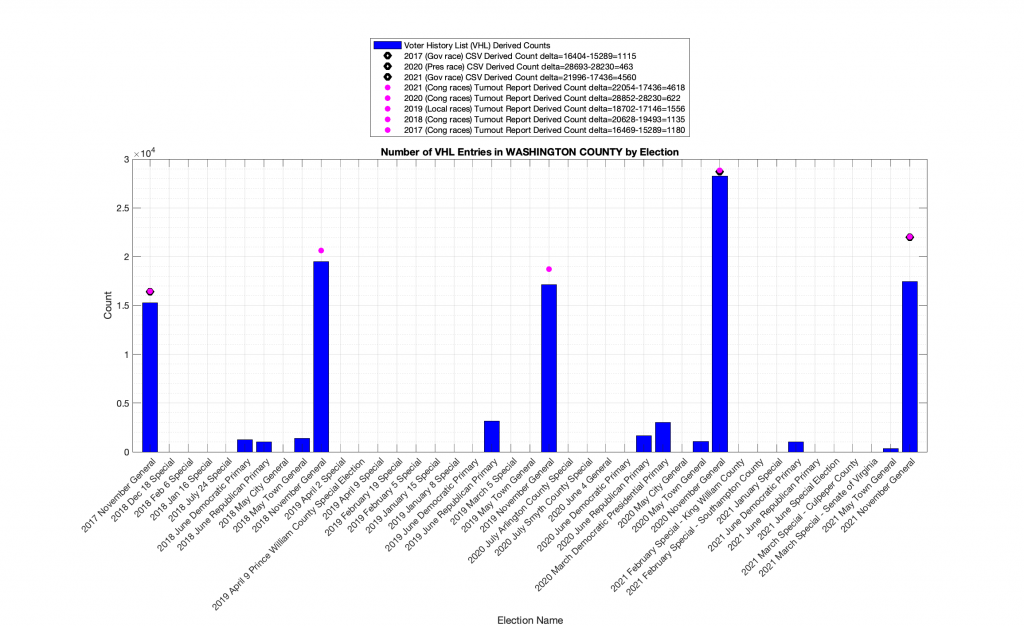
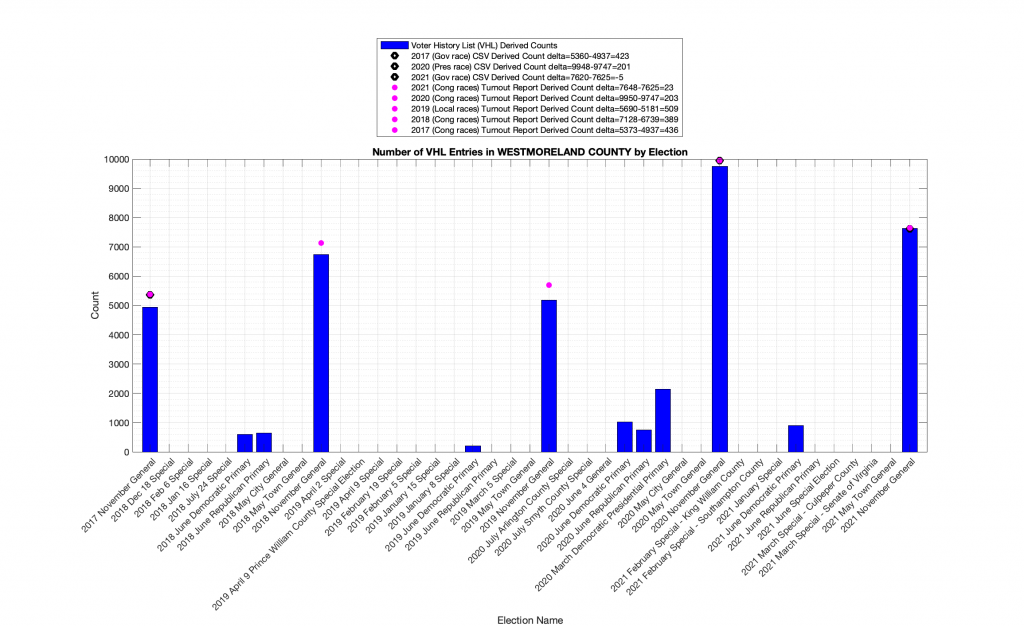
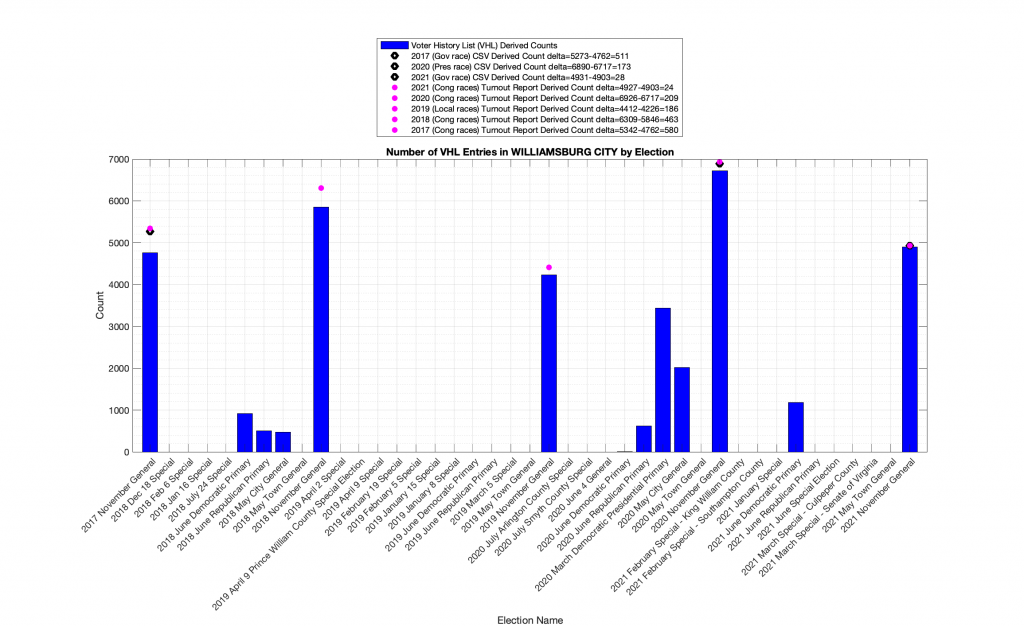
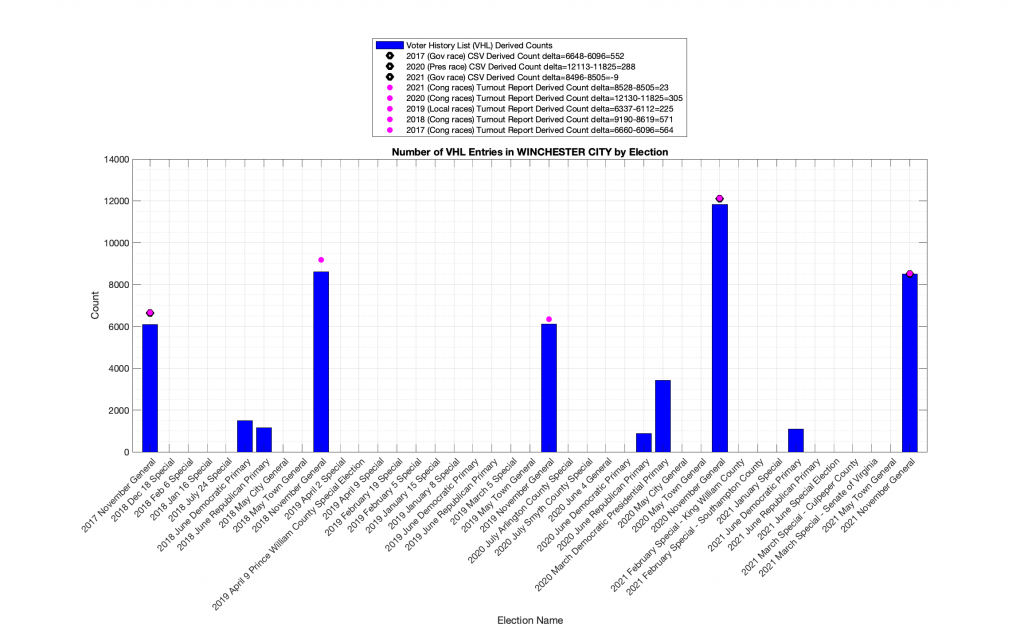
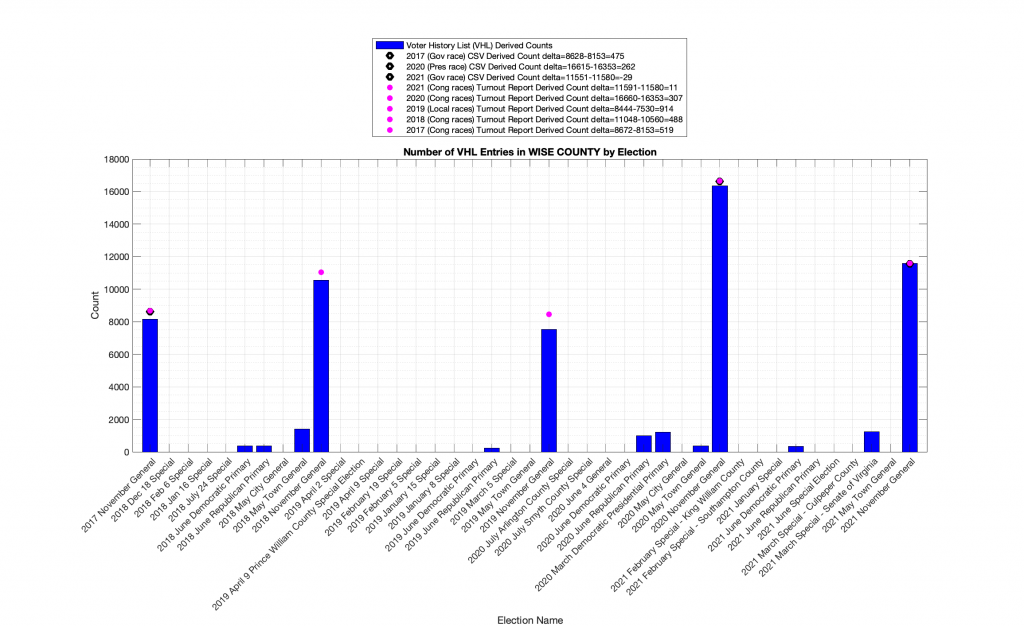
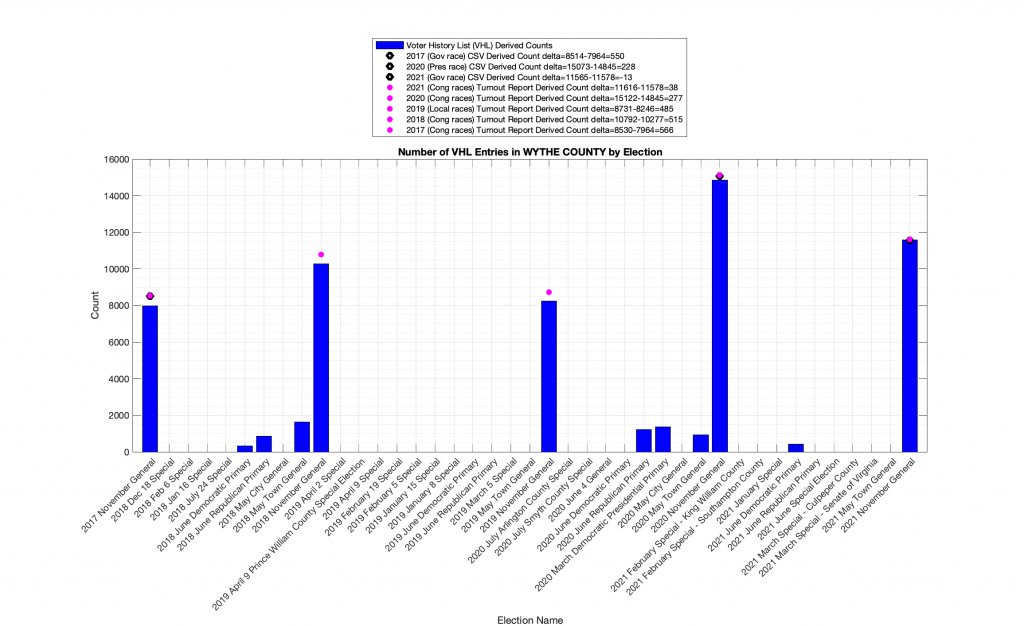
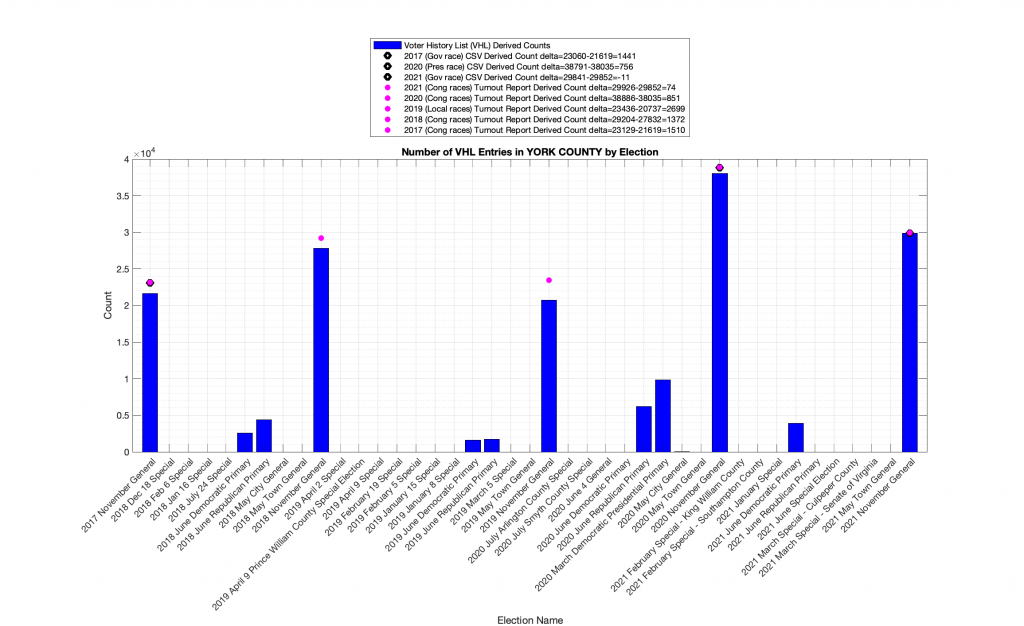
Complete Gallery:
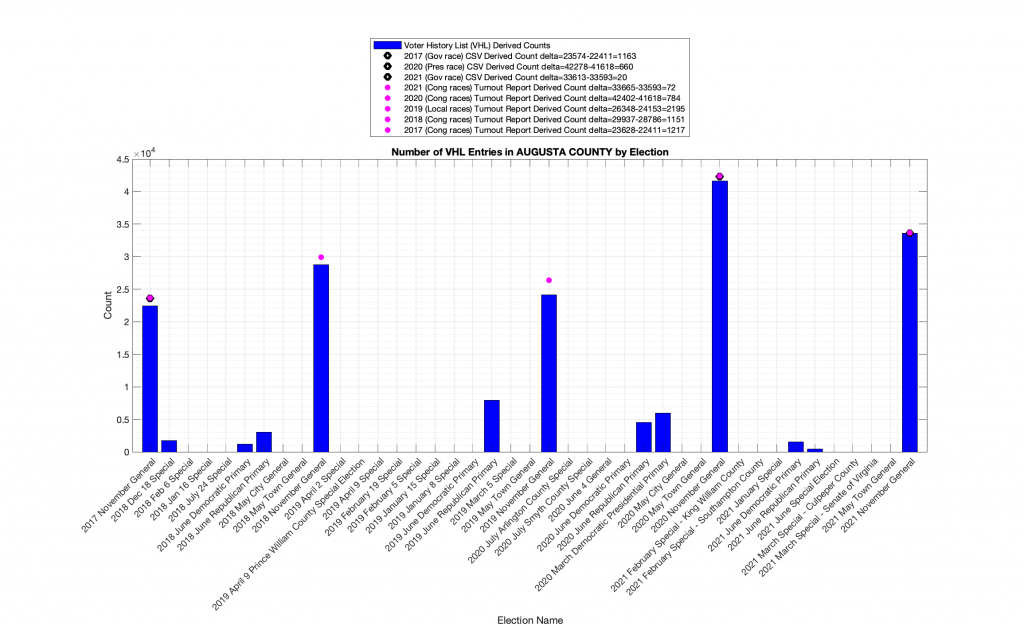
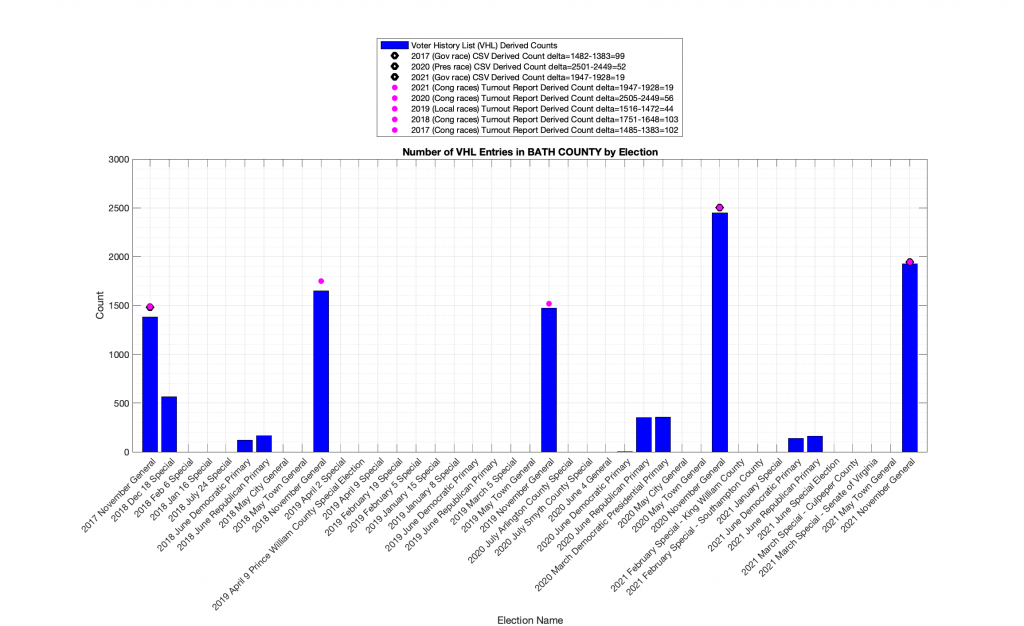
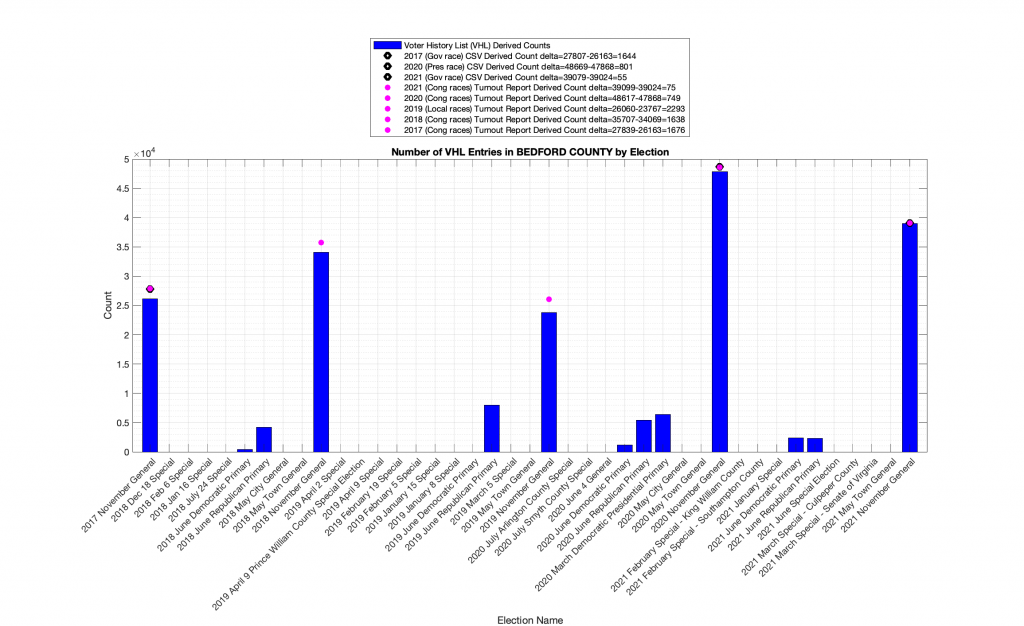
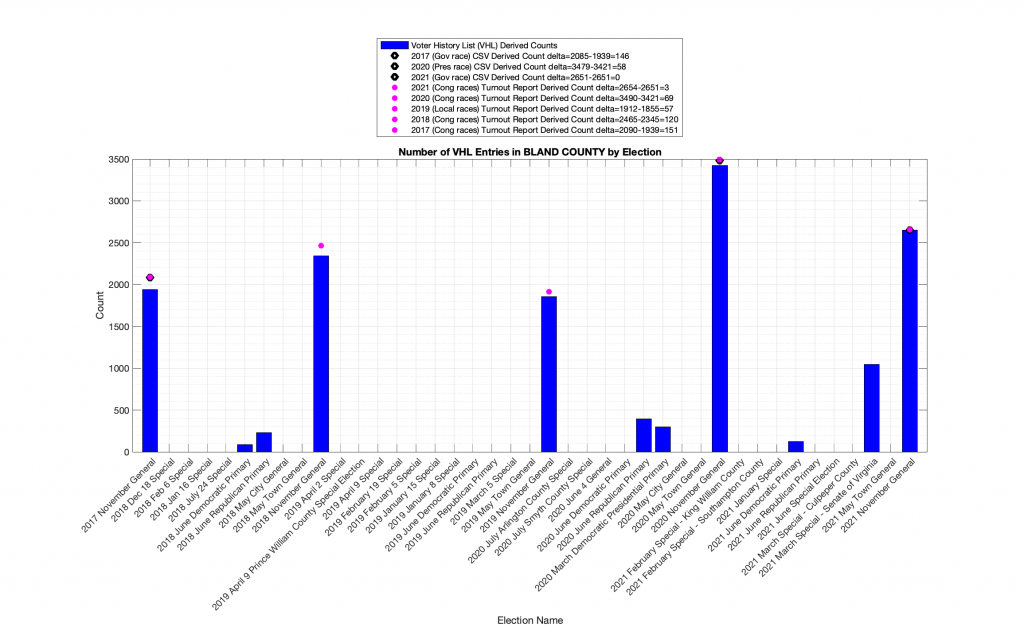
Below is a complete gallery of every Locality’s computed results for completeness.