Previously (see here, and here) I built a set of Election Fingerprints including WI that was based on the County data that I extracted from the NYT/Edison research election tracker, which was the best data that I had available at the time. While the results did have some interesting features, there wasn’t really enough data points to make any sort of inference one way or the other. Well … this last weekend (07/30/21) I received a dataset that had all of the vote counts and registered voters by Ward Grouping in the state, which is a much higher fidelity dataset than I had been working with.
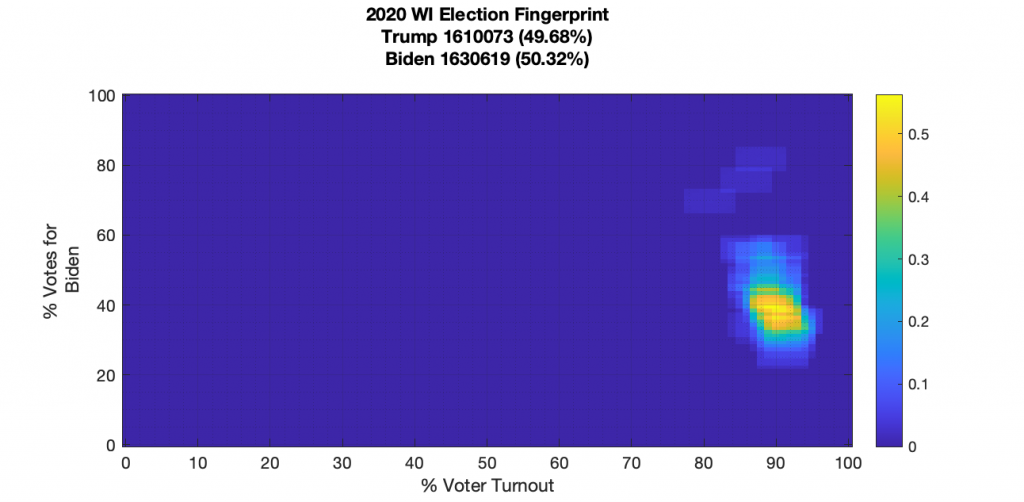
Update 8/4/21: Not 24 hours after posting, my data source for the WI data has discovered some more accurate voter registration numbers for me to use which more accurately account for same day registrations. (The one I used was dated as of 12/1/20) I will be updating my analysis ASAP. The updated plots and analysis is posted here, but I’ll keep this post up for historic purposes.
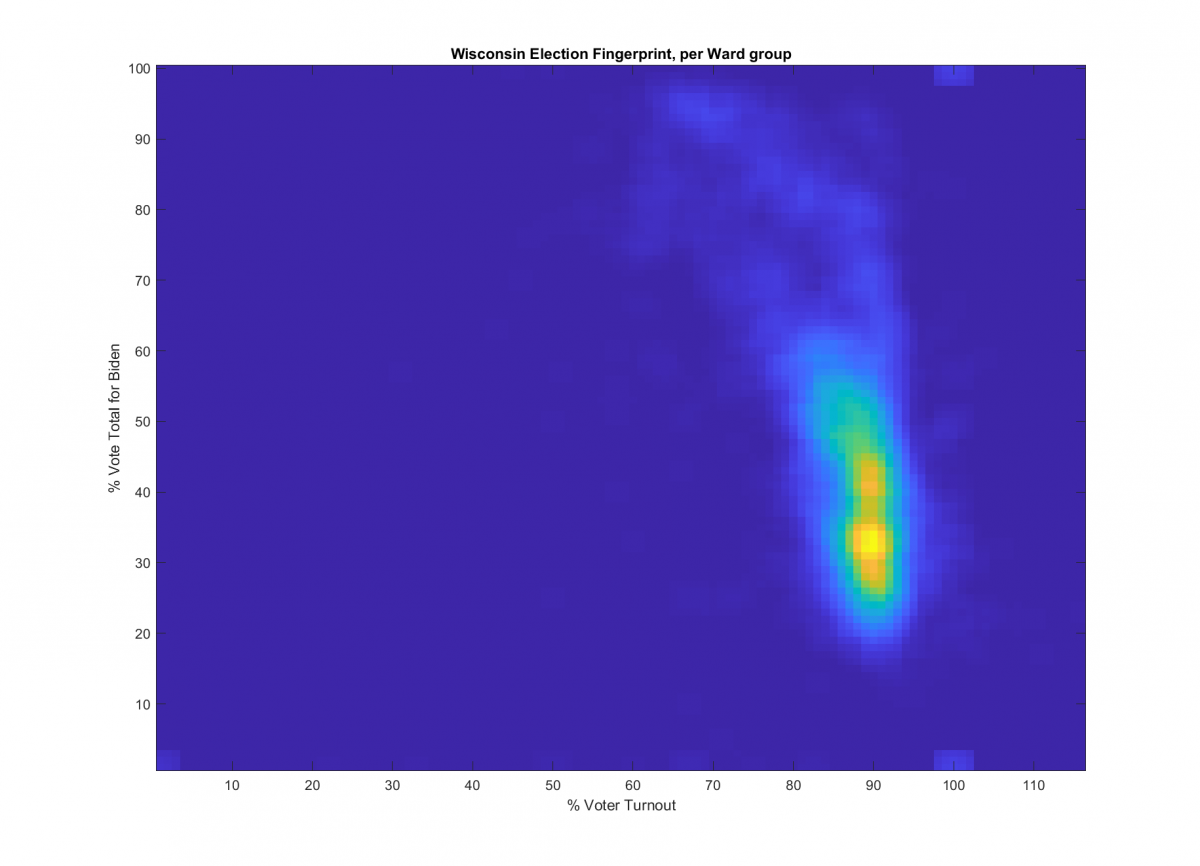
The original image I created is replicated below for reference. As you can see, its a very blocky histogram created from the County level data points. There is a main lobe at about 90% turnout and 40% for Biden with some kurtotic streaking up and to the left with another grouping of Counties. While those features are indeed irregular and interesting, due to the coarse nature of the original per County data, it was plausible that the shape is just due to sampling issues so I didn’t flag WI as one of my issue states.
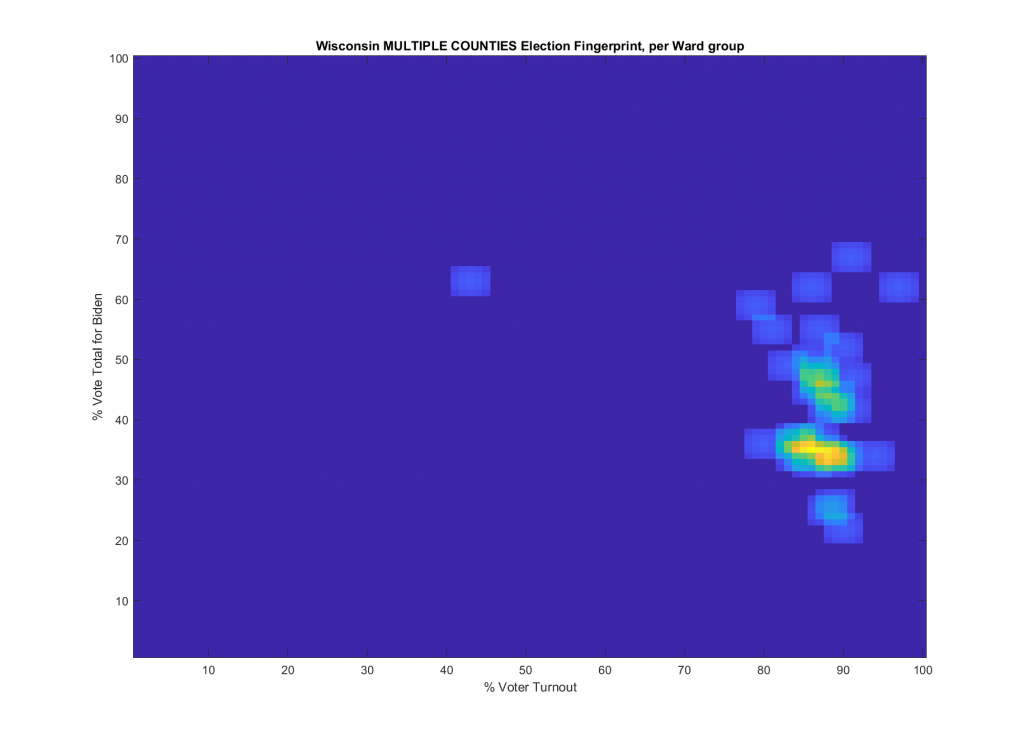
The data set I received this weekend however, is a drastic improvement in fidelity. It’s not without its data quality issues, as there was a good bit of data normalization needing to be done to get the vote tally data per ward group and the voter registration data per ward to marry up. Besides some different spellings, abbreviations and shorthand that needed to be rectified between the dataset, the registration data had any municipality that would straddle county lines labeled similar to the following format: “MULTIPLE COUNTIES, CITY OF NOWHERESVILLE, WARD 5A” along with a registered voter count. The vote count tally data had grouped multiple wards into different groupings such as “SOMEWHERE COUNTY, CITY OF NOWHERESVILLE, WARDS 1-3,4,5A,6C,13-15” along with a set of vote totals for Biden, Trump and TotalVotesCast. So I had to go through the files by hand and group each files corresponding data with the smallest size groupings as possible. There also seems to be a few (not many, though) Wards that are not accounted for by the Vote count result as well and others that are missing from the registration data. That being said, we can see much more detail in the generated statewide fingerprint (below), which also matches the “low-res” version that I had done previously. (Hooray … my results are consistent!)
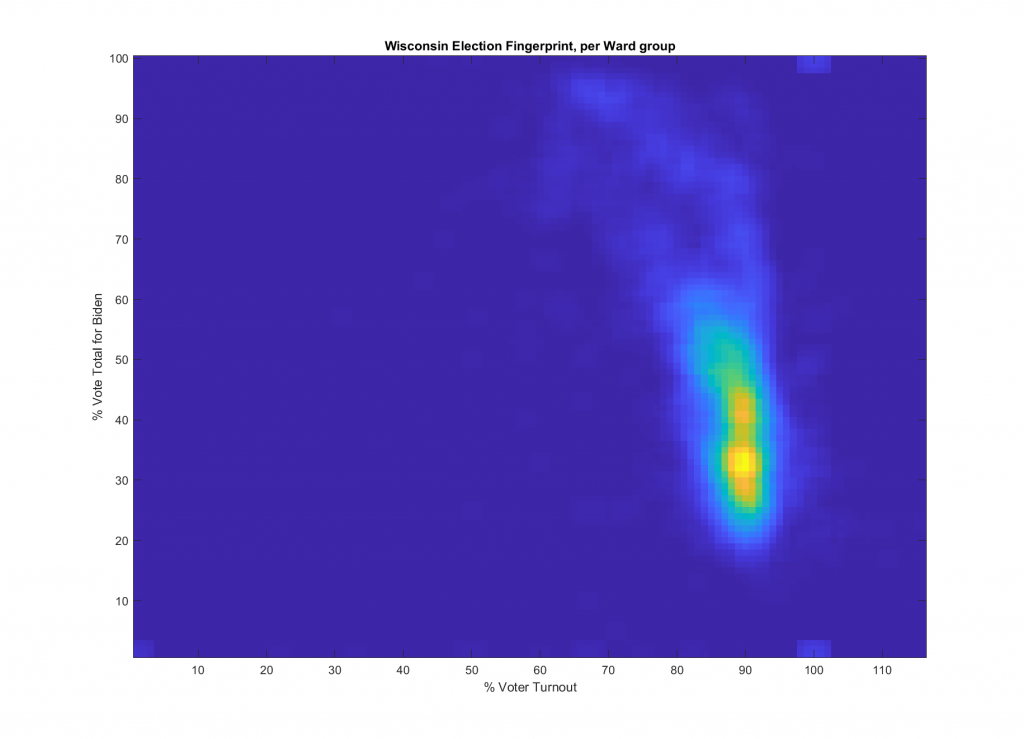
We see what looks like two (or even three) superimposed lobes around the 90% turnout and 40% per Biden bin, which is consistent with my earlier low-res version, and we have a lot more detail as to the upward kurtotic smear off the main distribution. There also are a few Ward Groupings that have exceptionally high % for Biden (rarely, if ever, does a candidate receive near 100% vote share), and there are Ward Groupings that are near/over the 100% turnout marker, with the addition that some of those are ALSO either 100% Biden or 0% Biden (all big red flags)!
As discussed in the National Academy of Sciences paper that all of this work is based on, an idealized Election Fingerprint should look like a 2D Gaussian (or a multi-variate normal distribution). Or maybe, in an extremely divided populace, 2 overlapping Gaussian distributions. Deviations from this are, by definition, irregular and an indication that there might be an issue with the election. Distinct linear or non-linear features sloping away from the central lobes(s) could indicate voter manipulation or “ballot stuffing”; isolated regions at high turnout +/or very high vote percentage for one candidate could be an indication of extreme manipulation or vote substitution. Now, its true that no real Election Fingerprint will look perfectly Gaussian due to the realities of how elections operate, data errors, etc … but they should at least be close!
So that moves the needle for me as to considering WI as a problematic state based off Election Fingerprint generation. I would definitely say now that I think there are concrete signs of election irregularity in WI that deserve to be rigorously investigated. I can’t tell you if the shape of the above plot is due to incompetence, or outright fraud … but there is definitely something wrong!
Per County Data
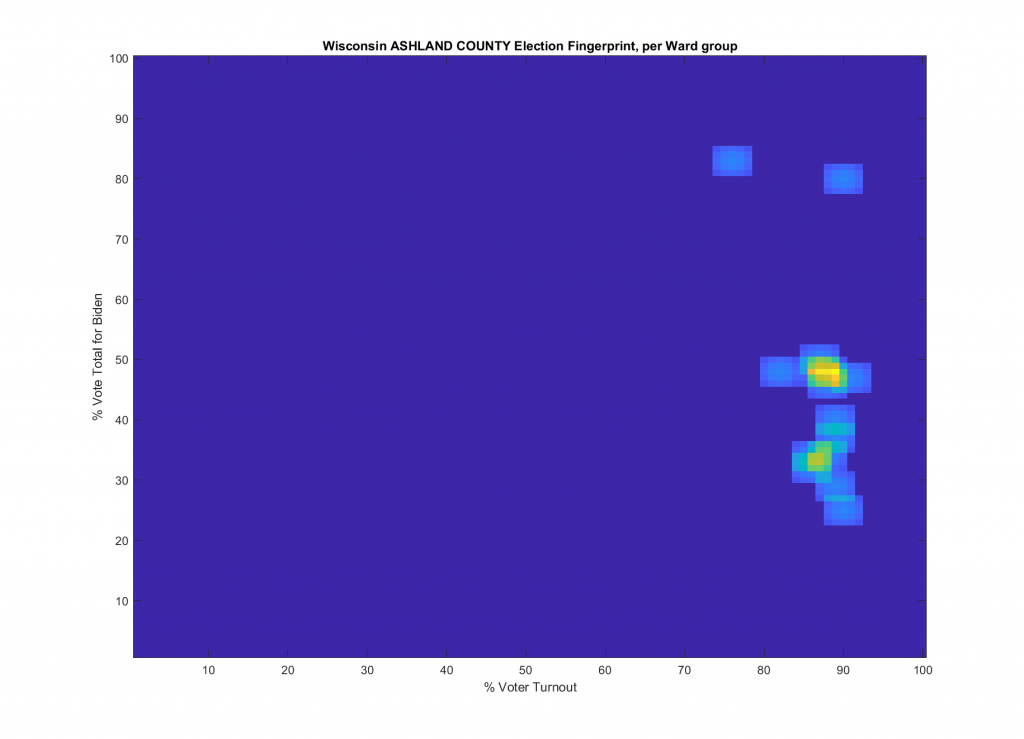
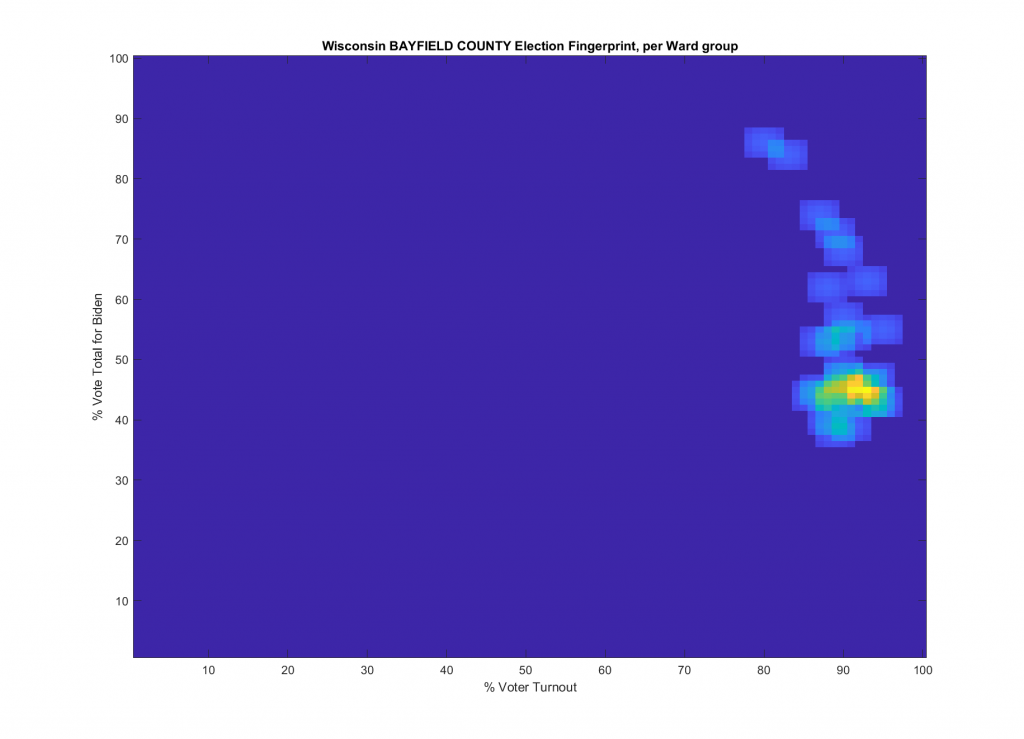
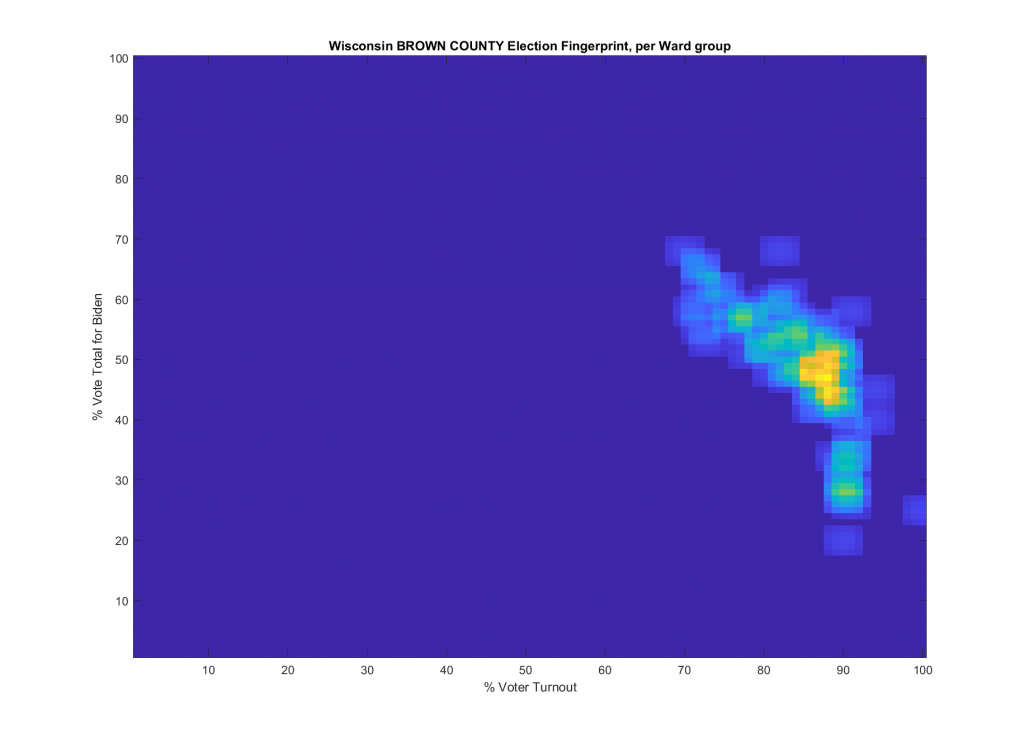
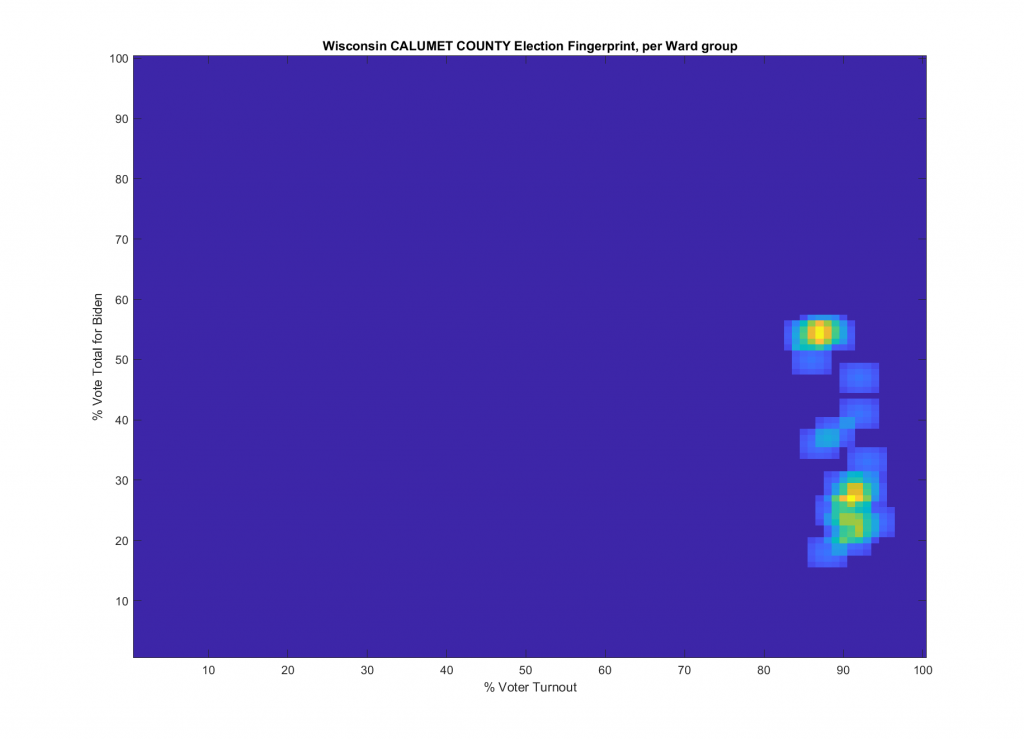
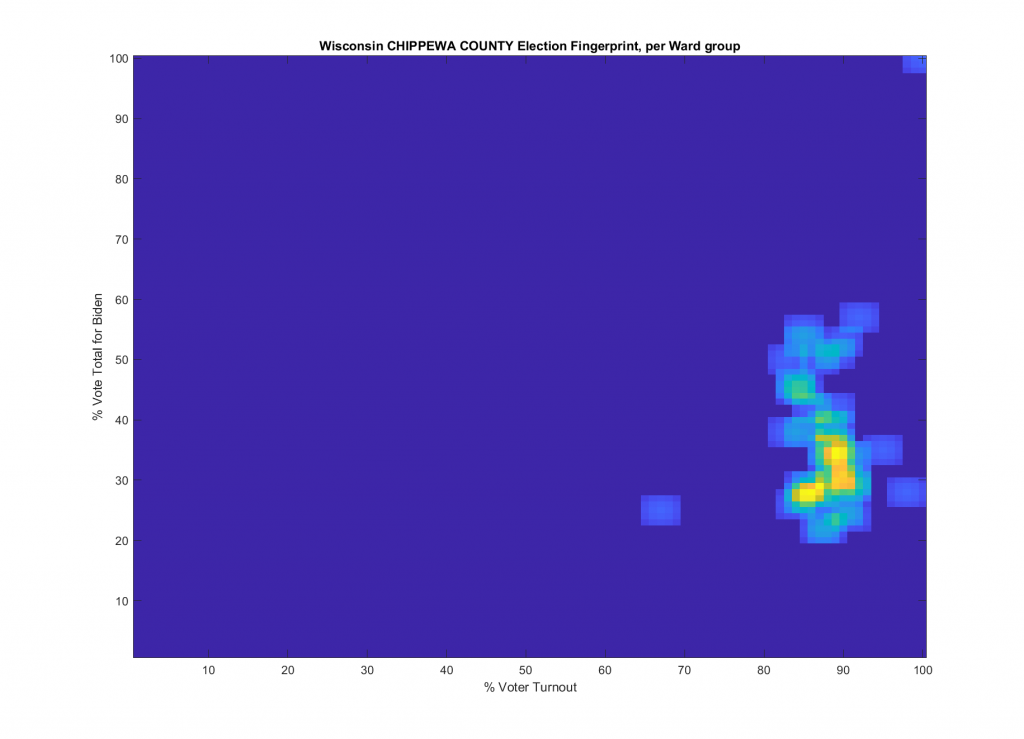
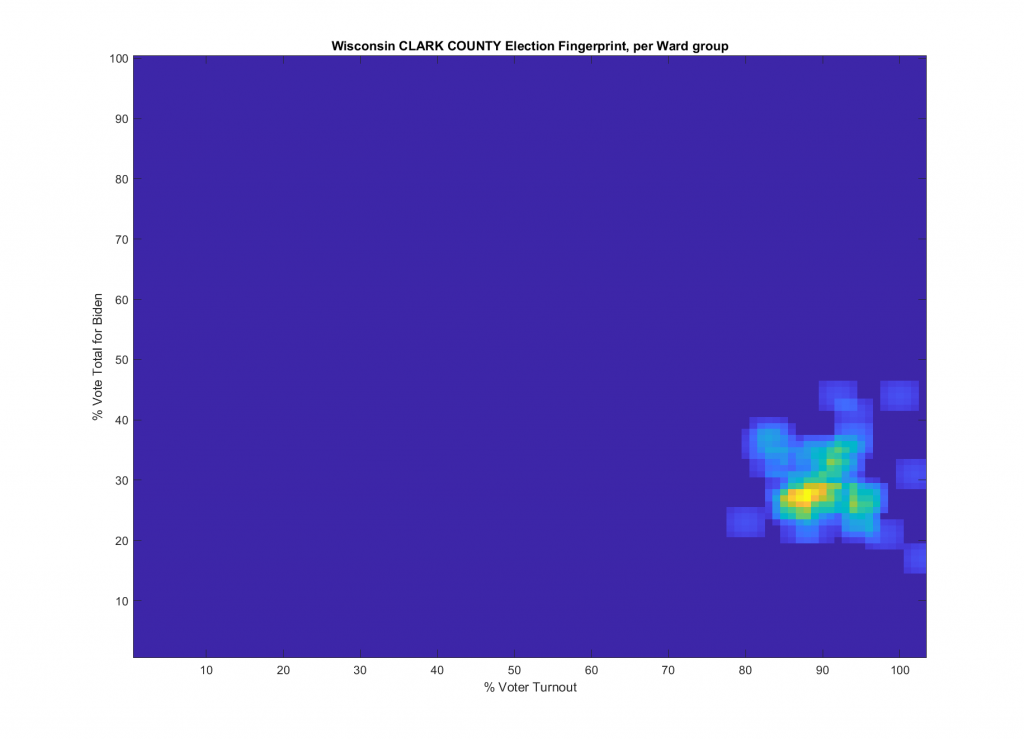
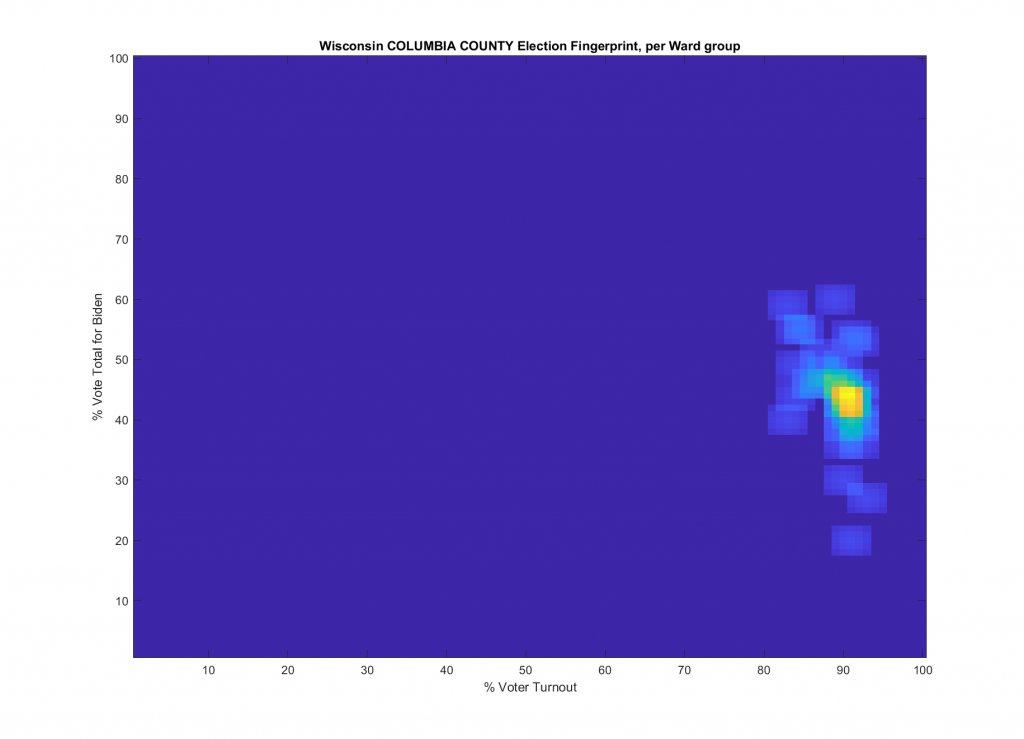
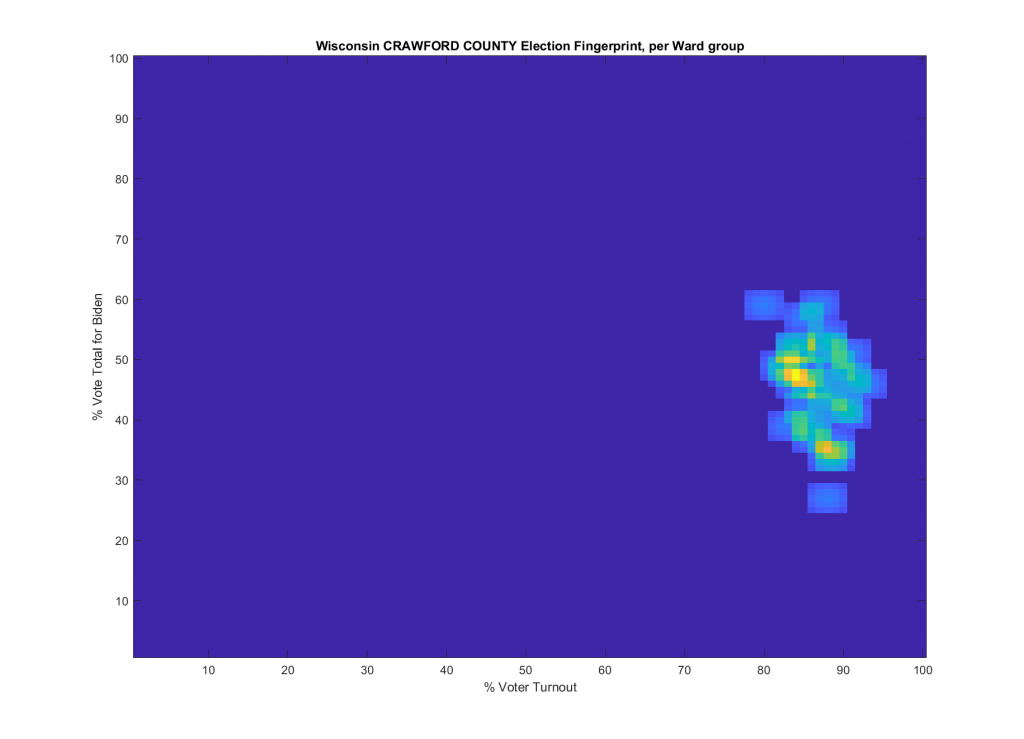
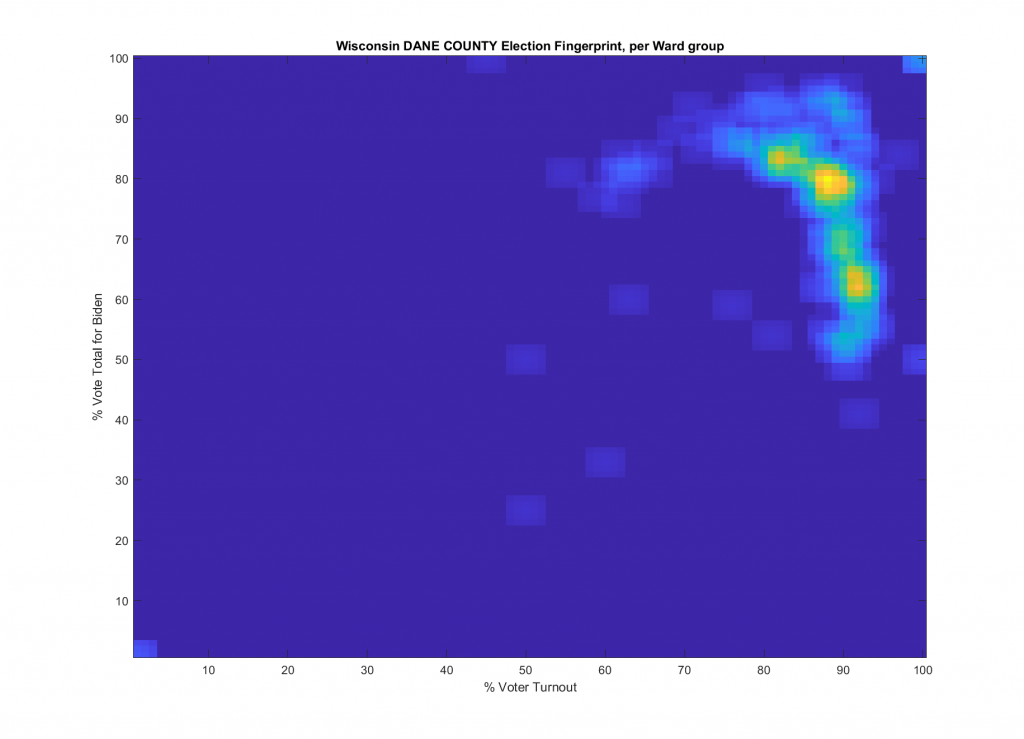
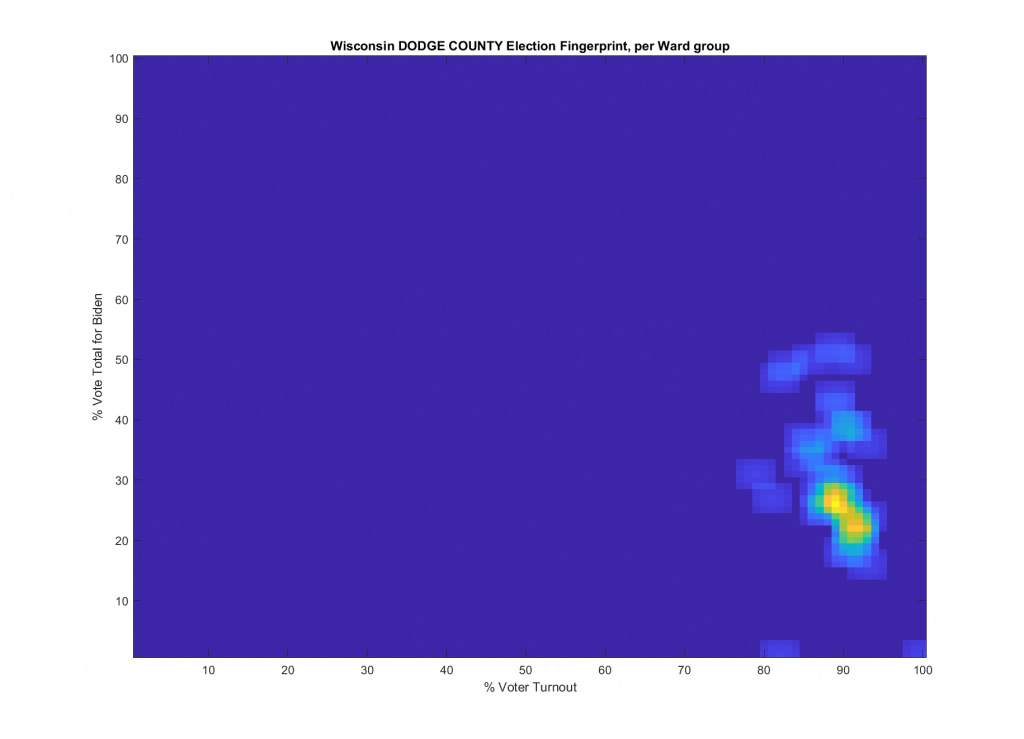
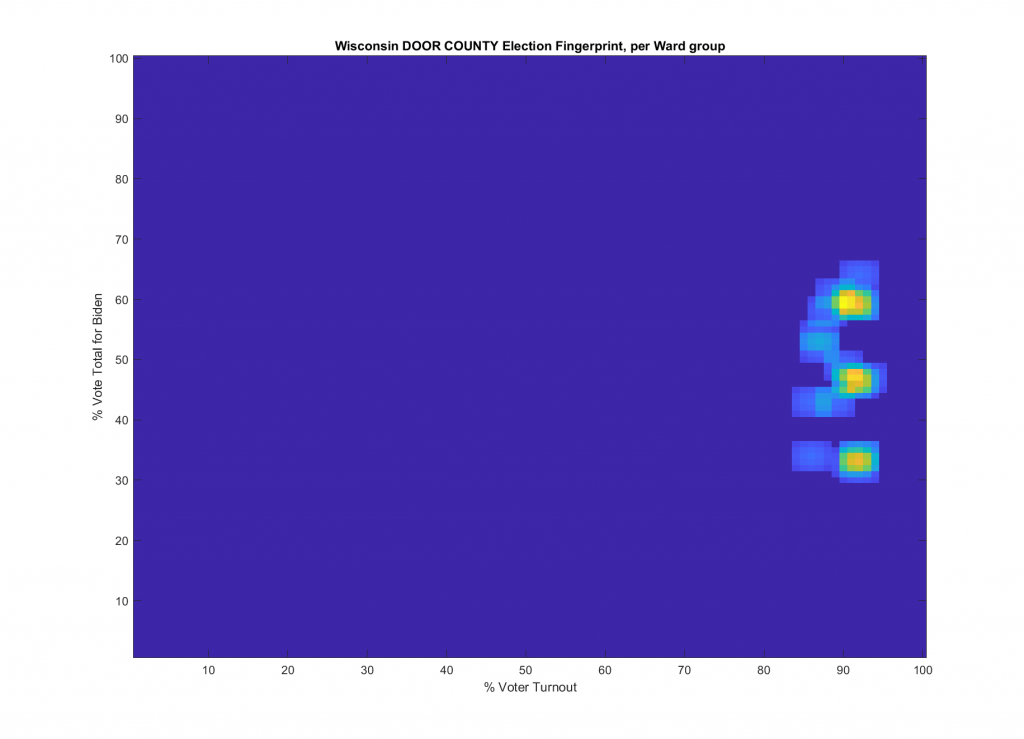
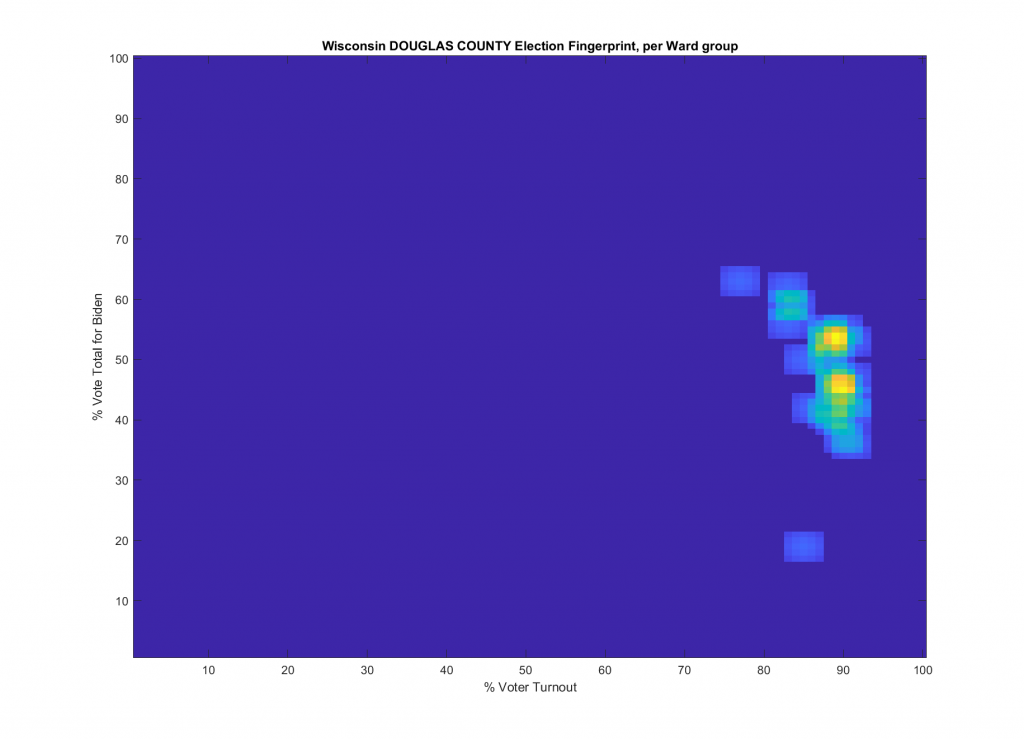
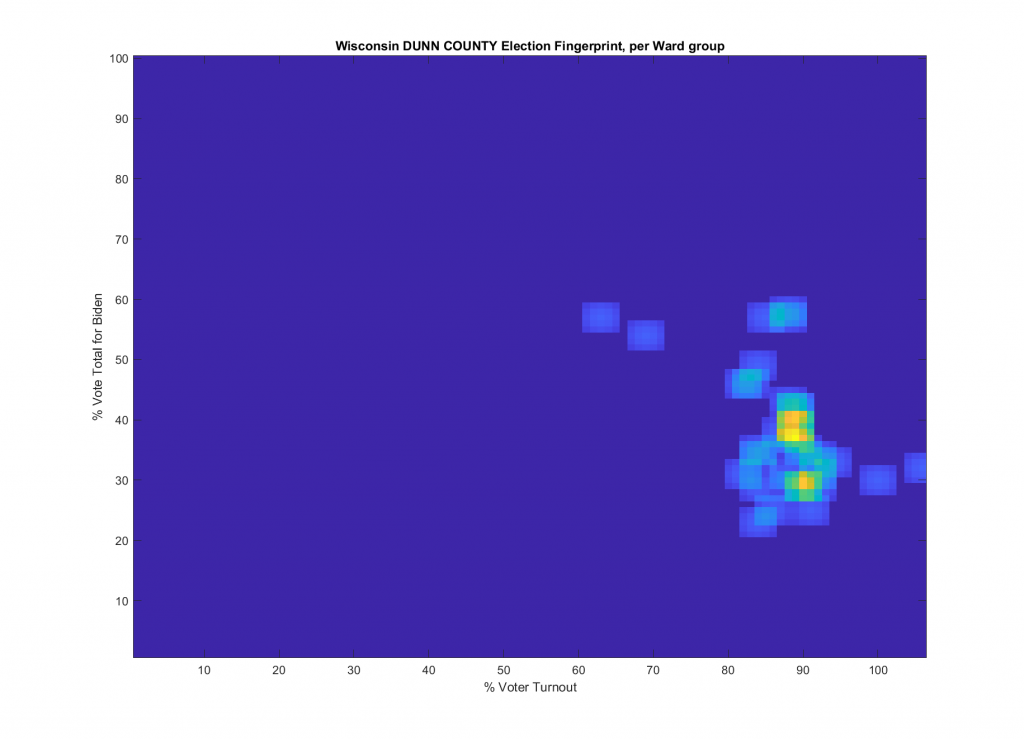
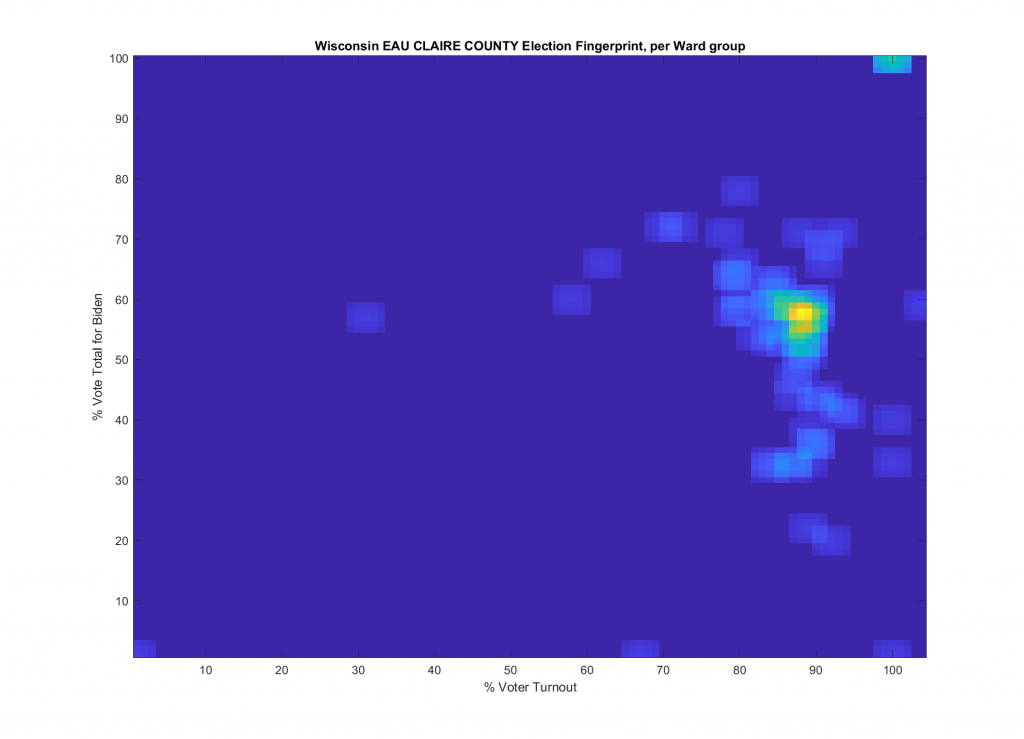
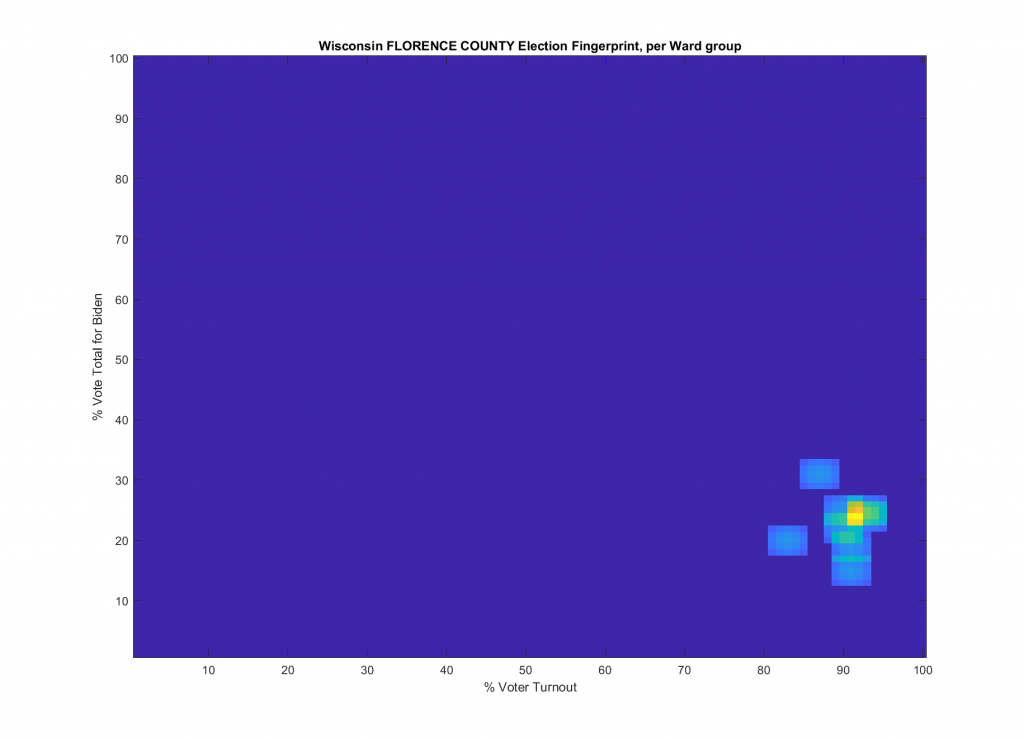
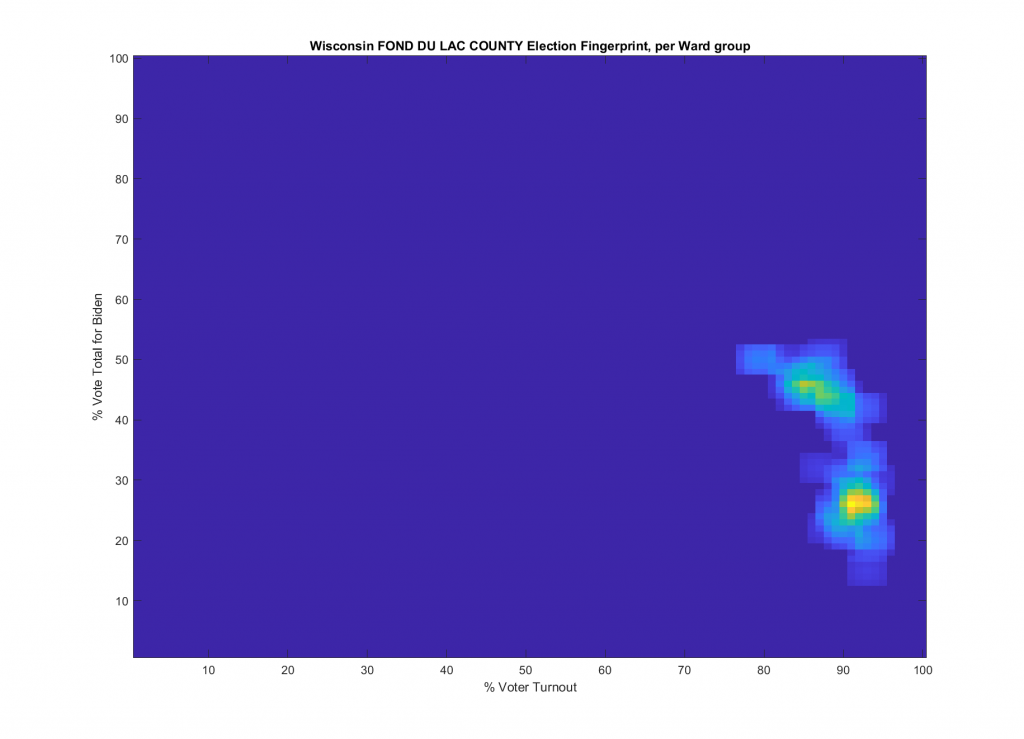
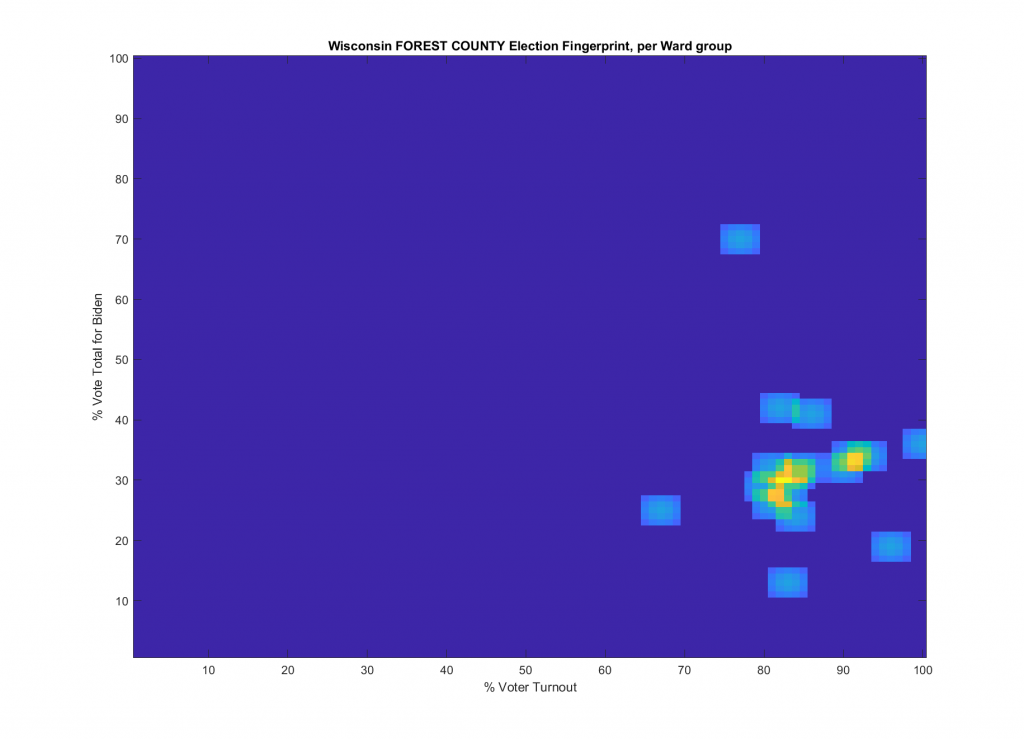
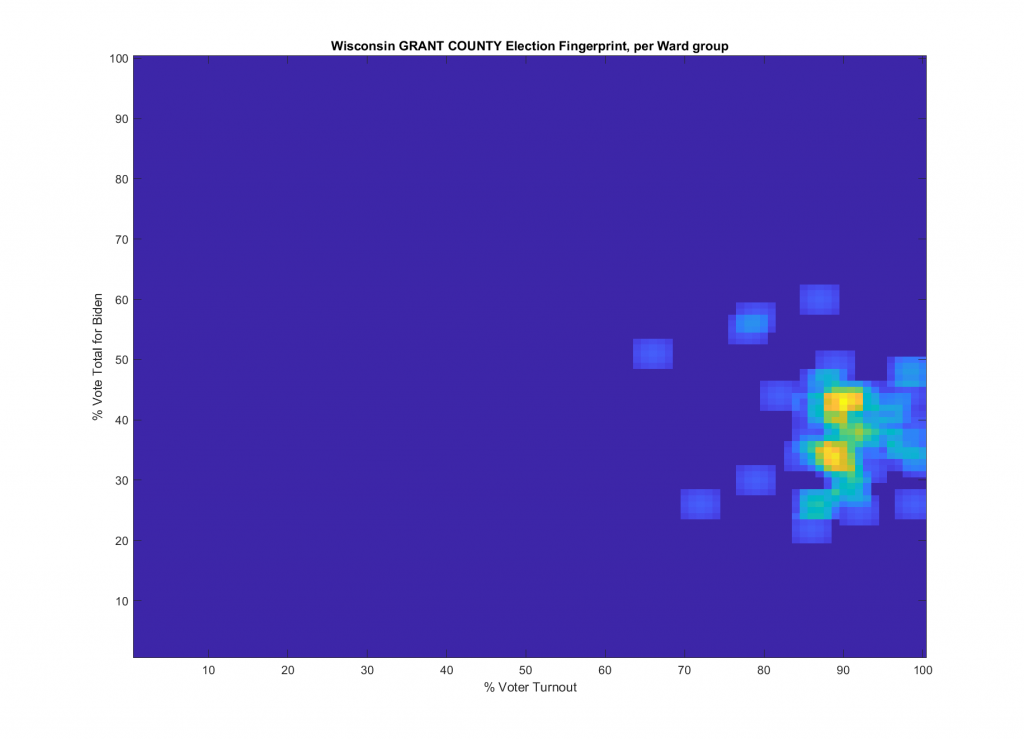
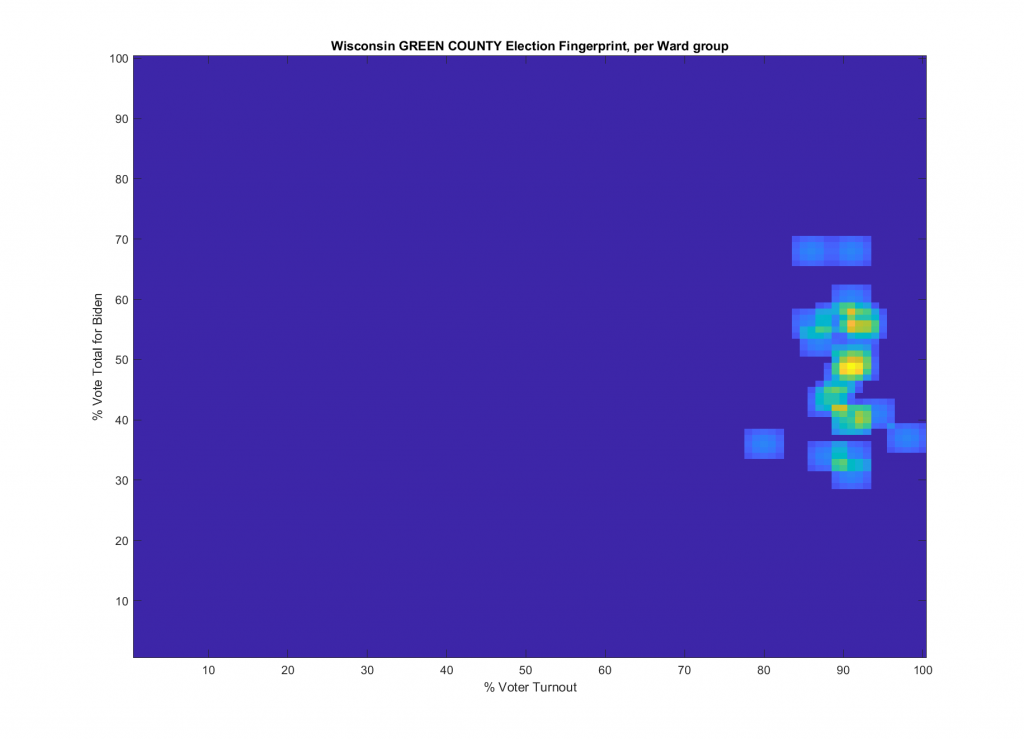
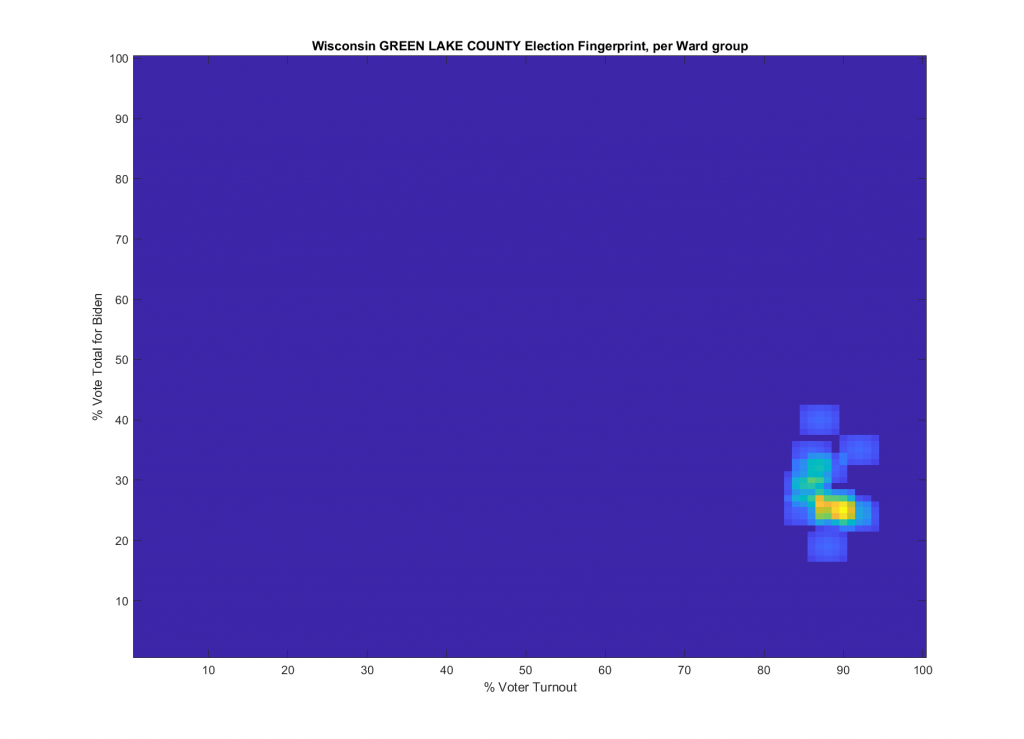
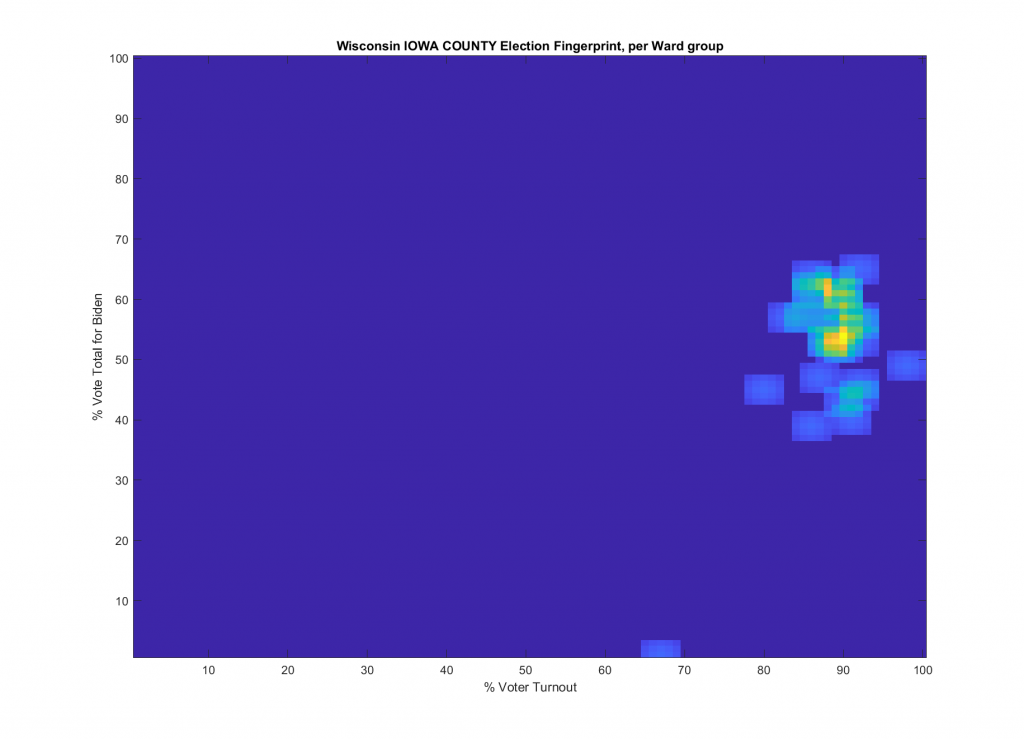
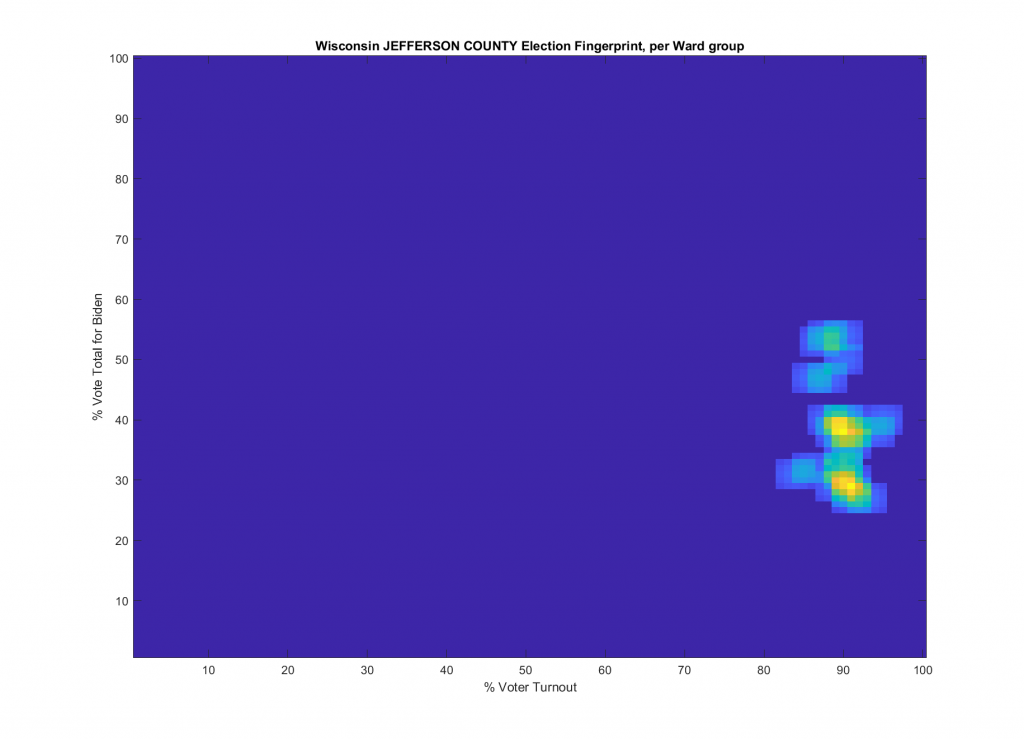
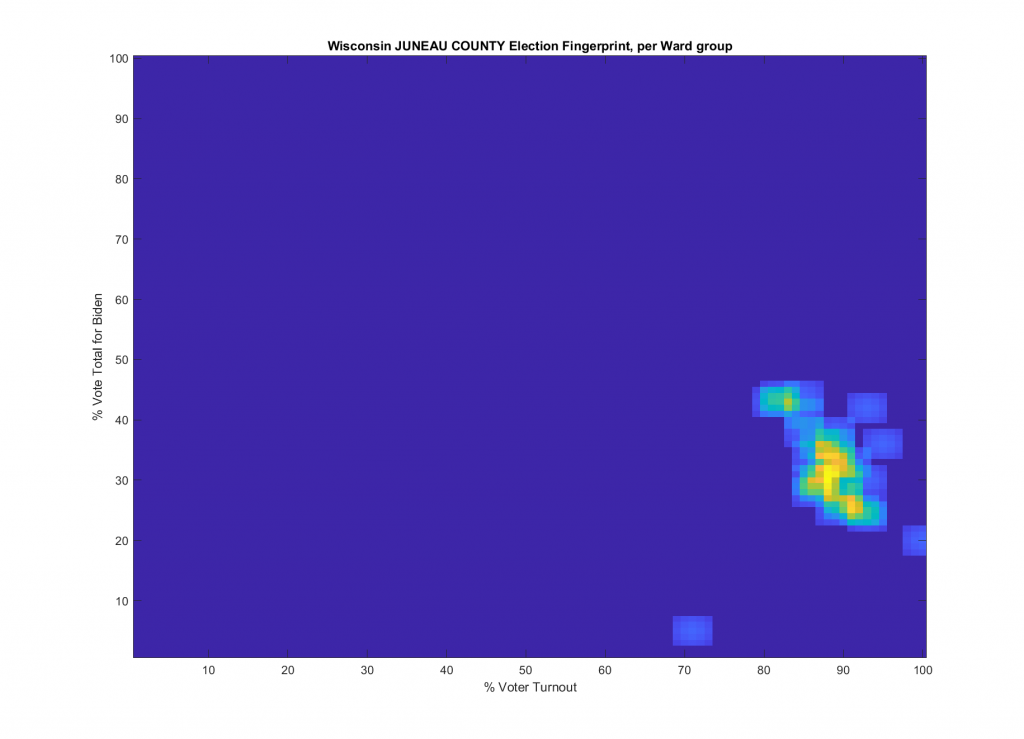
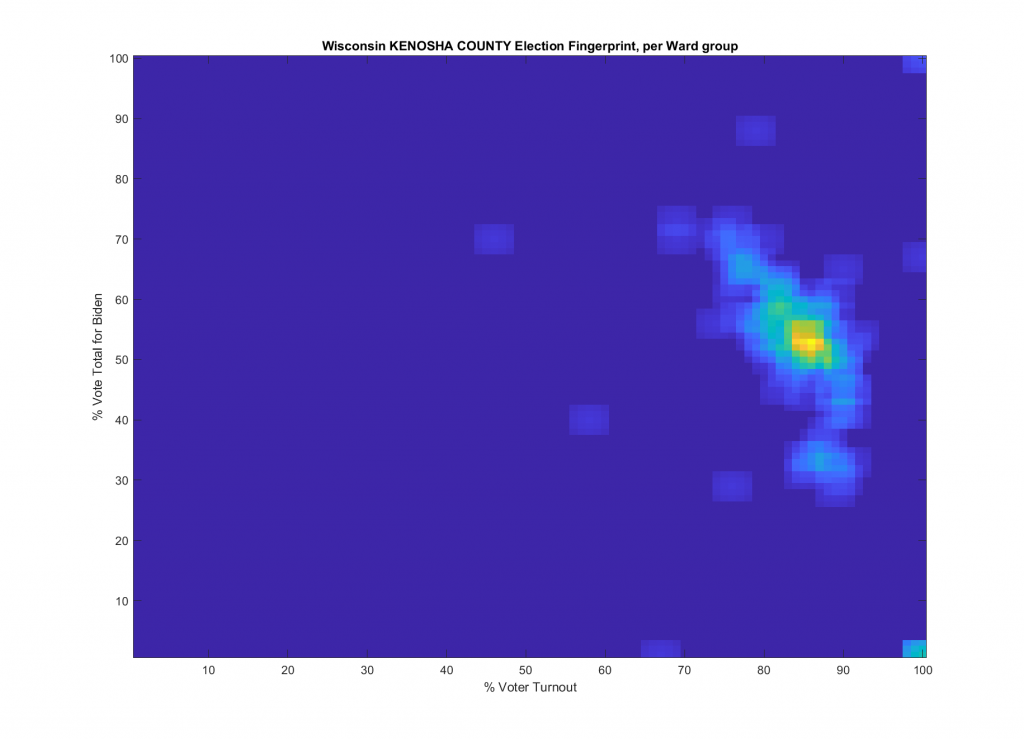
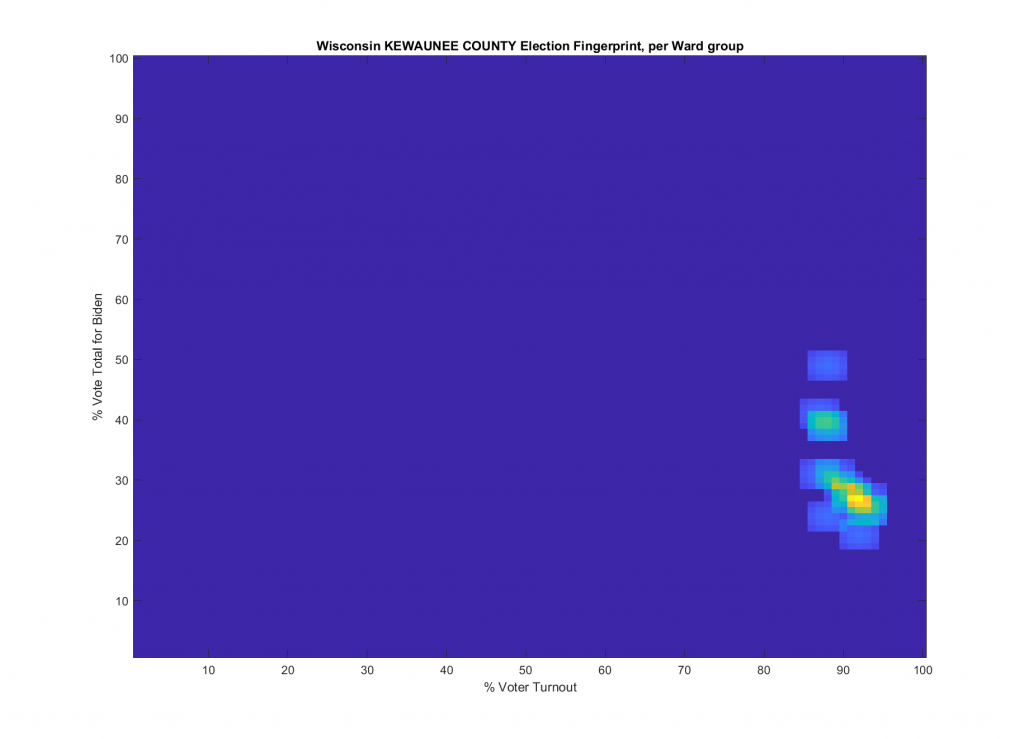
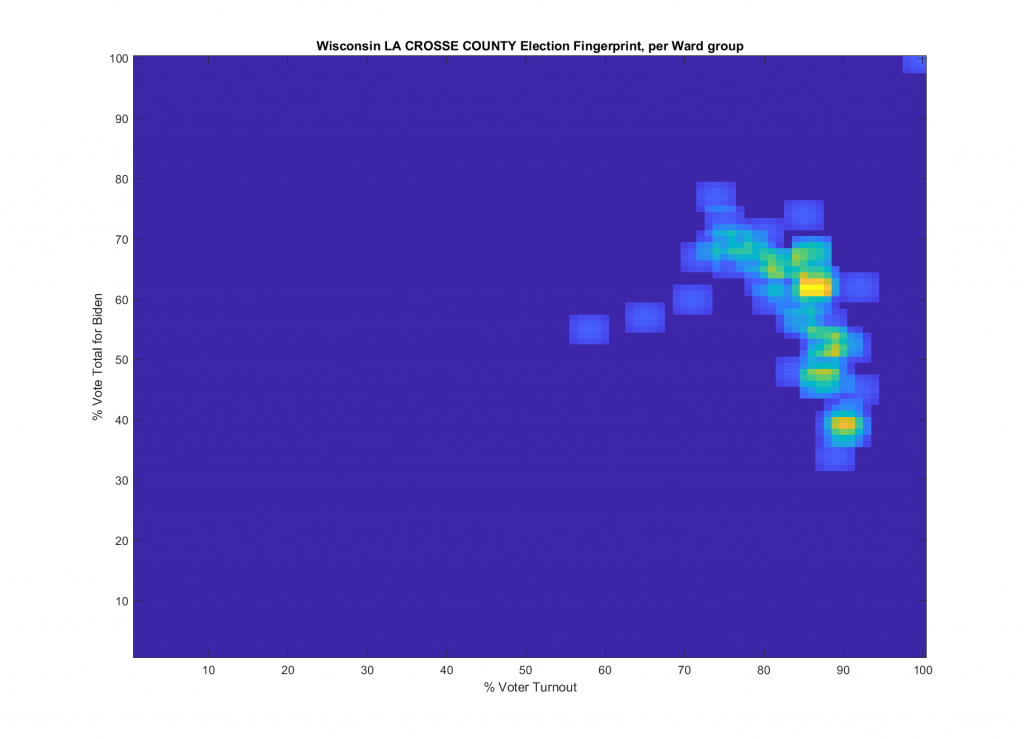
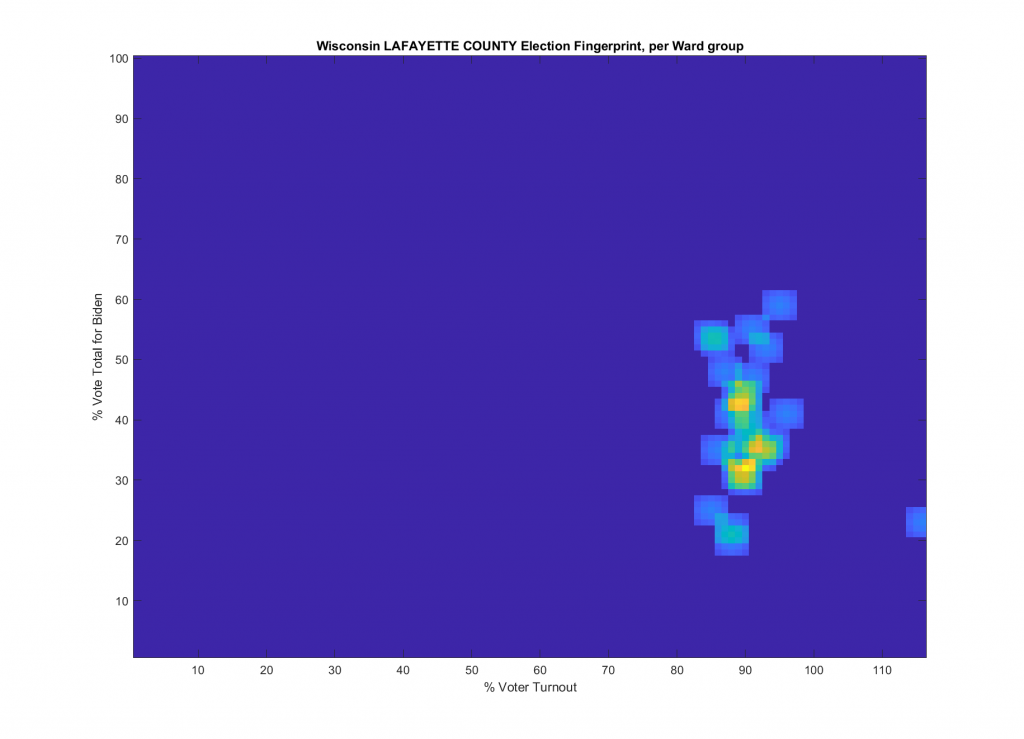
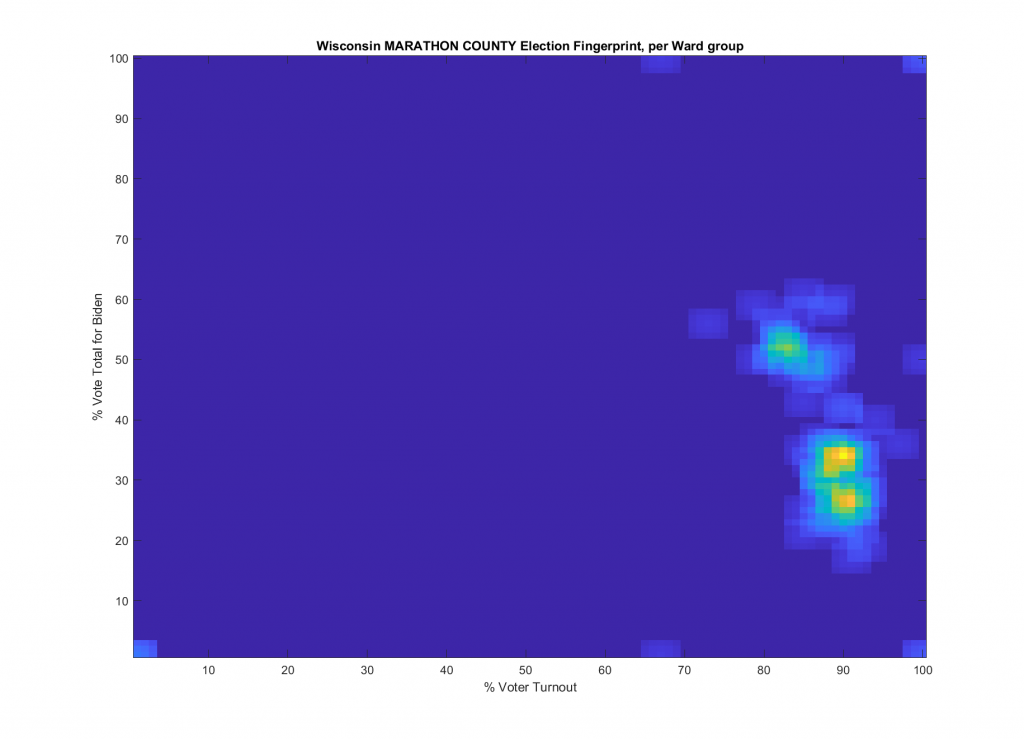
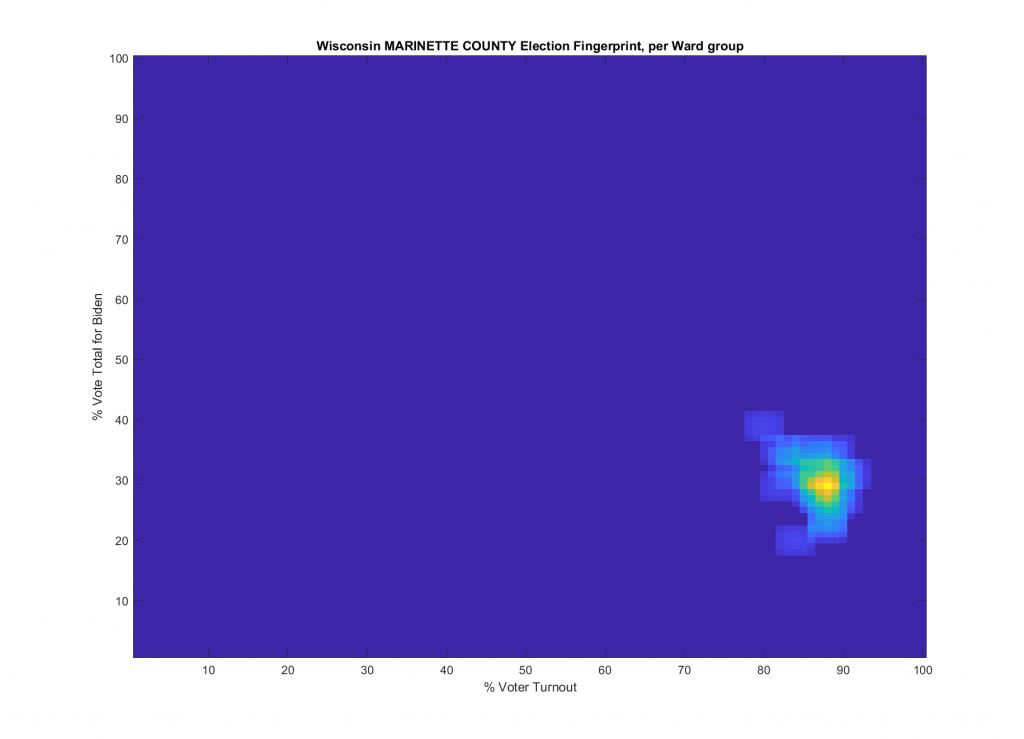
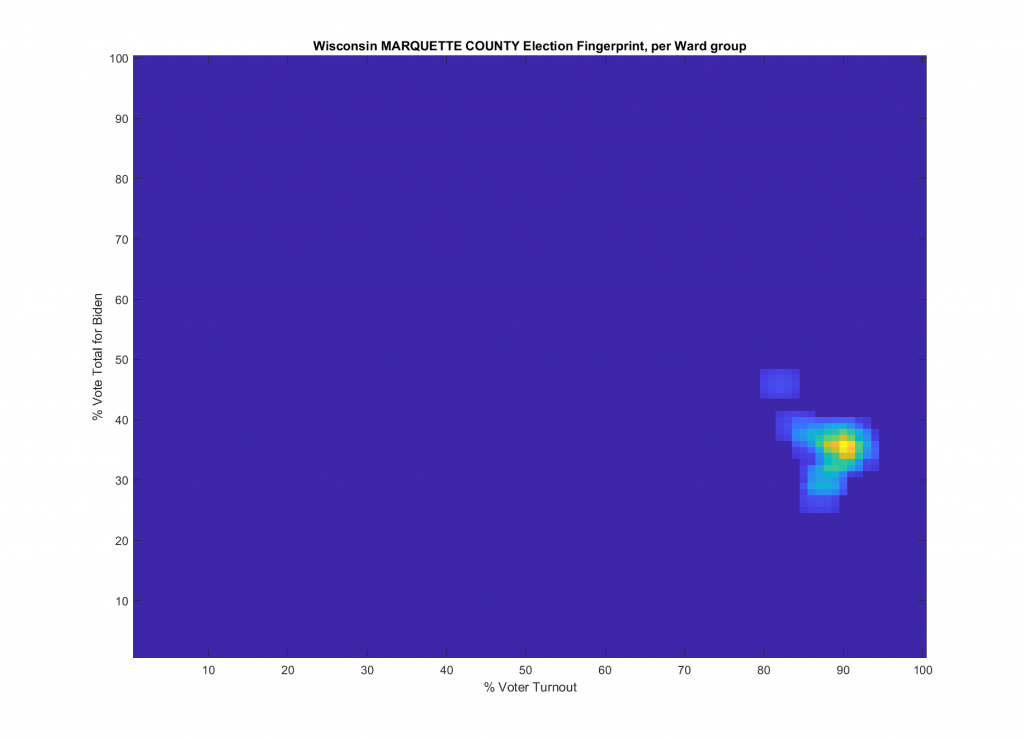
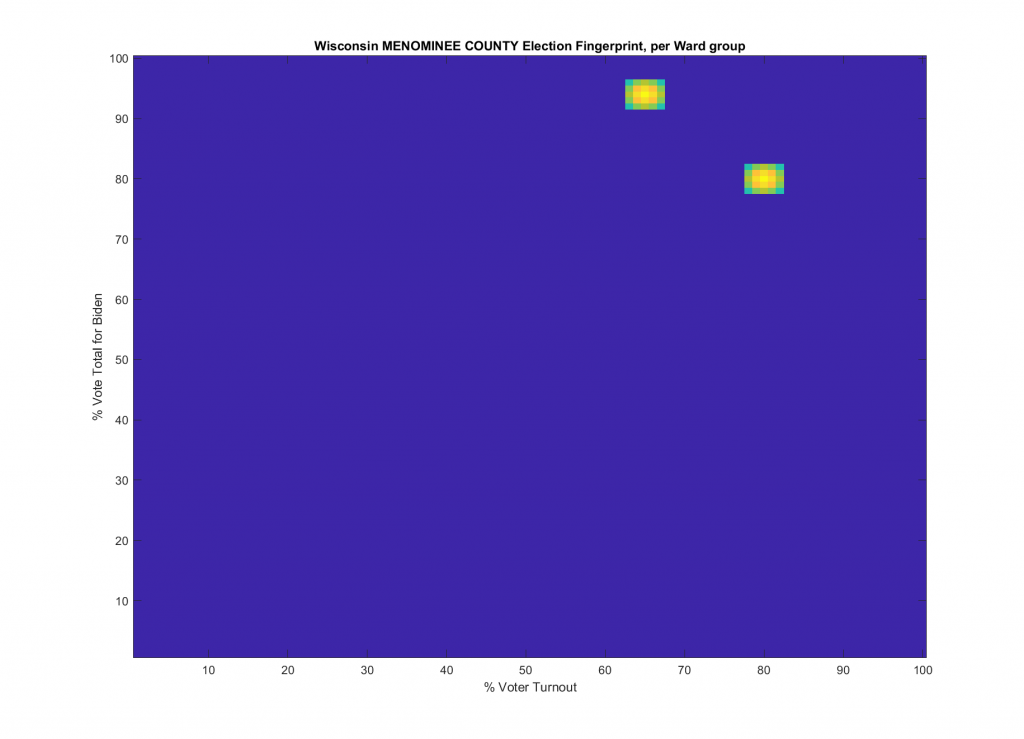
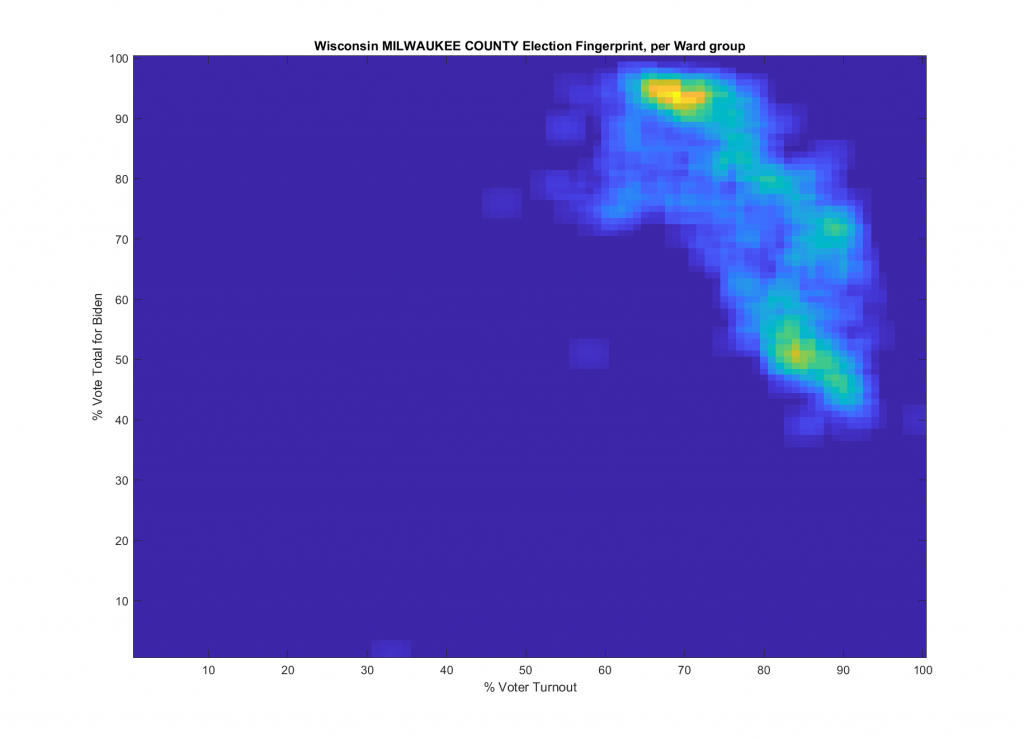
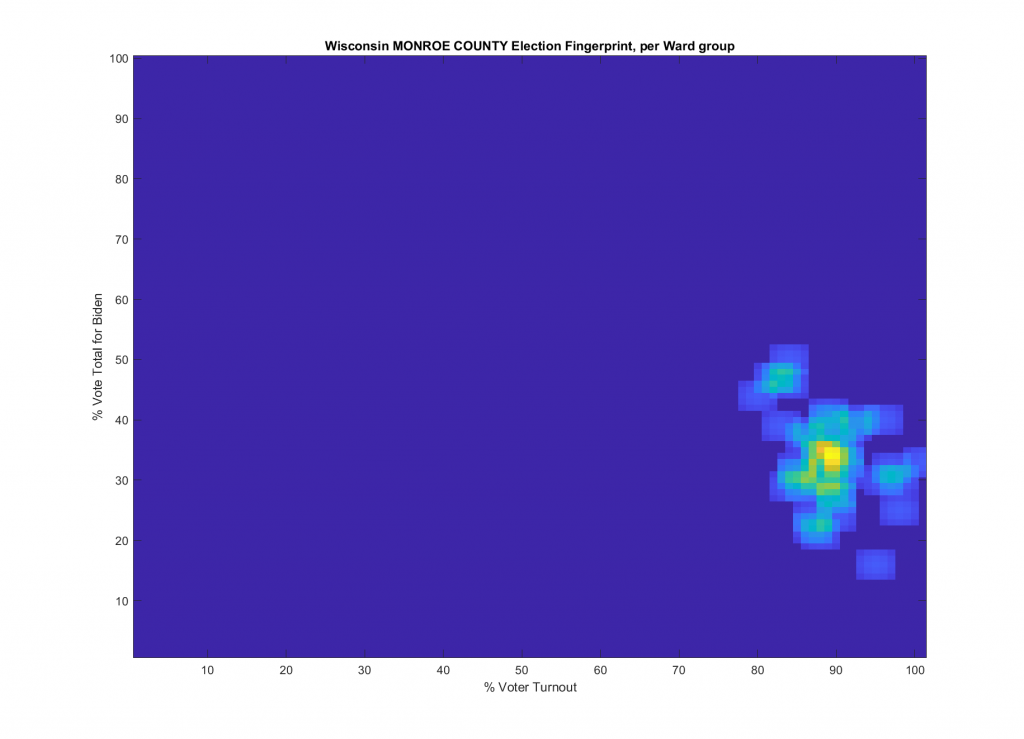
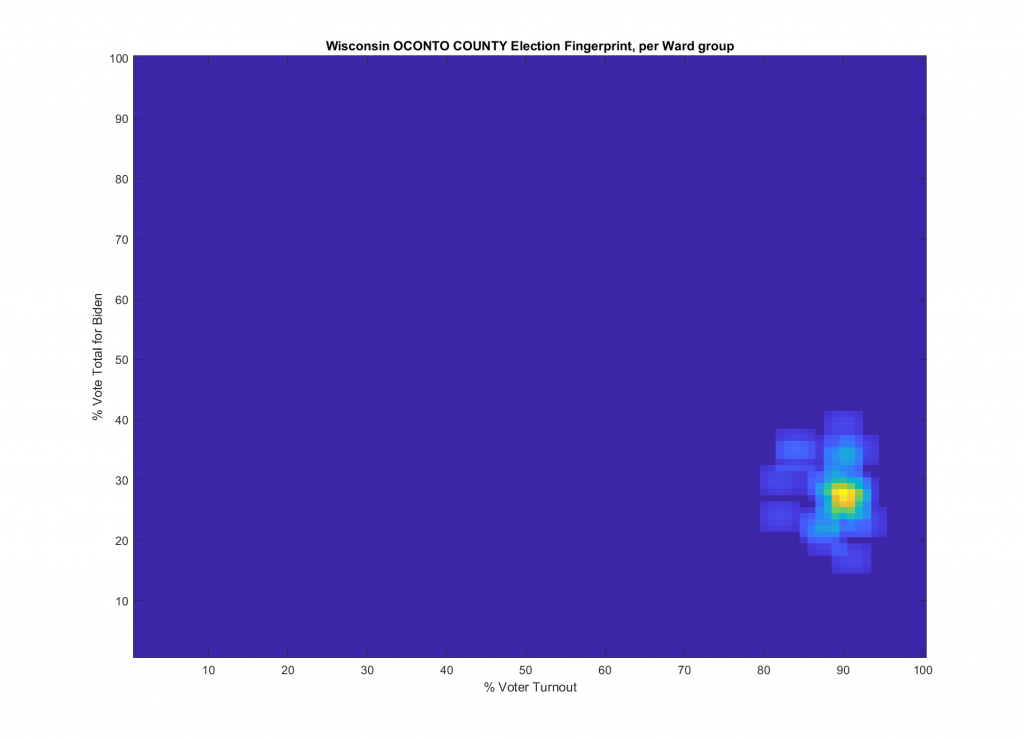
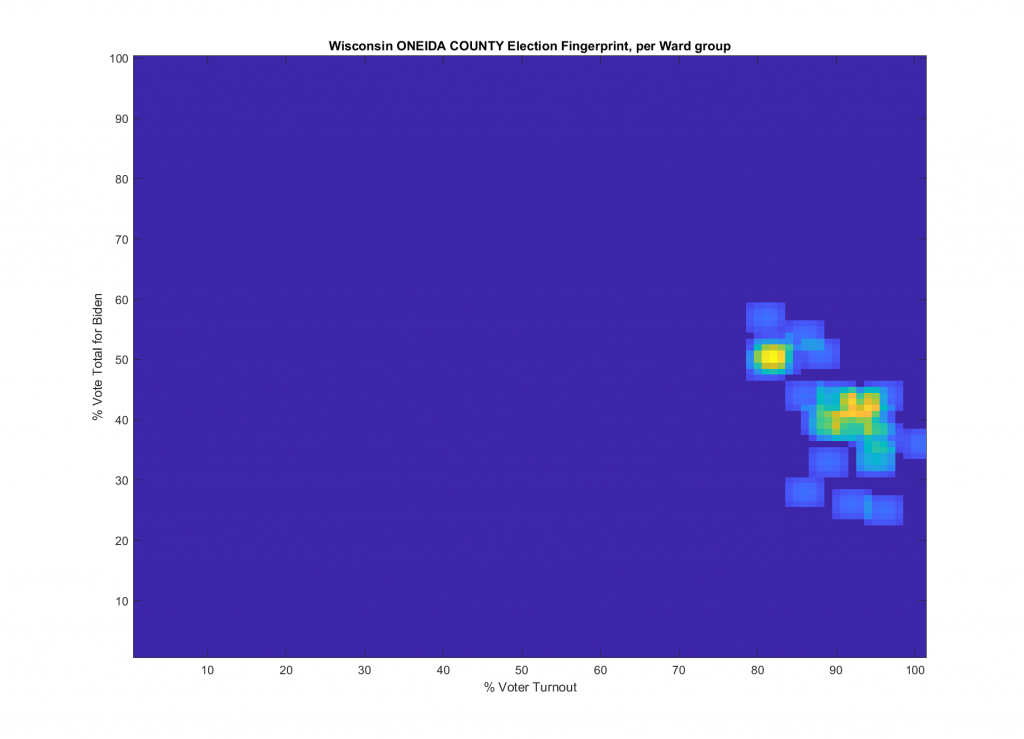
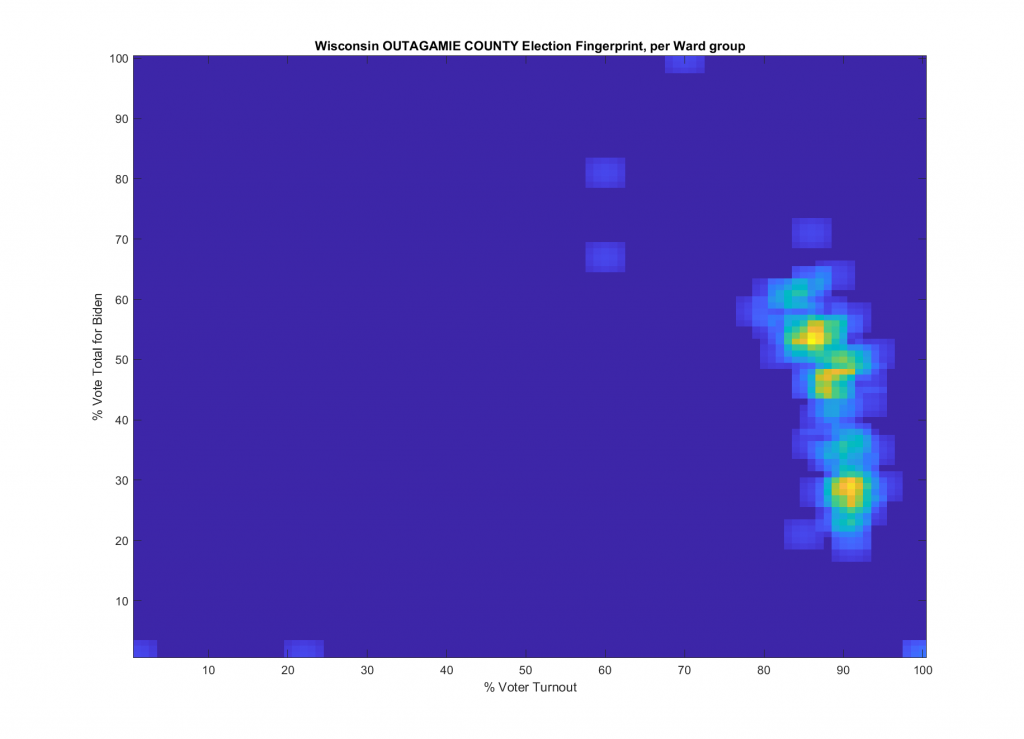
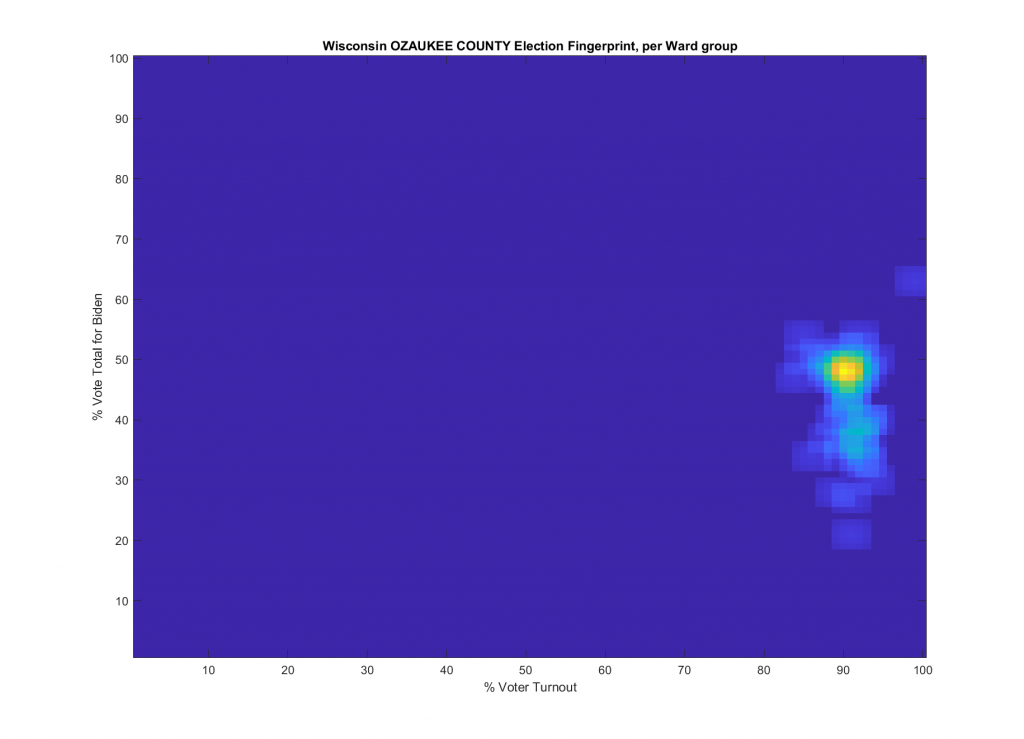
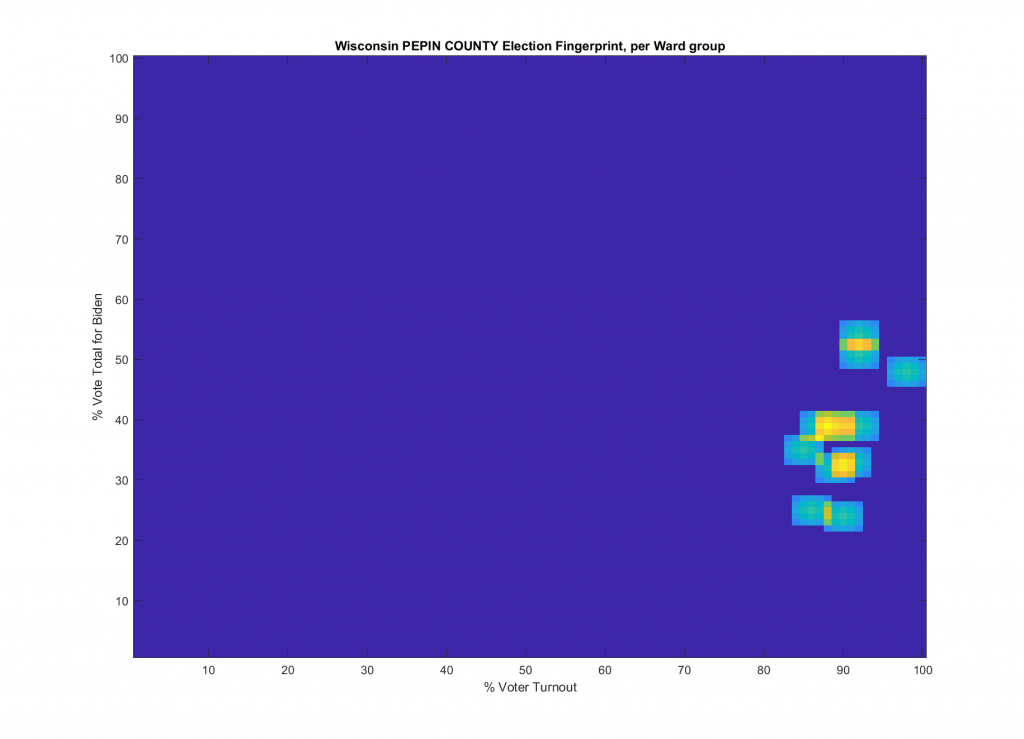
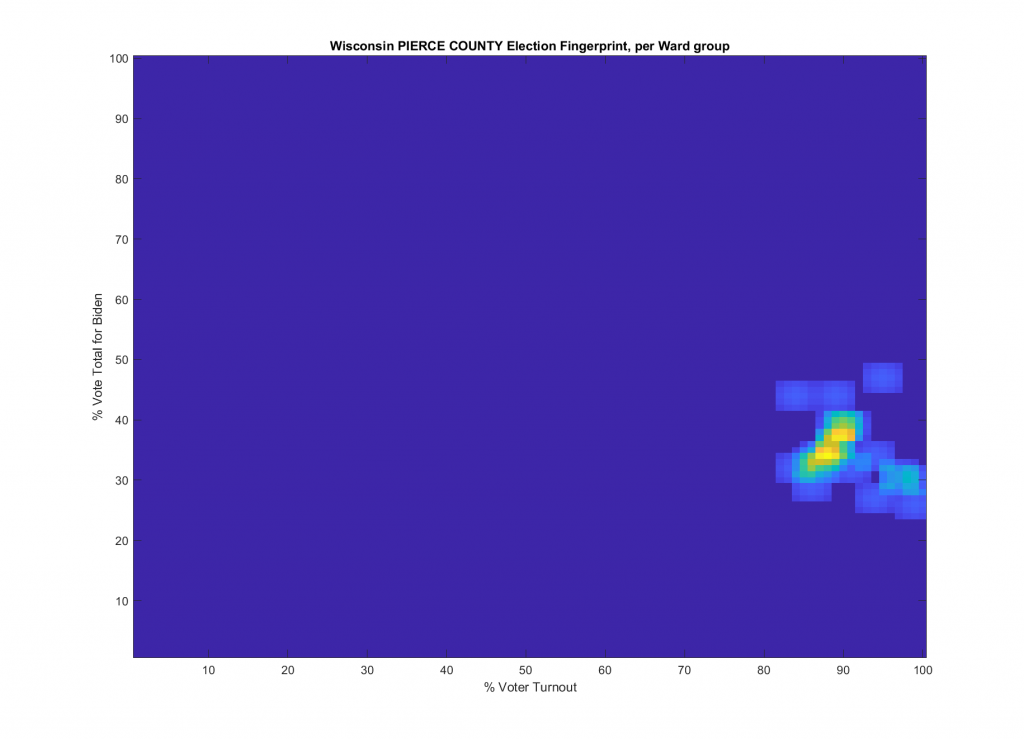
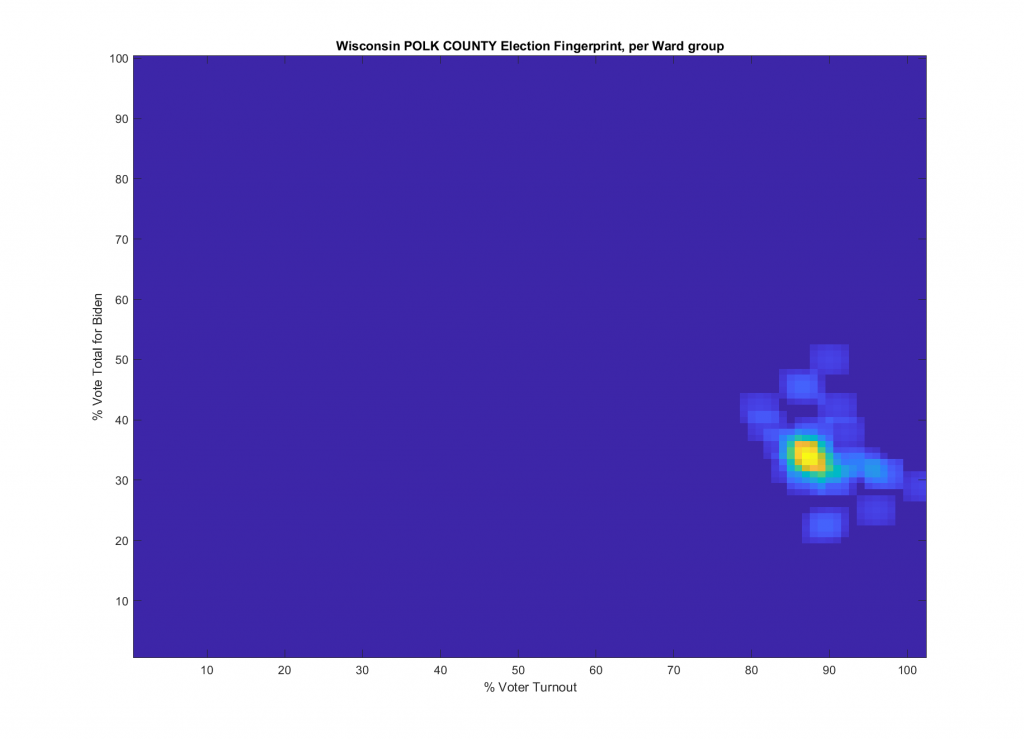
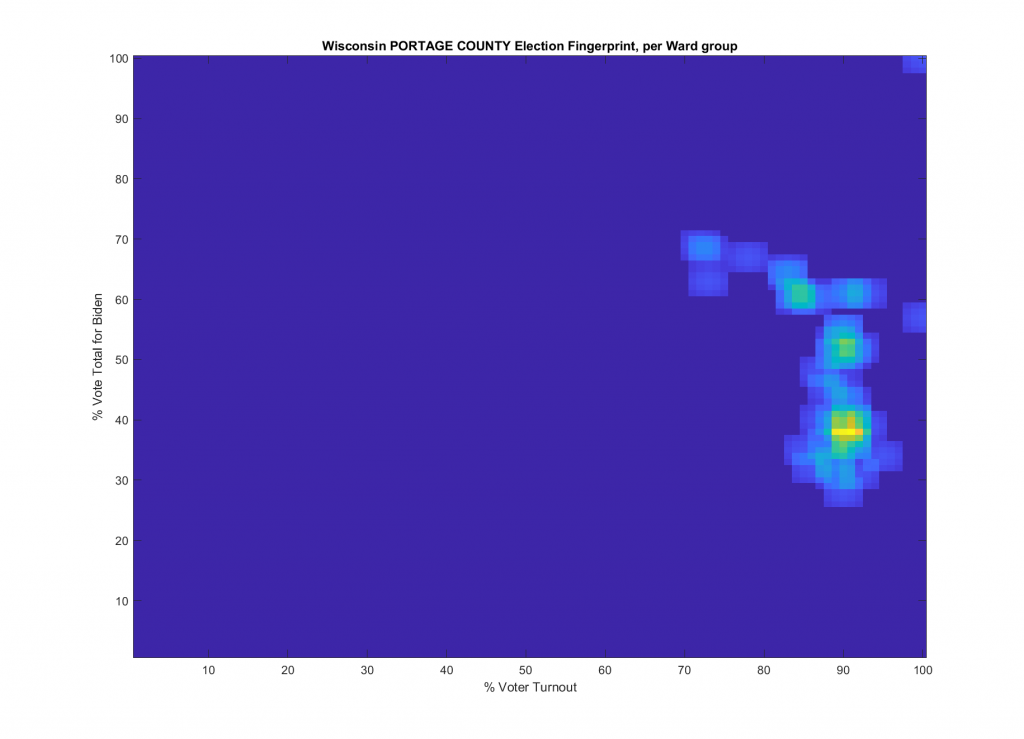
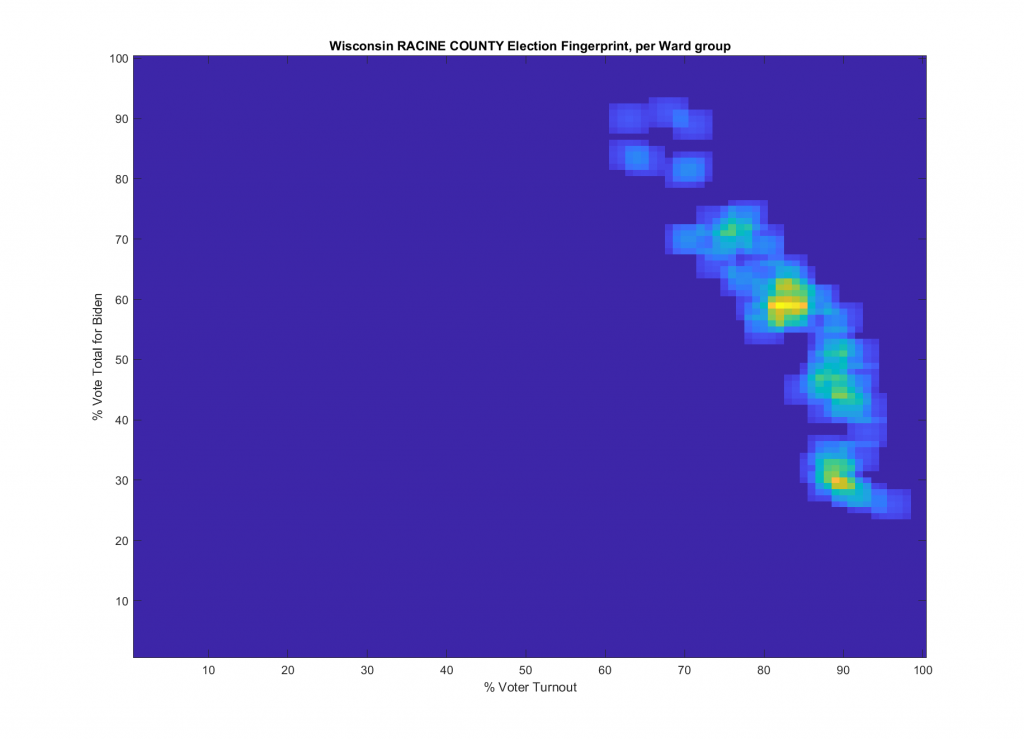
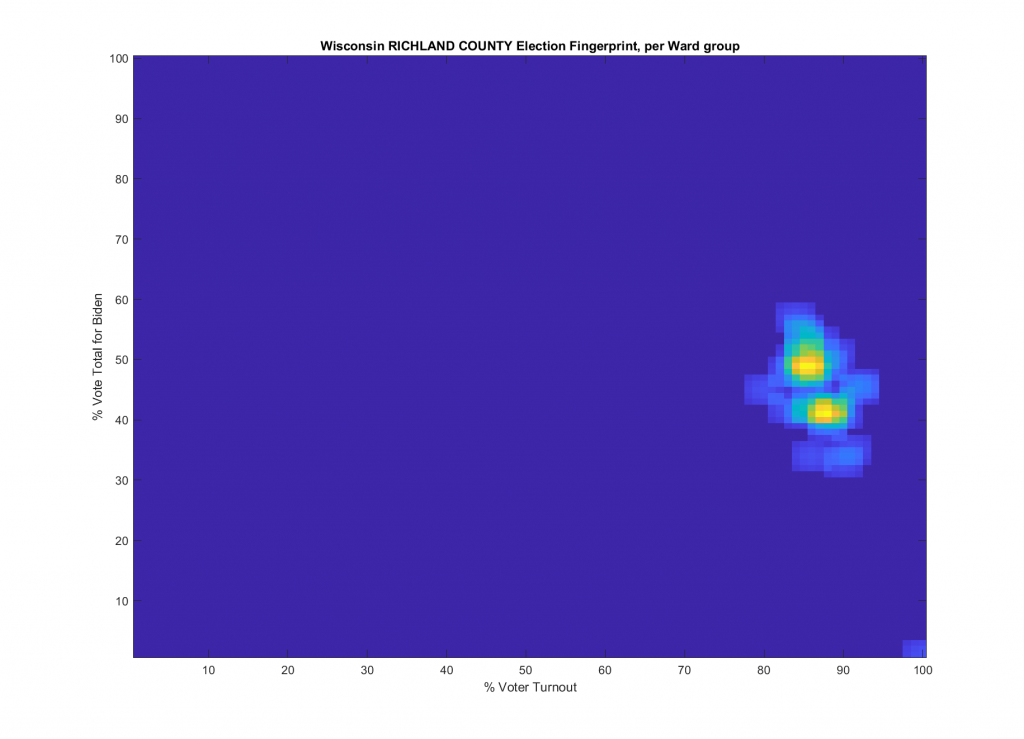
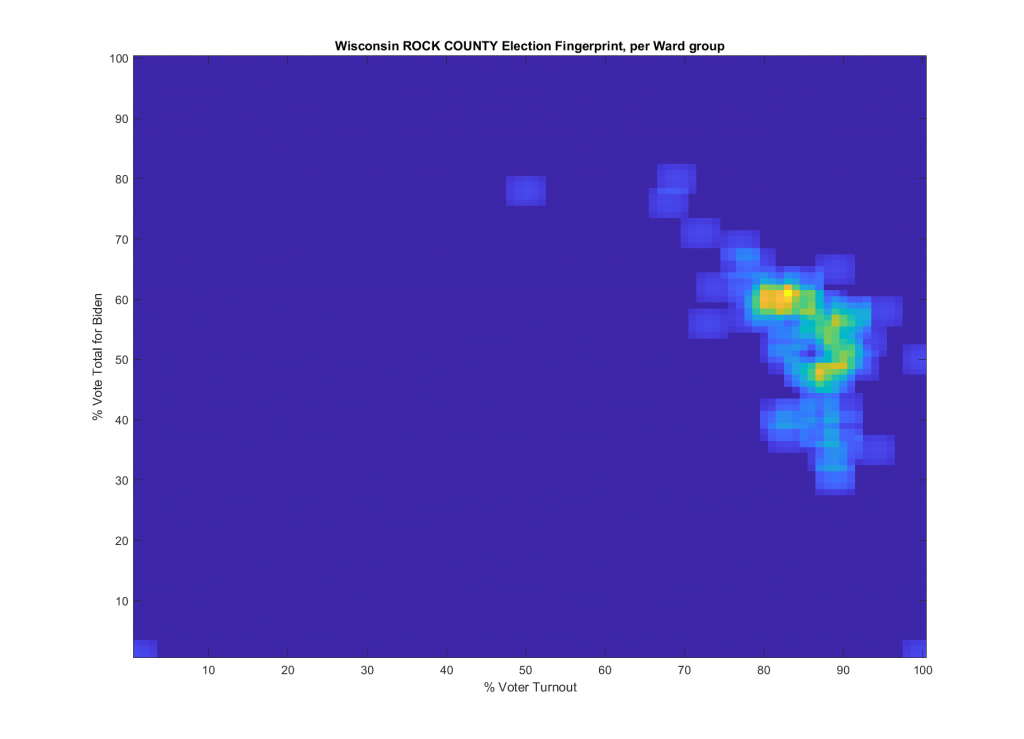
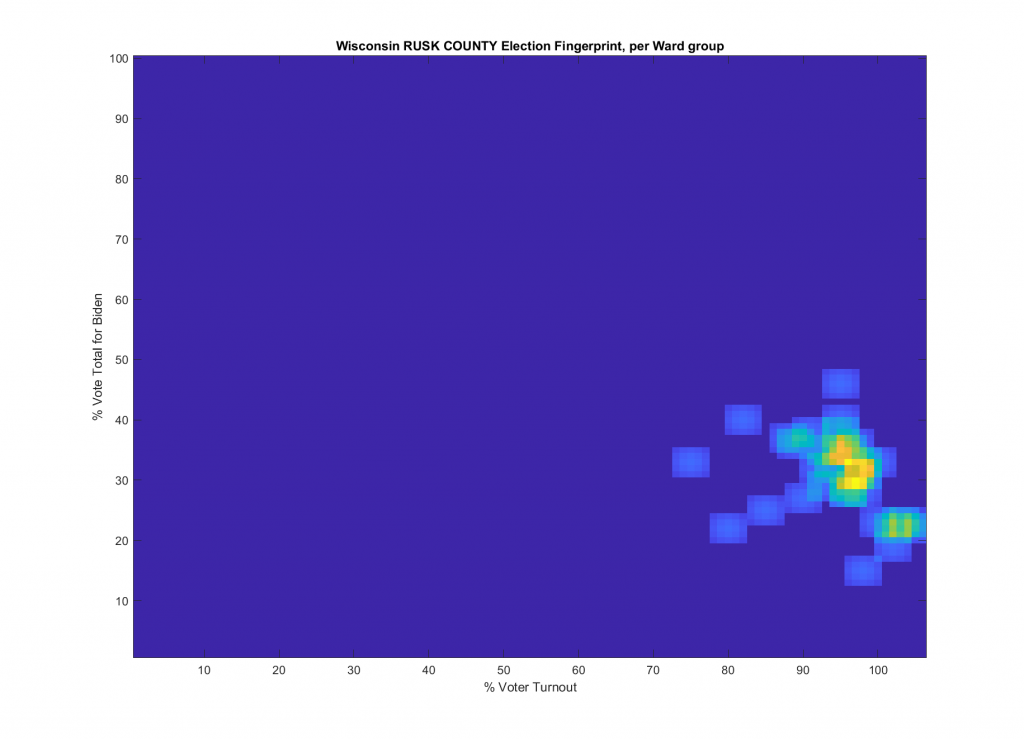
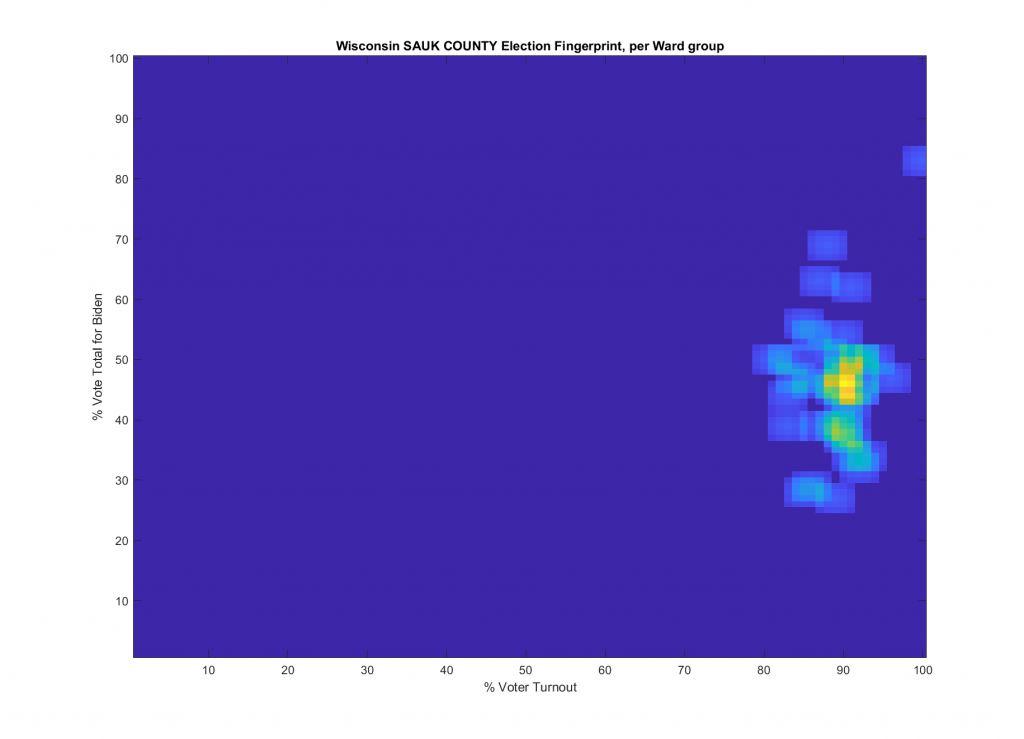
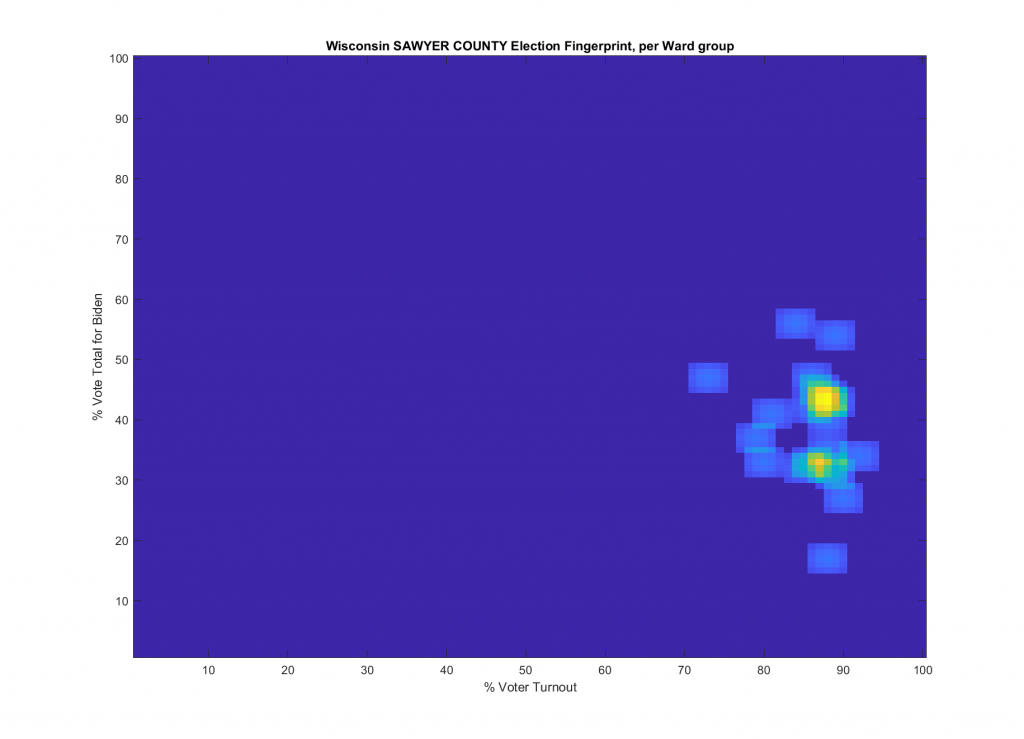
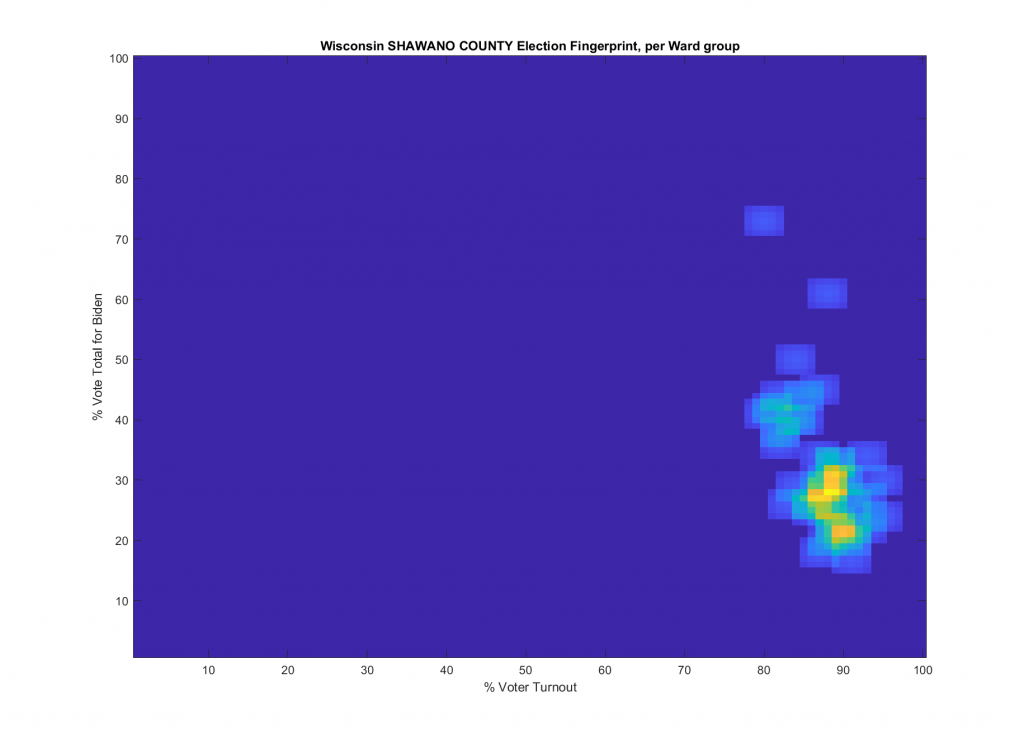
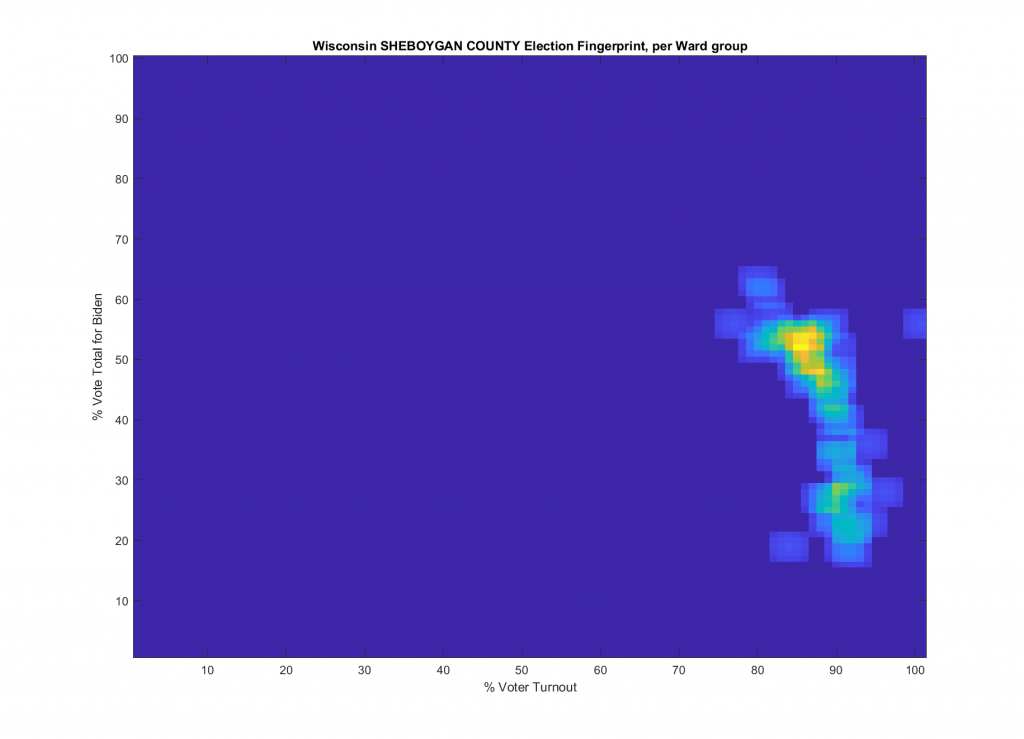
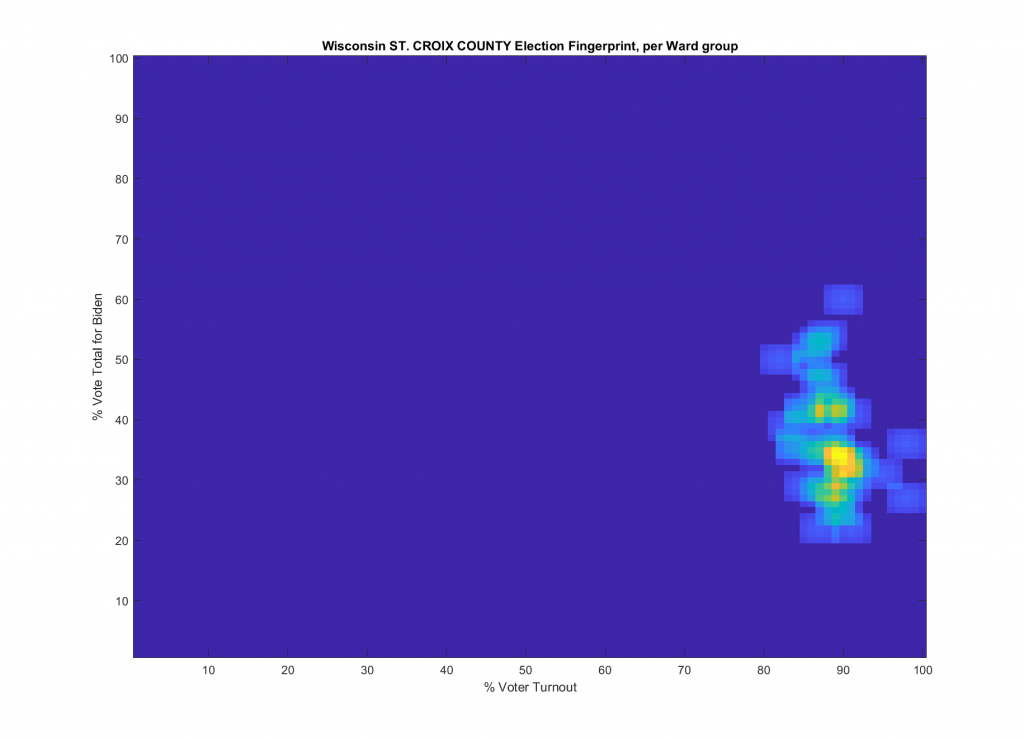
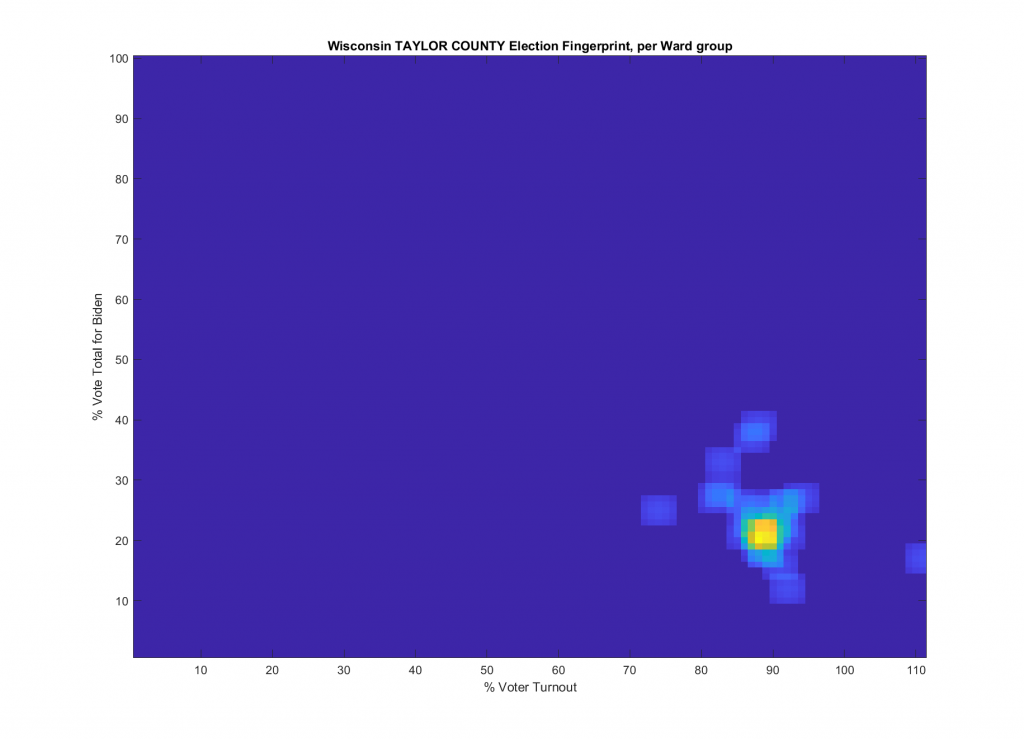
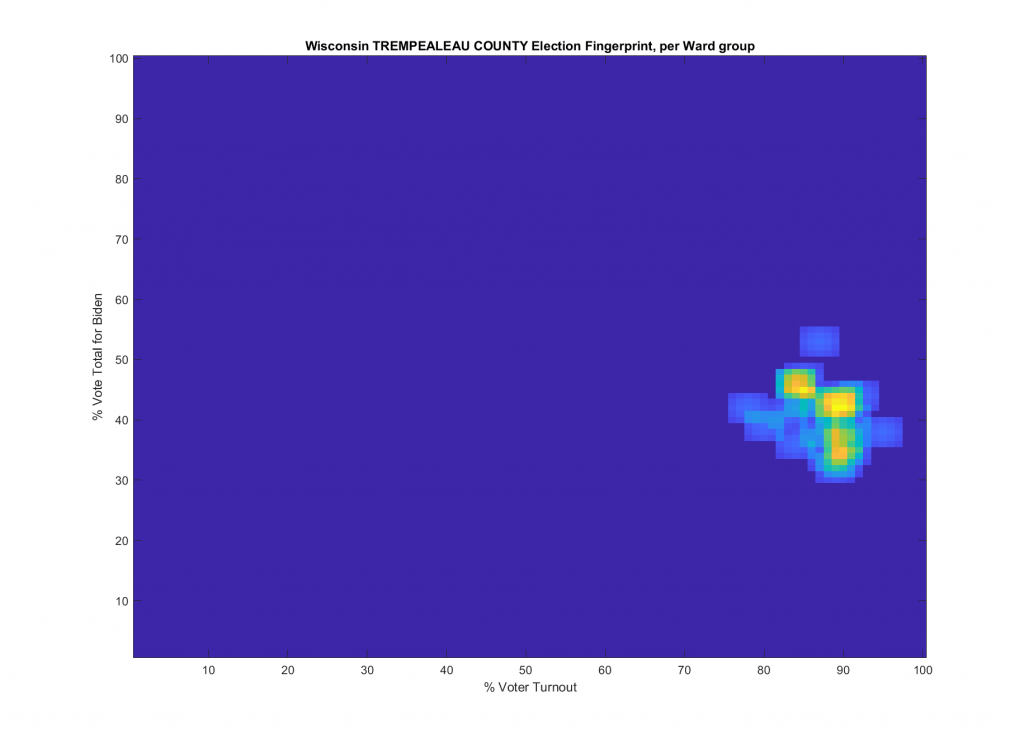
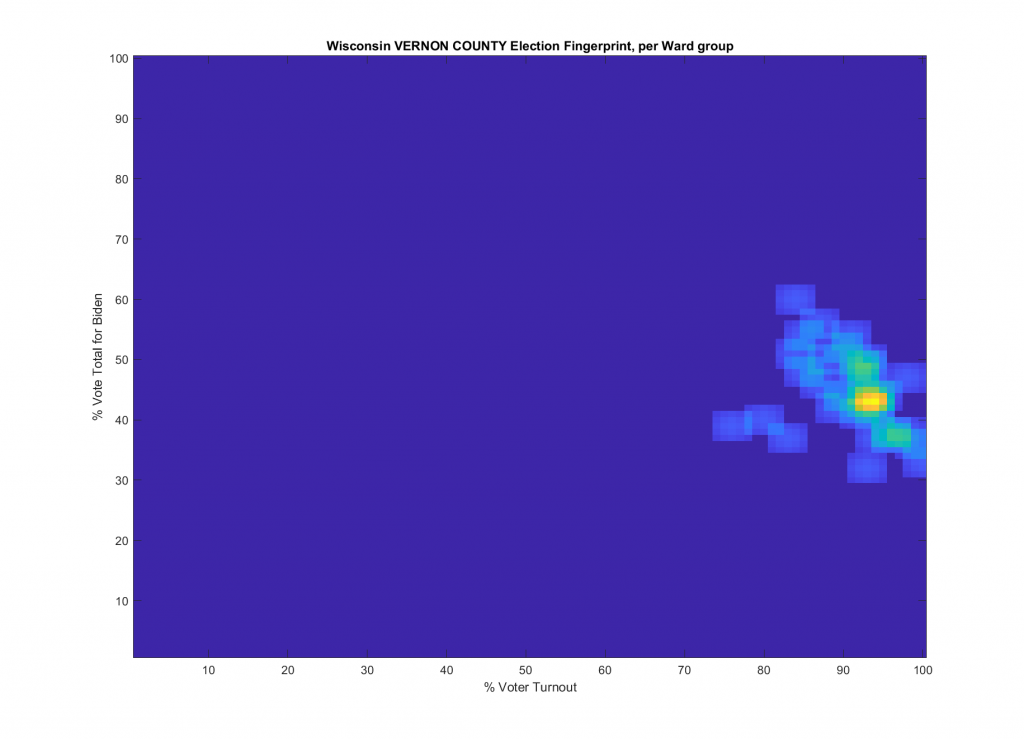
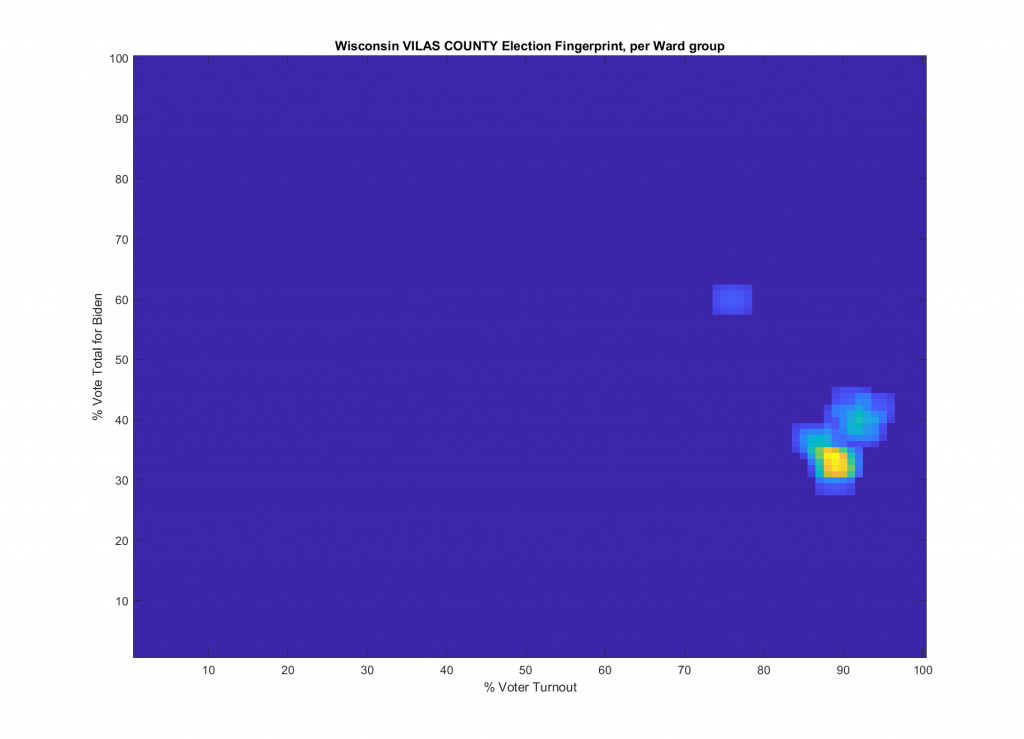
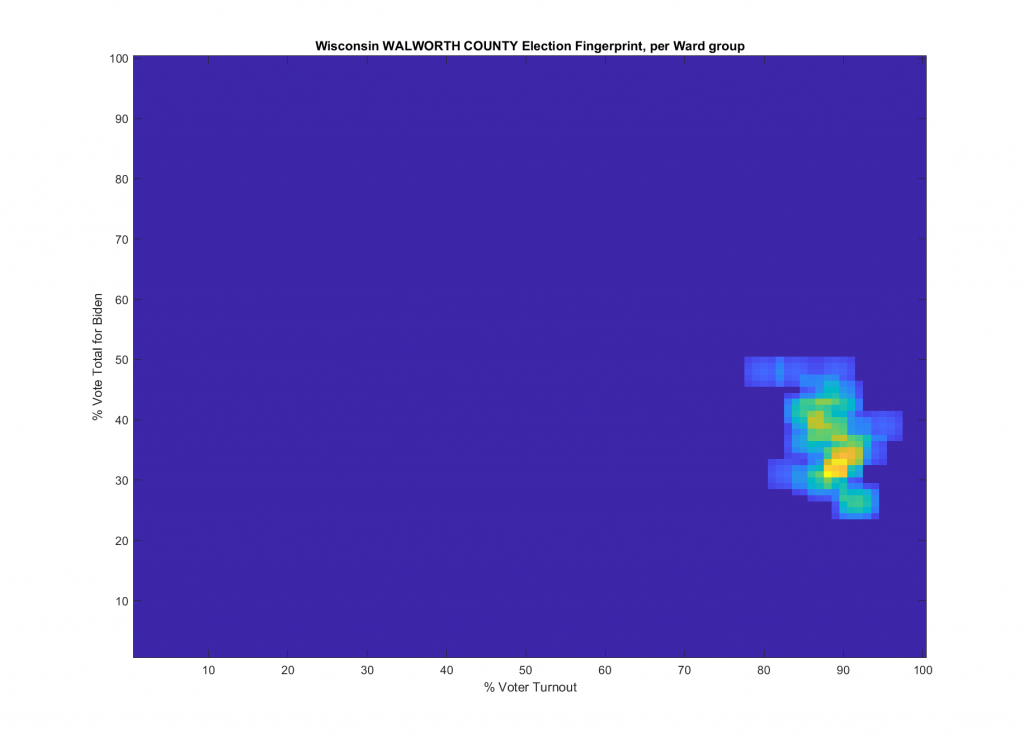
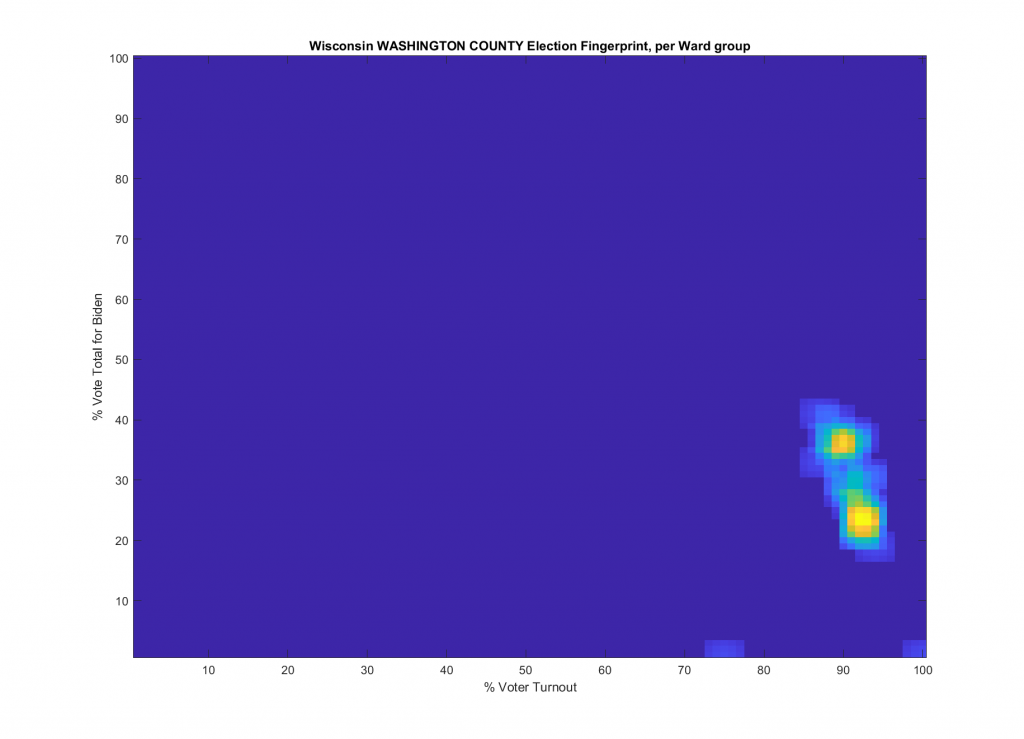
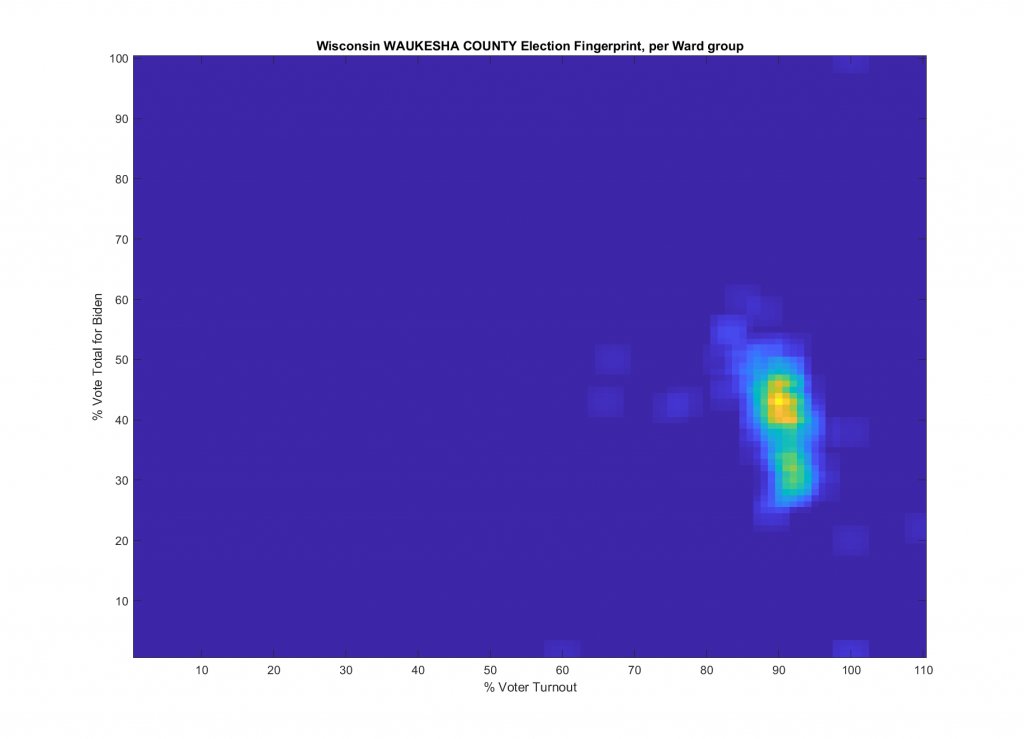
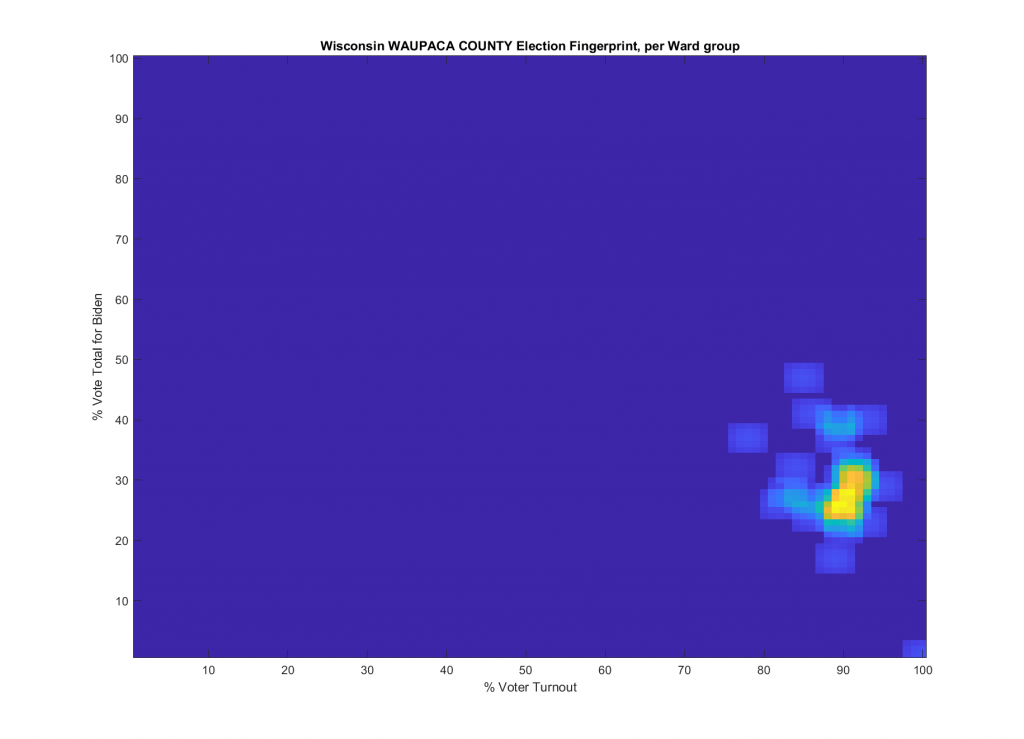
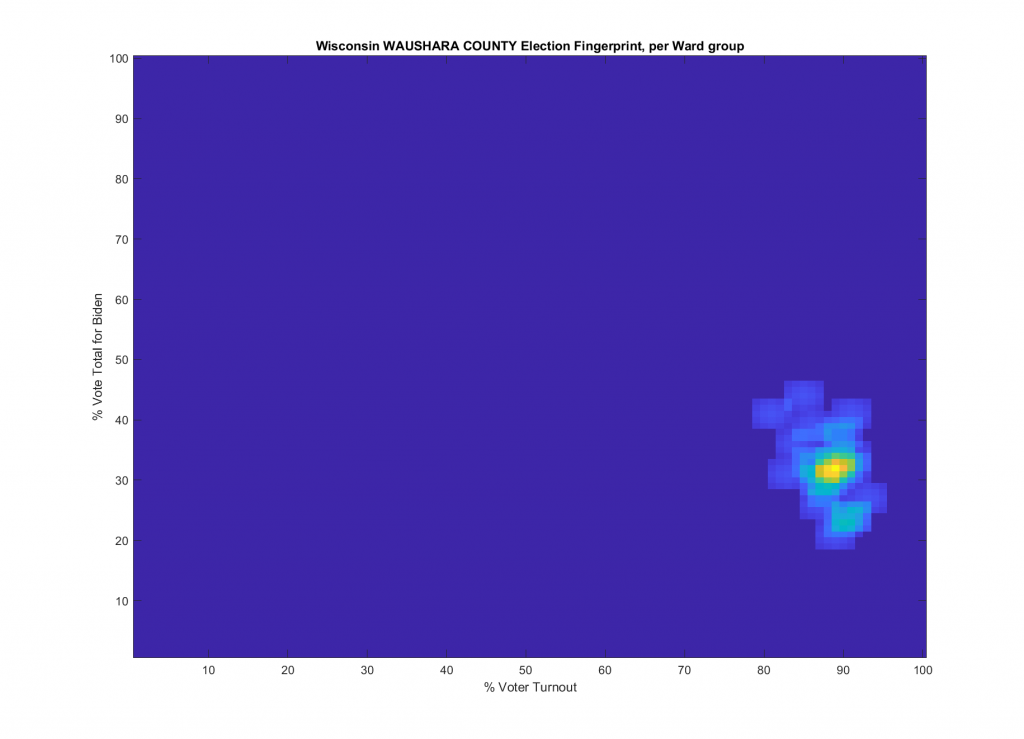
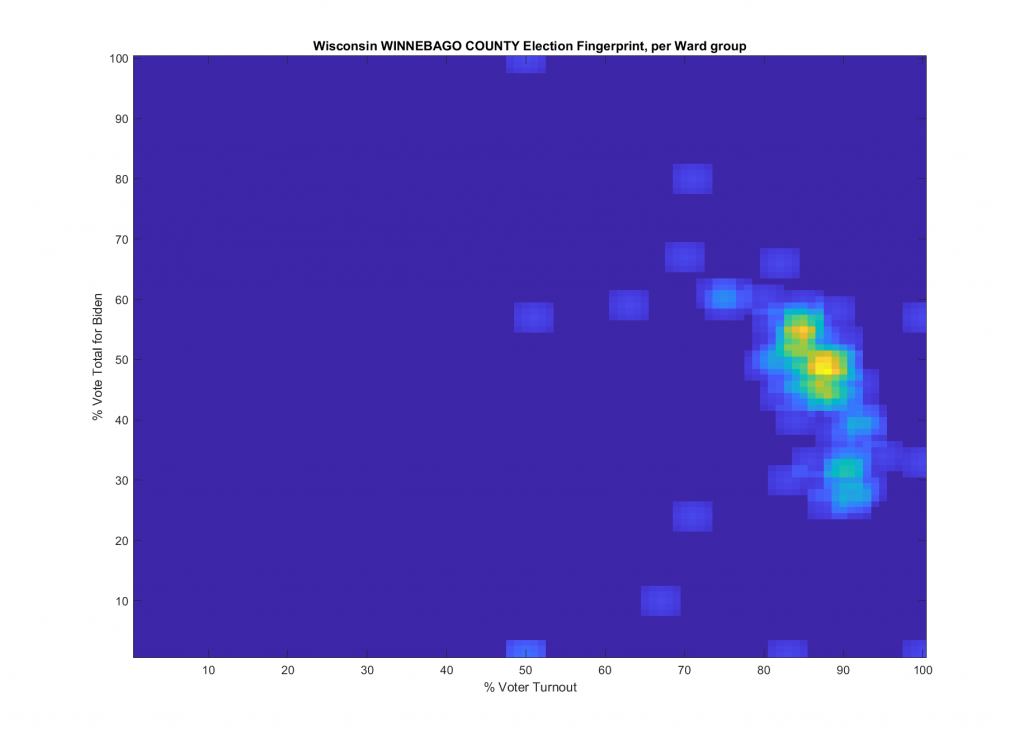
Since I now have all of this rich data to play with … It’d be a shame to only do things statewide! I also produced fingerprints for every single county. One note here is that there is one plot that is the group of “MULTIPLE COUNTIES” that I had mentioned above due to the way the source registration data was organized and labelled. Some of the counties, look actually pretty good with nice, localized, near-gaussian distributions. Some are just an absolute mess!
My list of “interesting” counties:
ASHLAND, BAYFIELD, BROWN, CALUMET, CHIPPEWA, CLARK, DANE, DOGE, DOOR, DOUGLAS, DUNN, EAU CLAIRE, FOREST, GRANT, IOWA, JACKSON, JUNEAU, KENOSHA, KEWAUNEE, LACROSSE, LAFAYETTE, MARATHON, MILWAULKEE, MONROE, ONEIDA, OUTGAMIE, OZAUKEE, PIERCE, PORTAGE, RACINE, RICHLAND, ROCK, RUSK, SAULK, SHAWANO, SHEBOYGEN, St. CROIX, TAYLOR, VILAS, WASHINGTON, WAUKESHA, WAUPACA, WINNEBAGO (43/72 WI Counties)
Of that list, I’d label the following as “VERY interesting”:
BAYFIELD, BROWN, CALUMET, DANE, DOOR, EAU CLAIRE, KENOSHA, LACROSSE, LAFAYETTE, MARATHON, MILWAULKEE, OUTGAMIE, OZAUKEE, PORTAGE, RACINE, ROCK, SAULK, SHAWANO, SHEBOYGEN, St. CROIX, VILAS, WAUKESHA, WINNEBAGO (23/72 WI Counties)
The Election Fingerprints of all of the counties (plus the “MULTIPLE COUNTIES” super-group) are listed below:


Here is the link to the consolidated dataset used to generate all of the graphics on this page.