Hat tip to Ed Solomon for collating the data on this one. There’s a bunch more coming as Ed’s done the heavy lifting on a bunch of localities, and I’m working through them.
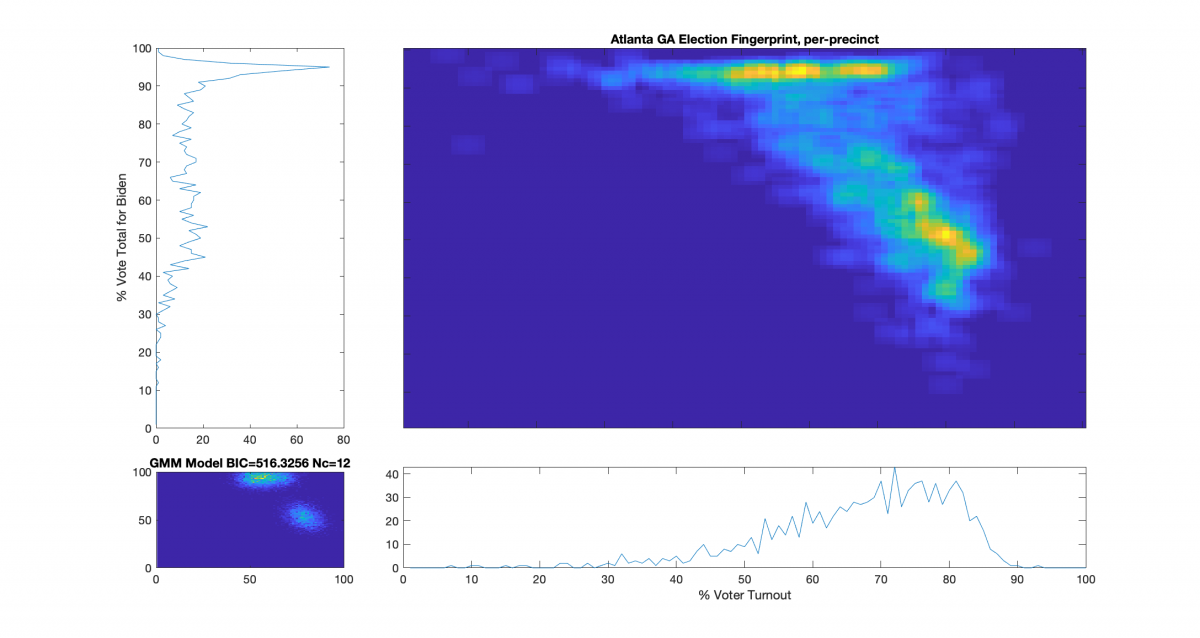
Election Fingerprint for Atlanta, GA polling places – All Vote Types:
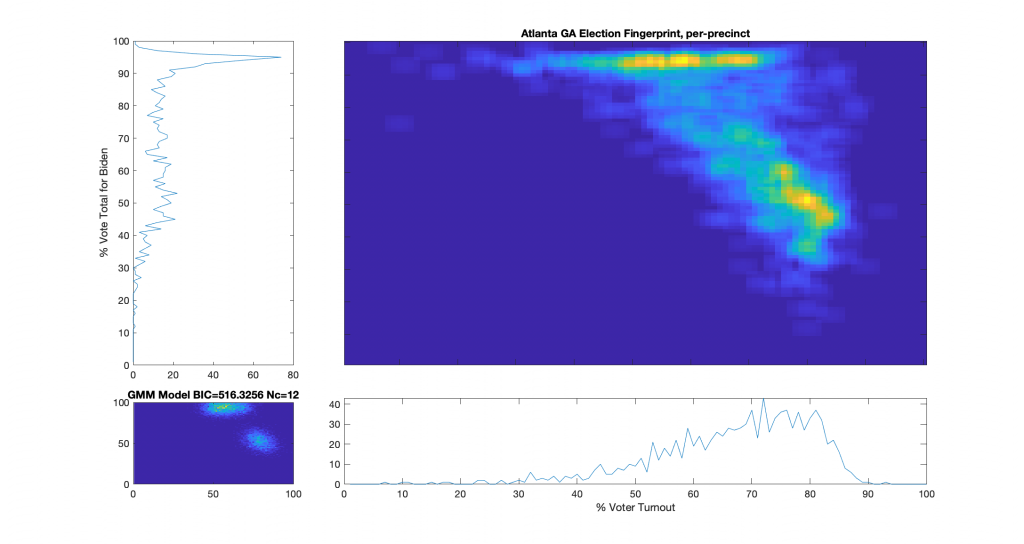
Conclusions:
- The results do not form a normal Gaussian distribution, and are therefore, by definition, an “irregular” distribution. The main lobe of the ‘fingerprint’ also has a diffuse linear streak up and to the left. According to the authors of the NAS paper, election results that show a strong streaking away from the main lobe may indicate ‘ballot stuffing,’ where ballots are added (or subtracted) at a specific rate. The election fingerprint is in the form of a main lobe and streak, although the streak is not as pronounced as the NAS paper’s Russia results.
- Vote share near or over 100% is highly irregular and indicates a strong potential for fraud in any election. In the image above, there is a distinct and shape line across multiple turnout bins of near 100% vote share for Biden. Even in contentious elections, voter turnout over 90% is statistically unlikely, but not impossible.
- Of the 1022 polling places in Atlanta, 252 are in the > 90% vote share for Biden band, 201 had > 93%, 84 had > 95%, and 8 had > 97%.
- These findings indicate significant election irregularities that warrant additional scrutiny and investigation. It should be reiterated that the observed irregularities discussed above can serve as useful indicators and warnings of issues with an election, but do not constitute absolute proof of fraud on their own.