The below is based on the discussion of “Single Transferrable Vote” (“STV”) methods in [1], published in 1977. STV has more recently been called “Ranked Choice Voting” (RCV) or “Instant Runoff Voting” (IRF), among other names, by lobbying groups that are currently pushing for its incorporation into our voting systems. Irrespective of the name used, it represents a family of voting methods, with slightly different variants depending on how votes are removed and/or redistributed in each successive round of voting. [2][5]
What does STV/RCV/IRV entail, in general:
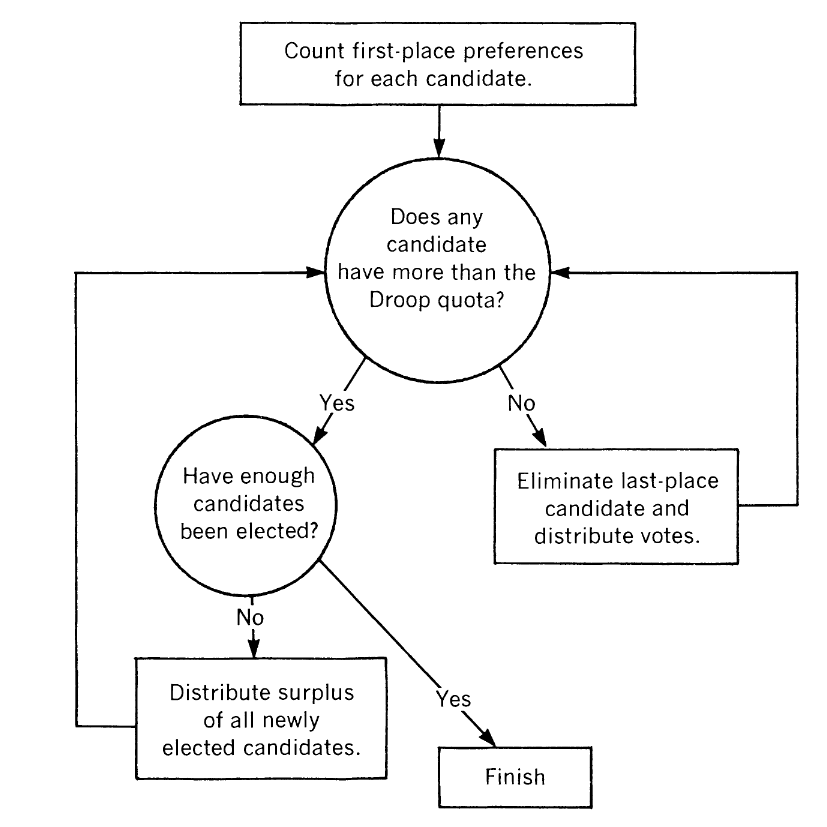
The core system is a proportional voting system, where voters are required to rank order their preferred candidate selections and all ballots are collected and centralized tabulation is performed in multiple rounds until winner(s), or candidates that have support above a specified quota (or “threshold”), are allocated.
A common definition of the quota utilized in STL/RCV/IRV systems is the “Droop quota”, and is defined as:
q = FLOOR( # of Voters / (# of Seats + 1) + 1)
In a given round the candidate with the least support is eliminated from further evaluation. Surplus votes from candidates that go over the droop threshold and votes from eliminated candidates can be distributed amongst remaining candidates for subsequent rounds. Surplus vote distribution is only applicable when multiple winners are allowed in a contest.
The arguments used to support and push for RCV have not significantly changed since the time that the original paper was published, but the terms and language utilized have been modified. The authors note that much of the rationale in pushing for STV was centered around the ideas of inclusivity and making sure voters are able to cast “effective” ballots.
“Modem proponents emphasize the system’s effective representation of minorities, its sensitivity and accuracy in ‘measuring changes in popular will,’ and its tendency to encourage independent (nonparty line) voting.”
Doron, G., & Kronick, R. (1977) [1]
The same arguments have been recently repeated and pushed to legislators and the media. The name has changed from “Single Transferrable Vote” to “Ranked Choice Voting” or “Instant Runoff Voting”, but the argument remains largely the same, as can be seen by simply visiting the websites and promotional material for any of the current groups that are lobbying for RCV to be incorporated [3][4].
The issue pointed out by Doron & Kronick:
The authors in [1] note that the STV/RCV/IRV system allows for a “perversion” (their words, not mine) whereby a candidates chances to be selected as a winner can potentially be negatively impacted even when receiving increased support.
“… a function that permitted an increased vote for a candidate to cause a decline in that candidate’s rank in the social ordering-would probably strike most of us as a rather absurd, even perverse, method of arriving at a social choice. Consequently, some writers refer to this condition as the ‘Non-Perversity’ condition. All of the democratic social choice functions that have been considered in the literature were assumed to guarantee this condition, but the Single Transferrable Vote system does not.”
Doron, G., & Kronick, R. (1977) [1]
The authors present a hypothetical example to demonstrate the issue. Suppose we have 3 candidates (Candidate X, Candidate Y, Candidate Z) and two different voting groups, which we will refer to as group D and D’. Both D and D’ are fairly similar and only disagree on the relative ranking of two specific candidates.
In the tables below, recreated from [1], the only difference in the two voting group selections is that candidate X receives more support than candidate Y in group D’. However, if using the voting rules as described above candidate X wins in D, and loses in D’ even though X has increased support in D’.
| # of Voters | First Choice | Second Choice | Third Choice |
| 6 | X | Y | Z |
| 2 | Y | X | Z |
| 4 | Y | Z | X |
| 5 | Z | X | Y |
| # of Voters | First Choice | Second Choice | Third Choice |
| 6 | X | Y | Z |
| 2 | X | Y | Z |
| 4 | Y | Z | X |
| 5 | Z | X | Y |
There are 17 voters in each case, and only 1 seat available. Therefore, the Droop quota/threshold is 9 votes required in order to declare a winner.
In group D it is candidate Z that has the least amount of votes in the first round and is eliminated, therefore advancing 5 second-choice votes for X into the next round. Candidate X passes the threshold and wins in the second round.
In group D’, where candidate X received more support than candidate Y, it is candidate Y that has the least amount of votes in the first round and is eliminated, therefore advancing 4 second-choice votes for Z into the next round. Candidate Z then passes the threshold and wins in the second round.
Bibliography:
- Doron, G., & Kronick, R. (1977). Single Transferrable Vote: An Example of a Perverse Social Choice Function. American Journal of Political Science, 21(2), 303–311. https://doi.org/10.2307/2110496
- https://ballotpedia.org/Ranked-choice_voting_(RCV)
- https://campaignlegal.org/democracyu/accountability/ranked-choice-voting
- https://www.hhh.umn.edu/research-centers/center-study-politics-and-governance/research-and-initiatives-cspg/ranked-choice-voting
- Brandt F, Conitzer V, Endriss U, Lang J, Procaccia AD, eds. Handbook of Computational Social Choice. Cambridge: Cambridge University Press; 2016. https://doi.org/10.1017/CBO9781107446984