
One thing that I have been asked about repeatedly is if there is any sort of patterns in the assignment of voter ID numbers in the VA data. Specifically, I’ve been asked repeatedly if I’ve found any similar pattern to what AuditNY has found in the NY data. It’s not something that I have looked at in depth previously due mostly to lack of time, and because VA is setup very differently than NY, so a direct comparison or attempt to replicate the AuditNY findings in VA isn’t as straightforward as one would hope.
The NY data uses a different Voter ID number for counties vs at the state level, which is the “Rosetta Stone” that was needed for the NY team to understand the algorithms that were used to assign voter ID numbers, and in turn discover some very (ahem) “interesting” patterns in the data. VA doesn’t have such a system and only uses a single voter ID number throughout the state and local jurisdictions.
Well … while my other machine is busy crunching on the string distance computations, I figured I’d take a crack at looking at the distribution of the Voter ID numbers in the VA Registered Voter List (RVL) and just see what I find.
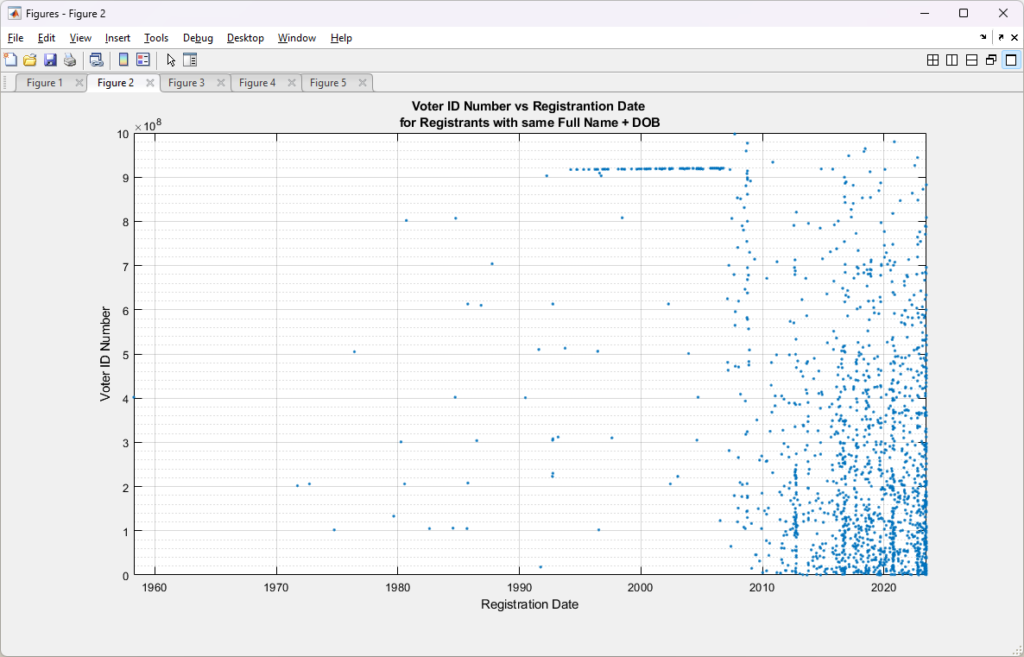
To start with, here is a simple scatter plot of the Voter ID numbers vs the Registration date for each record in the 2023-07-01 RVL. From the zoomed out plot it is readily apparent that there must have been a change in the algorithm that was used to assign voter identification numbers sometime around 2007, which coincides nicely with the introduction of the current Virginia Election and Registration Information System (VERIS) system.
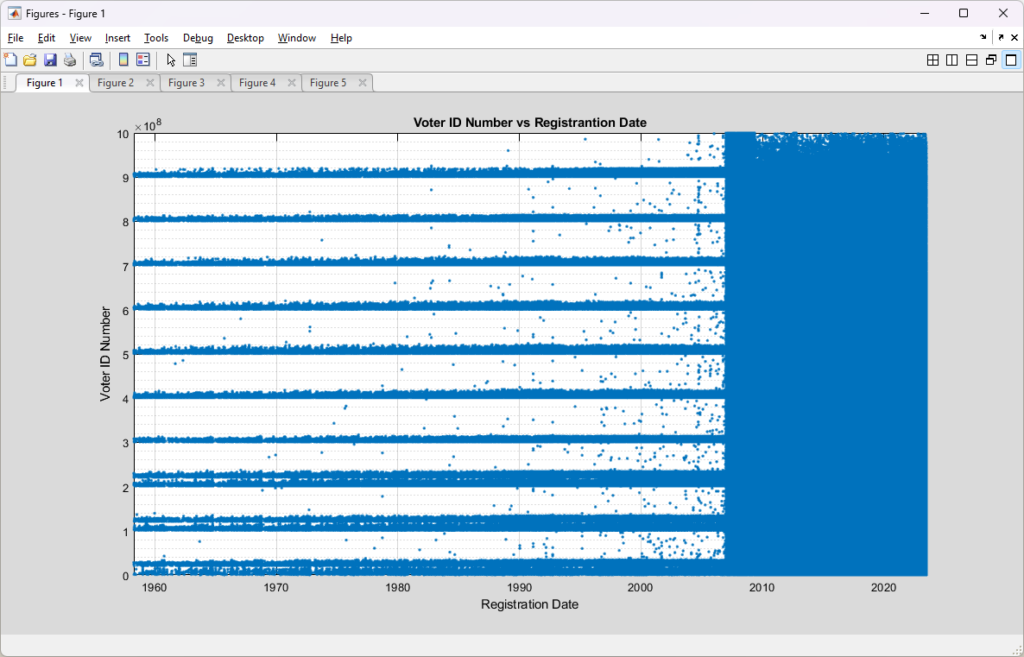
From a high level, it appears that the previous assignment algorithm broke the universe of possible ID numbers up into discrete ranges and assigned IDs within those ranges, but favoring the bottom of each range. This would be a logical explanation for the banded structure we see pre-2007. The new assignment algorithm post-2007 looks to be using a much more randomized approach. Nothing strange about that. As computing systems have gotten better and security has become more of a concern over the years there have been many systems that migrated to more randomized assignments of identification numbers.
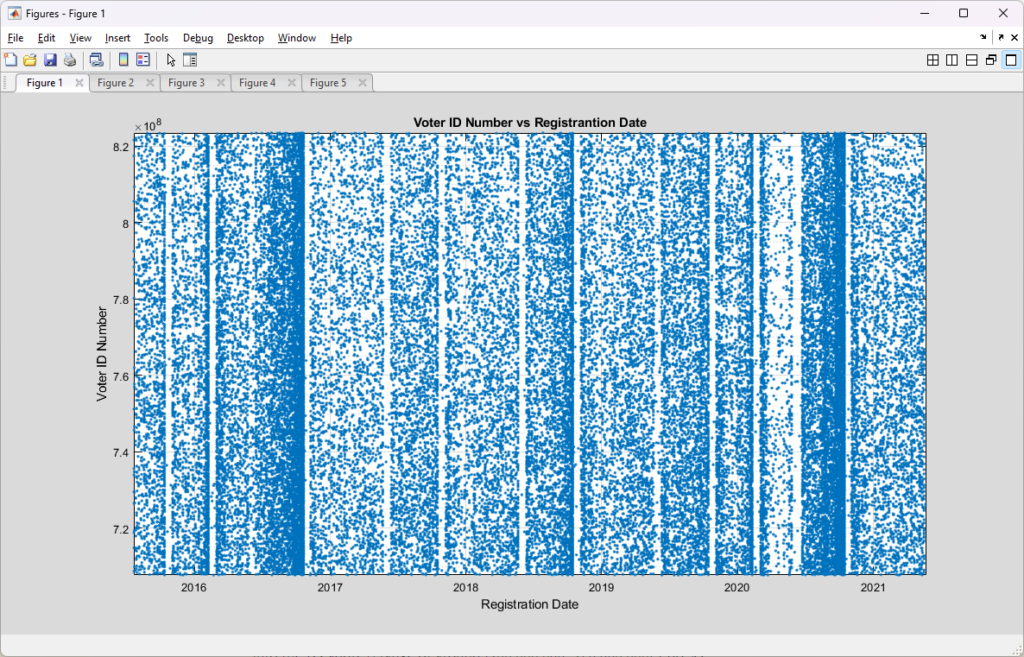
Looking at a zoomed in block of the post-2007 “randomized” ID assignments we can see some of the normal variability that we would expect to see in the election cycles. We see that we have a high density of new assignments around November of 2016 and 2020, with a low density section of assignments correlated to the COVID-19 lockdowns. There are short periods where it looks like there were lulls in the assignment of voter ID’s, these are perhaps due to holidays or maintenance periods, or related to the legal requirements to “freeze” the voter rolls 30 days before any election (primaries, runoffs, etc). Note that VA now has same day voter registration as of the laws passed by the previous democratic super-majority that went into affect in 2022, so going forward we would likely see these “blackout periods” be significantly reduced.
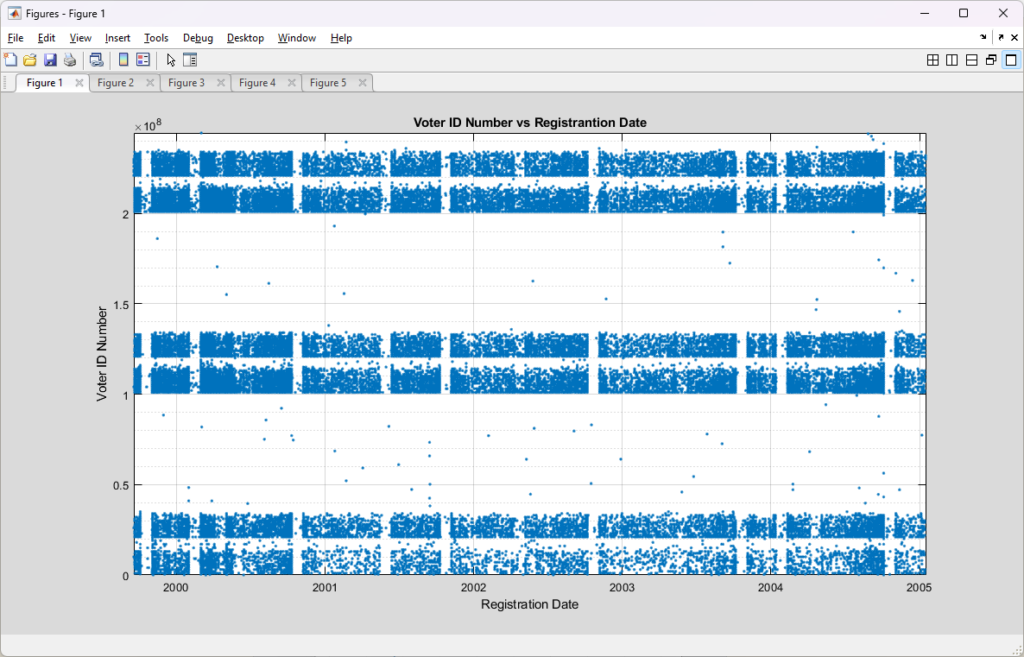
We can see more clearly the banded assignment structure of the pre-2007 entries by zooming in on a smaller section of the plot, as shown below. It’s harder to make out in this banded structure, but we still see similar patterns of density changes presumably due to the natural election cycles, holidays, maintenance periods, legally required registration lockouts periods, etc. We can also see the “bucketing” of ID numbers into distinct bands, with the bias of numbers filling the lower section of each band.
All of that looks unremarkable and seems to make sense to me … however … if we zoom into the Voter ID address range of around [900,000,000 to 920,000,000] we do see something that catches my curiosity. We see the existence of the same banded structure as above between 900,000,000 and 915,000,000 AND pre-2007, but there is another band of assignments super-imposed on the entire date range of the RVL. This band does not seem to be affected by the introduction of the VERIS system (presumably), which is very interesting. There is also what looks like to be a vertical high-density band between 2007 and 2010 that extends along the entire vertical axis, but we only see it once we zoom in to the VERIS transition period.
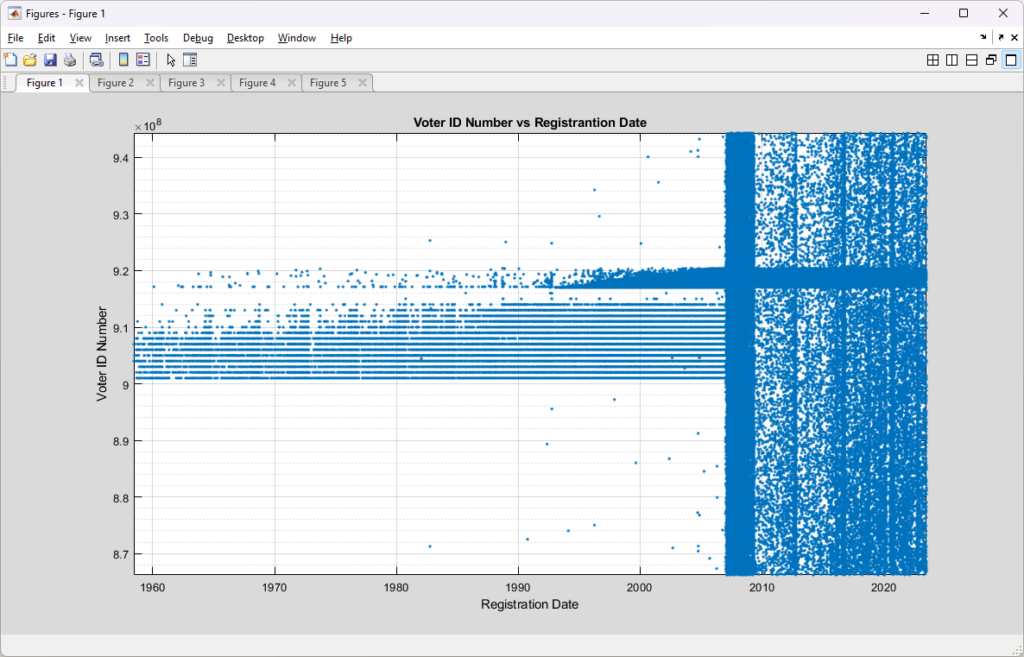
The horizontal band that extends across all date ranges only exists in the [~915,000,000 to ~920,000,000] ID range. It trails off in density pre ~1993, but it exists throughout the full registration date range. I will note that the “Motor Voter” National Voter Registration Act (NVRA) was implemented in 1993, so perhaps these are a reserved universe block for DMV (or other externally provided) registrations? (That’s a guess, but an educated one.)
A plausible explanation I can imagine for the distinct high density band between 2007-2010 is that this might be related to how the VERIS system was implemented and brought into service, and there was some sort of update around 2010 that made correction to its internal algorithms. (But that is just a guess.) That still wouldn’t entirely explain the huge change in the density of new registrants added to the rolls.
Another, or additional, explanation might be that when VERIS came online there were a number of registrants that had their Voter ID number regenerated and/or their registration date field updated as part of the rollout of the new VERIS software. Meaning that while VERIS was coming online and handling the normal amount of new real registrations, it was also moving/updating a large number of historic registrations, which would account for the higher density as VERIS became the system of record. That seems to be a poor systems administration and design choice, in my opinion, as it makes inaccurate those moved registrant records by giving them a false registration date. However, if that was the case, and VERIS was resetting registration dates as it ingested voter records into its databases, why do we see any records with pre-2007 registration dates at all? (This is again, merely an educated guess on my part, so take with a grain of salt.)
Incorporating the identification of cloned registrations
In attempting to incorporate some of my early results on the most recent RVL data doing duplicate record identification (technically they are “cloned” records, as “duplicates” would have the same voter ID numbers. This was pointed out to me a few days ago.) on this dataset, I did a scatter plot of only those records that had an identified exact match of (FullName +DOB) to other records in the dataset, but with unique Voter ID numbers. The scatter plot of those records is shown below, and we can see that there is a distinct ~horizontal cluster of records that aligns with the 915M – 920M ID band and pre-2007. In the post-2007 block we see the cloned records do not seem to be totally randomly distributed, but have a bias towards the lower right of the graph.
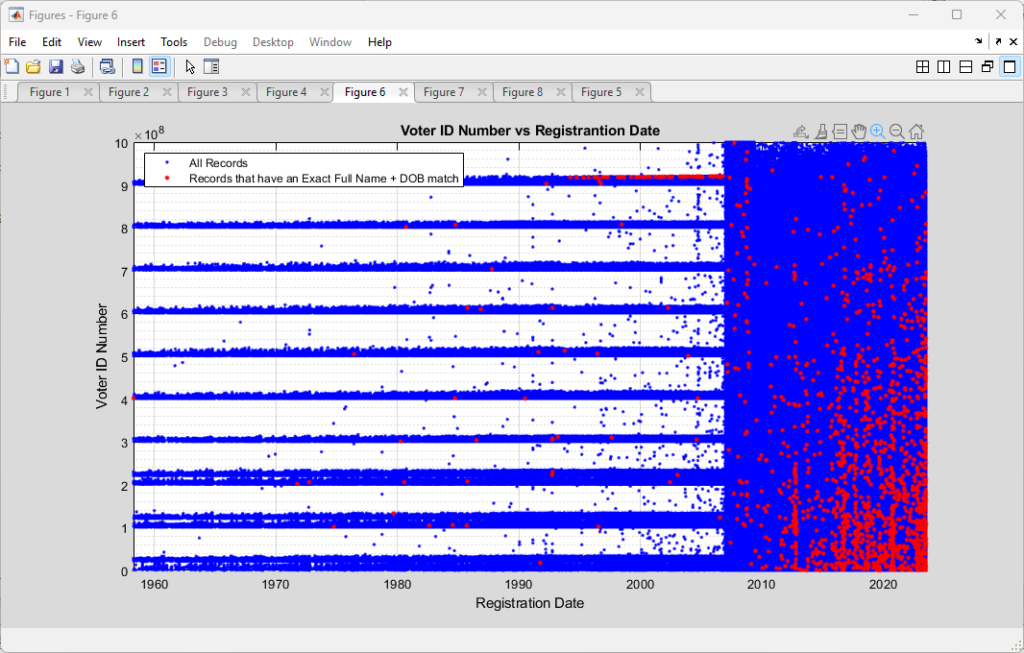
Superimposing the two plots produces the following, with the red indicating the records with identified Full Name + DOB string matches.
Zooming in to take a closer look at the 915M-920M band again, gives the following:
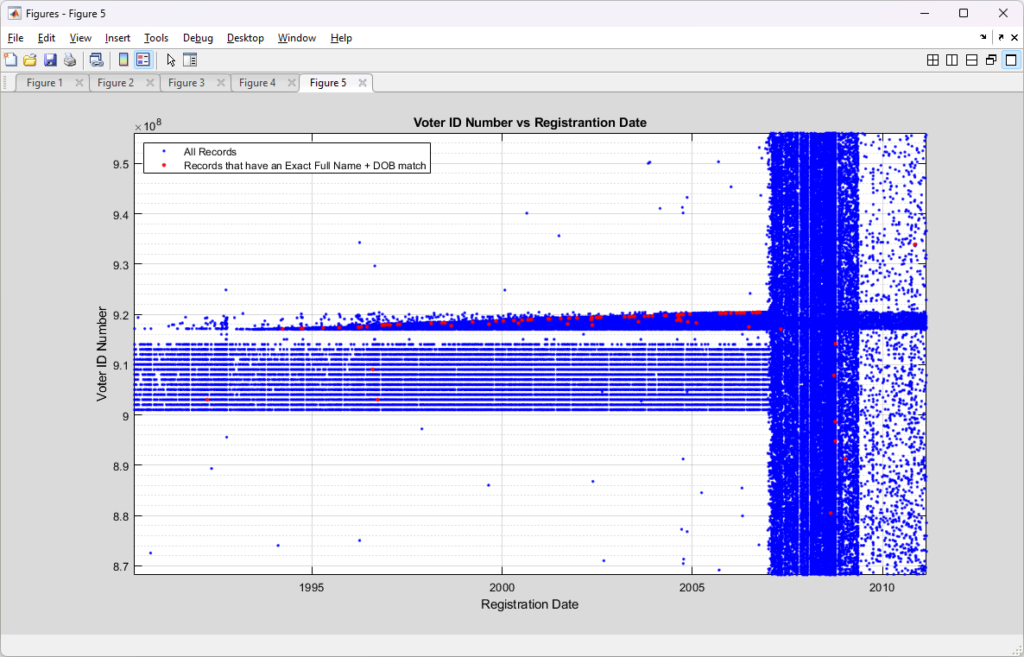
It is curious that there seems to be an alignment of the exact Full Name + DOB matching records with the 915M-920M, pre-2007 ID band. Post-2007 the exact cloned matches have a less structured distribution throughout the data, but they do seem to cluster around the lower right.
If the cloned records were simply due to random data entry errors, etc. I would expect to see sporadic red datapoints distributed “salt-n-pepper” style throughout the entirety of the area covered by the blue data. There might be some argument to be made for there being a bias of more of the red data points to the right side of the plot, as officials have not yet had time to “catch” or “clean-up” erroneous entries, but there is little reason to have linear features, or to have a bias for lower ID numbers in the vertical axis.
I am continuing to investigate this data, but as of right now all I can tell you is that … yes, there does seem to be interesting patterns in the way Voter IDs are assigned in VA, especially with records that have already been found and flagged to be problematic (clones).