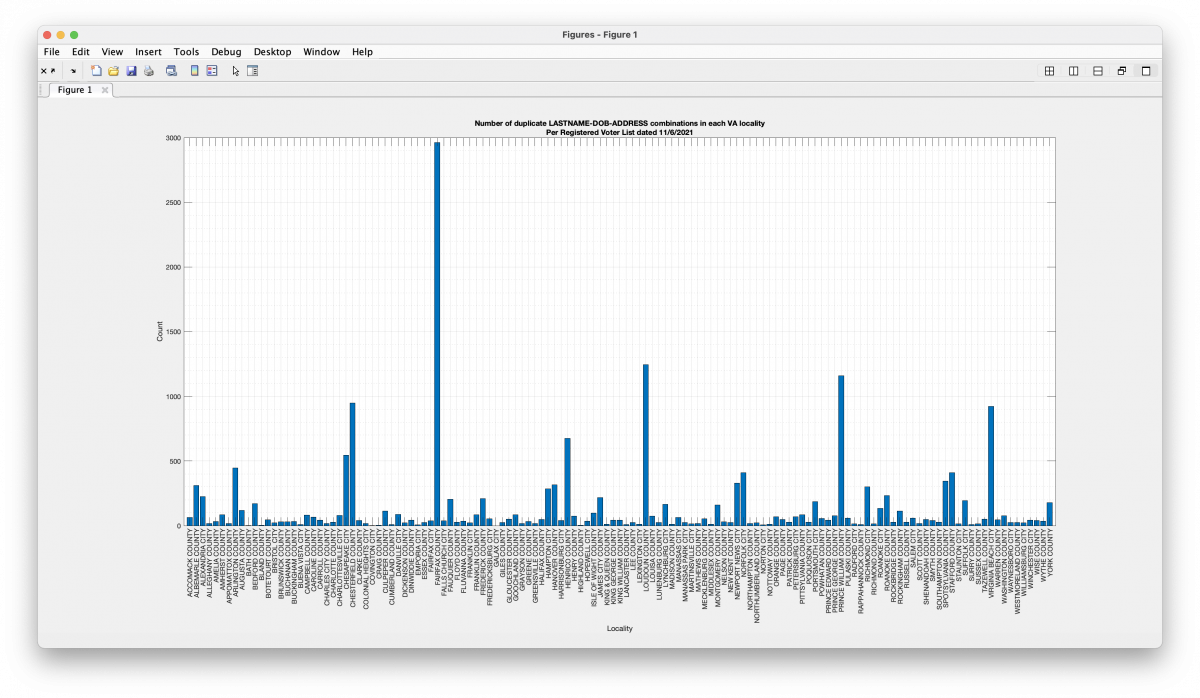
Computed below is the number of duplicated voter records in each locality as of the 11/06/21 VA Registered Voter List (RVL). The computation is based on performing an exact match of LAST_NAME, DOB and ADDRESS fields between records in the file.
Note: If the combination of the name “Jane Smith”, with DOB “1/1/1980”, at “12345 Some Road, Ln.” appears 3 times in the file, there are 3 counts added to the results below. If the combination appears only once, there are 0 counts added to the results below, as there is no repetition.
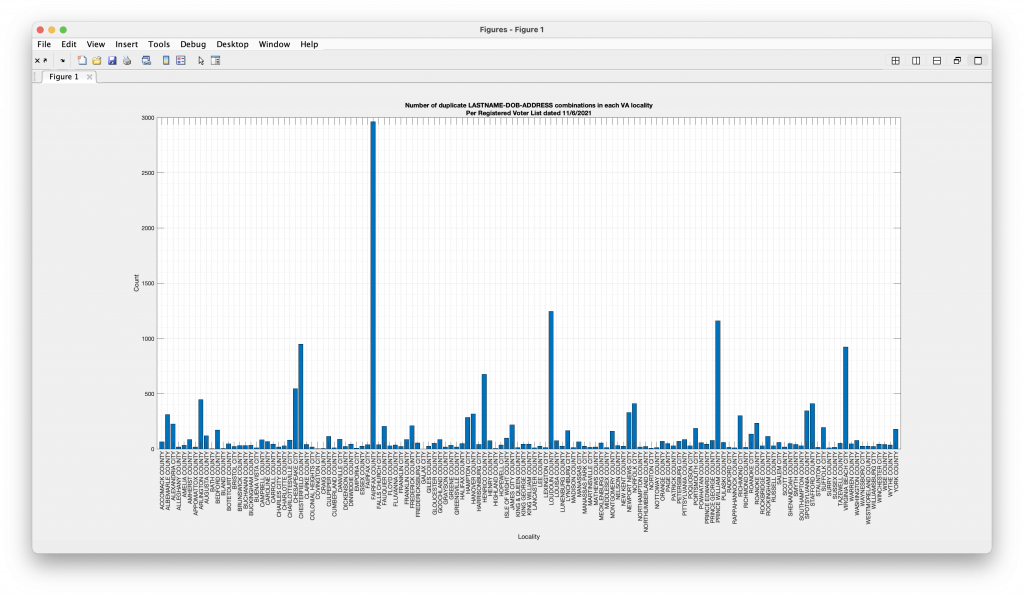
Additionally I’ve done an even more restrictive matching which requires exact match on FIRST, MIDDLE and LAST name, DOB and ADDRESS fields in the second graphic and list presented below.
The first, more lenient, criteria will correctly flag multiple records with the same first or middle name, but misspelled such as “Muhammad” vs “Mahammad”, but could also include occurrences of voting age twins who live together or spouses with the same DOB.
The second, more strict, criteria requires that multiple rows flagged have exactly the same spelling and punctuation for FIRST, MIDDLE, LAST, DOB and ADDRESS fields. This has less false positive, but more false negatives, as it will likely miss common misspellings between entries, etc.
There are no attempts to match for common misspellings, etc. I did do a simple cleanup for multiple contiguous whitespace elements, etc., before attempting to match.
I have summarized the data here so as not to reveal any personally identifiable information (PII) from the RVL in adherence to VA law.
Update 2022-07-13 12:30: I have sent the full information, for both the lenient and strict criteria queries, to the Prince William County and Loudoun County Registrars. The Loudoun deputy registrar has responded and stated that all but 1 of the duplications in the stricter criteria had already been caught by the elections staff, but he has not yet looked at the entries in the more lenient criteria results file. I have also attempted to contact the Henrico County, Lynchburg City, and York County registrars but have not yet received a response or request to provide them with the full data.
Update 2022-07-31 23:03: I have also heard back from the PWC Registrar (Eric Olsen). Most of the entries that I had flagged in the 11/6/2021 RVL list have already been taken care of by the PWC staff already. There were only a couple that had not yet been noticed or marked as duplicates. Also, per our discussion, I should reiterate and clarify that the titles on the plots below simply refer to duplicated entries of the data files according to the filtering choice. It is a technically accurate description and should not be read as I am asserting other than the results of the matching operation.
MAJOR CORRECTION (2022-07-17): The below analysis incorrectly computed the CSV totals for each of the 3 counties. I had an indexing error into my CSV file list and erroneously computed the 2020 totals from the CSV’s. I have since updated and recomputed all of the VHL and CSV results, and have additionally added a check against the Turnout report numbers as reported by ELECT. These new results will be forthcoming in an upcoming blog post. While there are still discrepancies between the VHL and CSV, their magnitude is not as large as was originally presented here. My apologies for the error. Corrected numbers for the 2020 CSV totals are shown in red below with my original estimates in strikethrough font.
(Edited 2022-07-10 17:31 EST to add better explanation of VHL and CSV files to first paragraph.)
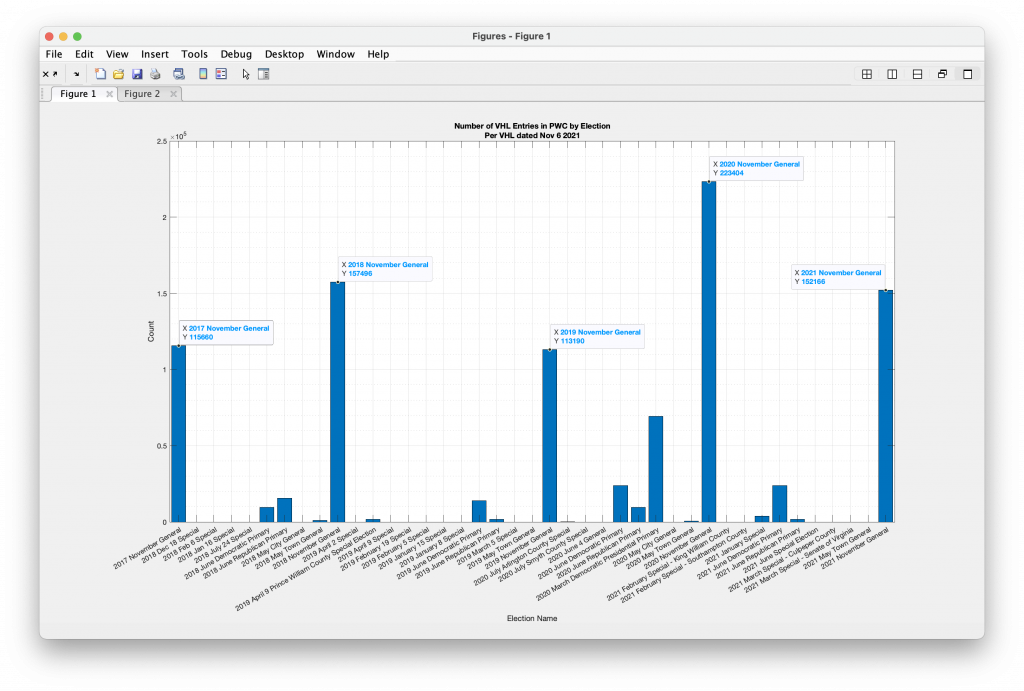
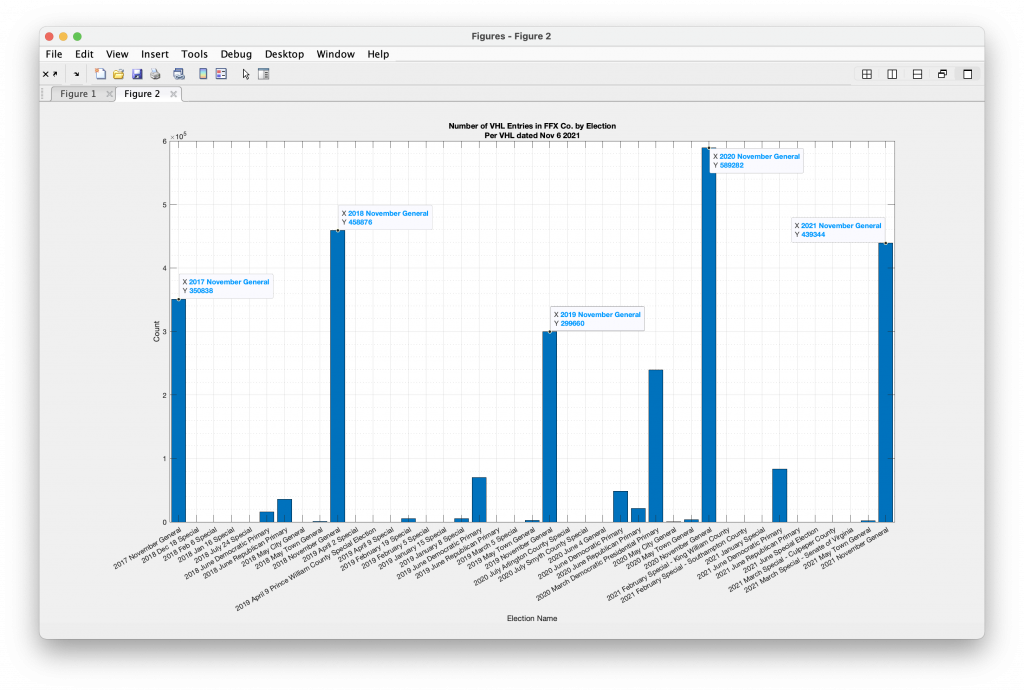
Per Request – Prince William, Fairfax and Loudoun County
According to the CSV file hosted on the ELECT servers and downloaded on 11-30-2020, the number of votes cast in Prince William County in 2020 Presidential race was 228,267 (corrected) 137,874, which is significantly different than the number of Voters that cast ballots (223,404) in 2020 as generated from the Voter History List (VHL). The 2021 CSV file, downloaded from ELECT on 12-11-2021, gives 153,218 voters as compared to 152,166 given by the VHL data. Why the discrepancies? Note that the VHL is counting people, and the CSV is counting votes cast in the races for President(2020)/Gov(2021), but the numbers should still be roughly similar between the two sources. Also the CSV “Total Vote” field should be including overvotes, write-ins, etc so that is not the source of the discrepancies. Furthermore, the 11-06-2021 VHL data file is identical to the VHL datafile downloaded on 12-14-2021, so there is no missing data from the VHL file for the 2021 election. Finally, note that by definition the Voter History List information will undercount the number of voters that participated in the 2020 election, because voters that have been removed from the registered voter list in between the end of the 2020 election period and when the file was downloaded (11-6-2021) will have had their corresponding records deleted from the VHL.
According to the CSV file hosted on the ELECT servers and downloaded on 11-30-2020, the number of votes cast in Fairfax County was 601,243 (corrected) 487232, which is significantly different than the number (589282) generated from the VHL. The 2021 CSV file, downloaded from ELECT on 12-11-2021, give 441262 voters as compared to 439344 given by the VHL data. Why the discrepancies?
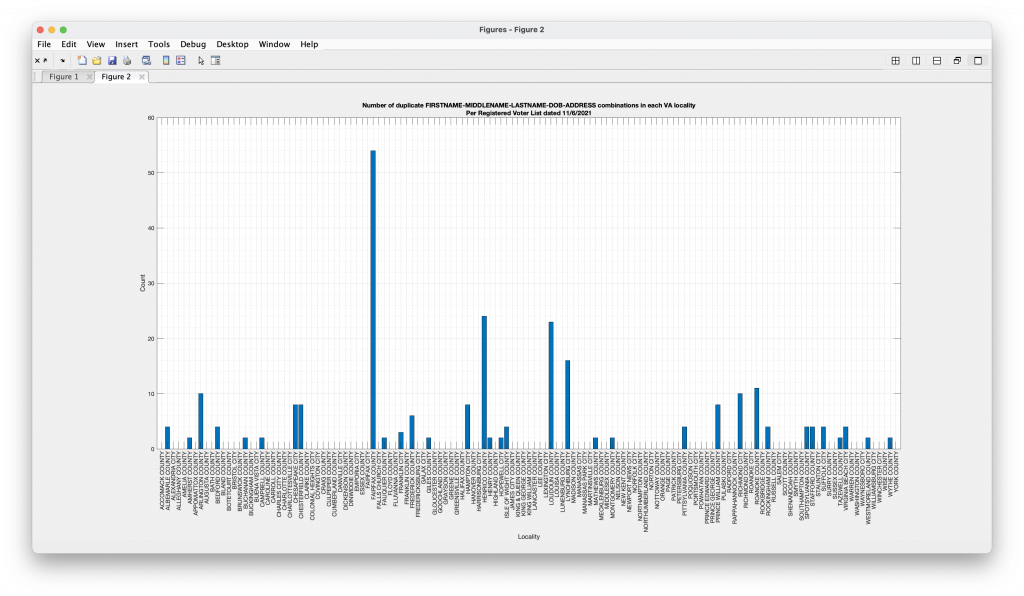
According to the CSV file hosted on the ELECT servers and downloaded on 11-30-2020, the number of votes cast in Loudoun County was 224,976 (corrected) 111655, which is significantly different than the number (220758) generated from the VHL. The 2021 CSV file, downloaded from ELECT on 12-11-2021, give 161793 voters as compared to 161449 given by the VHL data. Why the discrepancies?
Many election integrity investigators are looking through registration records and trying to find suspicious registrations based on the number of records attributed to a specific address as an initial way of identifying records of interest and of need of further scrutiny. This can often produce false positives for things like nursing homes, college dormitories, etc. Additionally, one of the concerns that has been raised is the risk of potential elder abuse, ID theft, manipulation or improper use of ballots for occupants of nursing home, hospice care or assisted living facilities.
According to https://npino.com : “The National Provider Identifier (NPI) is a unique identification number for covered health care providers (doctors, dentists, chiropractors, nurses and other medical staff). The NPI is a 10-digit, intelligence-free numeric identifier. This means that the numbers do not carry other information about healthcare providers, such as the state in which they live or their medical specialty. The NPI must be used in lieu of legacy provider identifiers in the HIPAA standards transactions. Covered health care providers and all health plans and health care clearing houses must use the NPIs in the administrative and financial transactions adopted under HIPAA (Health Insurance Portability and Accountability Act).”
I’ve compiled a list of every nursing home, hospice care, or assisted living facility in the country based on their current NPI code. I have mirrored and scraped the entire https://npino.com site as of 5-23-2022 and compiled the list of nationwide Nursing homes, Assisted Living and Hospice Care facilities into the below CSV file and am presenting it here in the hopes that it is useful for other researchers. I did do a small amount of regular expression based cleanup to the entries (e.x. // replacing “Ste.” with “Suite”, fixing whitespace issues, etc.) as well as manually addressing a handful of obviously incorrect addresses (e.x. // repeated/spliced street addresses, etc.).
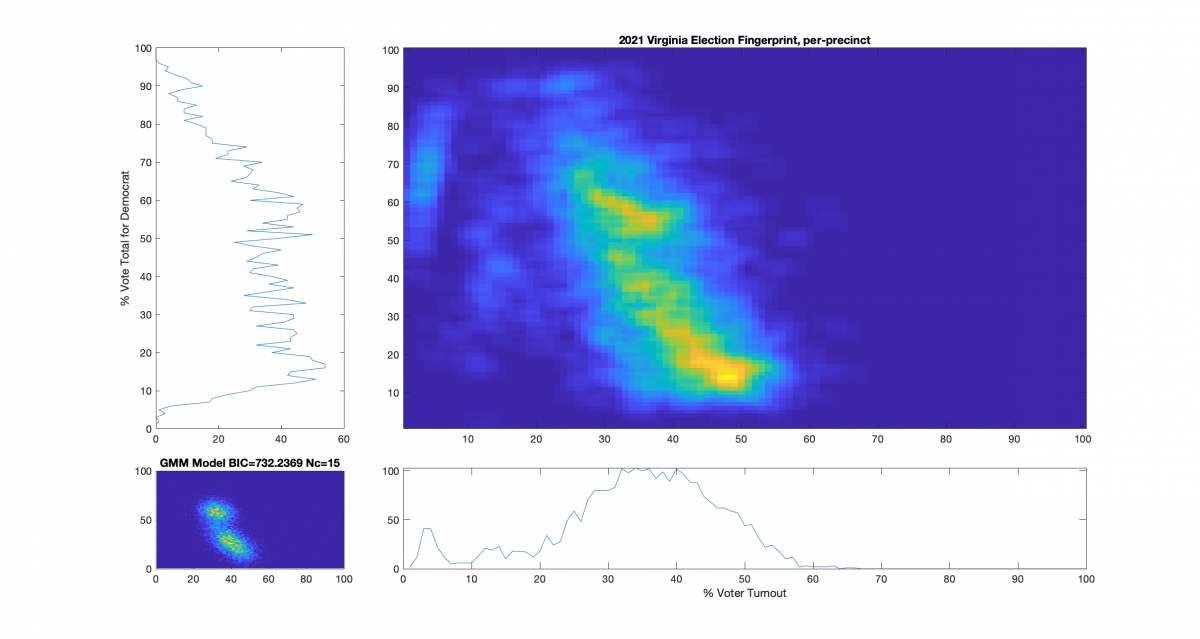
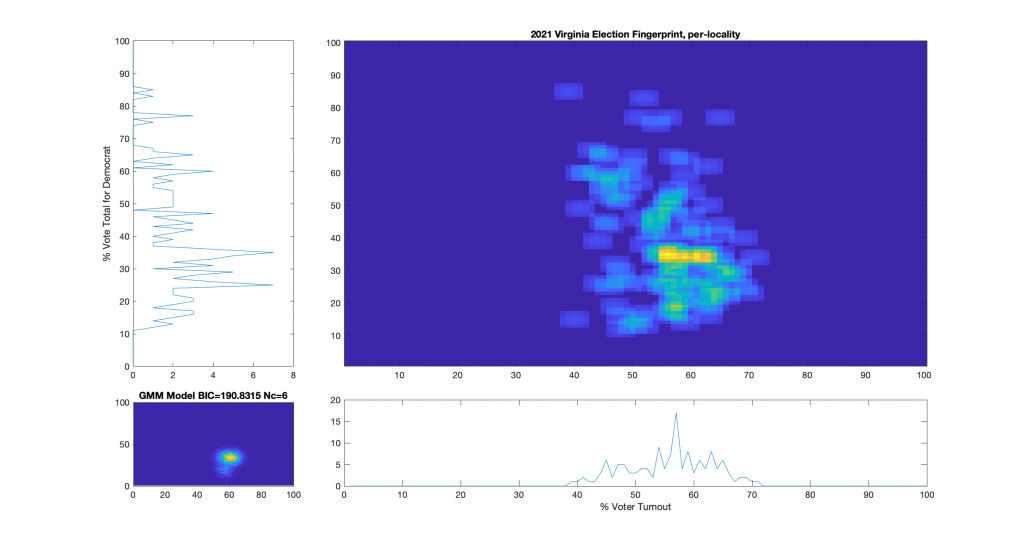
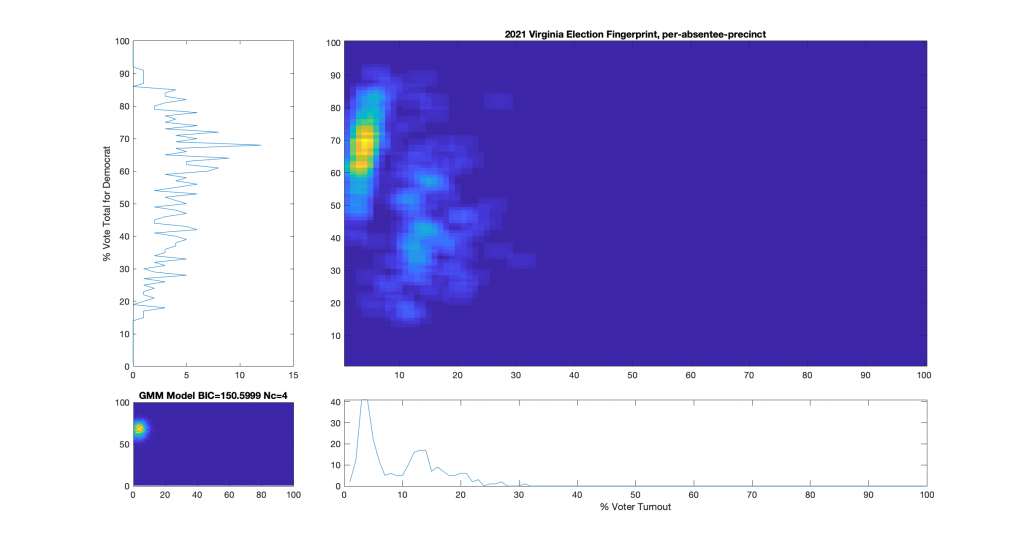
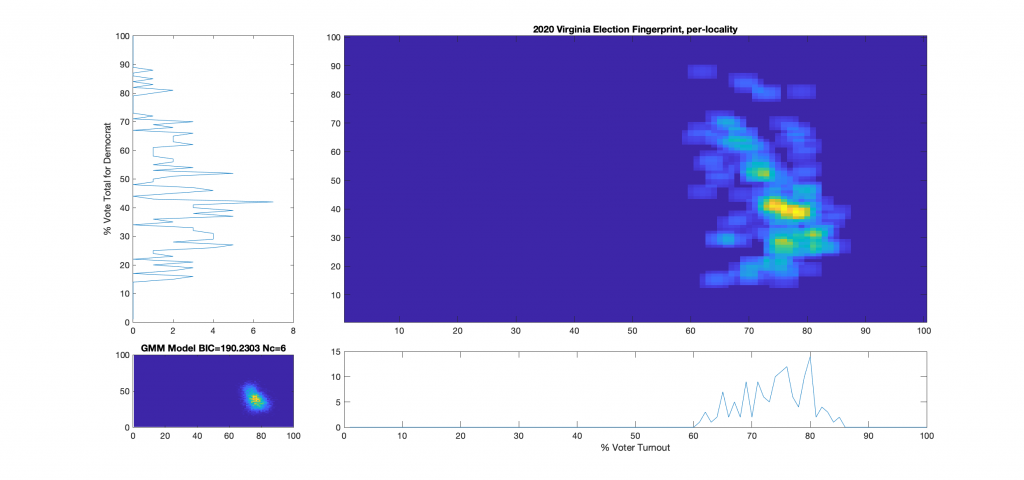
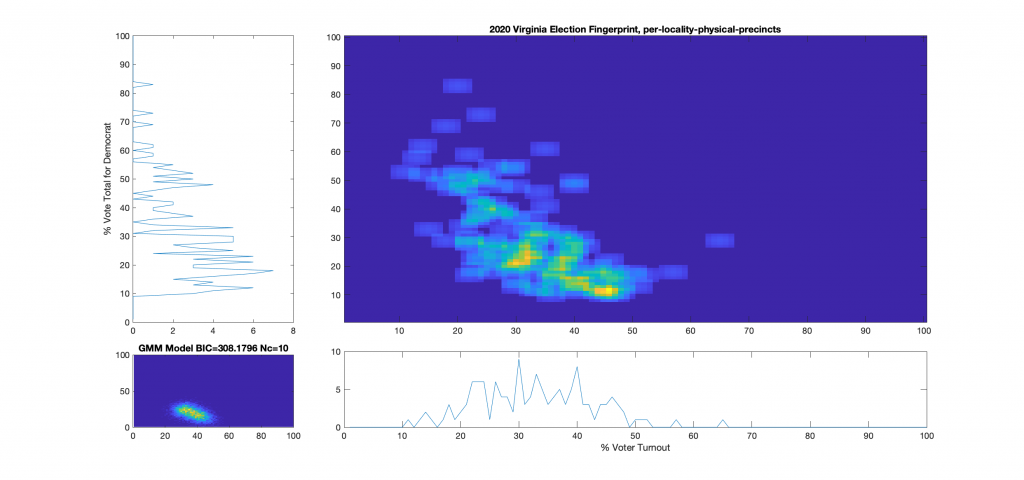
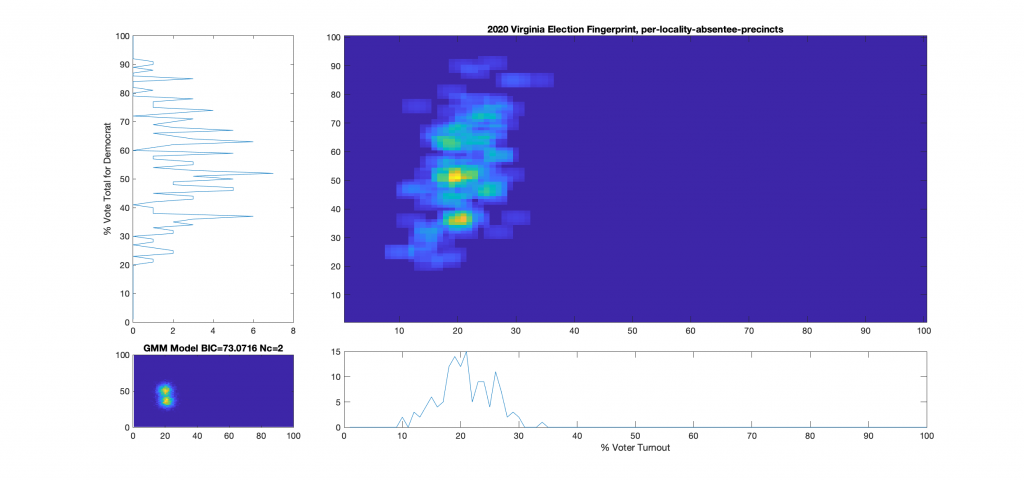
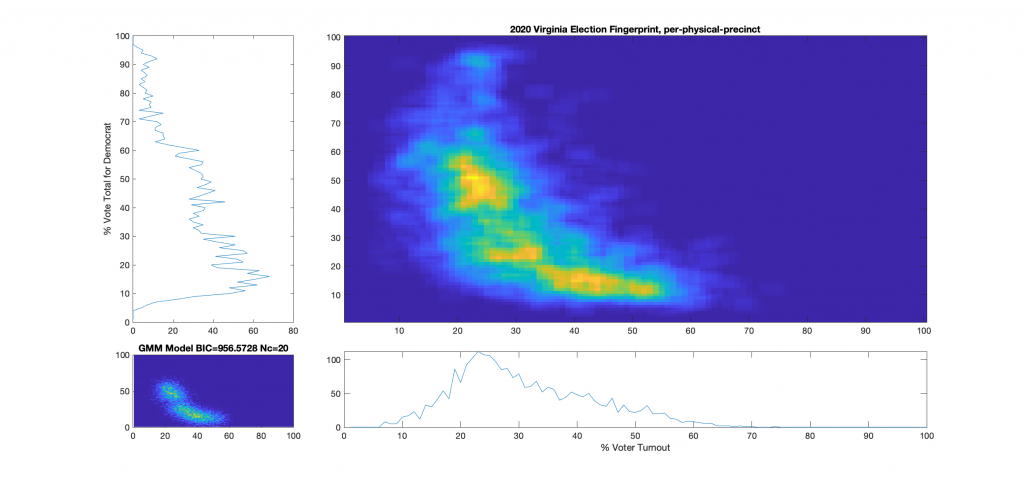
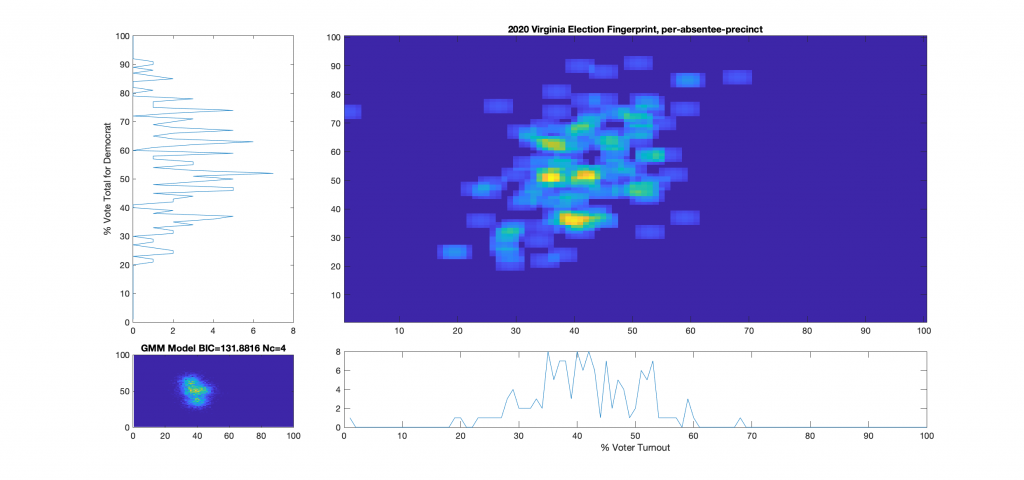
For additional background information, see here, here and here. As a reminder and summary, according to the published methods in the USAID funded National Academy of Sciences paper (here) that I based this work off of, an ideal “fair” election should look like one or two (depending on how split the electorate is) clean, compact Gaussian distributions (or “bulls-eye’s”). Other structural artifacts, while not conclusive, can be evidence and indicators of election irregularities. One such indicator with an attributed cause is that of a highly directional linear streaking, which implies an incremental fraud and linear correlation. Another known and attributed indicator is that of large distinct and extreme peaks near 100% or 0% votes for the candidate (the vertical axis) that are disconnected from the main Gaussian lobe which the authors label a sign of “extreme fraud”. In general, for free and fair elections, we expect these 2D histograms to show a predominantly uncorrelated relationship between the variables of “% Voter Turnout” (x-axis) and “% Vote Share” (y-axis).
Note that even though the republican (Youngkin) won in VA, the y-axis of these plots presented here was computed as the % vote share for the democratic candidate (McCauliffe) in order to more easily compare with the 2020 results. I can produce Yougkin vote share % versions as well if people are interested, and am happy to do so.
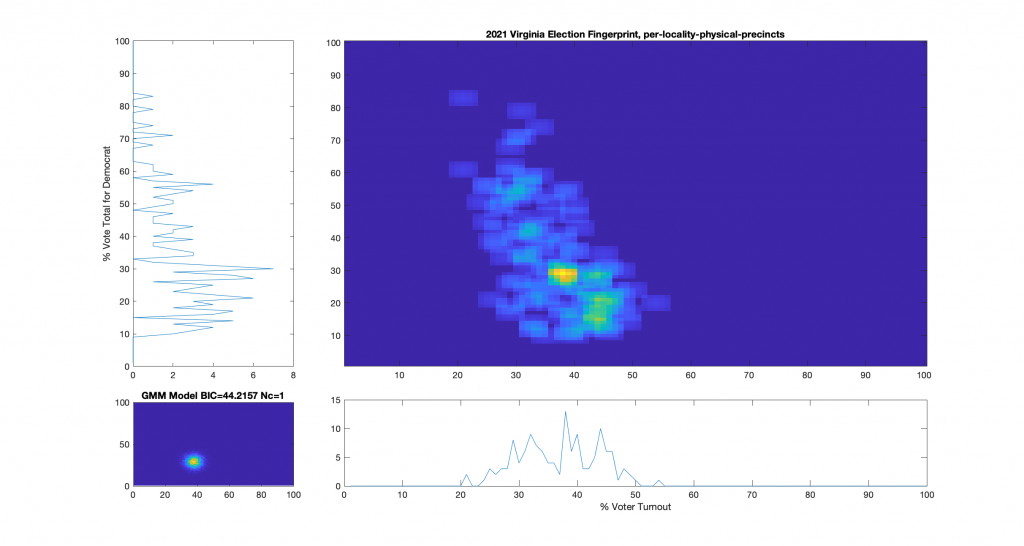
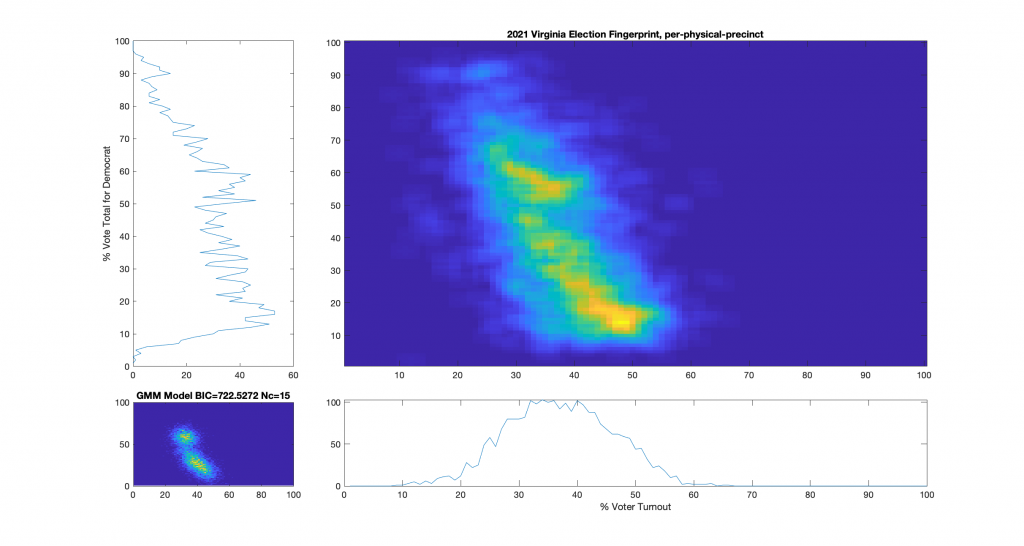
While the 2021 election fingerprints look to have less correlations between the variables as compared to 2020 data, they still look very non-gaussian and concerning. While there is no clearly observable “well-known” artifacts as called out in the NAS paper, there is definitely something irregular about the Virginia 2021 election data. Specifically, I find the per-precinct absentee [mail-in + post-election + early-in-person] plot (Figure 6) interesting as there is a diffuse background as well as a linearly correlated set of virtual precincts that show low turnout but very high vote share for the democratic candidate.
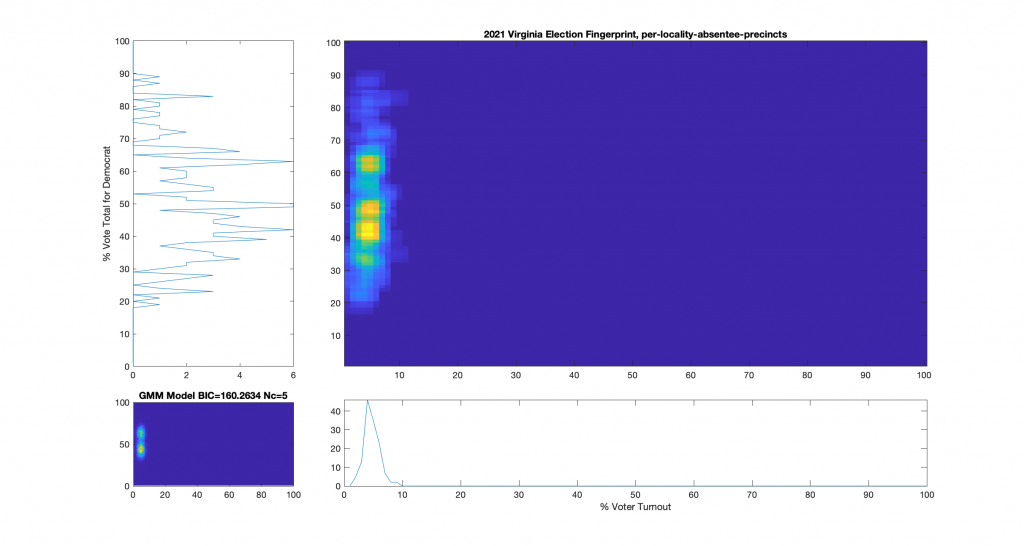
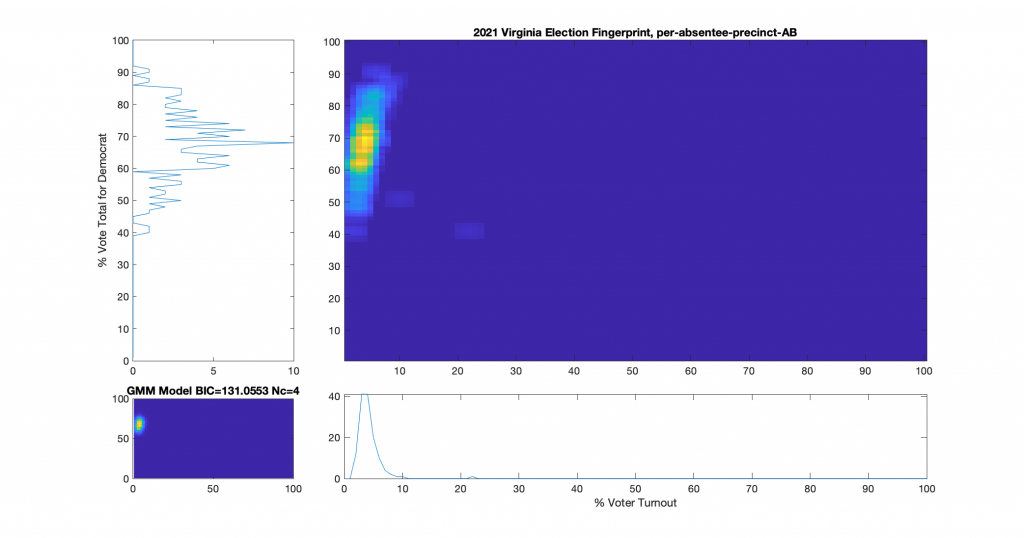
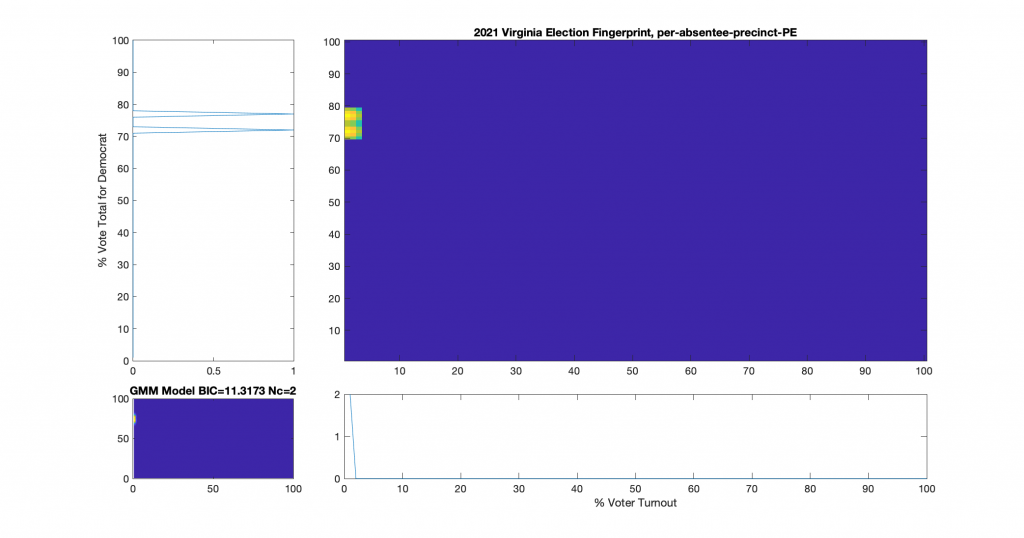
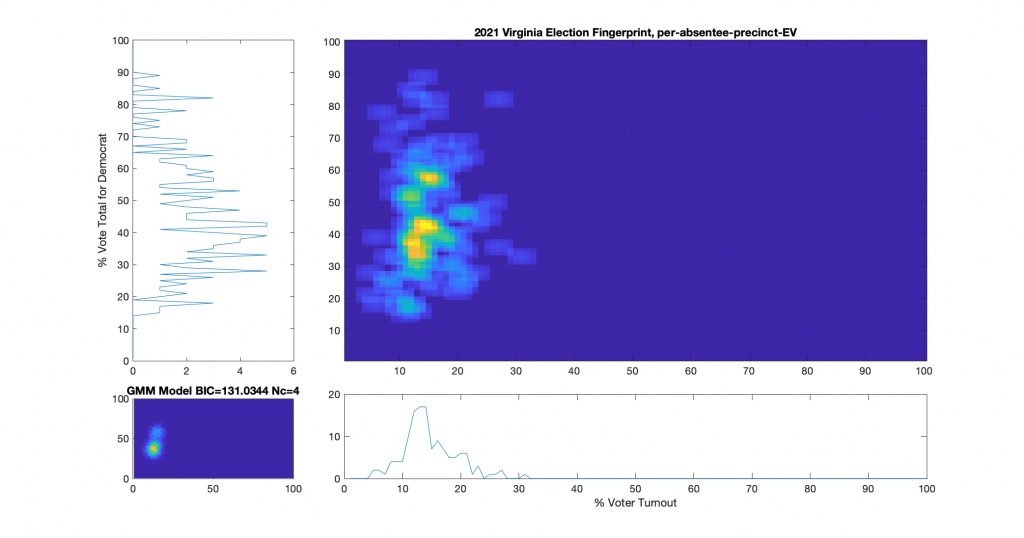
One of the nice differences about 2021 VA data is that they actually identified the distinctions between mail-in, early-in-person, and post-election vote tallies in the CAP’s this year. I have broken out the individual sub-groups as well and we can see that the absentee early-in-person (Figure 9) has a fairly diffuse distribution, while the absentee mail-in (Figure 7) and absentee post-election (Figure 8) ballots show a very high McAuliffe Vote %, and what looks to be a linear correlation.
For comparison I’ve also included the 2020 fingerprints. All of the 2020 fingerprints have been recomputed using the exact same MATLAB source code that processed the 2021 data. The archive date of the “2020 November General.csv” and “Turnout 2020 November General.csv” files used was 11/30/2020.
I welcome any and all independent reviews or assistance in making and double checking these results, and will gladly provide all collated source data and MATLAB code to anyone who is interested.
Figure 1 : VA 2021 Per locality, absentee (CAP) + physical precincts
Figure 2 : VA 2021 Per locality, physical precincts only:
Figure 3 : VA 2021 Per locality, absentee precincts only:
Figure 4 : VA 2021 Per precinct, absentee (CAP) + physical precincts:
Figure 5 : VA 2021 Per precinct, physical precincts only:
Figure 6 : VA 2021 Per precinct, absentee (CAP) precincts only:
Figure 7 : VA 2021 Per precinct, CAP precincts, mail-in ballots only:
Figure 8 : VA 2021 Per precinct, CAP precincts, post-election ballots only:
Figure 9 : VA 2021 Per precinct, CAP precincts, early-in-person ballots only:
Comparison to VA 2020 Fingerprints
Figure 10 : VA 2020 Per locality, absentee (CAP) + physical precincts:
Figure 11 : VA 2020 Per locality, physical precincts only:
Figure 12 : VA 2020 Per locality, absentee precincts only:
Figure 13 : VA 2020 Per precinct, absentee (CAP) + physical precincts:
Figure 14 : VA 2020 Per precinct, physical precincts only:
Figure 15 : VA 2020 Per precinct, absentee (CAP) precincts only:
During the 2021 election I archived multiple versions of the Statewide Daily Absentee List (DAL) files as produced by the VA Department of Elections (ELECT). As the name implies, the DAL files are a daily produced official product from ELECT that accumulates data representing the state of absentee votes over the course of the election. i.e. The data that exists in a DAL file produced on Tuesday morning should be contained in the DAL file produced on the following Wednesday along with any new entries from the events of Tuesday, etc.
Therefore, it is expected that once a Voter ID number is listed in the DAL file during an election period, subsequent DAL files *should* include a record associated with that voter ID. The status of that voter and the absentee ballot might change, but the records of the transactions during the election should still be present. I have confirmed that this is the expected behavior via discussions with multiple former and previous VA election officials.
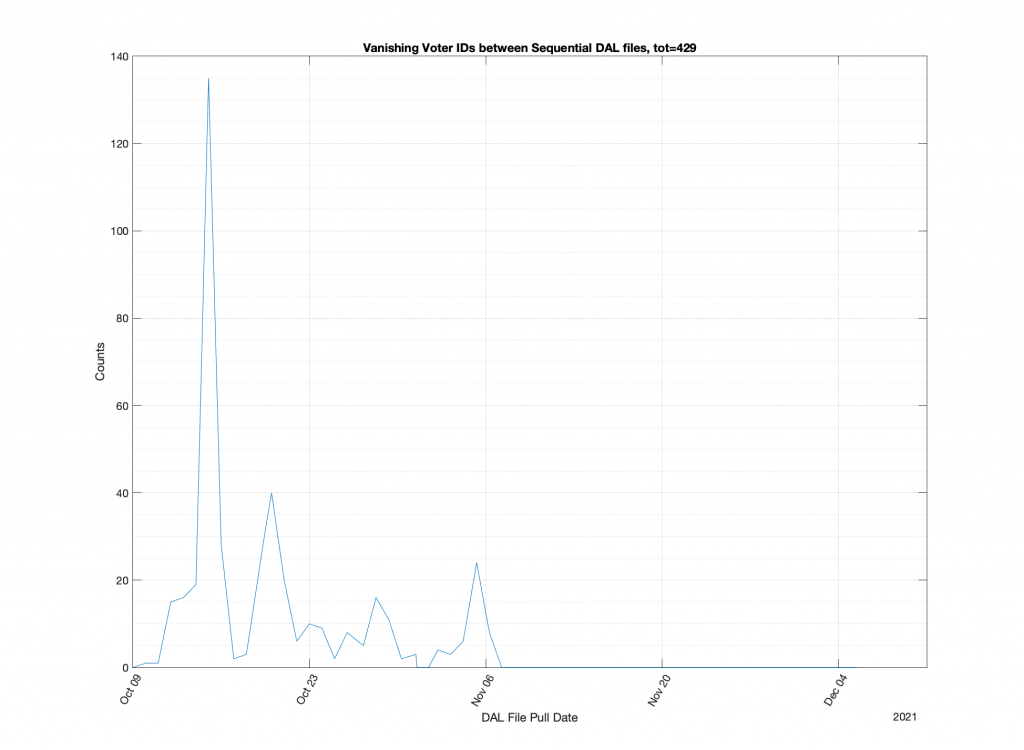
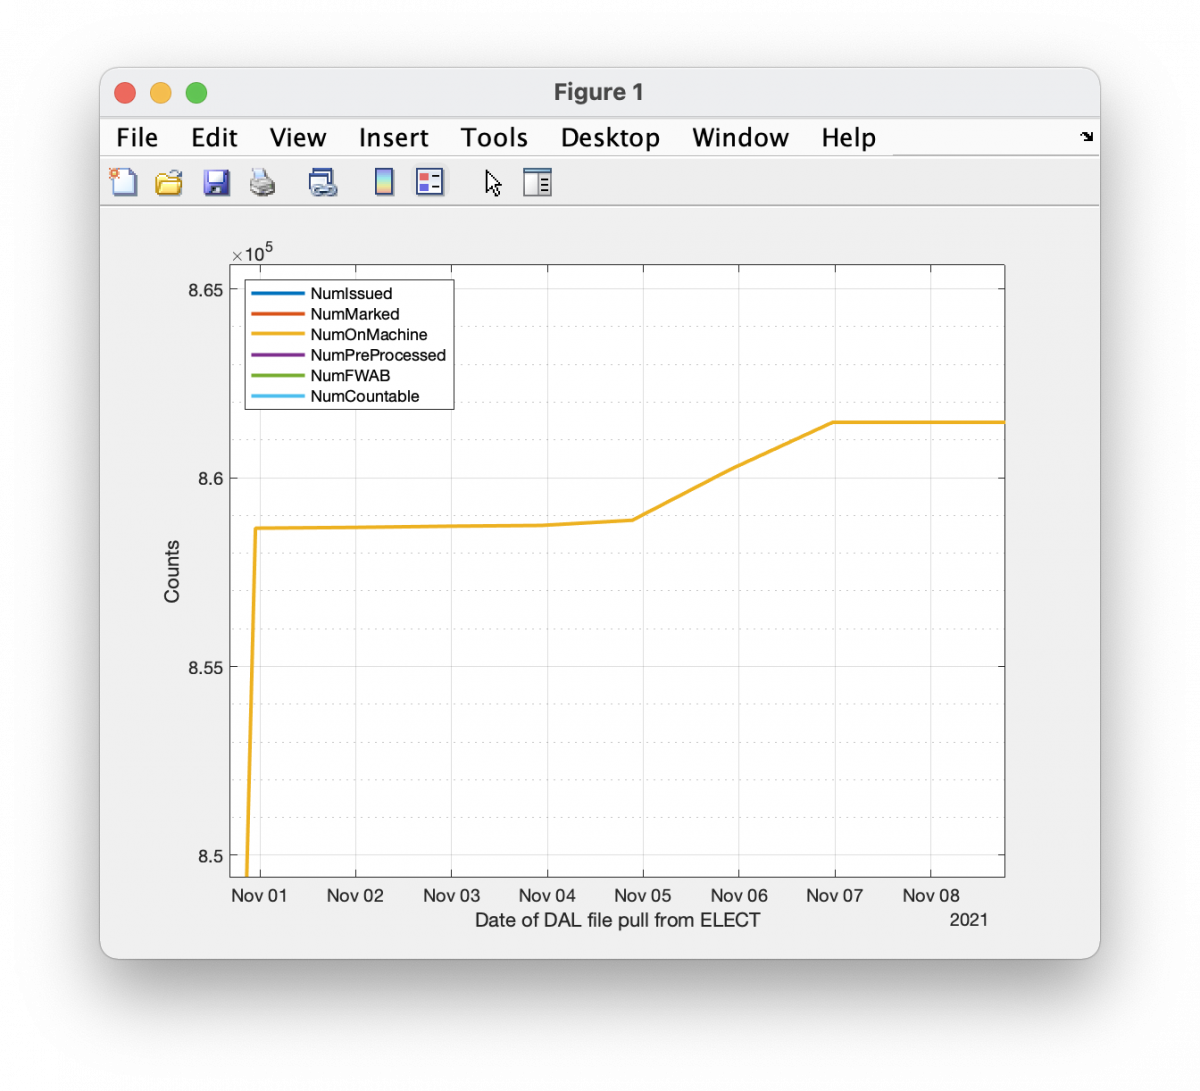
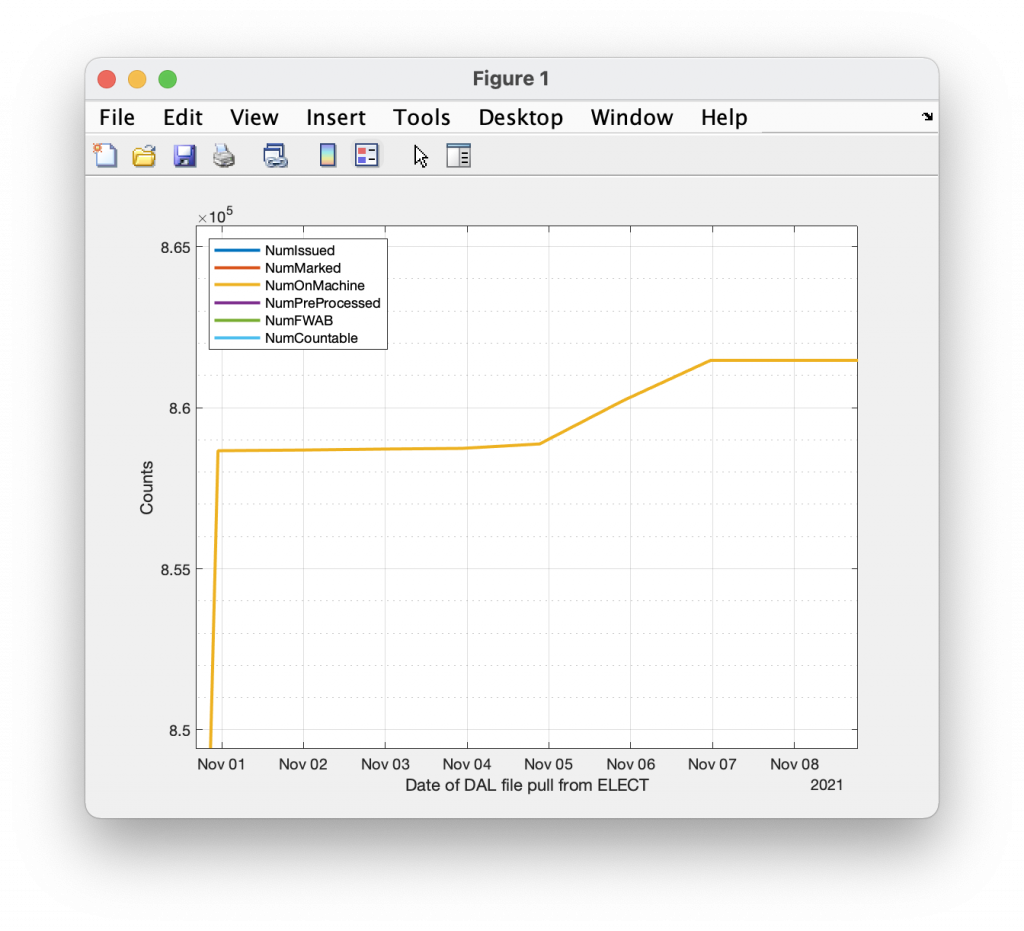
Stepping through the snapshots of collected 2021 DAL files in chronological order, we can observe Voter IDs that mysteriously “vanish” from the DAL record. We can do this by simply mapping the existence/non-existence of unique Voter ID numbers in each file. The plot below in Figure 1 is the counts of the number of observed “vanishing” ID numbers as we move from file to file. The total number of vanishing ID numbers is 429 over the course of the 2021 election. Not a large number. But it’s 429 too many. I can think of no legitimate reason that this should occur.
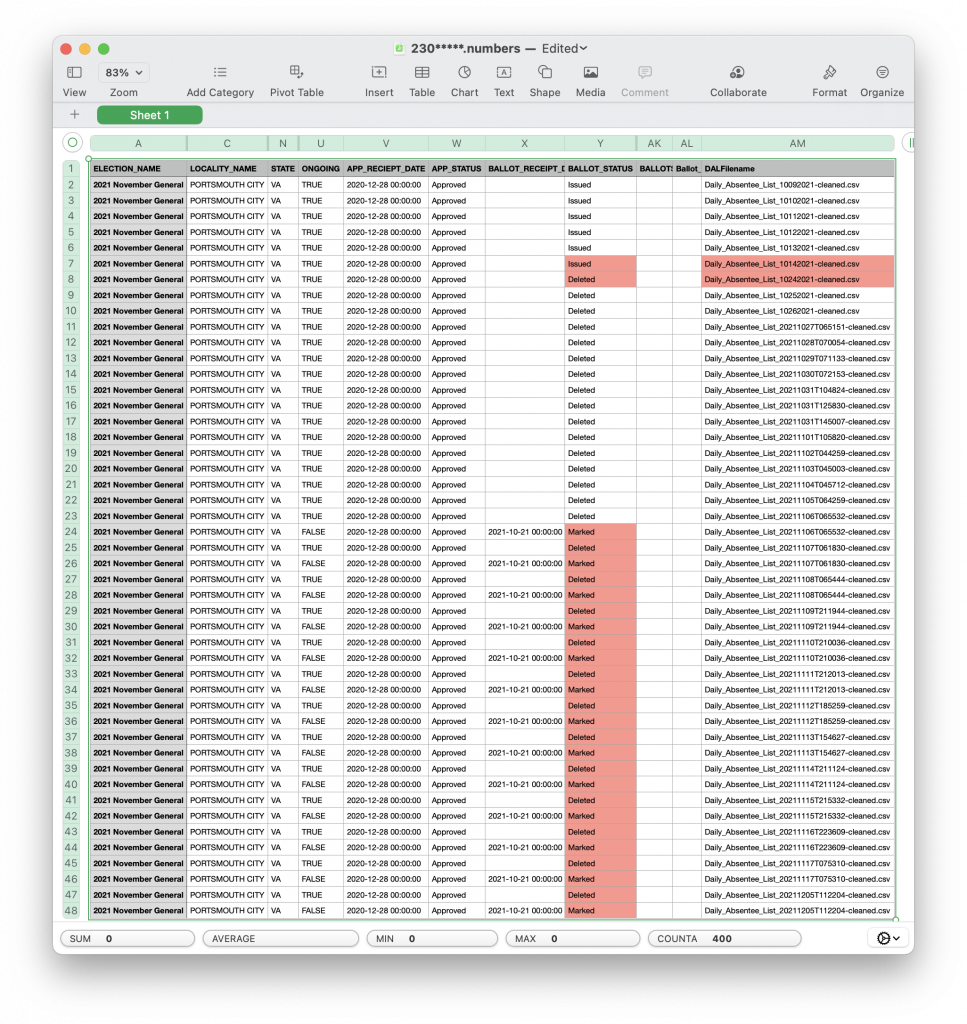
Now an interesting thing to do, is to look at a few examples of how these issues manifest themselves in the data. Note that I’m hiding the personally identifiable information from the DAL file records in the screenshots below, BTW.
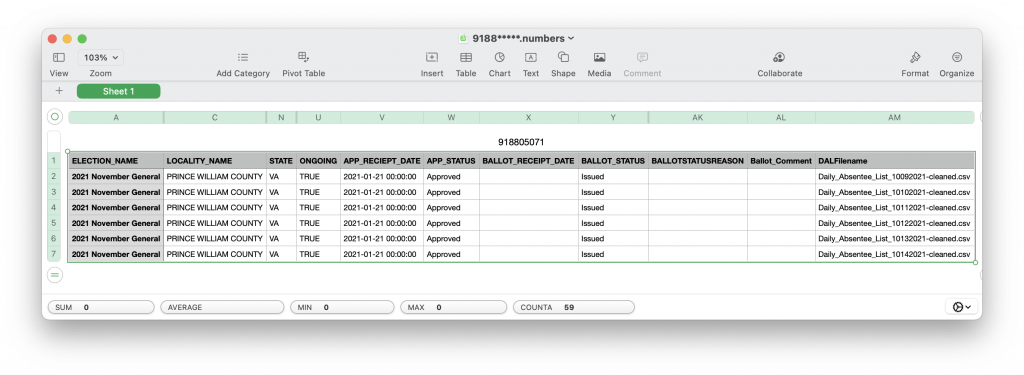
The first example in the screenshot below is an issue where the voter in question has a ballot that is in the “APPROVED” and “ISSUED” state, meaning that they have submitted a request for a ballot and that the ballot has been sent out. The record for this voter ID is present in the DAL file up until Oct 14th 2021, after which it completely vanishes from the DAL records. This voter ID is also not present in the RVL or VHL downloaded from the state on 11/06/2021.
This voter was apparently issued a real, live, ballot for 2021 and then was subsequently removed from the DAL and (presumably) the voter rolls + VERIS on or around the 14th Oct according to the DAL snapshots. What happened to that ballot? What happened to the record of that ballot? The only public record of that ballot even existing, let alone the fact that it was physically issued and mailed out, was erased when the Voter ID was removed from DAL/RVL/VHL records. Again, this removal happened in the middle of an election where that particular voter had already been issued a live ballot!
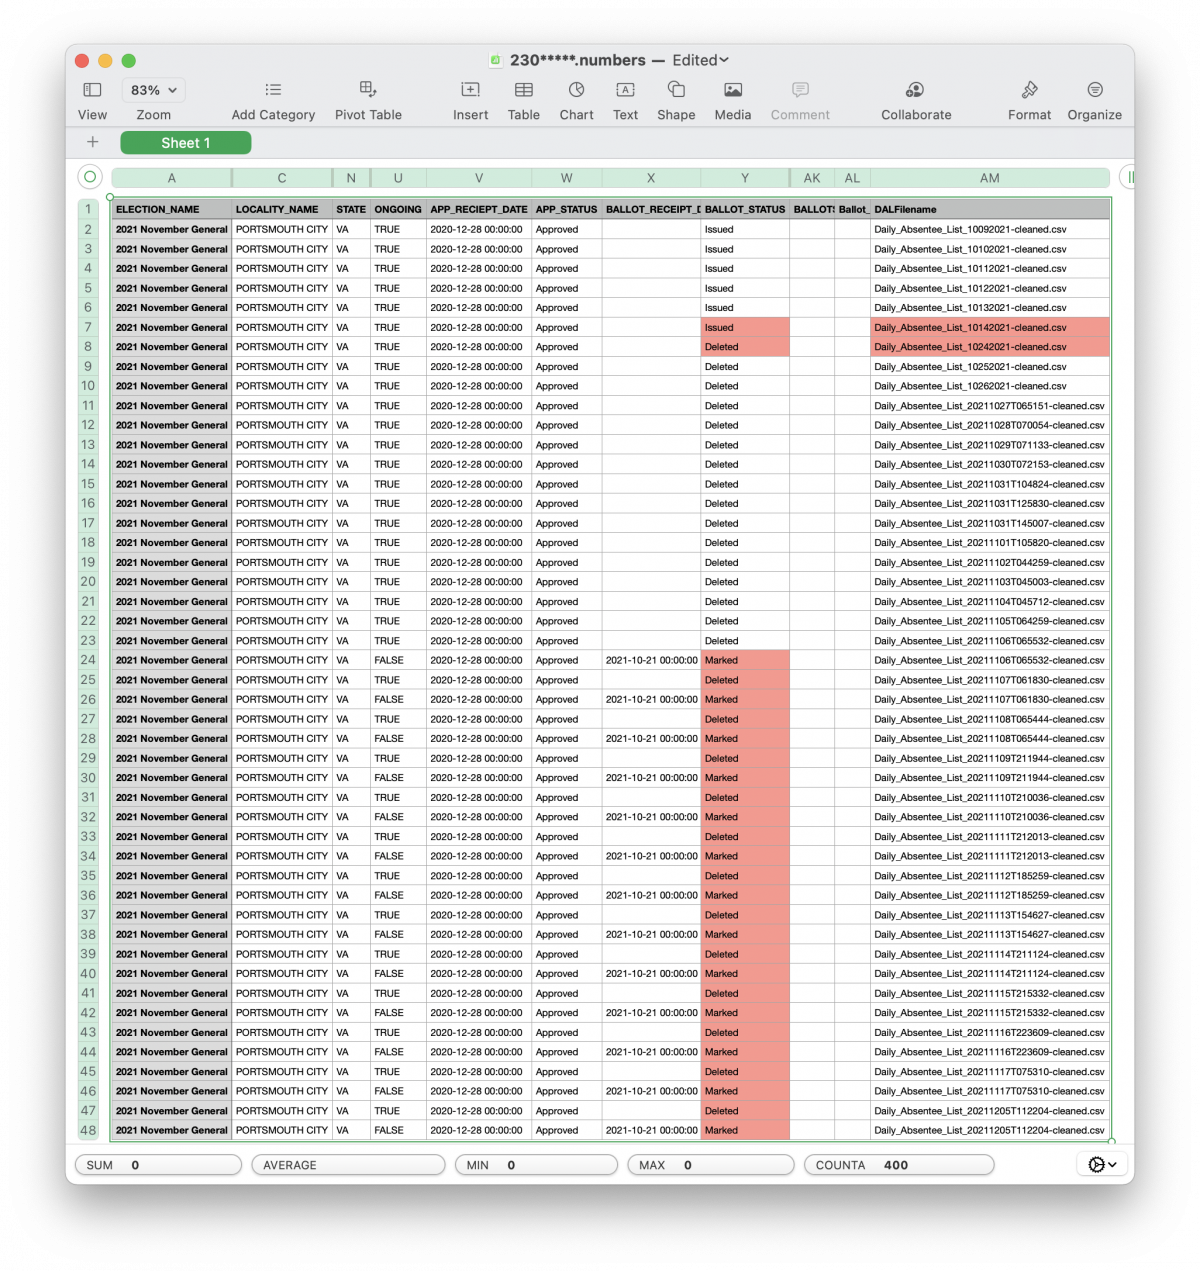
A few of these IDs actually “reappear” in the DAL records. ID “230*****” is one example, and a screenshot of its chronological record is below. The ballot shows as being ISSUED until Oct 14th 2021. It then disappears from the DAL record completely until the data pull on Oct 24th, where it shows up again as DELETED. This status is maintained until Nov 6th 2021 when it starts oscillating between “Marked” and “deleted” until it finally lands on “Marked” in the Dec 5 DAL file pull. The entire time the Application status is in the “Approved” state for this voter ID. From my discussions with registrars and election officials the “Marked” designation signifies that a ballot has been received by the registrar for that voter and is slated to be tabulated.
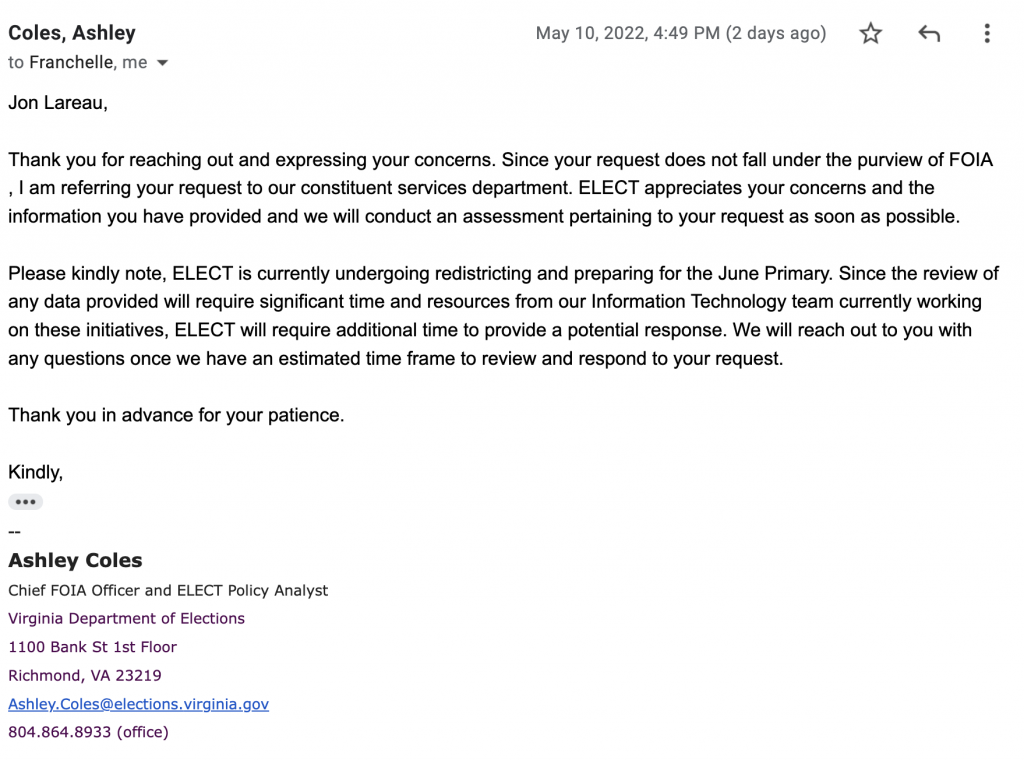
I have poked ELECT on twitter (@wwrkds) on this matter to try and get an official response, and submitted questions on this matter to Ashley Coles at ELECT, per the advice of my local board of elections chair. Her response to me is below:
Presented 2022-04-14 at Patriot Pub in Hamilton VA. Note that I mis-quoted the total registration error number off the slide deck during the voice track of my presentation. The slides are correct … my eyes and memory just suck sometimes! I said ~850K. The actual number is ~380K.
Previously I wrote about finding In-Person Early Vote records inserted into the Daily Absentee List (DAL) records after the close of early voting in VA in 2021. Well, theres been quite a bit of activity since then and I have somme updates to share.
I originally discovered this issue and began digging into it around Nov 8th 2021, and finally published it to my blog on Dec 10th 2021. At the same time, queries were sent through the lawyers for the RPV to the ELECT Chairman (Chris Piper) and to a number of registrars to attempt to determine the cause of this issue, but no response was supplied. I also raised this issue to my local Board of Elections chair, and requested that ELECT comment on the matter through their official twitter account.
Since that time I have continued to publish my findings, have continued to request responses from ELECT, and have offered to work with them to address and resolve these discrepancies. I know ELECT pays attention to this site and my twitter account, as they have quietly corrected both their website and data files after I have pointed out other errors and discrepancies. Additionally, Chris Piper has continued to publicly insist that there were no major issues in either the 2020 or 2021 election (including under questioning by the VA Senate P&E Committee), and neither he nor any member of ELECT has publicly acknowledged any of the issues I have raised … besides the aforementioned changing of their site contents, of course. I have thankfully had a few local board of elections members work with me, as well as a few local registrars … but I did not see any meaningful response or engagement from anyone at ELECT until Feb 23rd 2022 as discussed below.
On Feb 22nd 2022, I was invited to participate in a meeting arranged by VA State Senator Amanda Chase with the VA Attorney Generals office to discuss election integrity issues. I specifically cited a number of the issues that I’ve documented here on my blog, including the added DAL entries, as justification for my belief that there is an arguable case to be made for there being criminal gross negligence and maladministration at ELECT with respect to the administration and handling of VA election data.
That meeting apparently shook some things loose. Good.
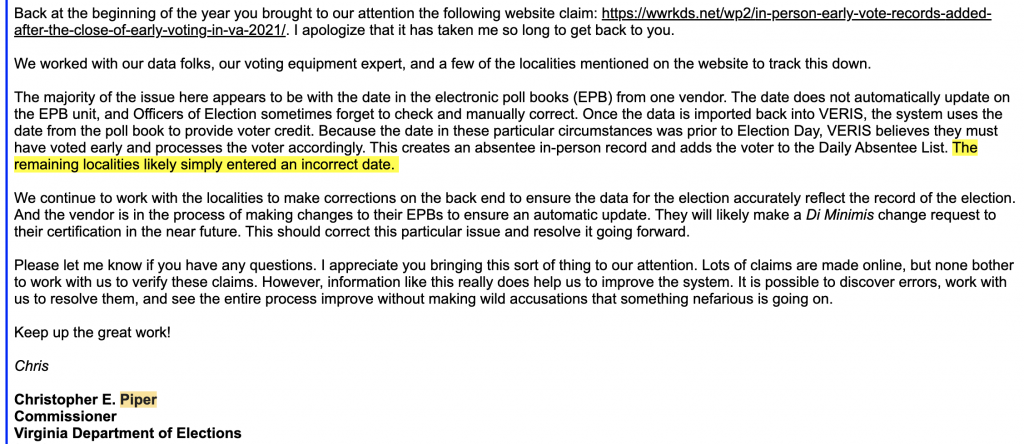
The day after that meeting Chris Piper finally sent a response at 10:45am to our inquiry on the subject of the added DAL entries. It is quoted below:
While I am glad that he finally responded, his technical reasoning does not address all of the symptoms that are observed:
He states the cause was due to the EPB’s from one vendor, but the data shows DAL additions being attributed to multiple localities that use different EPB vendors.
His explanation does not address the distribution of the numbers of DAL additions across all of the precincts observed. A misconfigured or malfunctioning poll book would affect all of the check-ins entered on it, not just a sporadic few.
This also does not seem like a minor issue as its affecting thousands of voters ballots and voter history. So I’m rather concerned with Mr. Piper’s attitude toward this issue, as well as others. It needs to be addressed as a logic and accuracy testing issue, as a matter of procedures and training, in addition to simply asking vendors to add checks to their software. Also, will this be addressed in VERIS at all, or if/when a replacement system is put in place?
In response to his last paragraph, I will simply note that I have been actively and consistently working to raise all of these issues through official channels … through official requests via the RPV, working with local election board members and registrars, and asking for input from elect through social media. I have not made accusations of malicious or nefarious intent, but I do think there is plenty of evidence to make the case of incompetence +/or gross negligence with our elections data … which is actually a crime in VA … and Chris Piper has been the head of ELECT and the man responsible for ensuring our election data during that time (he is stepping down effective March 11th).
Since his response was sent, a few additional things have occurred:
(A) The AG’s office informed us that they are actually required by law to treat ELECT as their client and defend them from any accusations of wrongdoing. This is frustrating as there does not seem to be any responsive cognizant authority that is able to act on this matter in the interest of the public. This is not a local jurisdictional issue as it affects voters statewide, and is therefore in the purview of the AG as the Department of Elections has been heretofore dismissive and non-responsive of these matters. I am not a lawyer, however.
(B) I was able to connect with the Loudoun County Deputy Director of Elections (Richard Keech) as well as the Prince William County registrar (Eric Olsen) and have been working through the finer details of Chris’s explanation to verify and validate at the local level. [Note: I previously had Richard erroneously listed here as the Registrar instead of the Deputy Directory]. Both Richard and Eric are continuing to look into the matter, and I continue to work with them to get to the bottom of this issue.
Richard confirmed his belief that the bad OS system date on Election Day EPBs was responsible for the errors, however with some slight differences in the details from Piper’s description. There were multiple vendors affected, not just one. Per Richard, the problem appeared to be that a number of Loudoun poll-books (regardless of vendor) that were used for Election Day had been in storage so long that their batteries had completely depleted. When they were finally powered up, their OS system clocks had a wildly incorrect date. The hardware used was a mixture of Samsung SM-T720 and iPad tablets, depending on poll-book application vendor. The hardware was purchased separately through local contracts with CDW, and the software was uploaded and configured by the vendors.
In Loudoun, all of the EPBs went through logic and accuracy testing before the election per Richard, but it does not appear that the procedures for the Logic and Accuracy testing had any specific checks for OS date settings.
In Prince William County the registrar (Eric) was not aware of any issues with the system clocks on the poll-books, and he was skeptical of the distribution of the small numbers of added DAL entries. He noted, as I did above, that if a poll book was misconfigured it would affect all of the records that passed through it, not just a small handful. He also noticed that there was a discrepancy with the attribution of polling place names that I had extracted from the DAL files, where some of the names did not correspond with actual polling places in PWC. He has stated he will look into the matter and get back to me. I will update my blog when he does so.
From my communications with Richard, the VERIS system imports a text based file for processing voter credit and does not have any special checks against the dates for in-person vs early voting records. Hence, why this issue can impact multiple vendors if their applications use the system clock to date-stamp their exported txt files for upload into VERIS.
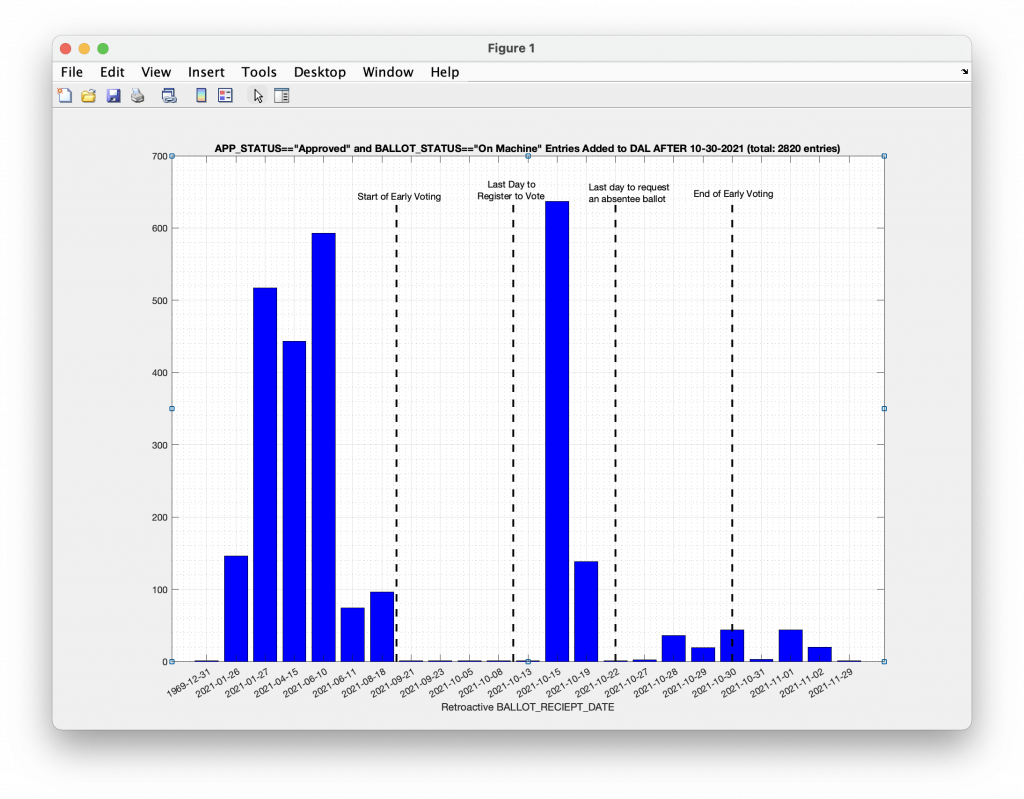
(C) I have reworked my code per my conversations with Ricky and Eric, and fixed a few bugs and parsing errors along the way. Most notably, there are a number of missing or malformed field values in the raw DAL files that were being parsed into ‘undefined’ categorical values by the default csv MATLAB parser. These ‘undefined’ values, even when located in unimportant fields in the row of a MATLAB table, can cause the entire row to be incomparable to other entries when performing logical operations. I have adjusted my parser and logic to account for +/or ignore these entries as necessary. Additionally I had previously looked for new entries by comparing values across entire rows, but have adjusted to now only look at voter ID numbers that have not been seen previously, in order to omit those entries that had simply been adjusted (address changes, etc) after the fact, or that contained ‘undefined’ field elements as mentioned previously. Also I noticed that some of the dal files had duplicate records of Approved and On-Machine records for the same voter ID. While that is an issue in itself, I de-duplicated those entries for this analysis. This new logic gives the updated results presented below, with a total number of discrepancies now at 2820.
I will note that I am still a little skeptical of the “bad date” explanation as being a complete answer to this issue, as it does not adequately explain the distribution of small numbers of discrepancies attributed to multiple precincts, for one thing. While the bad date may explain part of the issue, it does not adequately account for all of the observed effects, IMO. For example, in Loudoun there are 26 precincts listed below that have inserted DAL records attributed to them. Many of these precincts having only 1 or 2 associated records. If the bad OS date explanation is to blame, then (a) there must have been at least 26 poll-books, one at each precinct, in Loudoun with misconfigured and incorrect dates AND (b) many of these poll-books were used to only check in 1 or 2 people total, as anyone checked in on a misconfigured poll-book would have their voter credit/DAL file entries affected. This would have to have been replicated at ALL of the precincts in ALL of the localities listed below. While the above scenario is admittedly possible, I find it rather implausible.
Update 2022-03-20
I’ve heard back from both Ricky Keech (Loudoun) and Eric Olsen (PWC).
Eric looked into the 10 entries for PWC and all of them were Military voters who did actually walk in, in person, to the registrars office and vote on machine absentee after the close of early voting, as allowed for by state law. So everything checks out for PWC.
Per discussion with Ricky, there were two issues: The first being a number of pollbooks for four specific precincts that were used for Election Day having the wrong date setting as discussed above. The other issues was possibly the connectivity issue of the Pollbook to the servers in South Riding during the early voting period that had to be hand corrected. Ricky’s explanation e-mail to me is copied below.
Hi Jon,
Following up on our conversation the other day. So, I did some more digging and was able to figure out what happened. The bulk of the voters (1213) were from the four precincts that had a tablet with the wrong date on it. That accounts for all voters in precincts 214, 416, 628, and 708. I had a staff person go back and pull out the tablets used in those precincts, and we confirmed that each of those four had one table with the wrong date.
That leaves 141 voters that received ‘credit’ after election day. Once we had narrowed it down, I looked for patterns and noticed all the remaining precincts were in South Riding. That jogged my memory and led me to the solution. When I ran the final reports on the Sunday before the election, I noticed that the number showing as voting early seemed to be off by 100 or so. This was odd because our daily checked in count and voted count reconciled at every site every day. So, I went back and compared the voters checked into our pollbooks at early voting to the voters with early voting (On Machine) credit in VERIS and found that there were 137 voters who voted on October 19 at the Dulles South EV site and for some reason did not have credit. I worked on this Monday to make sure it was right, and it was, none of those voters had credit. This could either have been a connectivity issue at Dulles South EV site OR an issue with VERIS when the data was uploaded to mark the voters. I can say definitively that the number checked in on the pollbooks at that site on that day and the number of people who put ballots into the machine was correct, we check that constantly and the observers on site checked as well. I can guarantee that if there had been a discrepancy, we’d have heard about it right away.
So, after determining that was exactly what happened I uploaded credit for those voters at 2:06:51pm on Wednesday, November 3 and the upload completed processing at 2:07:07pm.
When we spoke the other day, I thought it was likely a connectivity issue, but now I’m not entirely sure that’s the case, as if the connection wasn’t working the numbers should have been off. And they were correct on the devices at the EV site and my laptop here at the office. Everything matched.
So long story short, we did an audit, discovered missing credit from one early voting site on one day, and corrected it.
The other four voters were people who voted an emergency early voting ballot on Monday, November 1.
Richard Keech, Deputy Director of Elections for Loudoun County, Mar 11 2022 email to Jon Lareau
The MATLAB code for generating the above is given below. The raw time-stamped DAL data files, as downloaded from the ELECT website, are loaded from the ‘droot’ directory tree as shown below, and I only utilize the latest daily download of DAL file data for simplicity.
warning off all
% Data directory root
droot = 'SourceData/DAL/2021/';

% Gets the list of DAL files that were downloaded from the ELECT provided
% URL over the course of the 2021 Election.
files = dir([droot,'raw/**/Daily_Absentee_List_*.csv']);
matc = regexp({files.name}, 'Daily_Absentee_List_\d+(T\d+)?.csv','match');
matc = find(~cellfun(@isempty,matc));
files = files(matc);

% Only process the last updated DAL for each day.  I downloaded multiple
% times per day, but we will just take the last file downloaded each day
% for simplicity here.
matc = regexp({files.name}, '(\d+)(T\d+)?','tokens');
fd = []; pc = 0; ic = 0; idx = [];
for i=1:numel(matc)
    if isempty(regexp(matc{i}{1}{1},'^2021.*'))
        fd(i) = datenum(matc{i}{1}{1},'mmddyyyy');
    else
        fd(i) = datenum(matc{i}{1}{1},'yyyymmdd');
    end
    datestr(fd(i))
    if pc ~= fd(i)
        ic = ic+1;
    end
    idx(ic) = i;
    pc = fd(i);
end
files = files(idx);

% Now that we have our list of files, lets process.
seen = [];
firstseen = [];
astats = [];
astatsbc = {};
cumOnMachine = [];
T = [];
for i = 1:numel(files)
    % Extract the date of the ELECT data pull.  Note that the first few
    % days I was running the script I was not including the time of the
    % pull when I was pulling the data fro the ELECT url and writing to
    % disk, so there's soe special logic here to handle that issue.
    matc = regexp(files(i).name, '(\d+)(T\d+)?','tokens');
    matc = [matc{1}{:}];
    if isempty(regexp(matc,'^2021.*'))
        fdn = datenum(matc,'mmddyyyy')+.5;
    else
        fdn= datenum(matc,'yyyymmddTHHMMSS');
    end
    fds = datestr(fdn,30)
    fdt = datetime(fdn,'ConvertFrom','datenum');

    % Move a copy to the 'byDay' folder so we can keep a reference to the
    % data that went into this analysis.
    dal2021filename = [files(i).folder,filesep,files(i).name];
    ofn = [droot,'byDay/Daily_Absentee_List_',fds,'.csv'];
    if ~exist(ofn)
        copyfile(dal2021filename,ofn);
    end

    % Import the DAL file
    dal2021 = import2021DALfile(dal2021filename, [2, Inf]);

    % Cleanup and handle undefined or imssing values.
    dal2021.CITY(isundefined(dal2021.CITY)) = 'UNDEFINED';
    dal2021.STATE(isundefined(dal2021.STATE)) = 'UNDEFINED';
    dal2021.ZIP(isundefined(dal2021.ZIP)) = 'UNDEFINED';
    dal2021.COUNTRY(isundefined(dal2021.COUNTRY)) = 'UNDEFINED';

    % Do some basic indexing of different DAL status categories and combinations
    appvd = dal2021.APP_STATUS == 'Approved' ;
    aiv2021 = appvd & dal2021.BALLOT_STATUS == 'Issued';
    amv2021 = appvd & dal2021.BALLOT_STATUS == 'Marked';
    aomv2021 = appvd & dal2021.BALLOT_STATUS == 'On Machine';
    appv2021 = appvd & dal2021.BALLOT_STATUS == 'Pre-Processed';
    afwv2021 = appvd & dal2021.BALLOT_STATUS == 'FWAB';
    appmv2021 = amv2021 | aomv2021 | appv2021 | afwv2021; % Approved and Countable

    % Accumulate the stats for each DAL file
    rstats = table(fdt,sum(aiv2021),sum(amv2021),sum(aomv2021),...
        sum(appv2021),sum(afwv2021),sum(appmv2021),'VariableNames',{'DALFileDate',...
        'NumIssued','NumMarked','NumOnMachine','NumPreProcessed','NumFWAB','NumCountable'});
    astats = [astats; rstats];

    % Write out the entries that were approved and countable in this DAL
    % file
    ofn = [droot,'byDayCountable/Daily_Absentee_List_Countable_',fds,'.csv'];
    if ~exist(ofn)
        writetable(dal2021(appmv2021,:),ofn);
    end

    % Write out the entries that were approved, countable and marked as 'On
    % Machine' (i.e. an Early In-Person Voter Check-In) in this DAL file
    ofn = [droot,'byDayCountableOnMachine/Daily_Absentee_List_Countable_OnMachine',fds,'.csv'];
    if ~exist(ofn)
        writetable(dal2021(aomv2021,:),ofn);
    end

    % Since the DAL file grows over time, we're going to try and figure out
    % which On-Machine entries in each new file:
    %       (a) We've seen before and are still listed.
    %       (b) We haven't seen before (a NEW entry).
    %       (c) We've seen before but the listing is missing (a DELETED
    %           entry).
    if isempty(T)
        % Only applicable for the first file we process.
        T = dal2021(aomv2021,:);

        % There are sometimes duplicate uid numbers in the approved and
        % on-machine counts!  This is a problem in and of itself, but not
        % the problem I'm trying to focus on at the moment.  So I'm going
        % to remove any duplicated rows based on UID.
        [uid, ia, ib] = unique(T.identification_number);
        T = T(ia,:);
        inew = (1:size(T,1))';
        ideleted = [];
        firstseen = repmat(fdt,size(T,1),1);
    else
        dOM = dal2021(aomv2021,:);

        % There are sometimes duplicate uid numbers in the approved and
        % on-machine counts!  This is a problem in and of itself, but not
        % the problem I'm trying to focus on at the moment.  So I'm going
        % to remove any duplicated rows based on UID.
        [uid, ia, ib] = unique(dOM.identification_number);
        dOM = dOM(ia,:);

        %[~,ileft,iright] = innerjoin(T,dOM);
        [~,ileft,iright] = intersect(T.identification_number,dOM.identification_number);

        % 'inew' will be a boolean vector representing those entries in
        % 'dOM' that are new On-Machine records
        inew = true(size(dOM,1),1);
        inew(iright) = false;

        % 'ideleted' will be a boolean vector representing those entries in
        % 'T' that are missing On-Machine records in 'dOM'
        ideleted = true(size(T,1),1);
        ideleted(ileft) = false;
        T = [T;dOM(inew,:)];
        firstseen = [firstseen; repmat(fdt,sum(inew),1)];
    end
    clf;
    plot(astats.DALFileDate,astats{:,2:end},'LineWidth',2);
    grid on;
    grid minor;
    legend(astats.Properties.VariableNames(2:end),'Location','NorthWest');
    xlabel('Date of DAL file pull from ELECT');
    ylabel('Counts');
    drawnow;
end
ofn = [droot,'byDayStats.csv'];
writetable(astats,ofn);
T.FirstSeen = firstseen;
ofn = [droot,'onMachineRecords.csv'];
writetable(T,ofn);
ofn = [droot,'onMachineRecords_missing.csv'];
writetable(T(ideleted,:),ofn);
cutoffDate = datetime('2021-11-01');
ofn = [droot,'onMachineRecords_after_20211101.csv'];
writetable(T(T.FirstSeen >= cutoffDate,:),ofn);
Ta = T(T.FirstSeen >= cutoffDate,:);
[ulocality,ia,ib] = unique(Ta.LOCALITY_NAME);
clocality = accumarray(ib,1,size(ulocality));
Tu = table(ulocality,clocality,'VariableNames',{'Locality','COUNT'});
ofn = [droot,'numOnMachineRecords_after_20211101_byLocality.csv'];
writetable(Tu,ofn);
Ta = T(T.FirstSeen >= cutoffDate,:);
[uprecinct,ia,ib] = unique(join([string(Ta.LOCALITY_NAME),string(Ta.PRECINCT_NAME)]));
cprecinct = accumarray(ib,1,size(uprecinct));
Tu = table(Ta.LOCALITY_NAME(ia),Ta.PRECINCT_NAME(ia),cprecinct,'VariableNames',{'LOCALITY','PRECINCT','COUNT'});
ofn = [droot,'numOnMachineRecords_after_20211101_byLocalityByPrecinct.csv'];
writetable(Tu,ofn);
The adjusted MATLAB parser function is listed below:
function dal = import2021DALfile(filename, dataLines)
%IMPORTFILE Import data from a text file
%  DAILYABSENTEELIST10162021 = IMPORTFILE(FILENAME) reads data from text
%  file FILENAME for the default selection.  Returns the data as a table.
%
%  DAILYABSENTEELIST10162021 = IMPORTFILE(FILE, DATALINES) reads data
%  for the specified row interval(s) of text file FILENAME. Specify
%  DATALINES as a positive scalar integer or a N-by-2 array of positive
%  scalar integers for dis-contiguous row intervals.
%
%  Example:
%  dal = import2021DALfile("SourceData/DAL/Daily_Absentee_List_10162021.csv", [2, Inf]);
%
%  See also READTABLE.
%
% Auto-generated by MATLAB on 16-Oct-2021 14:19:26
%% Input handling
% If dataLines is not specified, define defaults
if nargin < 2
    dataLines = [2, Inf];
end
%% Set up the Import Options and import the data
opts = delimitedTextImportOptions("NumVariables", 38);

% Specify range and delimiter
opts.DataLines = dataLines;
opts.Delimiter = ",";

% Specify column names and types
opts.VariableNames = ["ELECTION_NAME", "LOCALITY_CODE", "LOCALITY_NAME", "PRECINCT_CODE", "PRECINCT_NAME", "LAST_NAME", "FIRST_NAME", "MIDDLE_NAME", "SUFFIX", "ADDRESS_LINE_1", "ADDRESS_LINE_2", "ADDRESS_LINE_3", "CITY", "STATE", "ZIP", "COUNTRY", "INTERNATIONAL", "EMAIL_ADDRESS", "FAX", "VOTER_TYPE", "ONGOING", "APP_RECIEPT_DATE", "APP_STATUS", "BALLOT_RECEIPT_DATE", "BALLOT_STATUS", "identification_number", "PROTECTED", "CONG_CODE_VALUE", "STSENATE_CODE_VALUE", "STHOUSE_CODE_VALUE", "AB_ADDRESS_LINE_1", "AB_ADDRESS_LINE_2", "AB_ADDRESS_LINE_3", "AB_CITY", "AB_STATE", "AB_ZIP", "BALLOTSTATUSREASON", "Ballot_Comment"];
opts.VariableTypes = ["string", "string", "categorical", "string", "string", "string", "string", "string", "string", "string", "string", "string", "categorical", "categorical", "categorical", "categorical", "categorical", "string", "string", "string", "categorical", "string", "categorical", "string", "categorical", "double", "string", "categorical", "categorical", "categorical", "string", "string", "string", "string", "string", "string", "string", "string"];

% Specify file level properties
opts.ExtraColumnsRule = "ignore";
opts.EmptyLineRule = "read";

% Specify variable properties
opts = setvaropts(opts, ["ELECTION_NAME", "LOCALITY_CODE", "PRECINCT_CODE", "PRECINCT_NAME", "LAST_NAME", "FIRST_NAME", "MIDDLE_NAME", "SUFFIX", "ADDRESS_LINE_1", "ADDRESS_LINE_2", "ADDRESS_LINE_3", "EMAIL_ADDRESS", "FAX", "VOTER_TYPE", "APP_RECIEPT_DATE", "BALLOT_RECEIPT_DATE", "PROTECTED", "AB_ADDRESS_LINE_1", "AB_ADDRESS_LINE_2", "AB_ADDRESS_LINE_3", "AB_CITY", "BALLOTSTATUSREASON", "Ballot_Comment"], "WhitespaceRule", "preserve");
opts = setvaropts(opts, ["ELECTION_NAME", "LOCALITY_CODE", "LOCALITY_NAME", "PRECINCT_CODE", "PRECINCT_NAME", "LAST_NAME", "FIRST_NAME", "MIDDLE_NAME", "SUFFIX", "ADDRESS_LINE_1", "ADDRESS_LINE_2", "ADDRESS_LINE_3", "CITY", "STATE", "COUNTRY", "INTERNATIONAL", "EMAIL_ADDRESS", "FAX", "VOTER_TYPE", "ONGOING", "APP_RECIEPT_DATE", "APP_STATUS", "BALLOT_RECEIPT_DATE", "BALLOT_STATUS", "PROTECTED", "CONG_CODE_VALUE", "STSENATE_CODE_VALUE", "STHOUSE_CODE_VALUE", "AB_ADDRESS_LINE_1", "AB_ADDRESS_LINE_2", "AB_ADDRESS_LINE_3", "AB_CITY", "AB_STATE", "BALLOTSTATUSREASON", "Ballot_Comment"], "EmptyFieldRule", "auto");

% Import the data
dal = readtable(filename, opts);

% Perform some cleanup on commonly found issues...
dal.Ballot_Comment = strrep(dal.Ballot_Comment,char([13,10]),". ");
dal.BALLOTSTATUSREASON = strrep(dal.BALLOTSTATUSREASON,char([13,10]),". ");
dal.LOCALITY_NAME = categorical(strtrim(string(dal.LOCALITY_NAME)));
dal.PRECINCT_NAME = categorical(regexprep(strtrim(string(dal.PRECINCT_NAME)),'^(\d+)( +)(\w+)','$1 - $3'));
end
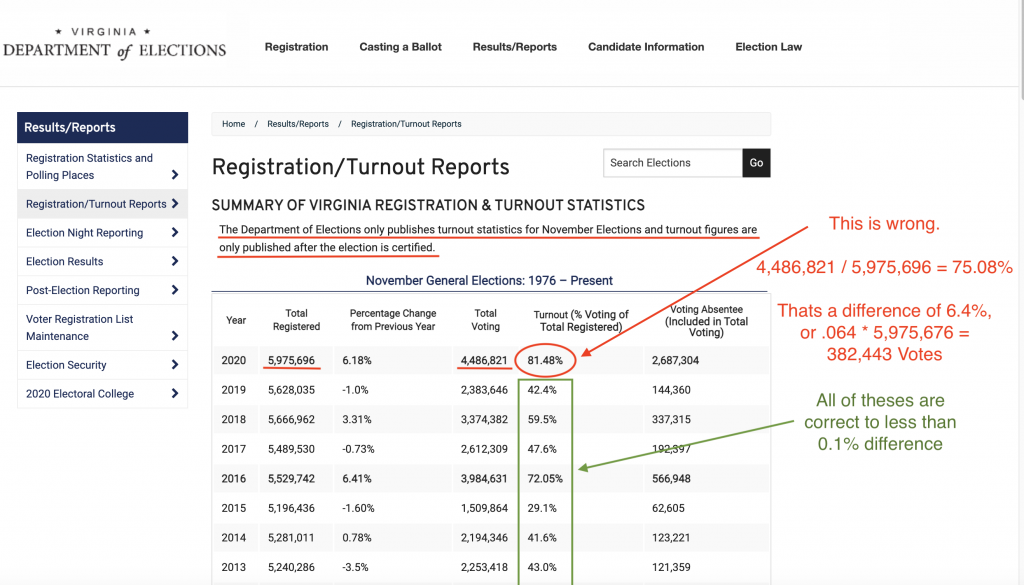
A while back I posted about the fact that the official turnout numbers on the VA Dept of Elections (“ELECT”) website we’re incorrect. ELECT’s webpage showed the turnout for the 2020 election was 81.48%, when their own stats on the same page clearly show the results should be 75.08%.
I first published this discrepancy on Aug 13 2021 via twitter (here), and then again on Sep 09 2021 on this blog (as well as twitter) in the first section of my 2020 analysis report (here). ELECT subsequently (and quietly) updated their results page by Sept 10th, but made no public notice as to the error and revision, and never responded to my questions to them as to how the error came about in the first place, why was it still on their official results page for almost a year, and what were they doing to ensure these types of errors didn’t happen again. I subsequently updated my 2020 analysis report to include the silent update of the results by ELECT (here).
In going over and reviewing some of my 2020 work and trying to make sure all of my documentation is complete, I’ve come across another tidbit of interesting information regarding the results on the ELECT site:
There were other silent updates to the official results that predate my finding the wrong turnout numbers.
Using the wayback machine (here), the first record I can find that has the 2020 results is from March 10 2021. Subsequent changes made to the values that can be seen with the wayback machine data are summarized below.
Wayback Machine Date
Year
Total Registered
Percent Change from Previous Year
Total Voting
Turnout (% Voting of Total Registered)
Voting Absentee (included in Total Voting)
2021-09-10
2020
5,975,696
6.18%
4,486,821
75.08%
2,687,304
2021-09-08
2020
5,975,696
6.18%
4,486,821
81.48%
2,687,304
2021-04-09
2020
5,975,696
6.18%
4,486,821
81.48%
2,687,304
2021-04-02
2020
5,975,802
6.18%
4,413,388
73.85%
2,614,927
2021-03-10
2020
5,975,802
6.18%
4,413,388
73.85%
2,614,927
Statistics posted on https://www.elections.virginia.gov/resultsreports/registrationturnout-statistics/ (as per the WayBack Machine) at different times since the close of the 2020 election.
From the table above there looks to have been a change sometime between April 2nd and April 9th to the number of registered voters, the total number of voters in the 2020 election, the turnout statistic, and the number of voters voting absentee. There also was a change sometime between Sept 8th and Sept 10th to the turnout statistic (presumably in response to my documenting the error and publishing it).
The entry from 2021-03-10 agrees with the official Election 2020 Summary Report dated 2021-01-25. The entry 2021-09-10 agrees with the Election 2020 Summary Report dated 2021-10-01. To their credit, ELECT has at least put a notice on the page for the Election Summary Reports that the report was updated on Oct 1st, but there is no explanation as to the reasoning for the revisions.
I would like to know why was ELECT modifying the results for months after the close of the election? Where did the extra ~73K ballots come from that were added to the results on April 9th? Where did the 81% come from?
On a spur of curiosity I went back to some of the data provided by the VA dept of elections (“ELECT”) for both the 2020 and 2021 elections and ran a new data consistency test …
I have a copy of the final Daily Absentee List (DAL) for both 2020 and 2021. I also have a copy of the paired Registered Voter List (RVL) and Voter History List (VHL) generated shortly after the close of the 2021 General Election and within a few moments of each other.
I was curious what the percentage of approved and counted absentee ballots from the DAL is that do NOT have an associated “voter credit” in the VHL for both 2020 and 2021. If ELECT’s data is accurate the number should be ideally 0, but most official thresholds for acceptability that I’ve seen for accuracy in election data systems hover somewhere around 0.1%. (0.1% is a fairly consistent standard that I’ve seen per the documentation for various localities Risk Limiting Audits, and the Election Scanner Certification procedures, etc.) The VHL should cover all of the activity for the last four years, but to ensure that I’m accounting for people that might have been officially removed from the RVL and VHL since the 2020 election (due to death, moving out of state, etc), I only run this test on the subset of the entries in the DAL that still have a valid listings in the RVL.
The results are below. Both years seem to have a high amount of discrepancies compared to the 0.1% threshold, with 2020’s discrepancy percentage being over 3x the percentage computed for 2021.
Year
Percent of Counted DAL Ballots without Voter Credit
2020
1.352%
2021
0.449%
For those interested in the computation, the MATLAB pseudo-code is given below. I can’t actually link to the source data files because of VA’s draconian restrictions on redistributing the contents of the DAL, RVL and VHL data files.
%%%%%%%%%%%%%%%%%%%%%%%%%%%%%%%%%%%%%%%%%%%%%%%%%%%%%%%%%%
% We first compute the indices of the DAL entries that represent
% approved and countable ballots ...
%
% 'dal2020' and 'dal2021' variables are the imported DAL tables
% 'VAVoteHistory' is the imported Voter History List
% 'RegisteredVoterList' is the Registered Voter List
%
% All four of the above are imported directly from the CSV
% files provided from the VA Department of elections with
% very little error checking save for obvious whitespace or
% line ending checks, etc.
%%%%%%%%%%%%%%%%%%%%%%%%%%%%%%%%%%%%%%%%%%%%%%%%%%%%%%%%%%

aiv2021 = dal2021.APP_STATUS == 'Approved' & dal2021.BALLOT_STATUS == 'Issued';
amv2021 = dal2021.APP_STATUS == 'Approved' & dal2021.BALLOT_STATUS == 'Marked';
aomv2021 = dal2021.APP_STATUS == 'Approved' & dal2021.BALLOT_STATUS == 'On Machine';
appv2021 = dal2021.APP_STATUS == 'Approved' & dal2021.BALLOT_STATUS == 'Pre-Processed';
afwv2021 = dal2021.APP_STATUS == 'Approved' & dal2021.BALLOT_STATUS == 'FWAB';
counted2021 = amv2021 | aomv2021 | appv2021 | afwv2021; % Approved and Countable

aiv2020 = dal2020.APP_STATUS == 'Approved' & dal2020.BALLOT_STATUS == 'Issued';
amv2020 = dal2020.APP_STATUS == 'Approved' & dal2020.BALLOT_STATUS == 'Marked';
aomv2020 = dal2020.APP_STATUS == 'Approved' & dal2020.BALLOT_STATUS == 'On Machine';
appv2020 = dal2020.APP_STATUS == 'Approved' & dal2020.BALLOT_STATUS == 'Pre-Processed';
afwv2020 = dal2020.APP_STATUS == 'Approved' & dal2020.BALLOT_STATUS == 'FWAB';
counted2020 = amv2020 | aomv2020 | appv2020 | afwv2020; % Approved and Countable

%%%%%%%%%%%%%%%%%%%%%%%%%%%%%%%%%%%%%%%%%%%%%%%%%%%%%%%%%%
% Next we compute the indices in the VHL that represent
% 2020 and 2021 General Election entries for voter credit
%%%%%%%%%%%%%%%%%%%%%%%%%%%%%%%%%%%%%%%%%%%%%%%%%%%%%%%%%%
valid_2020_entries = strcmpi(strtrim(string(VAVoteHistory.ELECTION_NAME)), '2020 November General');
valid_2021_entries = strcmpi(strtrim(string(VAVoteHistory.ELECTION_NAME)), '2021 November General');


%%%%%%%%%%%%%%%%%%%%%%%%%%%%%%%%%%%%%%%%%%%%%%%%%%%%%%%%%%
% We use the MATLAB intersect function to make sure that
% we are only using DAL entries that are still in the RVL
% and therefore are possible to be present in the VHL and
% compute the percentages.
%%%%%%%%%%%%%%%%%%%%%%%%%%%%%%%%%%%%%%%%%%%%%%%%%%%%%%%%%%
[did,iida,iidb] = intersect(dal2020.identification_number(counted2020), ...
    RegisteredVoterList.IDENTIFICATION_NUMBER);
[vid,iida,iidb] = intersect(VAVoteHistory.IDENTIFICATION_NUMBER(valid_2020_entries),...
    RegisteredVoterList.IDENTIFICATION_NUMBER);
[iid,iida,iidb] = intersect(did,vid);
pct2020 = (1-numel(iida) / numel(did)) * 100

[did,iida,iidb] = intersect(dal2021.identification_number(counted2021), ...
    RegisteredVoterList.IDENTIFICATION_NUMBER);
[vid,iida,iidb] = intersect(VAVoteHistory.IDENTIFICATION_NUMBER(valid_2021_entries),...
    RegisteredVoterList.IDENTIFICATION_NUMBER);
[iid,iida,iidb] = intersect(did,vid);
pct2021 = (1-numel(iida) / numel(did)) * 100
As of 03-20-2022, the latest version of my master spreadsheet posted below.
This includes the updates from my discussions with the York County registrar (see here), the comparison to DAL file entries (here), and the latest updates and comparisons to Statement of Results (SOR) / Machine Tape records, including ABLEMARLE, ACCOMACK COUNTY (partial), FAIRFAX COUNTY, FREDERICK COUNTY, GOOCHLAND COUNTY, HENRICO COUNTY (partial), ISLE OF WIGHT, LOUDOUN COUNTY (partial), LOUISA COUNTY, NORFOLK CITY, ORANGE COUNTY, POWHATAN COUNTY (partial), PRINCE WILLIAM COUNTY, STAFFORD COUNTY, SPOTSYLVANIA COUNTY, SUFFOLK COUNTY and YORK COUNTY. There’s more to process, but I wanted to put out a status update.
The previous result between the “official” CSV results and the “official” DAL file results has not changed at 5,766 Net discrepancies and 17,194 absolute. Latest update includes some cleaning up of the spreadsheet formulas and making sure that I am only accounting for discrepancies for those rows where we actually have verified transcriptions and/or tape images. The current discrepancies in the records between the CSV and the SOR / Machine Tapes is 4,549 Net discrepancies and 27,905 Absolute discrepancies. “Net” discrepancies are summed such that +/- deltas per candidate can cancel out, whereas “Absolute” discrepancies are summed using the absolute value. I have only been focusing on the Governors race at the moment and not any of the down-ballot races. Again many many “thank you’s” to the volunteers at VFA who have been helping to put all of this together.