Categories
Election Data Analysis Election Forensics Election Integrity Interesting technical

Interesting change in effective dates in VA Registered Voter List

I’ve stumbled across an interesting data artifact that I’m not sure what to make of. But I will present it here for completeness.

In the Registered Voter List available from the VA Dept of Elections (“ELECT”), each record of a registered voter has an “effective date” associated with it. This can be the same as the actual registration date, or the date that the voters record is returned to “active” status, etc. It appears that sometime within the last year, almost all of the voter registrations with a previous effective date earlier than June 2011 have had their effective date reassigned.

For this analysis I am using an RVL that I purchased from ELECT on 2021-11-06 and comparing it with an RVL purchased on 2022-11-22. I am only comparing the records associated with common voter IDs between each dataset. Any new or removed voters in the last year have been removed from the data and the corresponding plots below.

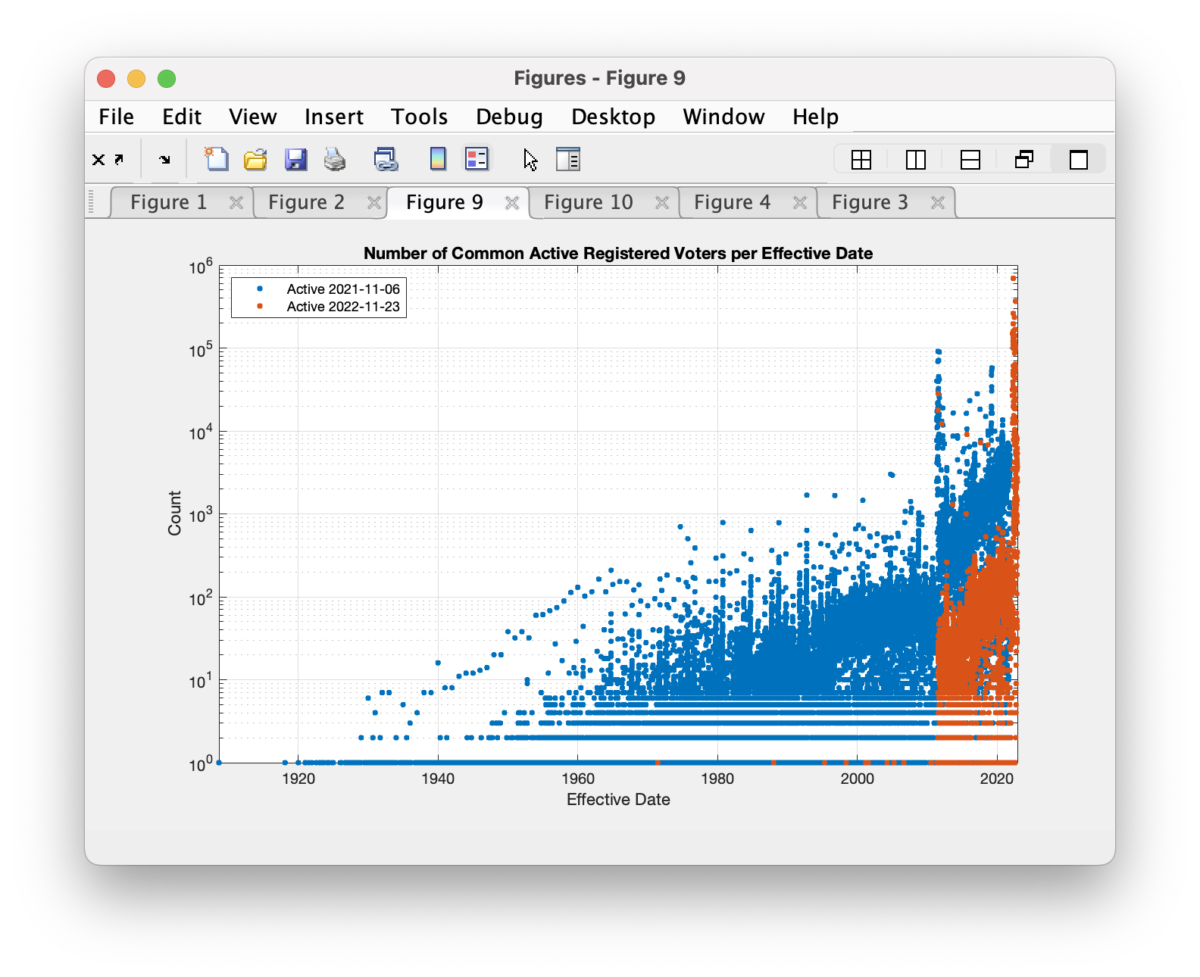
In the 2021 RVL, we can see the distribution of the effective dates in the histogram below. The majority of records have rather recent effective dates, but there are diminishing tails from long-term voters who’s effective date of their registration goes back many years. (The y-axis in the plot is logarithmic, so we can better see the shape of the distribution tails.)
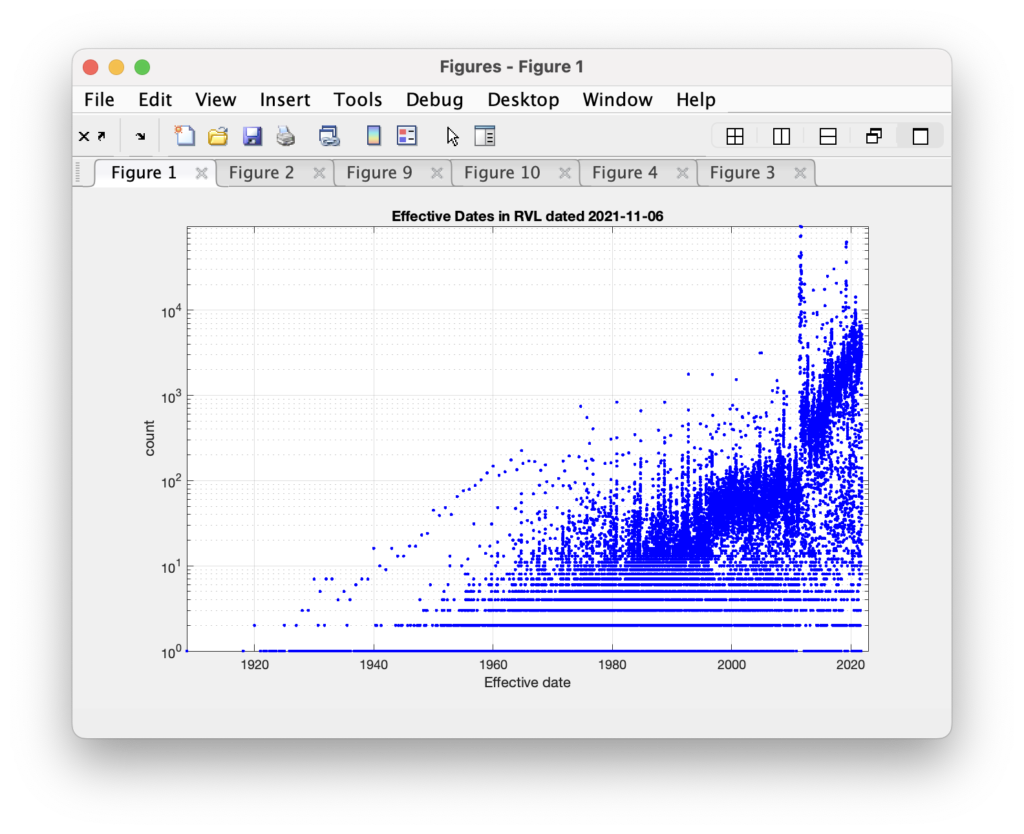
This isn’t all-together so surprising. Newer voters, or voters who have made recent changes to their registration information, will likely get an updated effective date on their voter registration record. Older, or longer term voters, that have not made any recent changes and stay active would show older effective dates on their records.

Now compare that to the RVL file dated 2022-11-22. Again, this comparison and the data in these plots is only those records that share common voter ids between the two files. Sometime between the time I downloaded the 2021-11-06 RVL and the 2022-11-22 RVL, almost all records with effective dates before July 2011 have had their effective dates reset to a more recent date.
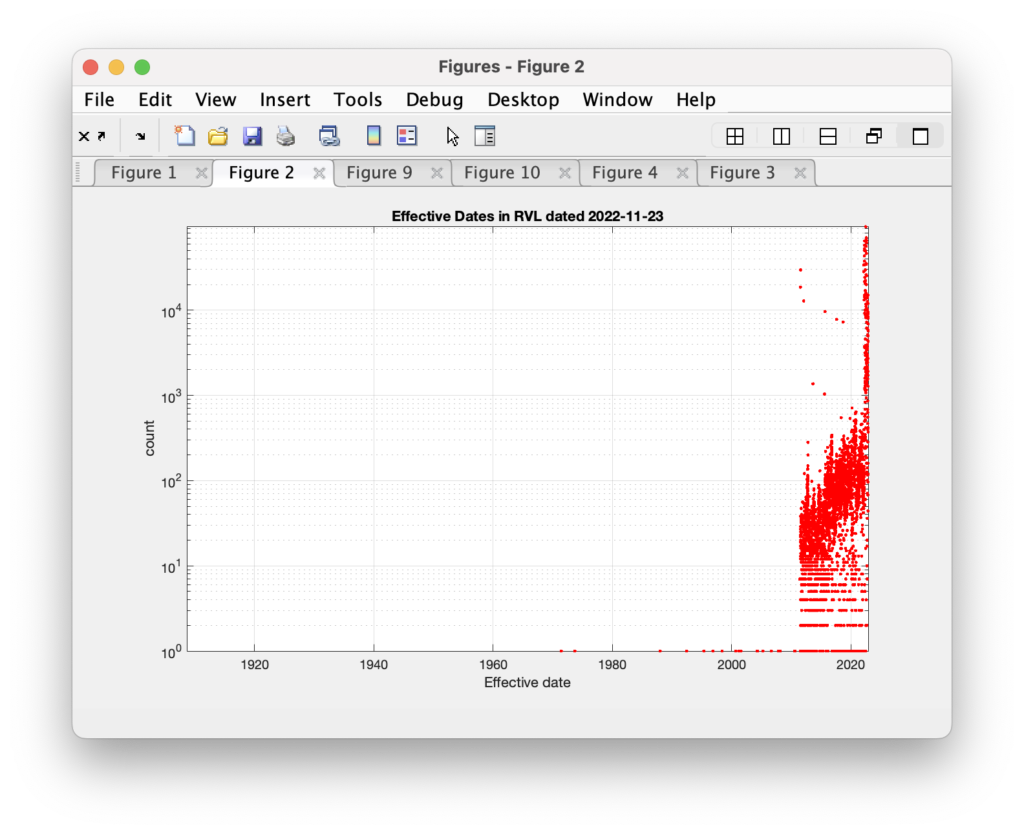
I don’t really know what to make of this. Was there a mass update of voter registration records? Or a database restore, or some other operation on the records?

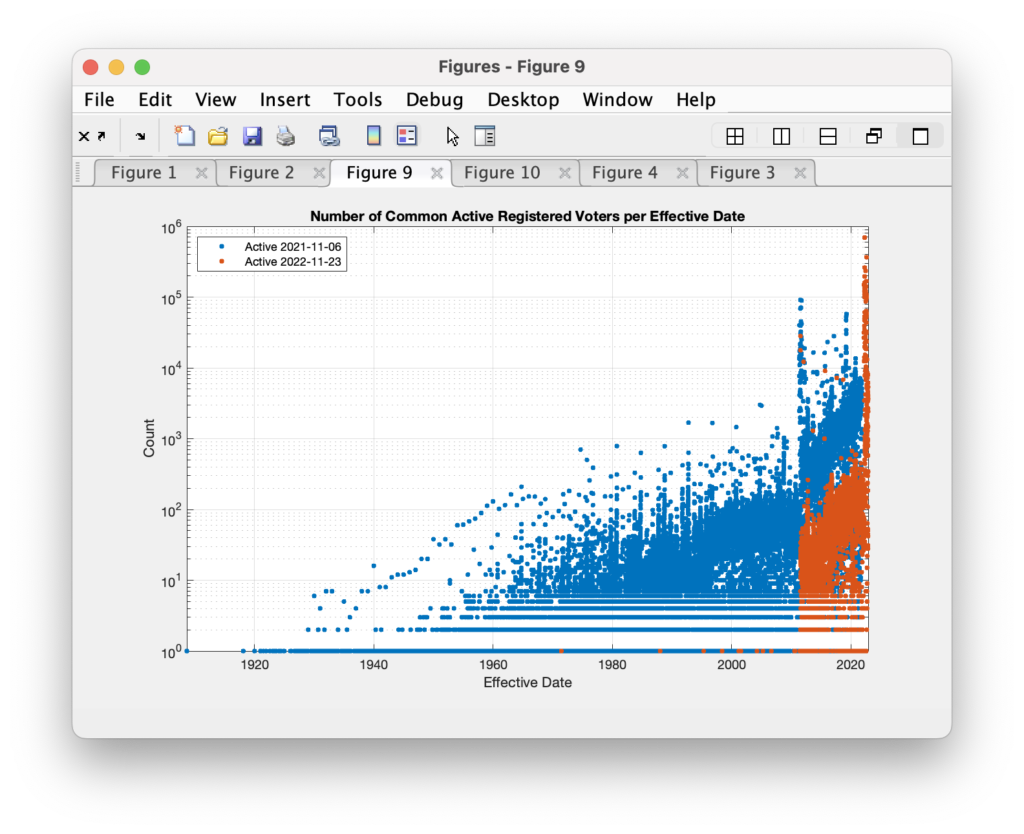
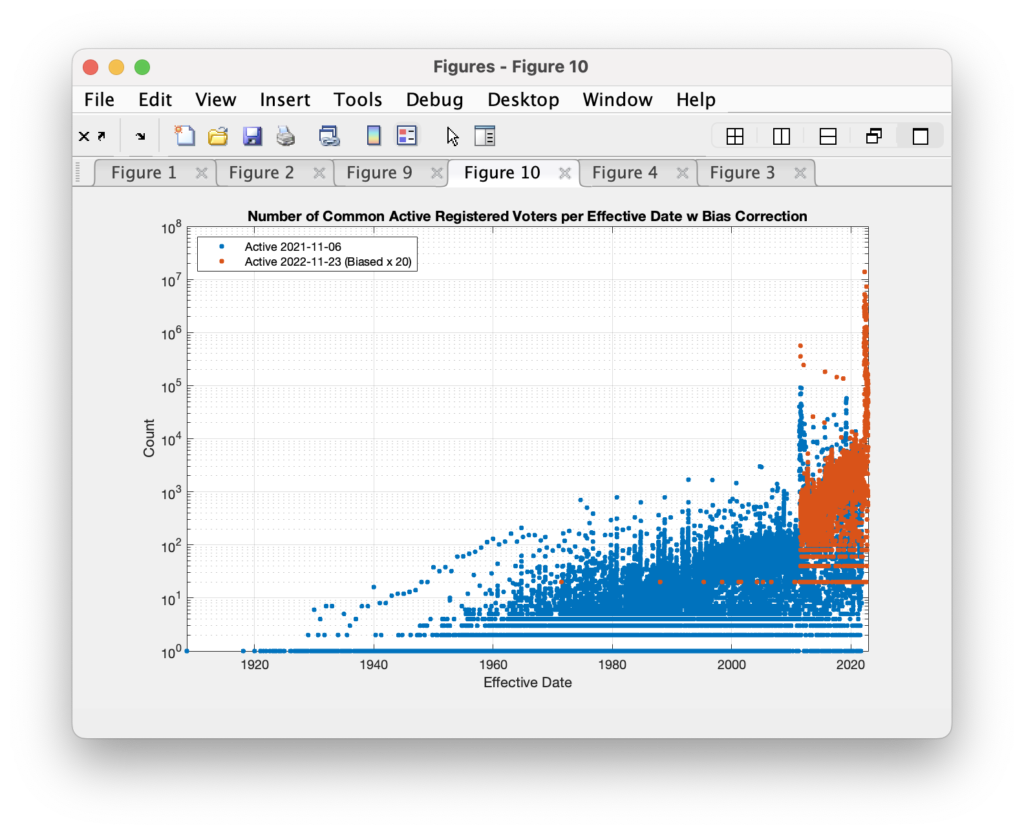
Even more interesting is when we superimpose the two histograms we see that the 2022 records with effective date after July 2011 look to also have had a significant percentage of dates reset. We see the red curve maintains it shape, save for the large spike at the far right, but is shifted lower … as if a constant percentage of the records have been included in the effective date shift.
Now if we apply a constant multiplier of 20x to the red (2022) dataset we can mostly re-align the histograms.
Of the effective dates that were changed between the two files, the distribution of the adjustments to the effective dates is shown below. I find it interesting that there are a number of records where the effective date has been moved backwards (?) in time.
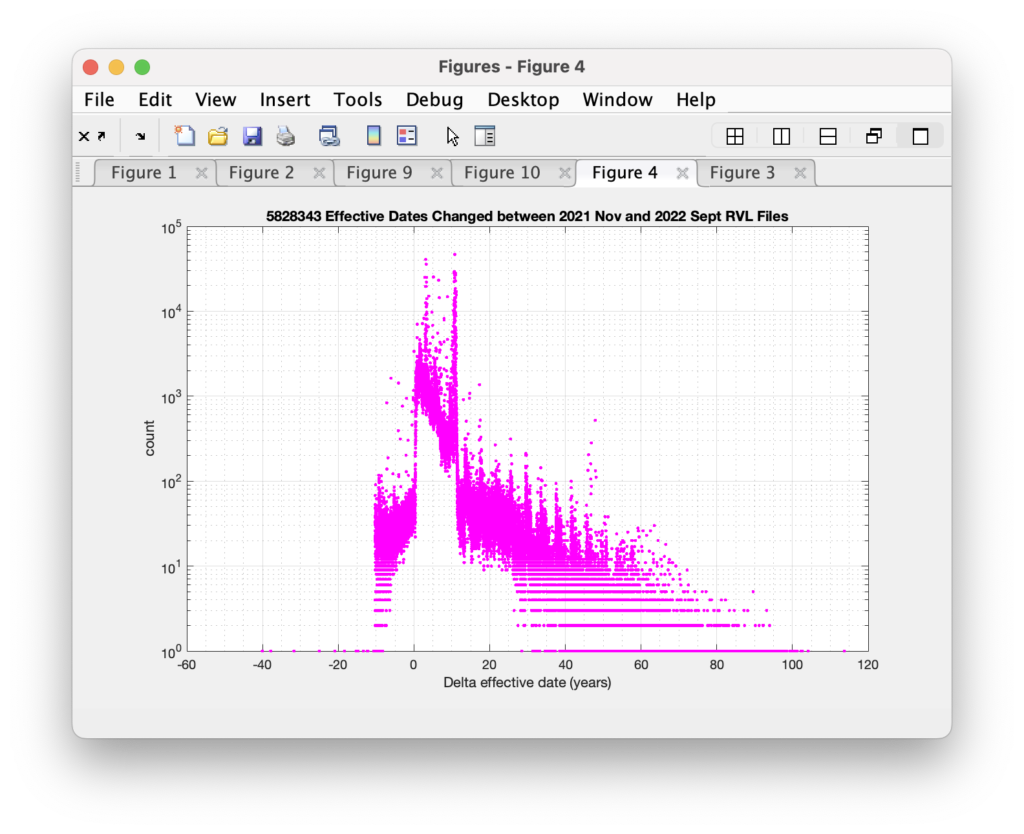
We know there have been significant issues with the database used by ELECT (known as the “VERIS” database), so maybe this is an artifact of some maintenance operations or repairs on the data entries? Or maybe this is a symptom of a larger problem. Whatever it is, it doesn’t make a lot of sense in what should be a very well maintained and authoritative set of records.
Categories
Election Data Analysis Election Forensics Election Integrity Press Release

Virginia’s Prince William County Conducts Ballot Recount after Errors Reported in Election Scanner


PWC Board Concludes Human Error ‘Likely’ Before Certifying Results

Non-profit electoral process group praises electoral board for responding to public’s calls to conduct a partial audit of discrepancies before certifying election results

November 16, 2022 –- Election officials in Virginia’s Prince William County met to certify the results of the 2022 General Election after they conducted a hand-count of ballot counts in conflict with machine counts and concluded that human error was a “likely” cause rather than machine error.

The board’s decision to conduct a hand-count of the ballots in question followed a call for a review from the public, local and state officials, and Electoral Process Education Corporation (EPEC), a
Virginia-based non-profit 501c (3) that provides election data analysis.

The ballots in question in PWC’s Precinct 612 remain in the custody of the general registrar; the board ruled the matter resolved after conducting a hand count of the machine bin that tallied 27 more
votes than physical ballots that were scanned into the machines. (See prior release detailing the error here: https://digitalpollwatchers.org/multiple-errors-found-in-virginias-2022-election-scanner-and-pollbook-data/)

Although the PWC electoral board was not able to reconcile one outstanding difference between the poll-book count of votes cast and the machine scans in two precincts, it judged the differences were
not likely coming from machine malfunctions.

While it is still problematic for poll books not to match the scanner tapes, it is a much more serious issue when the number of physical ballots in the accumulation bin and the scanner totals do not match.

EPEC’s recommendations based on its analysis of the election data include the following:

Standard processes should be updated to require verification that the number of ballots in the scanner collection bin match the scanner result report tape. If the numbers do not match, an on premises hand tabulation be performed by the election officers and the results recorded in the official public record.

EPEC also commended the PWC board of elections for ensuring transparency by confirming that the final counts of the physical ballots align with machine scan tallies before certifying the results.

Categories
Election Data Analysis Election Forensics Election Integrity technical

“On Machine” ballots with logically impossible time stamps

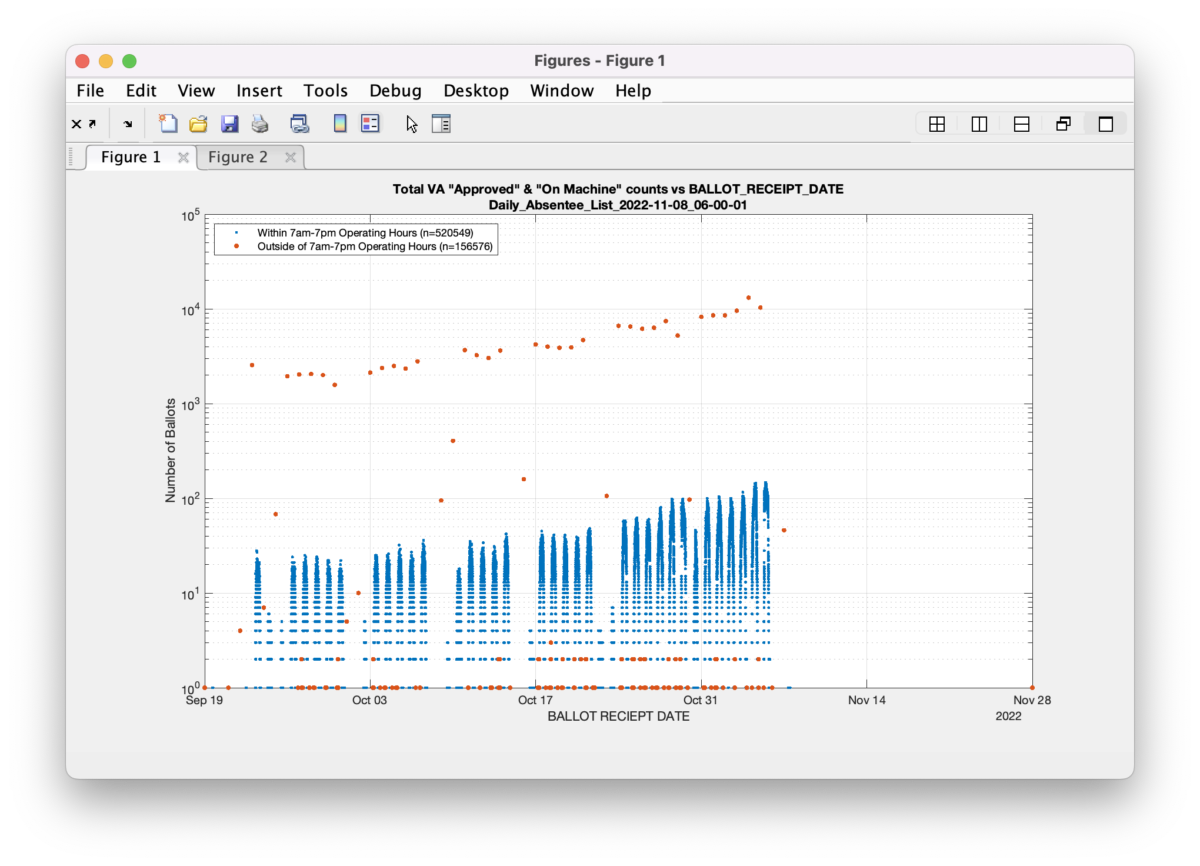
In looking over the VA DAL data, one interesting issue that is readily apparent, is that the BALLOT_RECIEPT_DATE field for in-person, on-machine early vote data is logically impossible.

These time-stamps are supposed to be generated by the electronic poll-books when a voter is checked in at an in-person early voting site. The appeal and rationale for utilizing electronic poll-books is exactly because the can automate the recording of check-in and (theoretically) minimize human error. The operating hours of VA in-person early voting sites are limited to 7am – 7pm. I’m not aware of any in-person early voting center that had extended hours past those. Therefore, logically, we would expect that the electronic poll book generated time stamps for check-ins for in-person on-machine early votes would fall within the 7am – 7pm bounds.

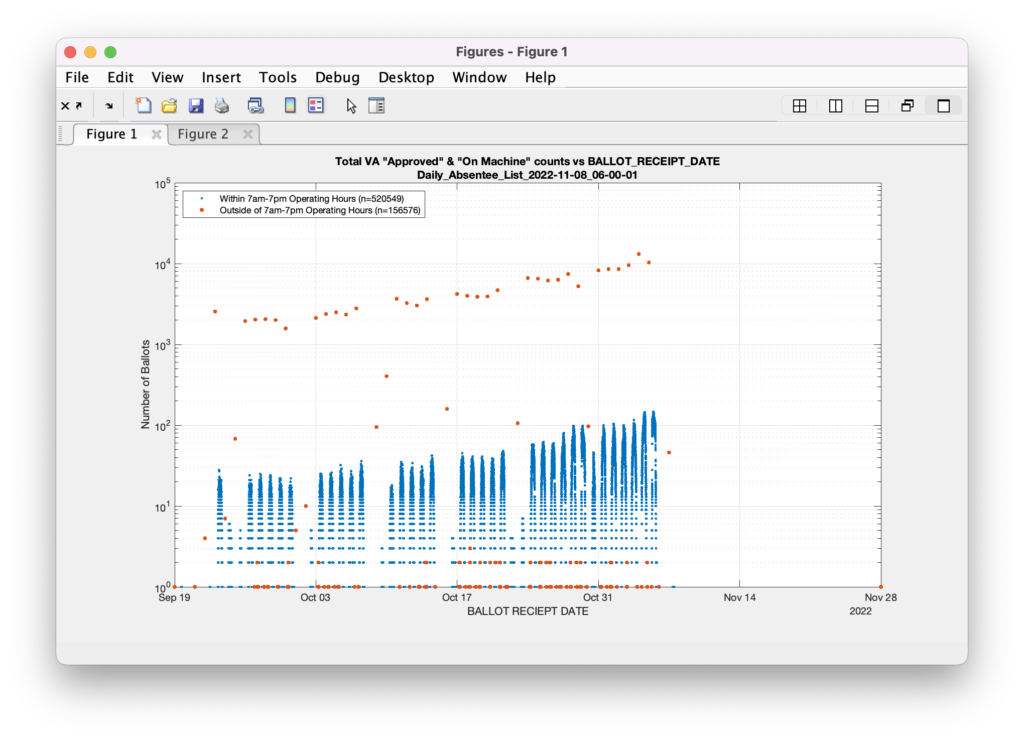
The plot below is generated directly from the Daily Absentee List (DAL) file pulled from the VA Department of Elections on 11/08/2022 at 6am. The x-axis gives the time (rounded to the nearest minute) of the BALLOT_RECIEPT_DATE field associated with recorded Early In-Person On-Machine ballots in the file. The (logrithmic) y-axis gives the total number of Early In-Person On-Machine records that were recorded with that unique timestamp. The blue trace represents all of the records that fall within the daily 7am – 7pm bounds, and the red trace represents the data outside of those bounds.

There were 520,549 records that fall within the expected time bounds, and 156,576 that fall outside of the bounds. From a purely systems perspective, that means that the ability of our electronic poll books (or the backend database they are tied to) to accurately record the check-in time of Early In-Person On-Machine voters has an error rate of 156576 / (156576+520549) = 23.12%.

Let me say that again. A 23.12% error rate.

23.12% of the time, our electronic poll-book based system is reporting a logically impossible time for a person to have physically walked into an open + operating early voting location to check-in and cast their ballot.

Now, if we want to be generous and allow for the possibility that maybe voting locations opened early or closed late and we pad our (7am – 7pm) bounds to be from (6am – 8pm) and run the same analysis, we still get an error rate of 23.09%.

If we pad the hours of operations limits even further to (5am – 9pm), we still get an error rate of 23.06%.

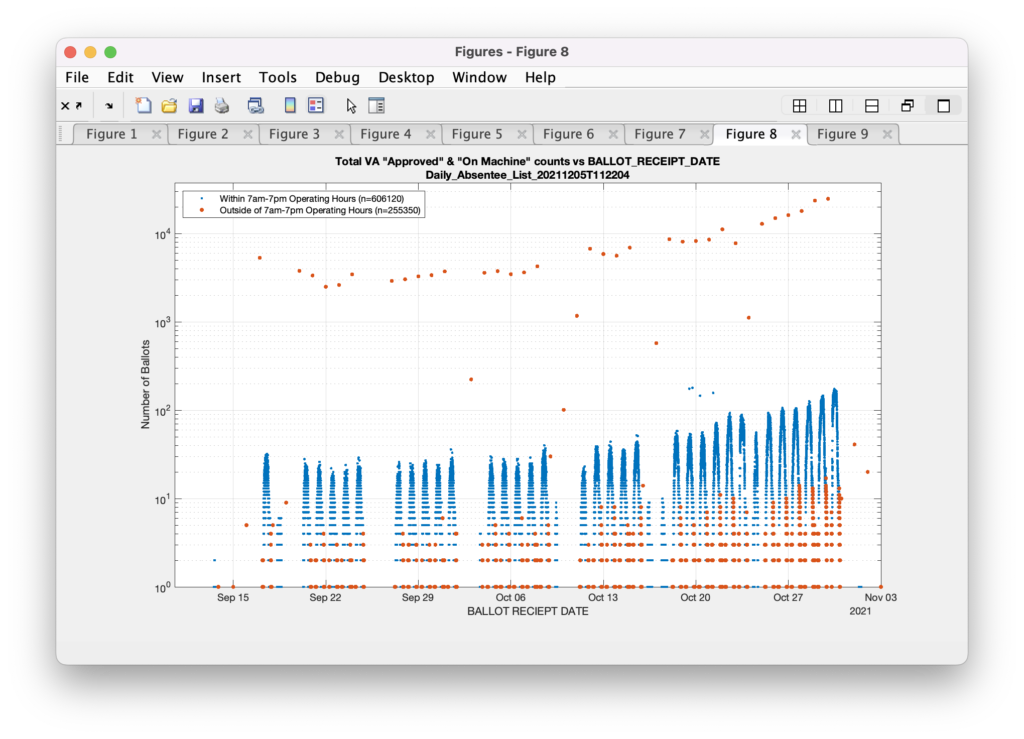
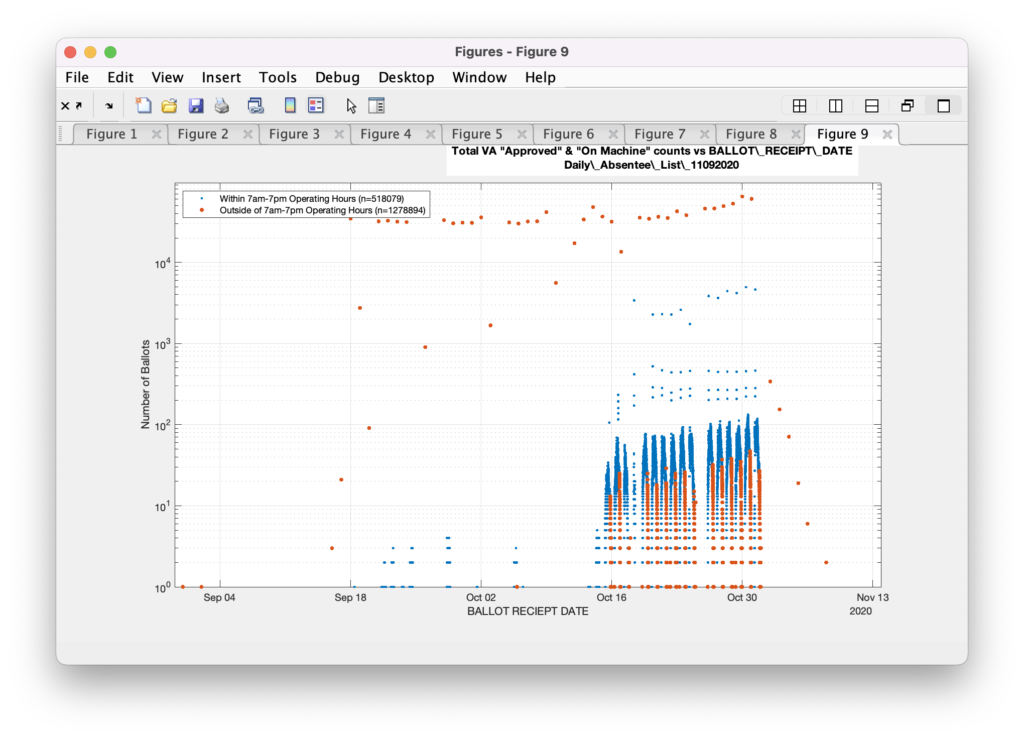
If we run the same analysis using the 7am – 7pm bounds on the 2021 and 2020 data we get 29.64% and 71.17% error rates, respectively.

Update 2022-11-13

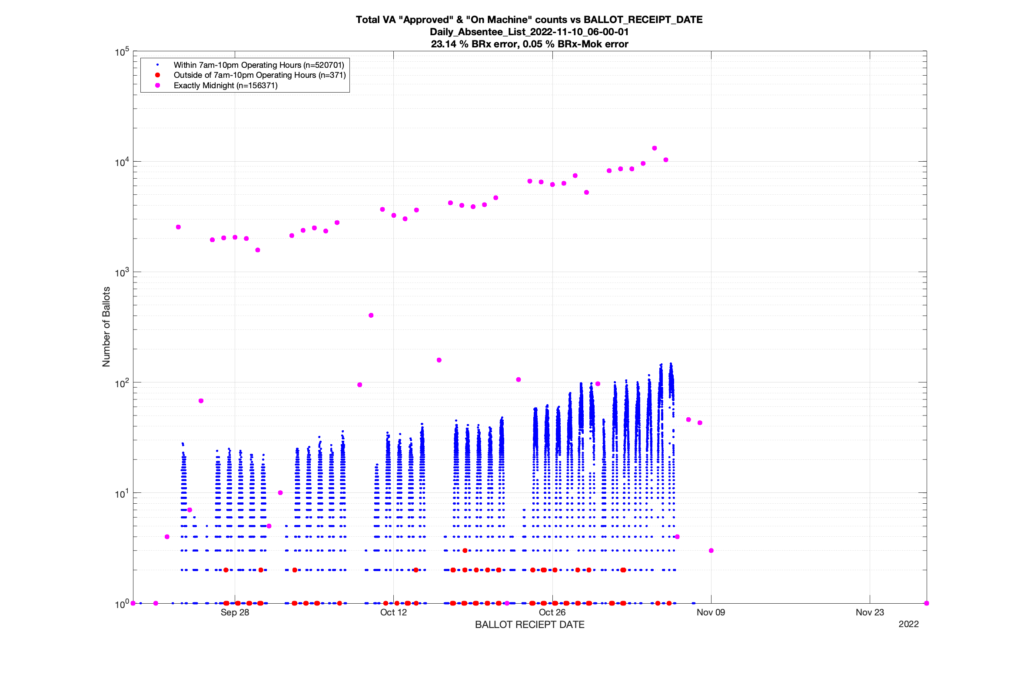
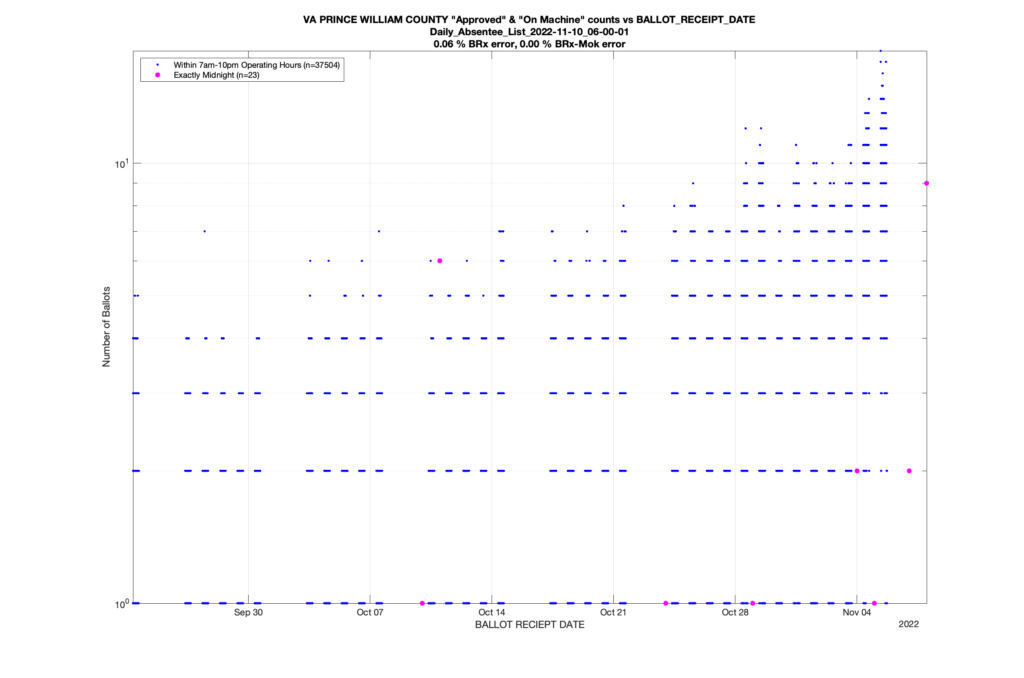
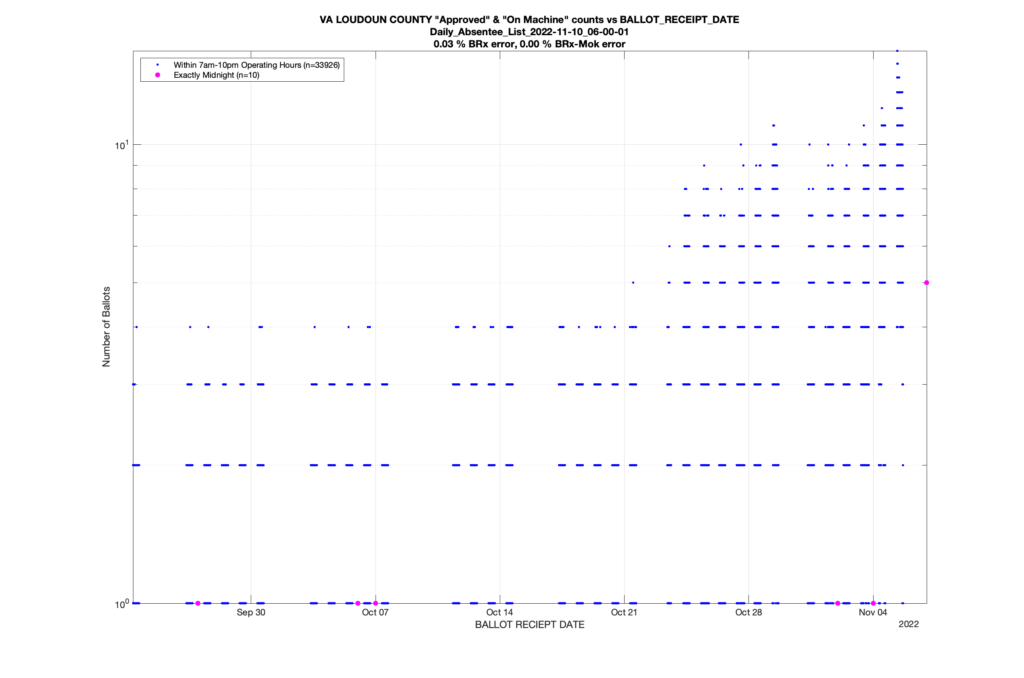
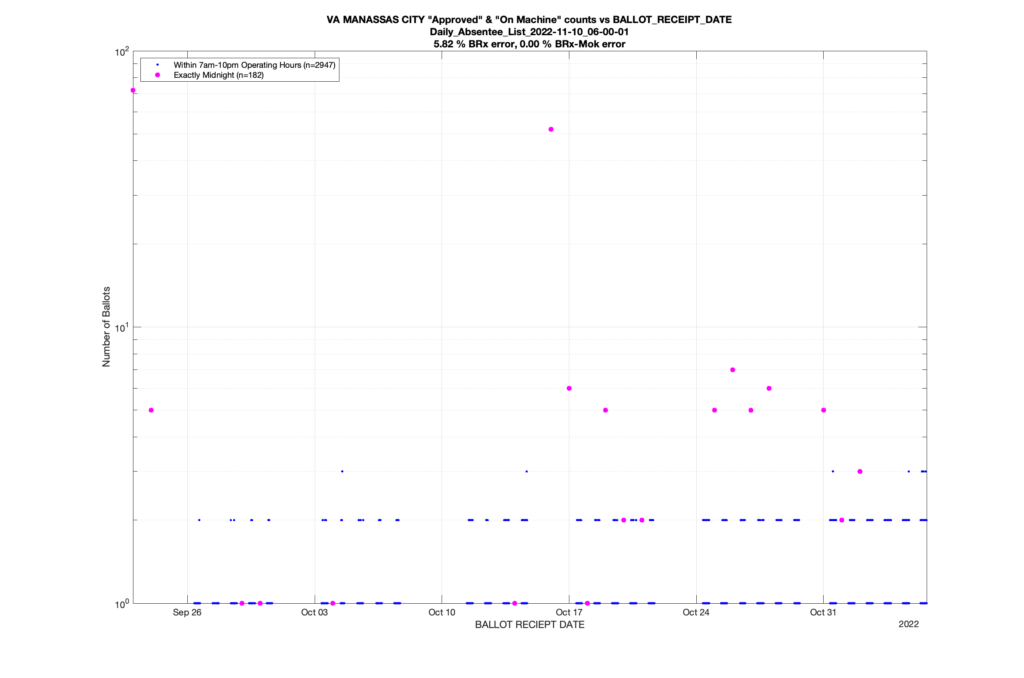
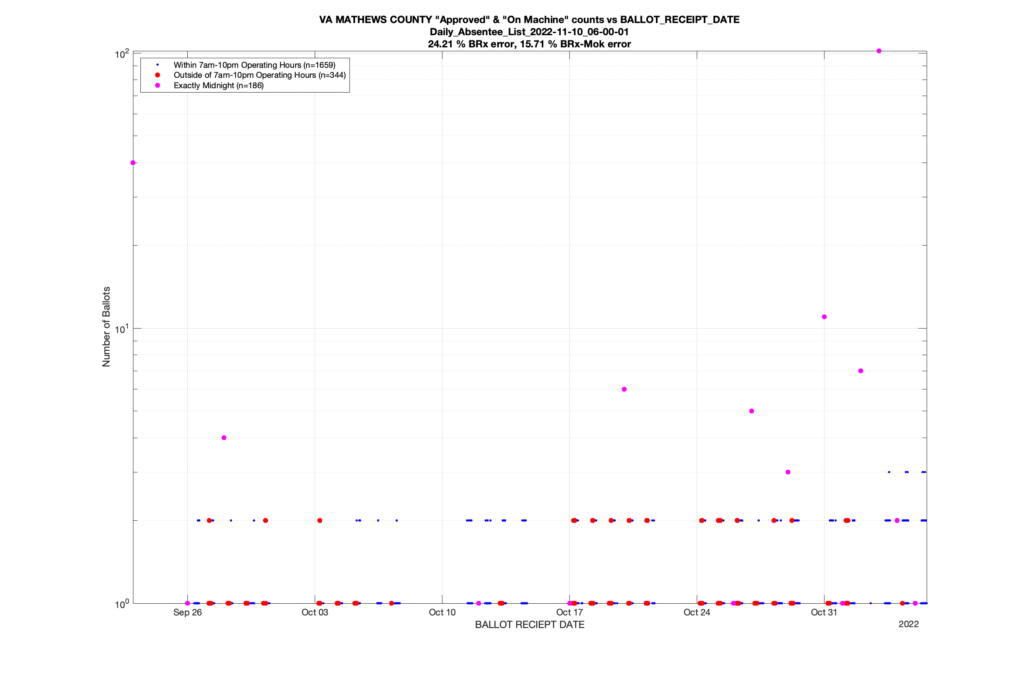
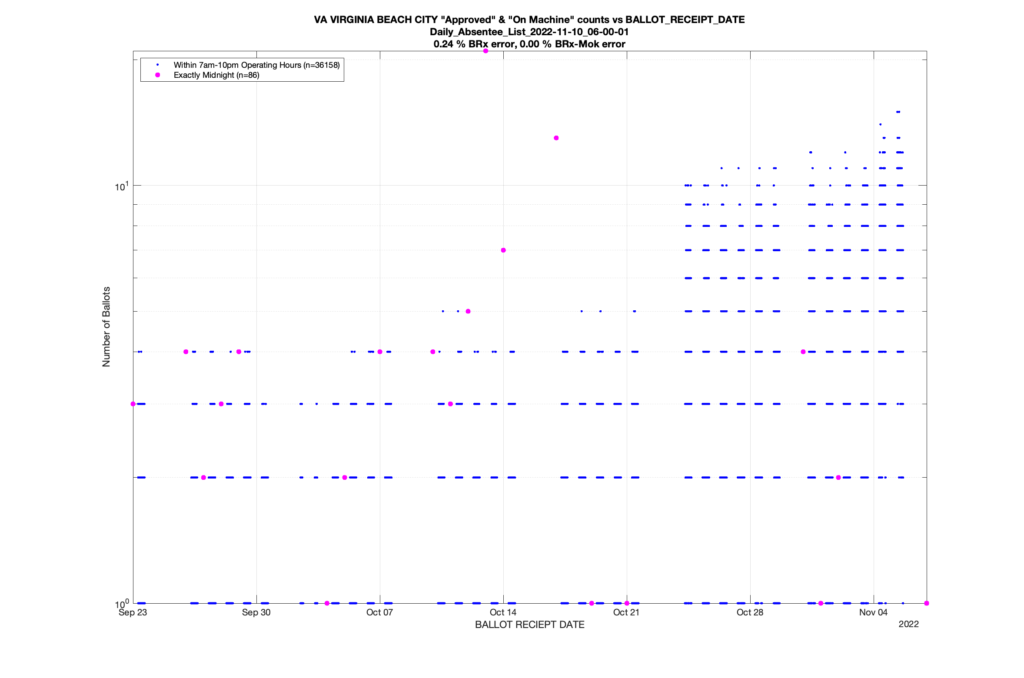
I adjusted the allowed times to 7am-10pm and re-ran the most recent 2022, 2021 and 2020 DAL files, as well as breaking down by locality. While doing this I noticed that some localities had all timestamps set to midnight, while others still had invalid timestamps set to unique values (but outside operational hours), and some had combinations of both. I’ve delineated the plots such that magenta traces are from ballot receipt timestamps that are all set to midnight, red trace is invalid timestamps not set to midnight, and blue traces are valid within 7am-10pm hours of operation (which is very very generous).

There are two error percentages being computed and being displayrd in the graph title area. The first (“BRx error”) is as described above and results in a 23.14% error in the 2022 VA statewide data. The second (“BRx_Mok error”) is as described above except we allow for the uniformly midnight ballot receipt dates to be presumed allowable, and results in a 0.05% error metric.

The inclusion of the latter class of error computation is in order to account for the remote chance that a locality is legitimately using paper poll books or otherwise not recording the time of the voter checkin, but only recording the date information (which would be consistent with all timestamps at midnight). VA requires the use of electronic poll books, but there are still some that use manual entry paper poll-books as backup. So even IF that was the explanation for why so many entries were uniformly timestamped to midnight … (A) why did they have to go to their paper poll book backups in the first place? and (B) we still have a residual error of 0.05% across the state that needs to be explained even after removing uniform midnight timestamps from consideration. That might not seem a terribly huge error rate at first blush, but when you consider that most electronic data recording systems (at least that I am aware of) have error rate requirement thresholds for acceptance testing set to the order of 1/1,000,000 … thats still unacceptable. I have been unable to find a documented requirement for error rate threshold for the electronic poll book systems used in VA, as per the VA department of elections.

The complete tabulation of all errors for each locality is provided here:

Selected Locality Plots:

The segmented Prince William County (my home county) 2022 plot is below. There is a 0.06% error rate of invalid (all midnight) timestamps in the Ballot Receipt date data.

The segmented Loudoun County 2022 plot is below. There is a 0.03% error rate of invalid (all midnight) timestamps in the Ballot Receipt date data.

The segmented Manassass City 2022 plot is below. There is a 5.82% error rate of invalid (all midnight) timestamps in the Ballot Receipt date data.

The segmented Mathews County 2022 plot is below. There is a 24.21% error rate of total invalid timestamps in the Ballot Receipt date data, and a reduced error rate of 15.71% when allowing all midnight timestamps to be considered as valid.

The segmented Virginia Beach City 2022 plot is below. There is a 0.24% error rate of invalid (all midnight) timestamps in the Ballot Receipt date data.

The complete set of generated plots for every locality is included in the attached zip file:

Categories
Uncategorized

Variances Observed in TX Early Vote Data

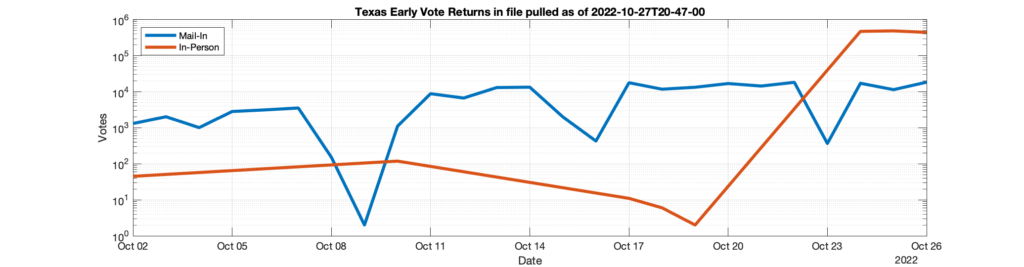
Recently I’ve started downloading all of the data from the TX secretary of state website multiple times per day. Each time I download the data I grab new versions of files representing how many Mail-In or In-Person votes have happened since mail-in votes have started to be accepted, according to the TX SOS. Note that this TX Early Voting return data, which is required by law to be publicly posted daily, is supposed to reflect the number of voted ballots (either In-Person or Mail-In) per the previous days in the ongoing election and serves as the official public record of these ballot transactions.

The TX SOS does site not post the cumulative results, but instead has individual links by day that show the totals of each category of voted ballot. I have downloaded copies all of this data over multiple days.

Now you would think, that if the TX SOS data was trustworthy and accurate, that I shouldn’t see differences in the historical data on the TX SOS site day to day. I should see new data as a newly available download, but the data associated with previous days results should stay the same.

… except it doesn’t.

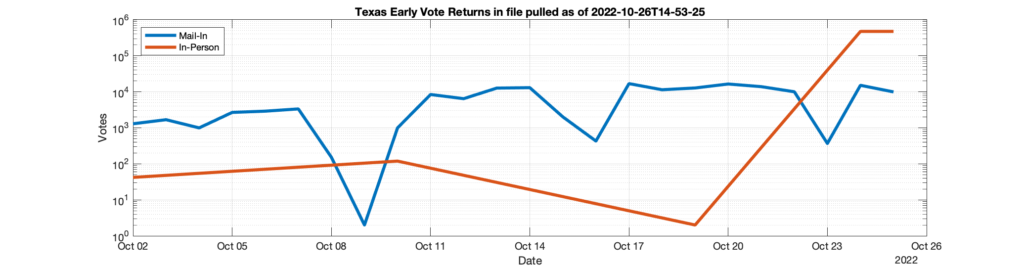
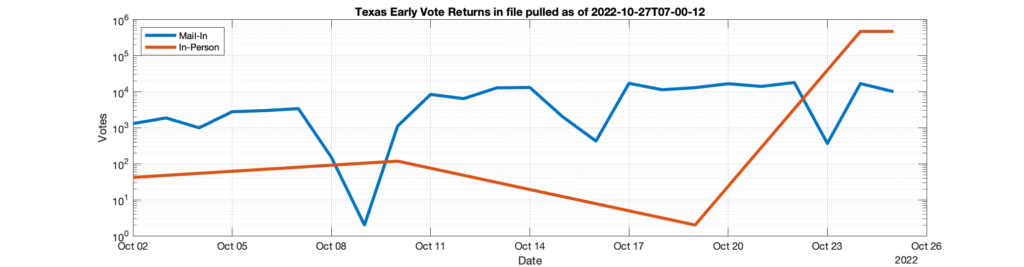
In the gallery below are 3 separate graphs of the data pulled from the TX SOS site. Each pull of the data grabbed the entire history of the data.

If you play the images in sequence you will notice that between the 1st (captured on 10/26 @ ~3pm) and second image (captured 10/27 @ ~7am) there are a few thousand ballots that suddenly appear in the Mail-In ballot trace attributed to 10/22. Between the second and third image (captured 10/27 @ ~9PM) you will see that there are a handful (~10) of ballots that get retrospectively added to the In-Person ballot totals attributed to 10/17 and 10/18.

What is the explanation for these additions?

I’m happy to supply the raw downloaded and timestamped files to anyone who is interested. Feel free to contact me and I will send the latest zip files and source code used to download.

Categories
Uncategorized

2022 General Election GA Daily Absentee Report Statistics

Similar to the statistics that I have been computing for the VA Daily Absentee List (DAL), I have also been collecting the daily early voting reports from the GA secretary of states website. These are also a set of cumulative files that track the status of early and absentee ballots.

I’m using the same set of processing techniques on the GA data as I am doing with the VA datafiles, save for some slight tweaks due to differences in the datasets. (1) GA doesn’t have the ‘Marked’ or ‘Pre-Processed’ distinction in how they track their mail in ballots like VA does, those records are all simply labeled as ‘Mail-In’. (2) GA has an ‘Electronic’ category for ballots, which I’m assuming is the equivalent of the ‘FWAB’ category in VA.

There are two plots below representing the same data, one plot with a linear y-axis and the other with a logarithmic y-axis. The x-axis is the date that each DAL file processed was archived and pulled from the Dept of Elections servers. Solid traces are directly extracted data from the DAL files. Dashed traces are computed metrics such as the number of “vanished” voters detected. Red datapoints are placed on traces that exhibit questionable behavior, for example if the number of “approved” and “countable” ballots ever decreases, etc. Vertical dotted lines indicate important dates.

All of the latest plots for every locality and precinct as well as the corresponding underlying CSV data files will be updated daily, and you can download them here.

The semilog versions of the plots for all localities or precincts that appear in the DAL data per locality are shown in the gallery below. The image carousel below might take a moment to load, btw.

Categories
Election Data Analysis Election Forensics Election Integrity technical

2022 VA General Daily Changes to Voter Registration Totals

Here is the changes to the voter registration numbers for each VA locality over the course of the 2022 general election. These files will be updated automatically as the data becomes available. The first graph below is the percent change with the color coding clamped to +/- 3 x the standard deviation, and the second is the absolute percent change.

The computed csv file for the above data is here: https://digitalpollwatchers.org/files/2022/VA/registration-changes/2022-va-general-voter-registration-count-changes.csv

Categories
Election Data Analysis Election Forensics Election Integrity technical

2022 VA General Election DAL File Statistics

Update 10-17-2022: There has been an issue with the VERIS system (the database that runs behind the scenes at the VA department of elections) where updates to the DAL files have not progressed since 10/14. On 10/17 there was a published change to the data files but the report generated was incomplete and cutoff halfway through its listing of CARROL COUNTY data. I had a phone conversation on 10/17 with ELECT and they are aware of the issue and working to correct it. Also I have included a new gallery at the bottom of the page of all of the individual localities or precincts that are automatically flagged as having issues of concern. Issues detected include any number of “vanishing” voters as defined below, “On Machine” ballot counts that decrease day-to-day, “Marked” OR “Pre-Processed” counts that decrease day-to-day, etc.

Update 10-18-2022: The publication of the DAL files has resumed. I have queries in to the department of elections as to the exact cause of the issues and will update accordingly as I find out more information.

Below is the current set of statistics from the 2022 VA General Election Daily Absentee List (DAL) file records. There are two plots below representing the same data, one plot with a linear y-axis and the other with a logarithmic y-axis. The x-axis is the date that each DAL file processed was archived and pulled from the Dept of Elections (ELECT) servers. Solid traces are directly extracted data from the DAL files. Dashed traces are computed metrics such as the number of “vanished” voters detected (described below). Red datapoints are placed on traces that exhibit questionable behavior, for example if the number of “approved” and “countable” ballots ever decreases, etc. Vertical dotted lines indicate important dates.
There are two very important fields in the DAL file that we want to pay attention to here: the APP_STATUS field, and the BALLOT_STATUS field.

DAL records with APP_STATUS = “Approved” and BALLOT_STATUS = “Issued” indicate a ballot that has been mailed to a voter.

DAL records with APP_STATUS = “Approved” and BALLOT_STATUS = “Marked” indicate a mail-in ballot that has been mailed to a voter, and then subsequently returned.

DAL records with APP_STATUS = “Approved” and BALLOT_STATUS = “Pre-Processed” indicate a mail-in ballot that has been mailed to a voter, returned and the ballot envelope has been opened and the ballot processed.

DAL records with APP_STATUS = “Approved” and BALLOT_STATUS = “On Machine” indicate a ballot record from a voter who physically walked into an early voting site and cast their vote on a tabulator machine.

DAL records with APP_STATUS = “Approved” and BALLOT_STATUS = “FWAB” indicate a Federal Worker Absentee Ballot (FWAB) mail-in ballot that has been received.

The combination of all ballots that have APP_STATUS=Approved and BALLOT_STATUS = “Marked” | “Pre-Processed” | “On Machine” | “FWAB” we term as “Countable” ballots.

I’ve computed the number of countable records that have an invalid BALLOT_RECIEPT_DATE or an invalid APP_RECIEPT_DATE. (For example if the BALLOT_RECIEPT_DATE is before the start of early voting, etc.)

I am also attempting to detect the number of duplicate voter IDs in a “countable” (as described above) state, if any, for each DAL file.

Additionally, I’ve computed and plotted the number of “Vanished” voters seen as we process the DAL files in chronological order. As each publication of the the DAL file is intended to capture information on all of the absentee ballots to date during an election, we would expect that once a unique voter ID becomes a record in the DAL file, that all subsequent DAL files should have an entry for that ID, regardless of its status. However, we know there are multiple instances where a voter ID will show up in the DAL record on a given date, and then be completely missing from a future DAL file.

Upon asking the department of elections for clarification as to how this can occur, their answer given was that if the voter has their registration cancelled for any reason, they are also removed from the DAL file. This holds true, even if live ballots had been issued for that voter, or if the voters vote has already been fed into a tabulator. This means that there is NO ACCOUNTING for these ballots in the DAL record. Note that the department of elections also does the same thing with the Voter History List (VHL) and the List of Those Who Voted (LTWV) data files. This is apparently standard operating procedure for the VERIS database(s) at ELECT, and (I quote) “… nothing unusual …” or to be concerned about as far as the department of elections is concerned. I vehemently disagree, and think that removing these records from the DAL while the election is ongoing is extremely problematic, to put it politely.

I will continue to update these plots as the election progresses. as more data comes in I will also be publishing these types of graphs for selected localities and precincts.

All of the latest plots for every locality and precinct as well as the corresponding underlying CSV data files will be updated daily, and you can download them here.

The semilog versions of the plots for all localities or precincts that appear in the DAL data that have flagged issues of concern are shown in the gallery below. The image carousel below might take a moment to load, btw.

Categories
Uncategorized

Difference in number of duplicated records in the VA RVL from 2021-2022

Since I know there have been a number of registrars and volunteers around the state that have been working to try and improve the maintenance of the VA voters rolls, I thought people would be interested in some summary results that I can now compute. While there is still plenty of work to be done, we have at least made some progress.

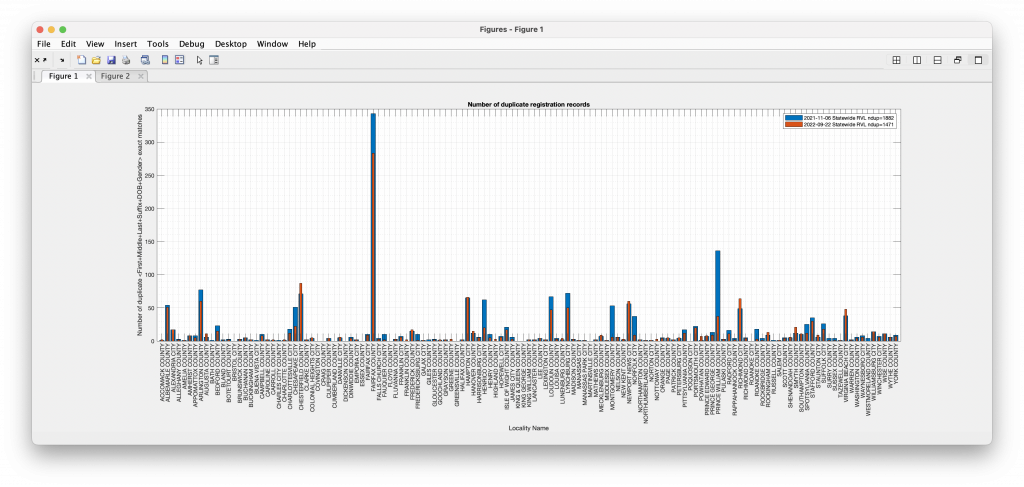
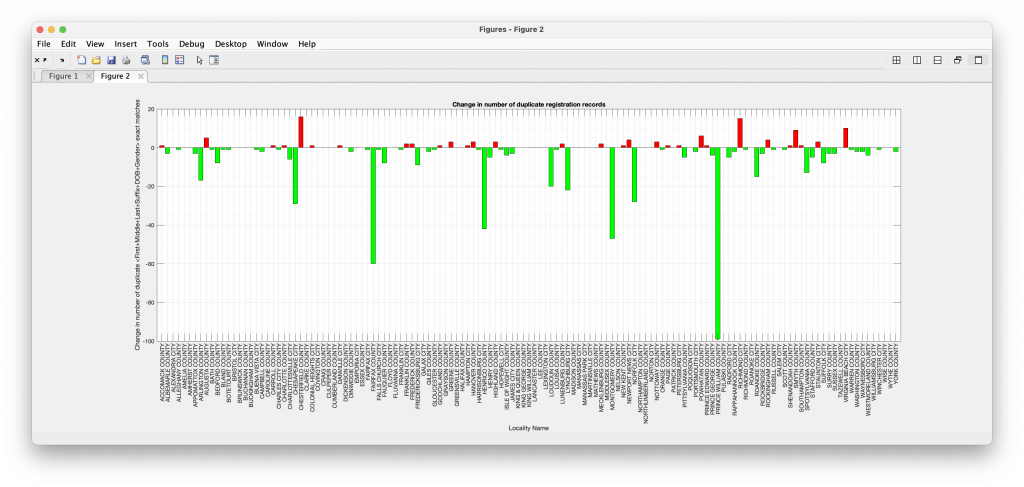
Below you will find the graph of the number of detected duplicate records in the statewide VA Registered Voter Lists as pulled on 2021-11-06 and 2022-09-22. The duplicate detection is based on an exact match of the join of (First Name + Middle Name + Last Name + Suffix + DOB + Gender) fields.

The total number of duplicate records detected in the 2021-11-06 RVL was 1882, and the total number of duplicate records in the 2022-09-22 RVL was 1471. Thats a 21% reduction in the number of duplicated voter records!

Interestingly enough, many of the duplicates actually cross over between multiple localities, so it is possible that many of these duplicated records are people that legitimately moved, but for some reason were given a new voter ID in the new locality and the old locality never removed their record. (A persons voter ID is supposed to be unique to them and ‘follow’ them throughout moves, etc.)

Any registrars who are interested in reviewing the specific records identified, please feel free to contact us.

Categories
Election Data Analysis Election Forensics Election Integrity Interesting programming technical

Updates to Henrico CVR processing

Note: For background information, please see my introduction to Cast Vote Records processing and theory here: Statistical Detection of Irregularities via Cast Vote Records.
Since I posted my initial analysis of the Henrico CVR data, one comment was made to me by a member of the Texas election integrity group I have been working with: We have been assuming, based on vendor documentation and the laws and requirements in various states, that when a cast vote record is produced by vendor software the results are sorted by the time the ballot was recorded onto a scanner. However, when looking at the results that we’ve been getting so far and trying to figure out plausible explanations for what we were seeing, he realized it might be the case that the ordering of the CVR entries are being done by both time AND USB stick grouping (which is usually associated with a specific scanner or precinct) but then simply concatenating all of those results together.

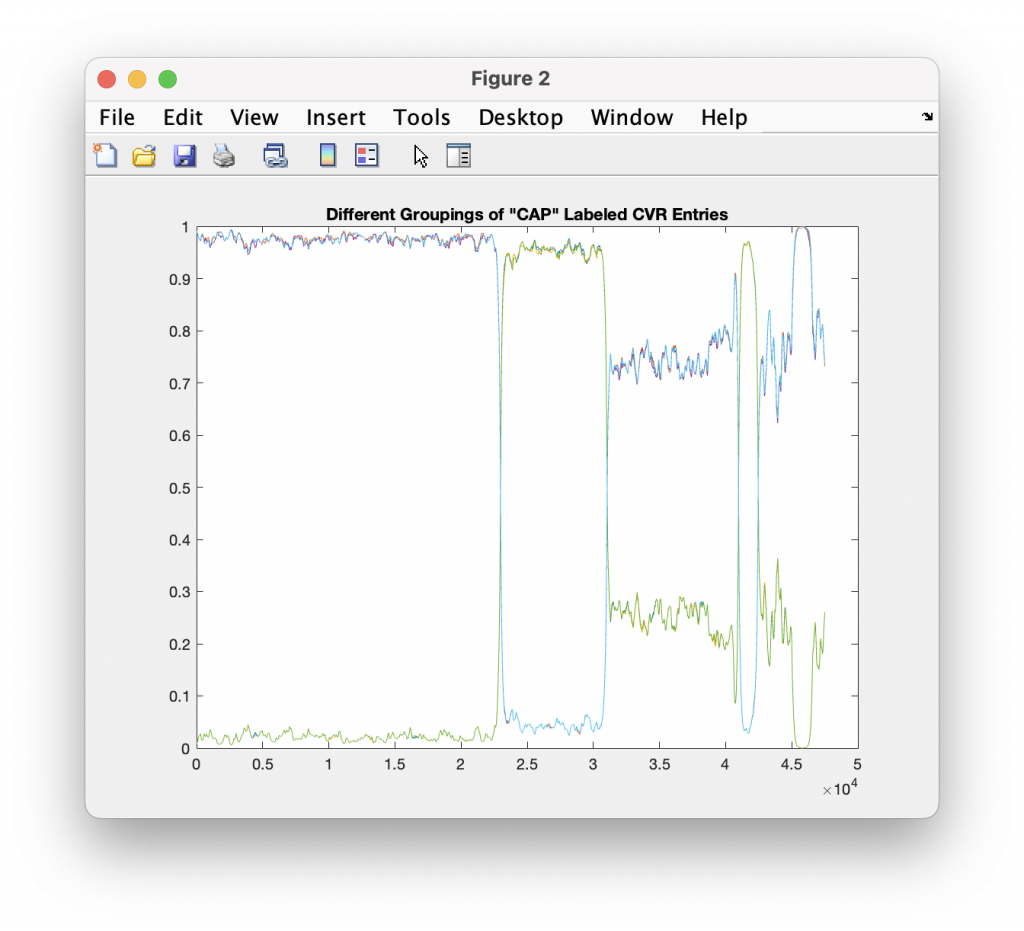
While there isn’t enough information in the Henrico CVR files to breakout the entries by USB/Scanner, and the Henrico data has record ID numbers instead of actual timestamps, there is enough information to break out them by Precinct, District and Race, with the exception of the Central Absentee Precincts (CAP) entries where we can only break them out by district given the metadata alone. However, with some careful MATLAB magic I was able to cluster the results marked as just “CAP” into at least 5 different sub-groupings that are statistically distinct. (I used an exponential moving average to discover the boundaries between groupings, and looking at the crossover points in vote share.) I then relabeled the entries with the corresponding “CAP 1”, “CAP 2”, … , “CAP 5” labels as appropriate. My previous analysis was only broken out by Race ID and CAP/Non-CAP/Provisional category.

Processing in this manner makes the individual distributions look much cleaner, so I think this does confirm that there is not a true sequential ordering in the CVR files coming out of the vendor software packages. (If they would just give us the dang timestamps … this would be a lot easier!)

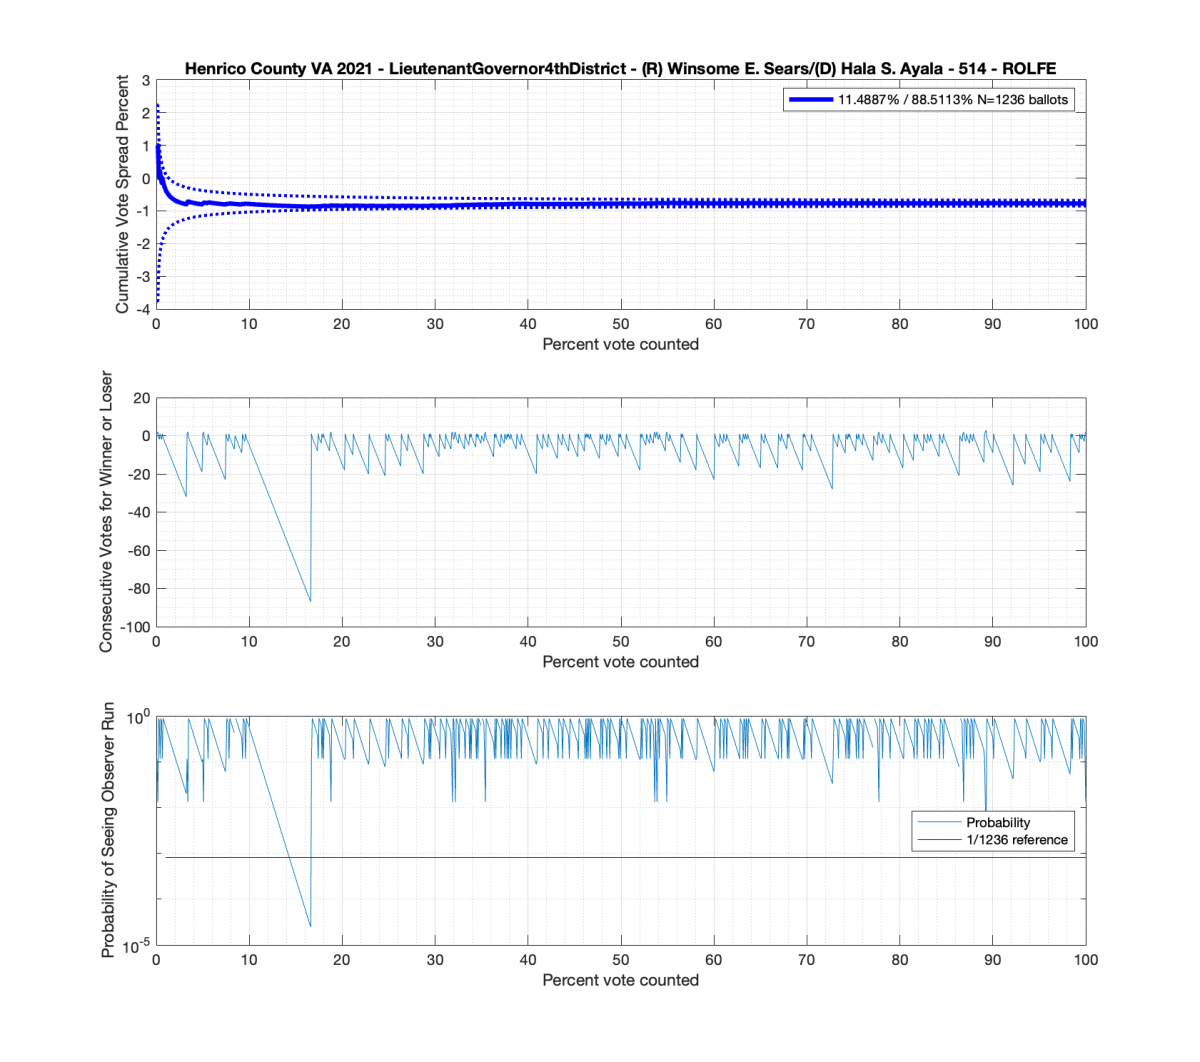
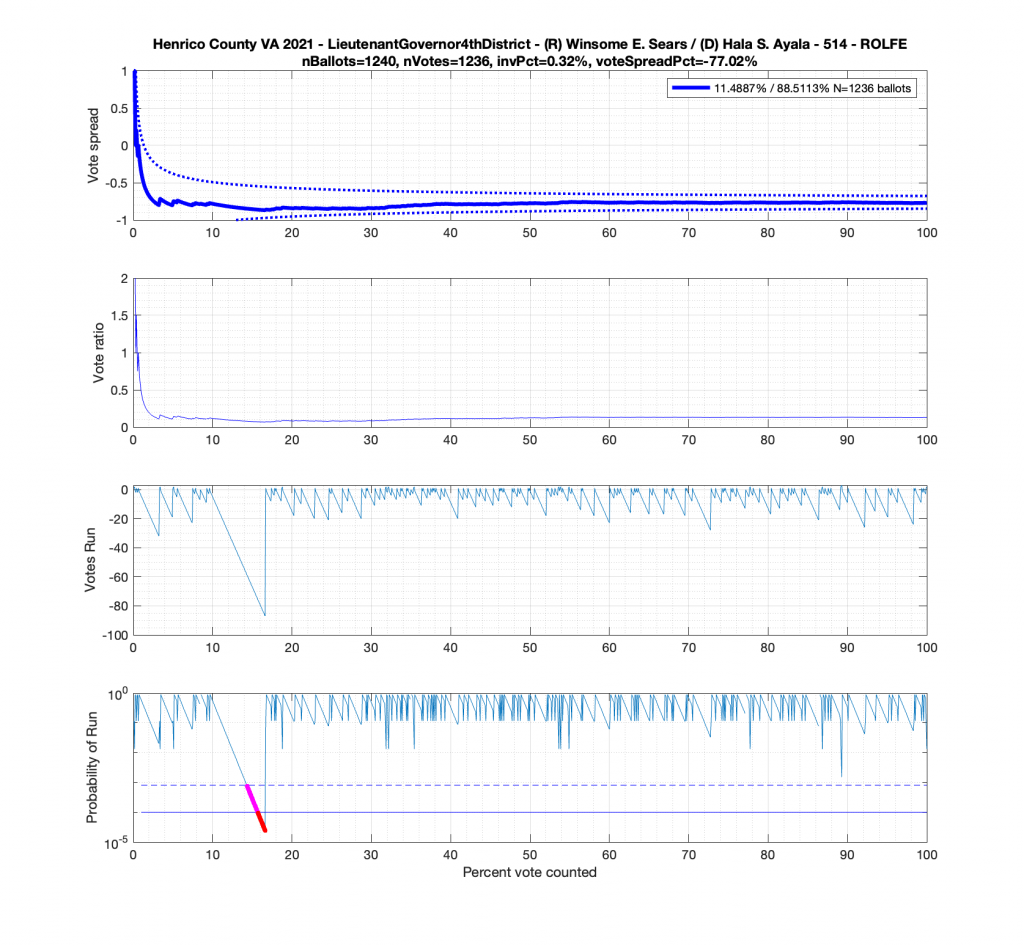
I have also added a bit more rigor to the statistics outlier detection by adding plots of the length of observed runs (e.g. how many “heads” did we get in a row?) as we move through the entries, as well as the plot of the probability of this number of consecutive tosses occurring. We compute this probability for K consecutive draws using the rules of statistical independence, which is P([a,a,a,a]) = P(a) x P(a) x P(a) x P(a) = P(a)^4. Therefore the probability of getting 4 “heads” in a row with a hypothetical 53/47 weighted coin would be .53^4 = 0.0789. There are also plotted lines for a probability 1/#Ballots for reference.

Results

The good news is that this method of slicing the data and assuming that the Vendor is simply concatenating USB drives seems to produce much tighter results that look to obey the expected IID distributions. Breaking up the data this way resulted in no plot breaking the +/- 3/sqrt(N-1) boundaries, but there still are a few interesting datapoints that we can observe.

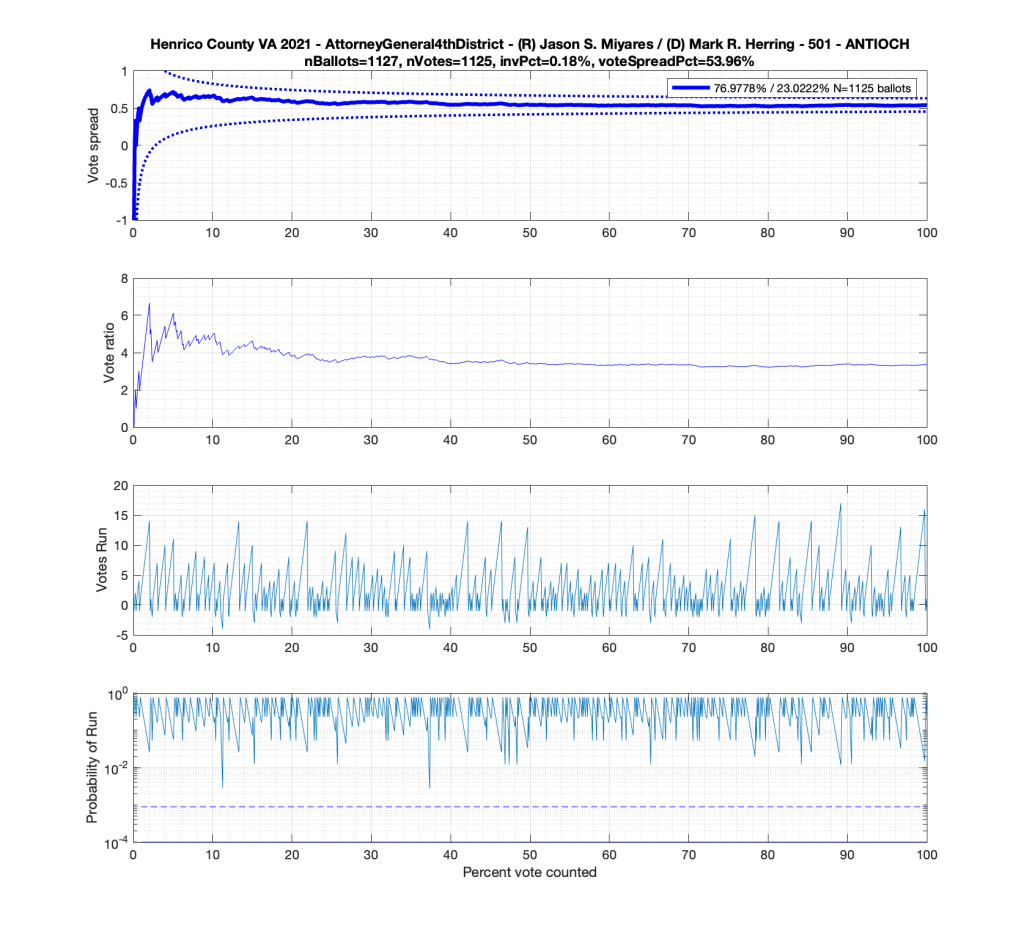
In the plot below we have the Attorney Generals race in the 4th district from precinct 501 – Antioch. This is a district that Miyares won handily 77%/23%. We see that the top plot of the cumulative spread is nicely bounded by the +/- 3/sqrt(N-1) lines. The second plot from the top gives the vote ratio in order to compare with the work that Draza Smith, Jeff O’Donnell and others are doing with CVR’s over at Ordros.com. The second from bottom plot gives the number k of consecutive ballots (in either candidates favor) that have been seen at each moment in the counting process. And the bottom plot raises either the 77% or 23% overall probability to the k-th power to determine the probability associated with pulling that many consecutive Miyares or Herring ballots from an IID distribution. The most consecutive ballots Miyares received in a row was just over 15, which had a .77^15 = 0.0198 or 1.98% chance of occurring. The most consecutive ballots Herring received was about 4, which equates to a probability of occurrence of .23^4 = 0.0028 or 0.28% chance. The dotted line on the bottom plot is referenced at 1/N, and the solid line is referenced at 0.01%.

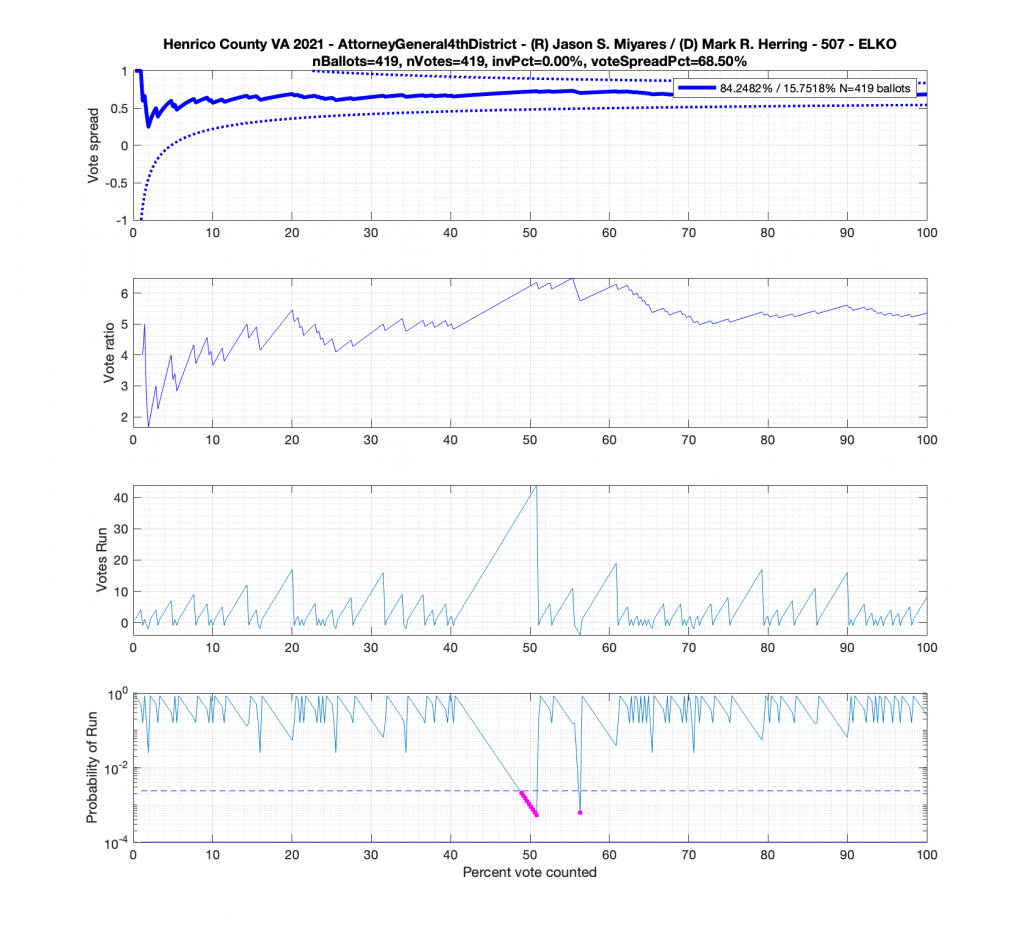
But let’s now take a look at another plot for the Miyares contest in another blowout locality with 84% / 16% for Miyares. The +/- 3/sqrt(N-1) limit nicely bounds our ballot distribution again. There is, however, an interesting block of 44 consecutive ballots for Miyares about halfway through the processing of ballots. This equates to .84^44 = 0.0004659 or a 0.04659% chance of occurrence from an IID distribution. Close to this peak is a run of 4 ballots for Herring which doesn’t sound like much, but given the 84% / 16% split, the probability of occurrence for that small run is .16^4 = 0.0006554 or 0.06554%!

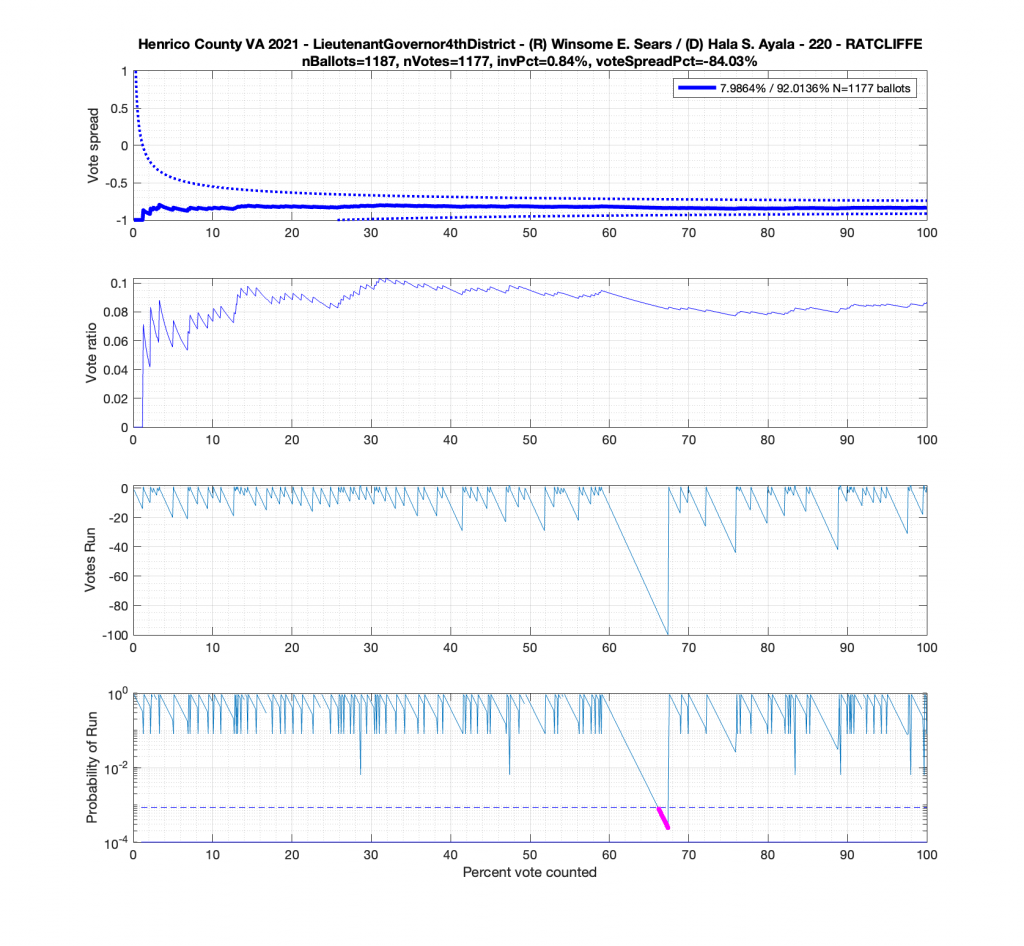
Moving to the Lt. Governors race we see an interesting phenomenon where where Ayala received a sudden 100 consecutive votes a little over midway through the counting process. Now granted, this was a landslide district for Ayala, but this still equates to a .92^100 = 0.000239 or 0.0239% chance of occurrence.

And here’s another large block of contiguous Ayala ballots equating to about .89^84 = 0.00005607 or 0.0056% chance of occurrence.

Tests for Differential Invalidation (added 2022-09-19):

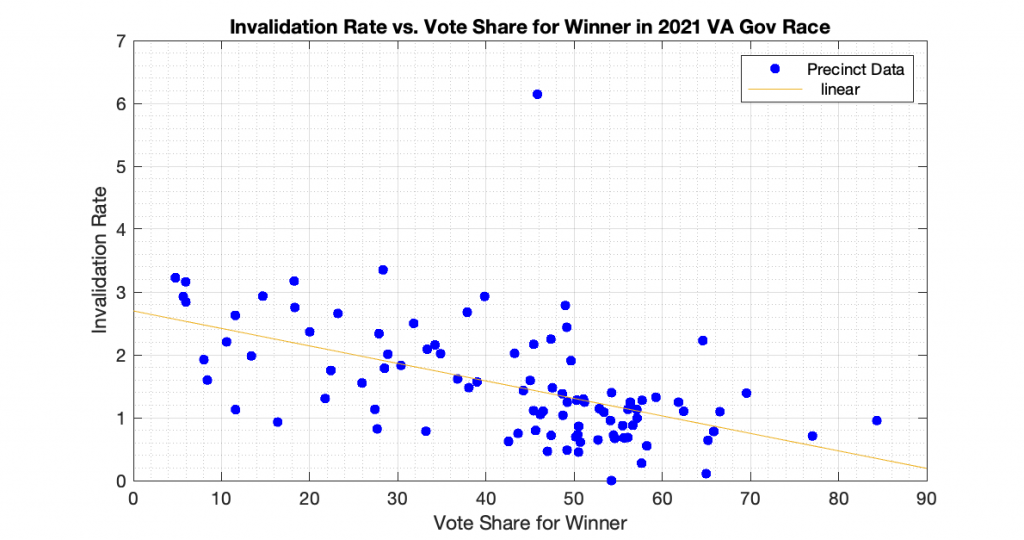
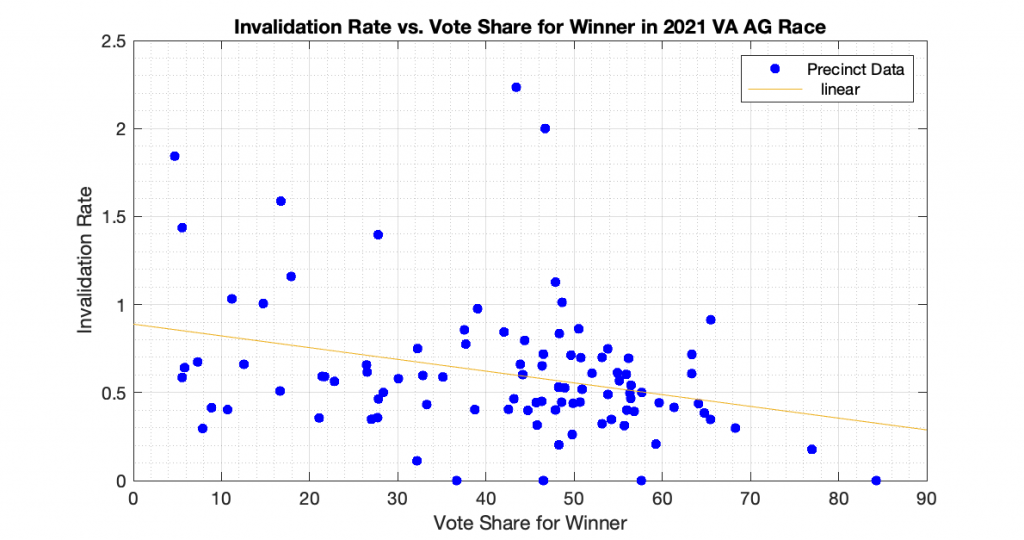
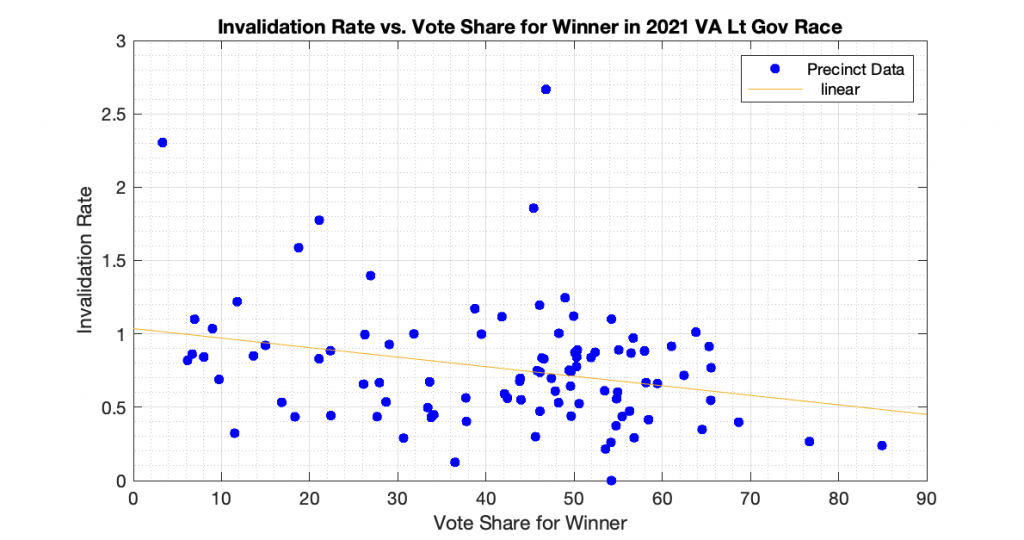
“Differential invalidation” takes place when the ballots of one candidate or position are invalidated at a higher rate than for other candidates or positions. With this dataset we know how many ballots were cast, and how many ballots had incomplete or invalid results (no recorded vote in the cvr, but the ballot record exists) for the 3 statewide races. In accordance with the techniques presented in [1] and [2], I computed the plots of the Invalidation Rate vs the Percent Vote Share for the Winner in an attempt to observe if there looks to be any evidence of Differential Invalidation ([1], ch 6). This is similar to the techniques presented in [2], which I used previously to produce my election fingerprint plots and analysis that plotted the 2D histograms of the vote share for the winner vs the turnout percentage.

The generated the invalidation rate plots for the Gov, Lt Gov and AG races statewide in VA 2021 are below. Each plot below is representing one of the statewide races, and each dot is representing the ballots from a specific precinct. The x axis is the percent vote share for the winner, and the y axis is computed as 100 – 100 * Nvotes / Nballots. All three show a small but statistically significant linear trend and evidence of differential invalidation. The linear regression trendlines have been computed and superimposed on the data points in each graph.

To echo the warning from [1]: a differential invalidation rate does not directly indicate any sort of fraud. It indicates an unfairness or inequality in the rate of incomplete or invalid ballots conditioned on candidate choice. While it could be caused by fraud, it could also be caused by confusing ballot layout, or socio-economic issues, etc.

Full Results Download

References

  • [1] Forsberg, O.J. (2020). Understanding Elections through Statistics: Polling, Prediction, and Testing (1st ed.). Chapman and Hall/CRC. https://doi.org/10.1201/9781003019695
  • [2] Klimek, Peter & Yegorov, Yuri & Hanel, Rudolf & Thurner, Stefan. (2012). Statistical Detection of Systematic Election Irregularities. Proceedings of the National Academy of Sciences of the United States of America. 109. 16469-73. https://doi.org/10.1073/pnas.1210722109.
Categories
Election Data Analysis Election Forensics Election Integrity Interesting programming technical

CVR Analysis – Henrico County VA 2021

Update 2022-08-29 per observations by members of the Texas team I am working with, we’ve been able to figure out that (a) the vendor was simply concatenating data records from each machine and not sorting the CVR results and (b) how to mostly unwrap this affect on the data to produce much cleaner results. The results below are left up for historical reference.

For background information, please see my introduction to Cast Vote Records processing and theory here: Statistical Detection of Irregularities via Cast Vote Records. This entry will be specifically documenting the results from processing the Henrico County Virginia CVR data from the 2021 election.
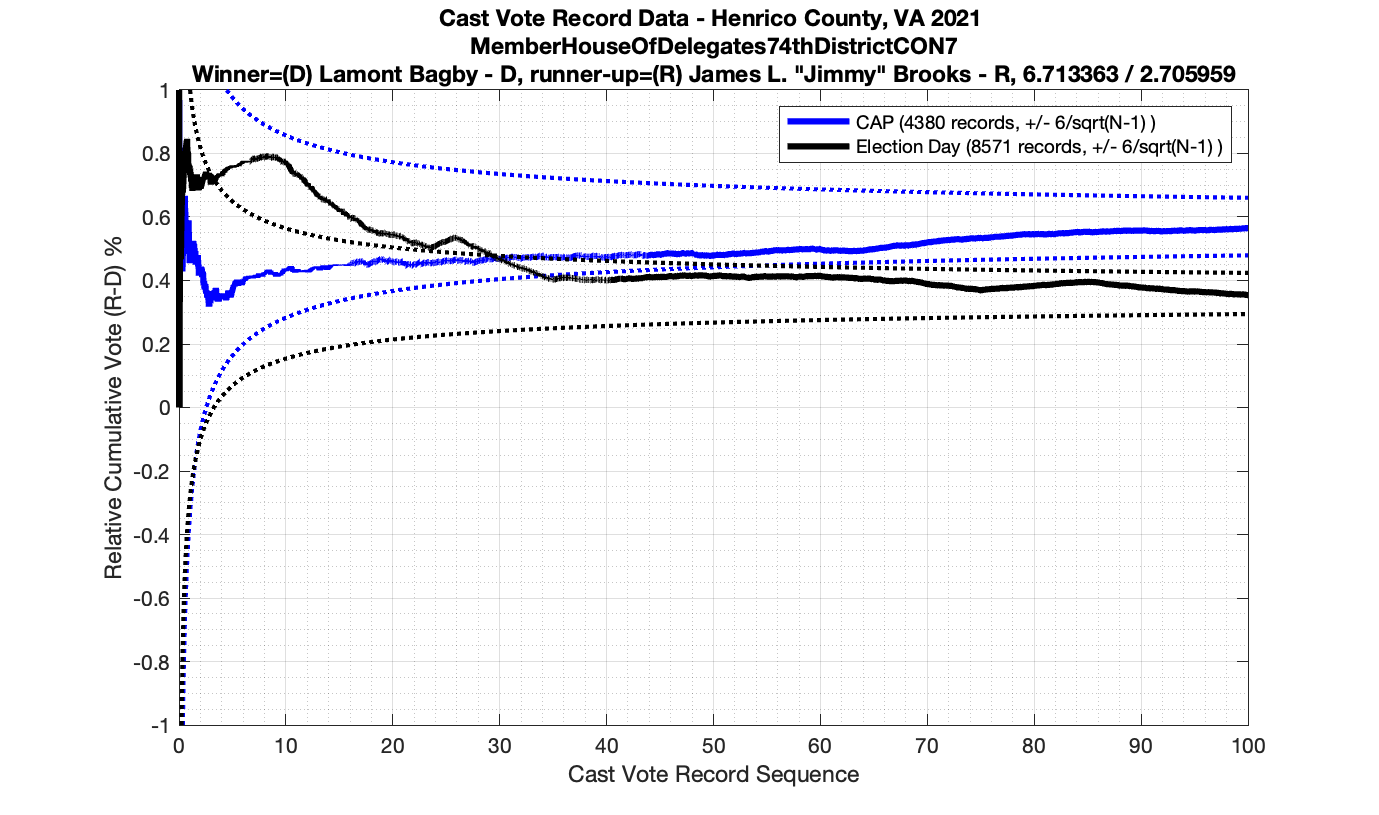
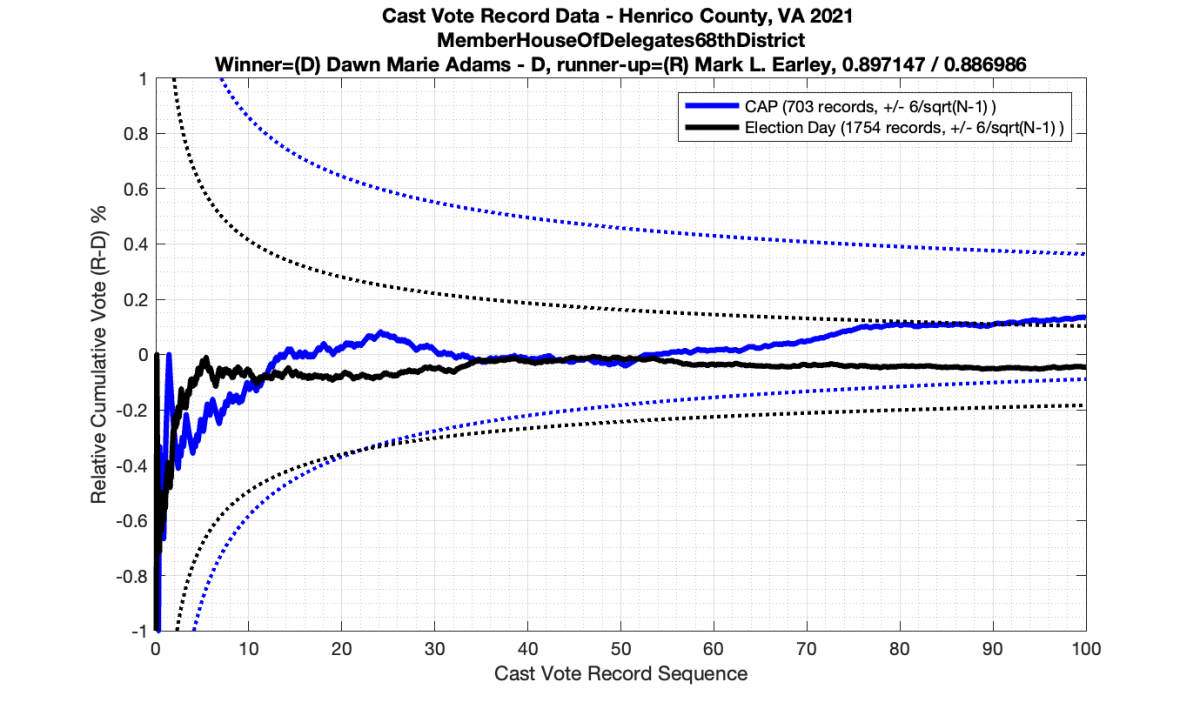
As in the results from the previous post, I expanded the theoretical error bounds out to 6/sqrt(N) instead of 3/sqrt(N) in order to give a little bit of extra “wiggle room” for small fluctuations.
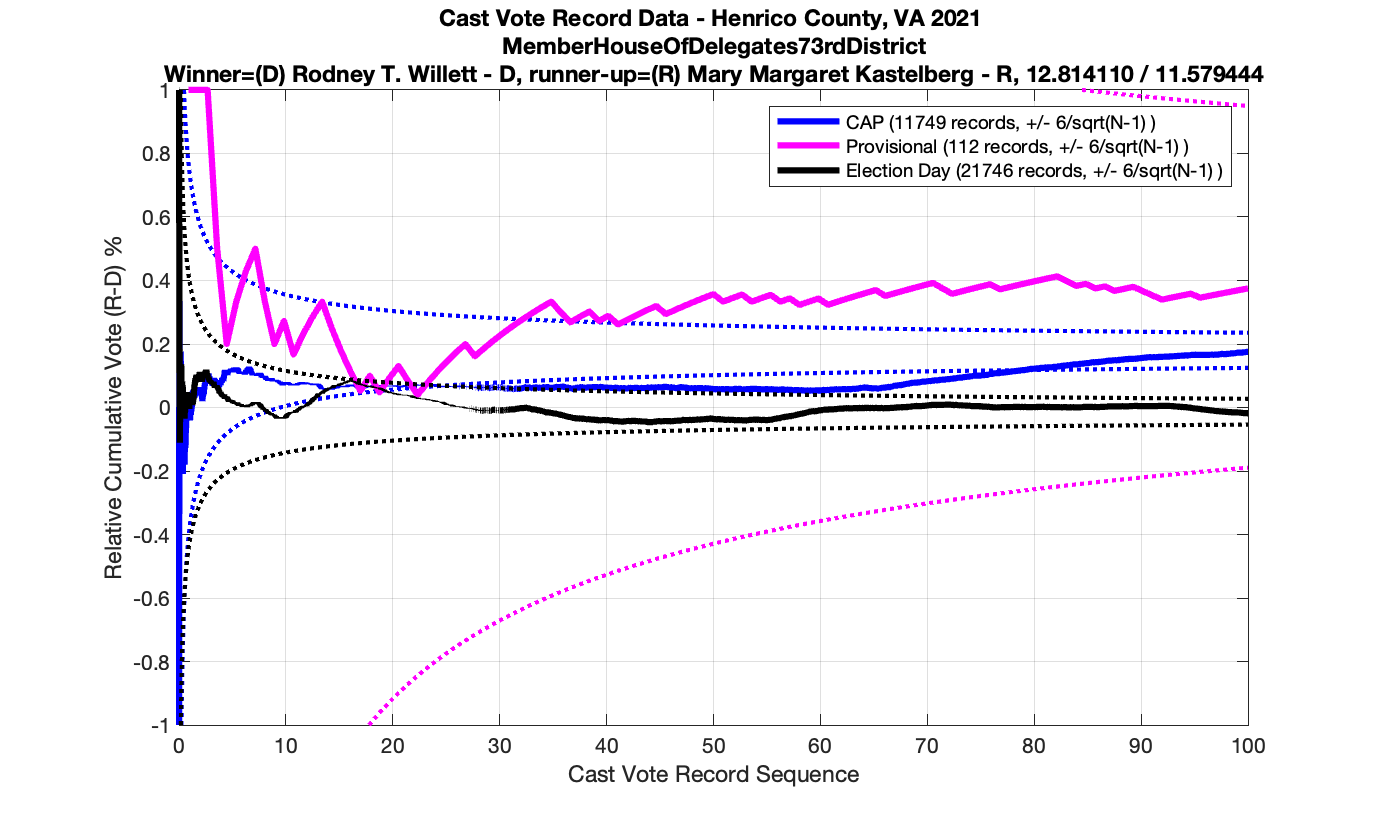
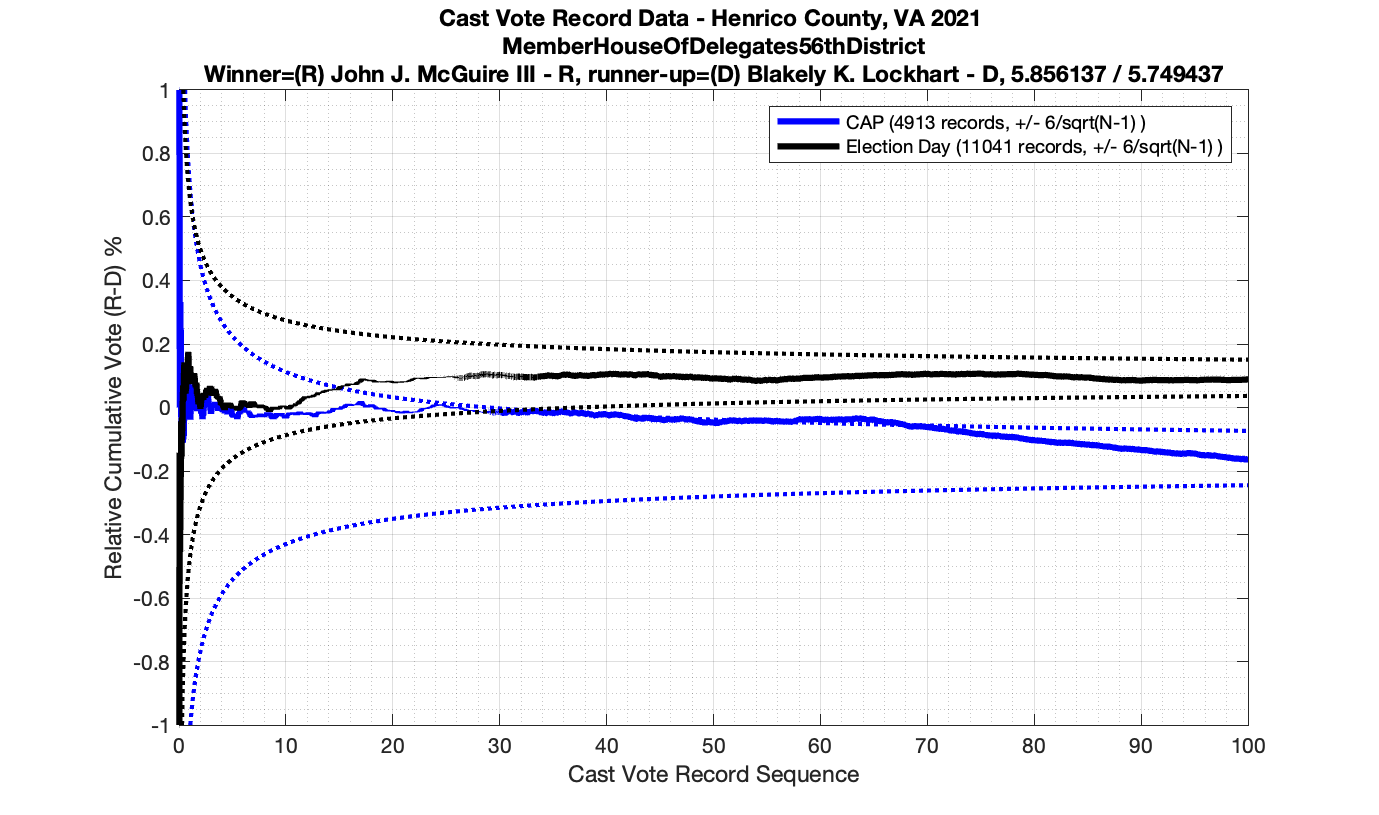
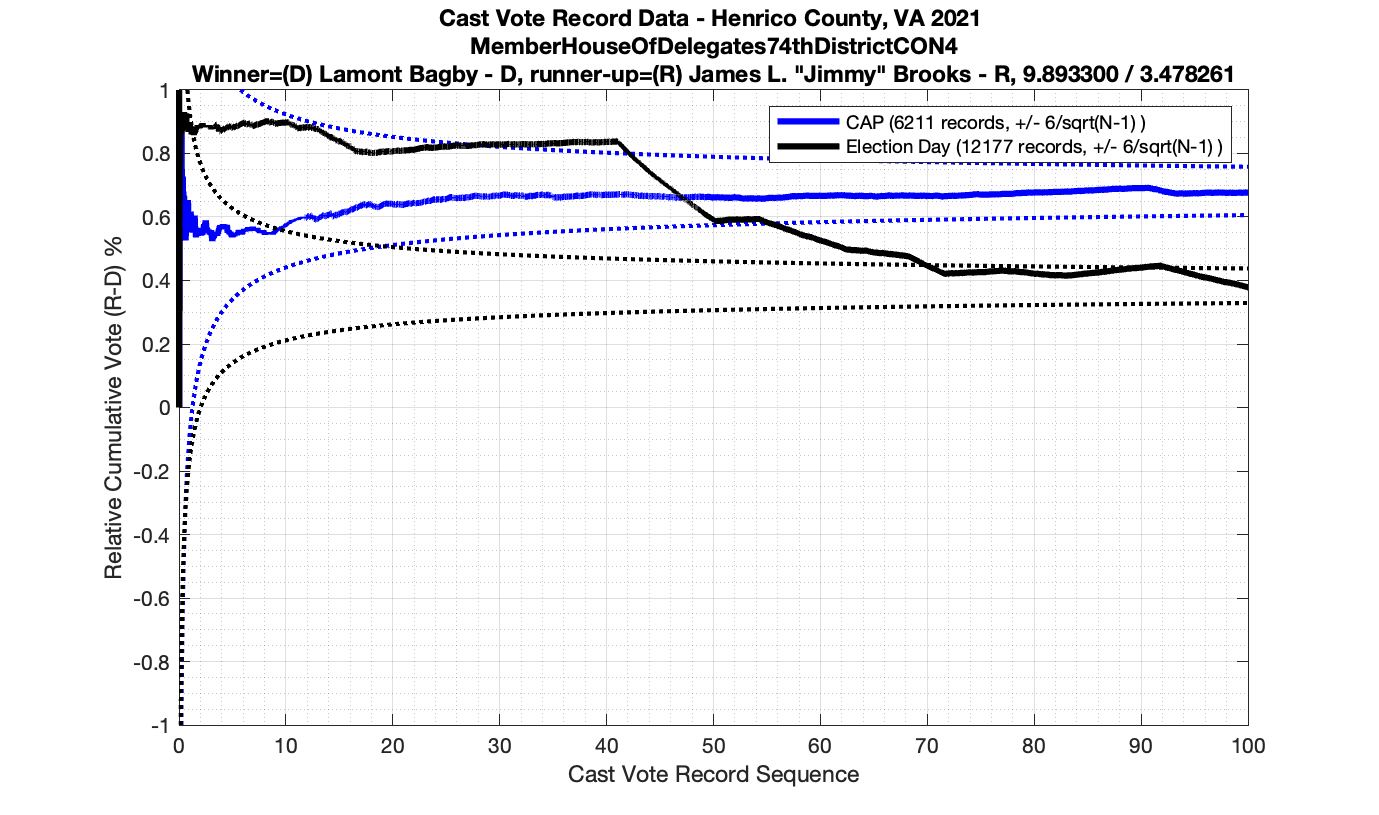
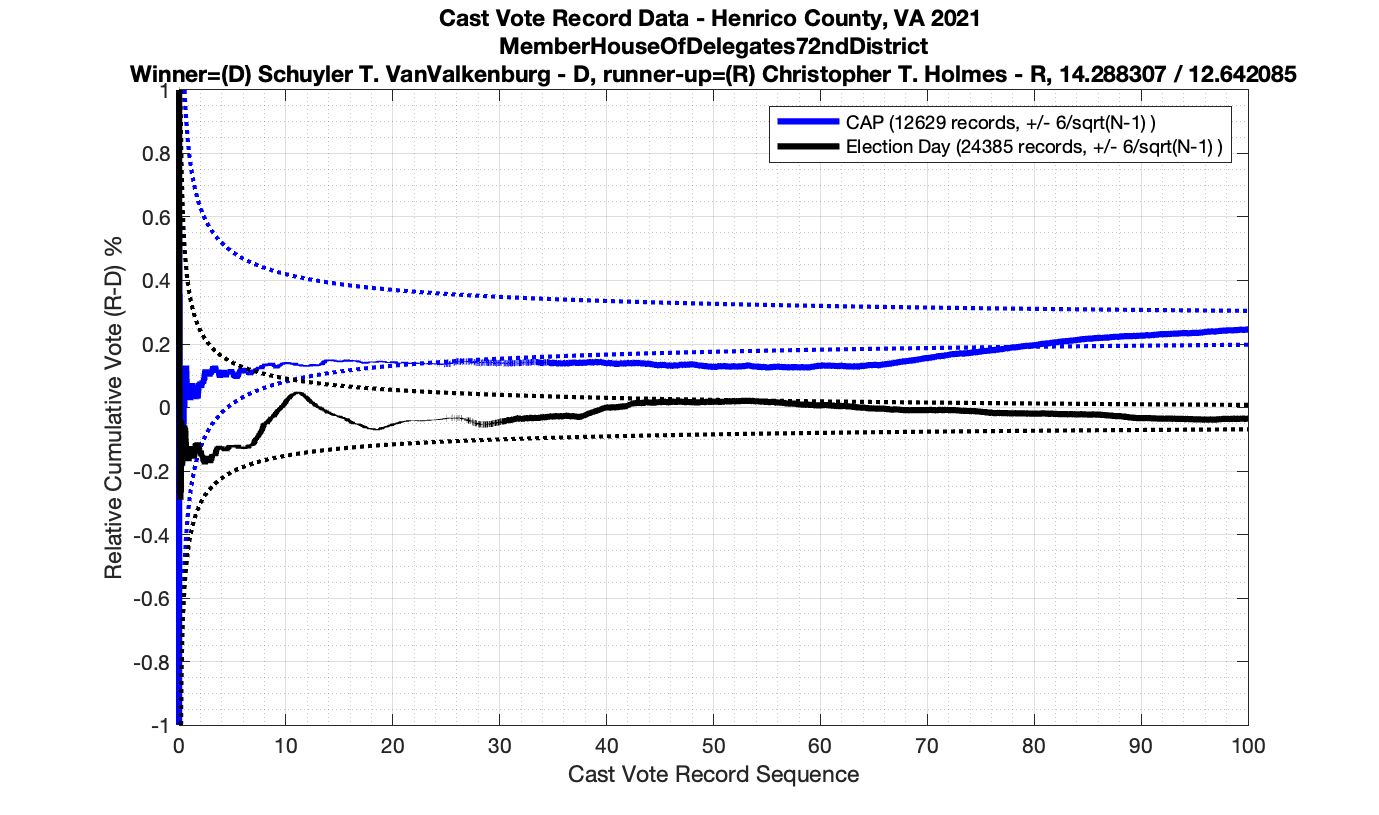
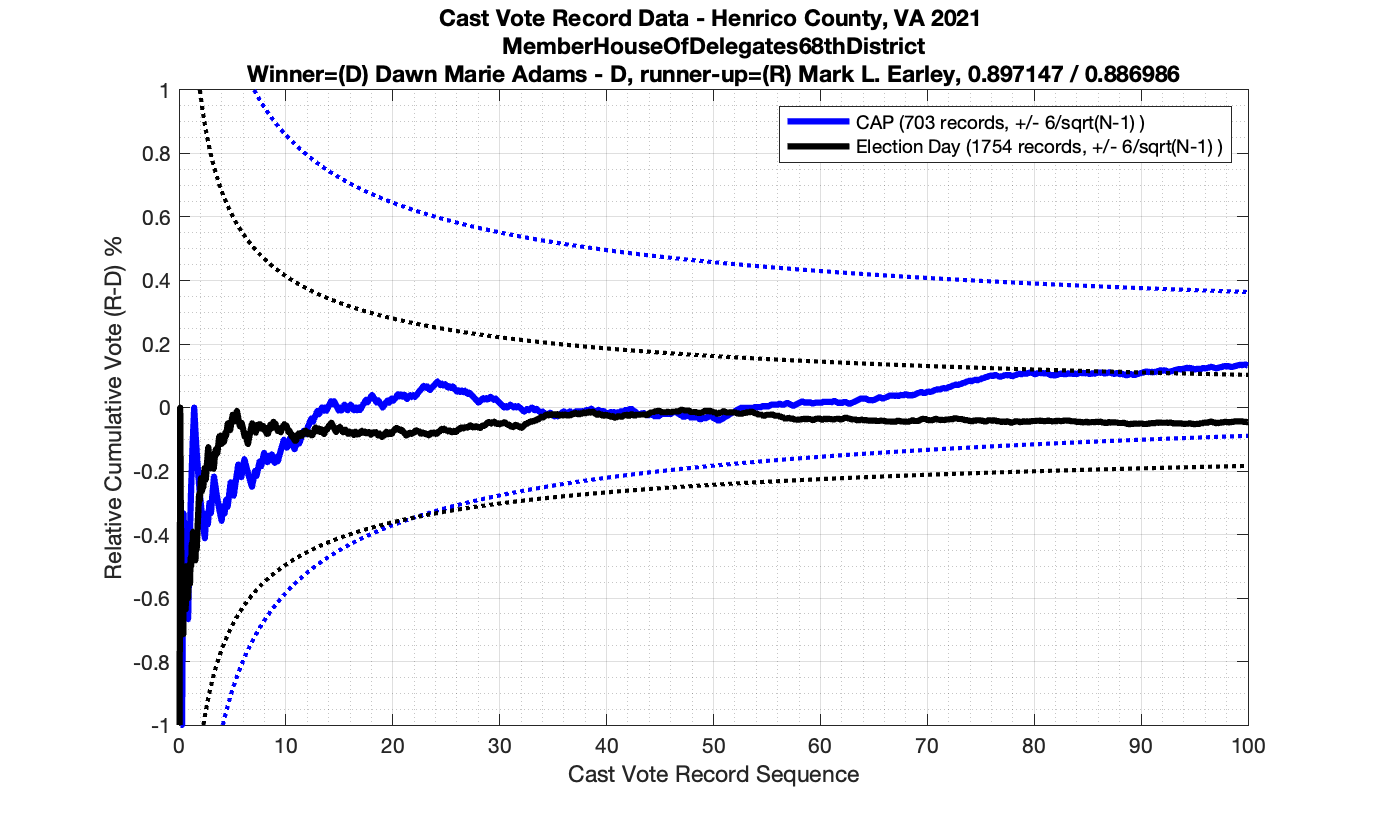
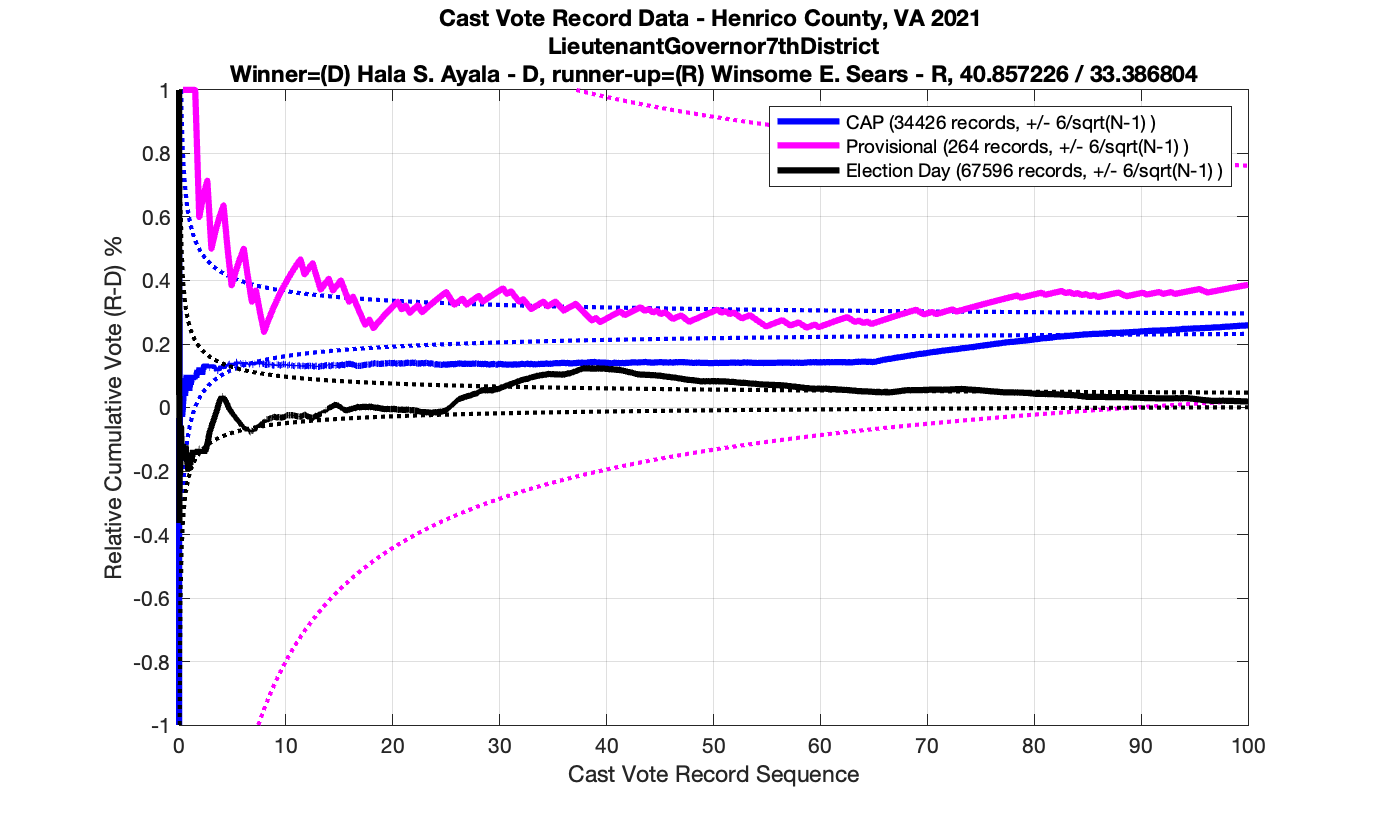
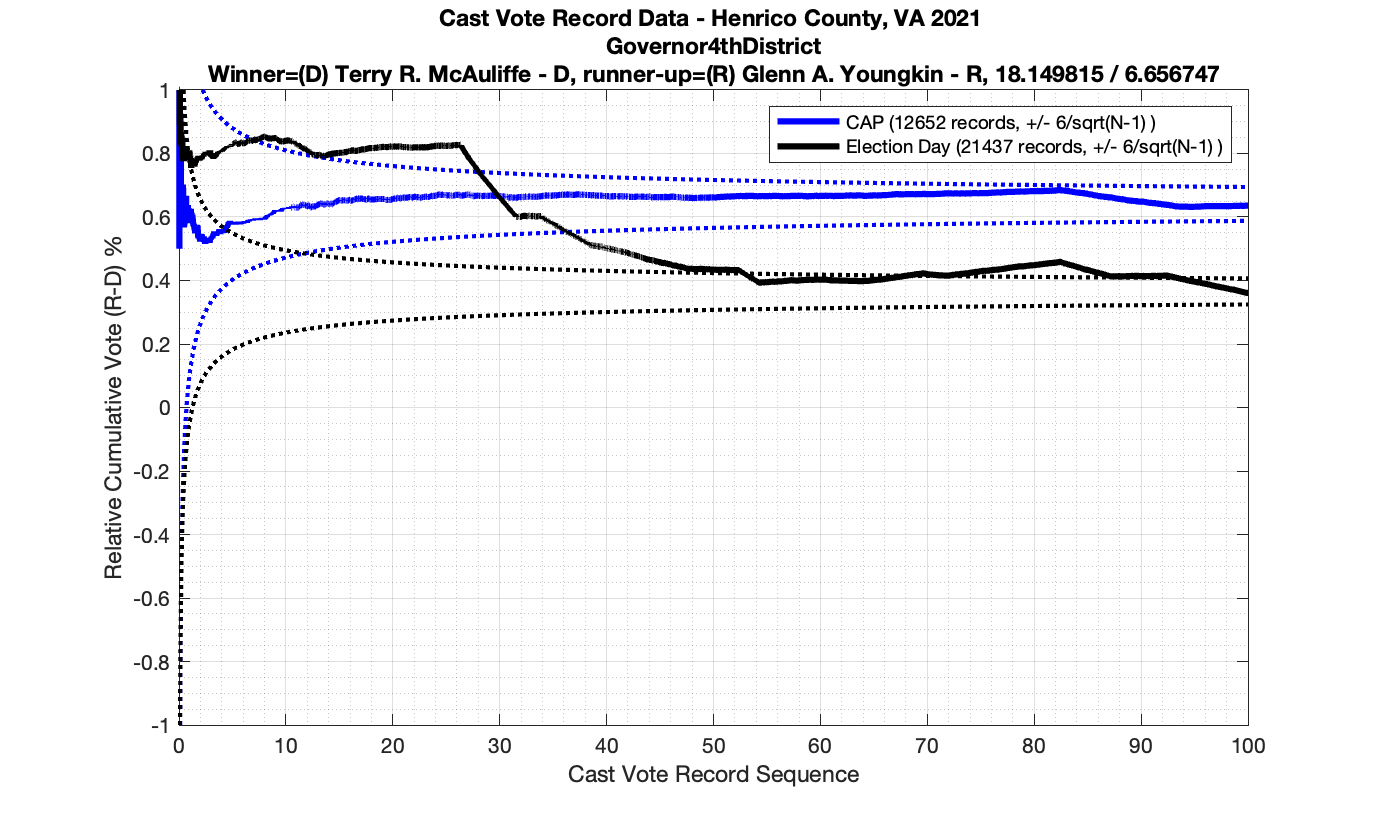
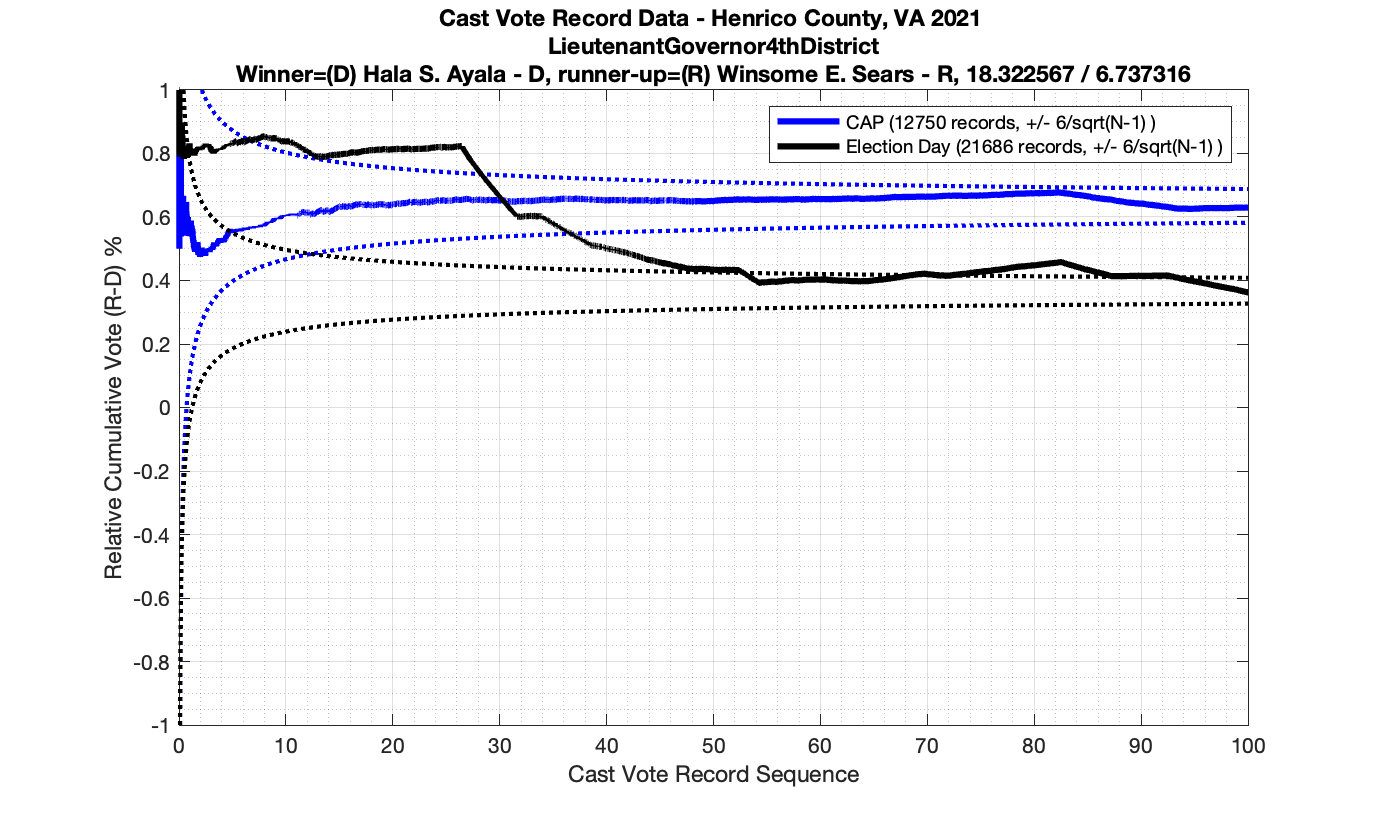
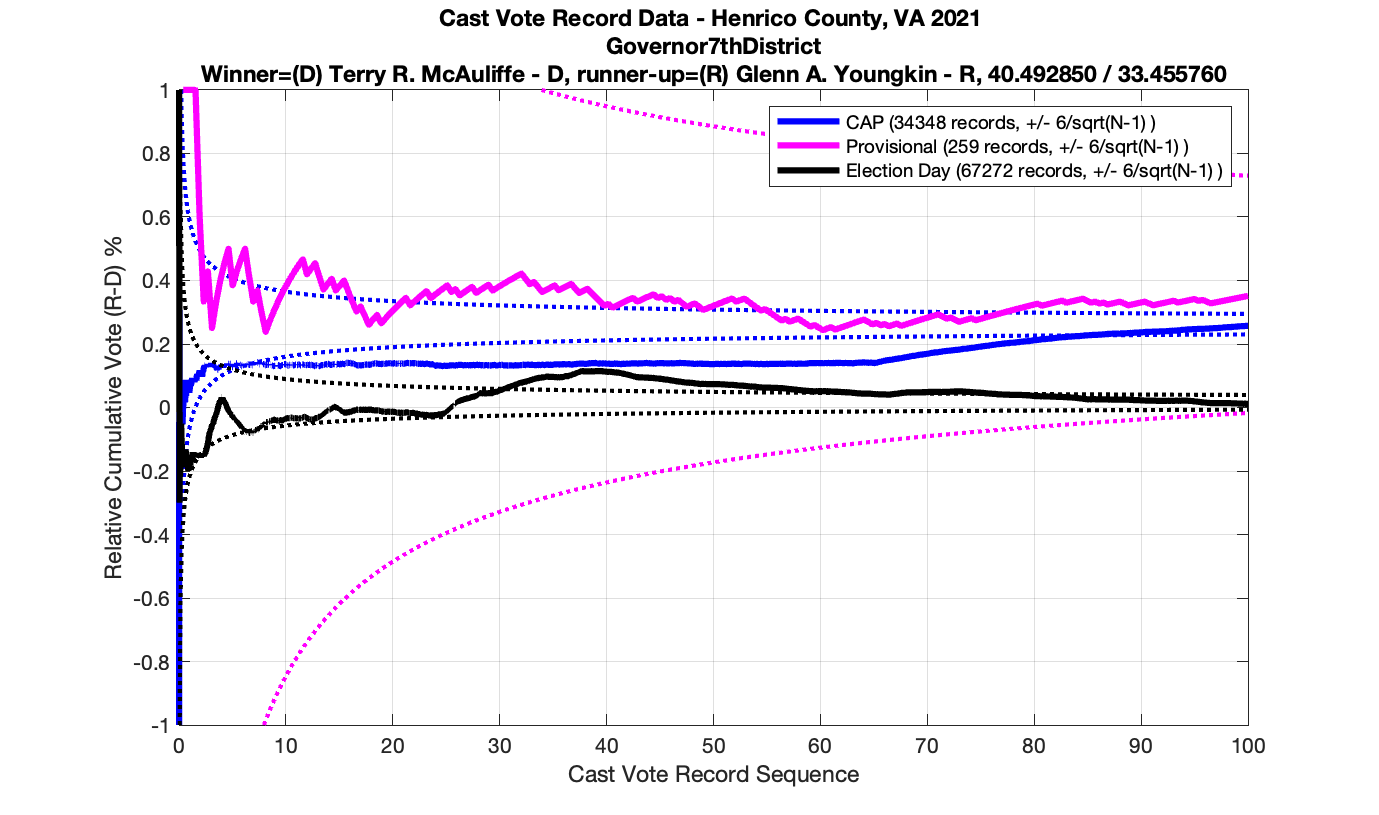
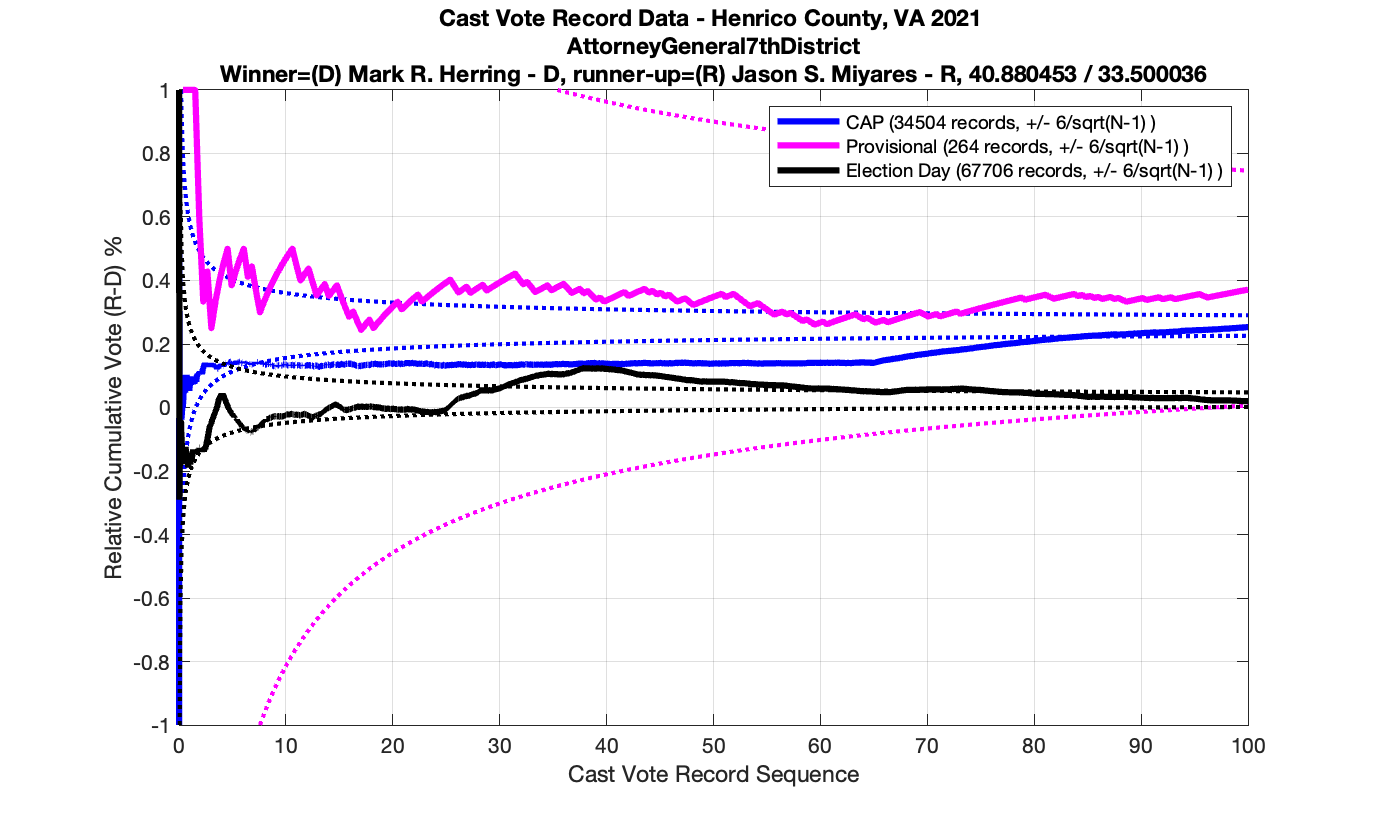
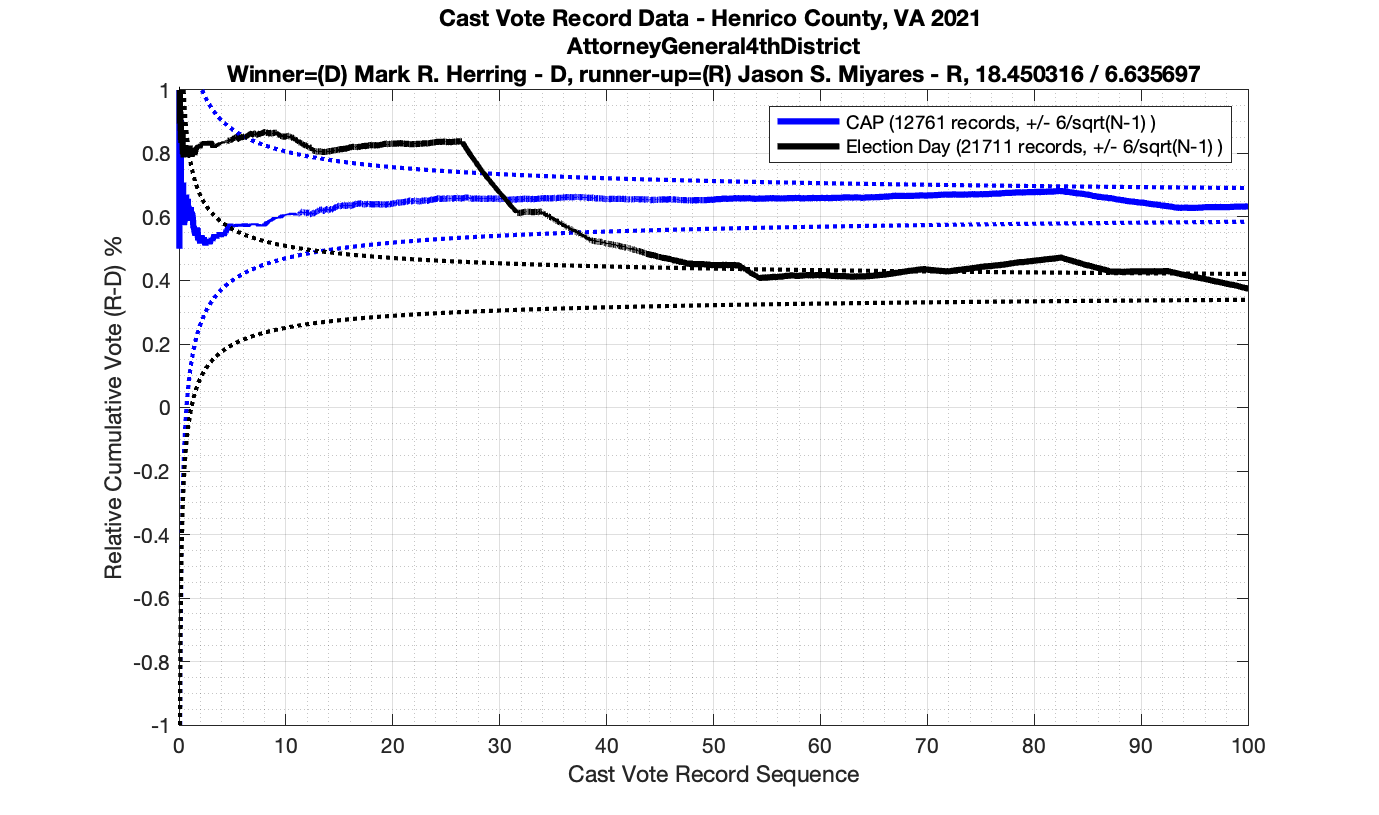
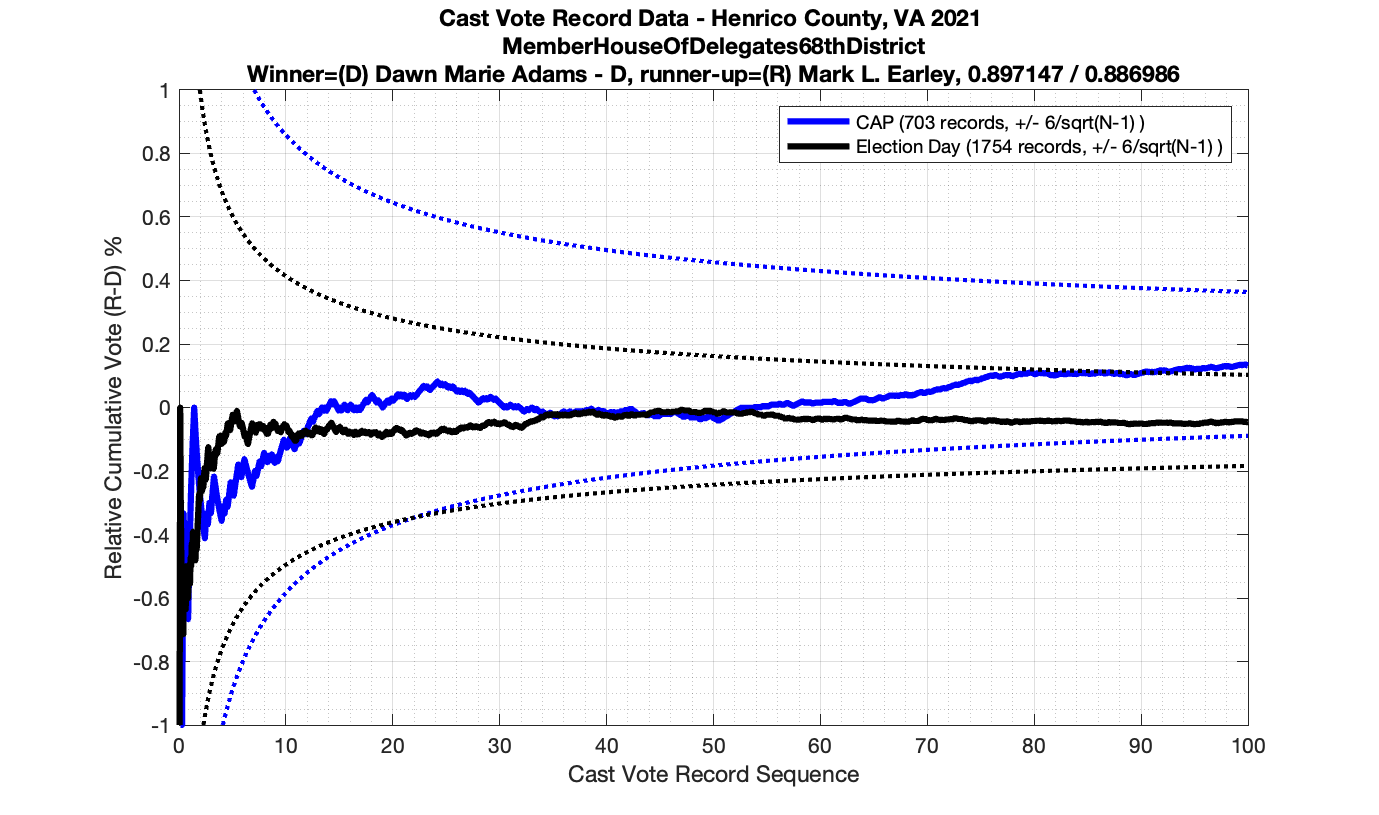
However the Henrico dataset could only be broken up by CAP, Non-CAP or Provisional. So be aware that the CAP curves presented below contain a combination of both early-vote and mail-in ballots.
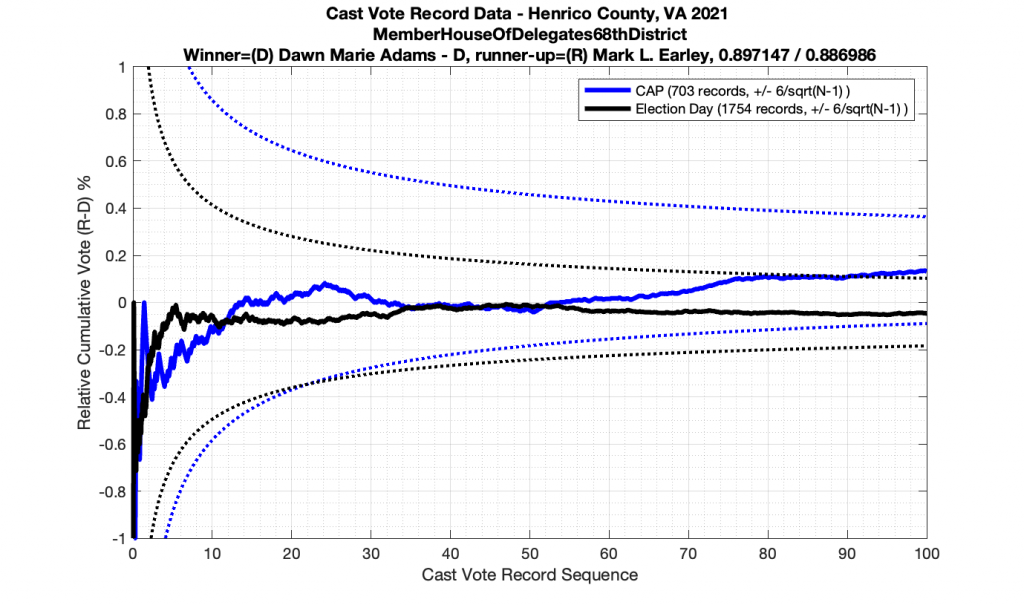
The good news is that I’ve at least found one race that seems to not have any issues with the CVR curves staying inside the error boundaries. MemberHouseOfDelegates68thDistrict did not have any parts of the curves that broke through the error boundaries.

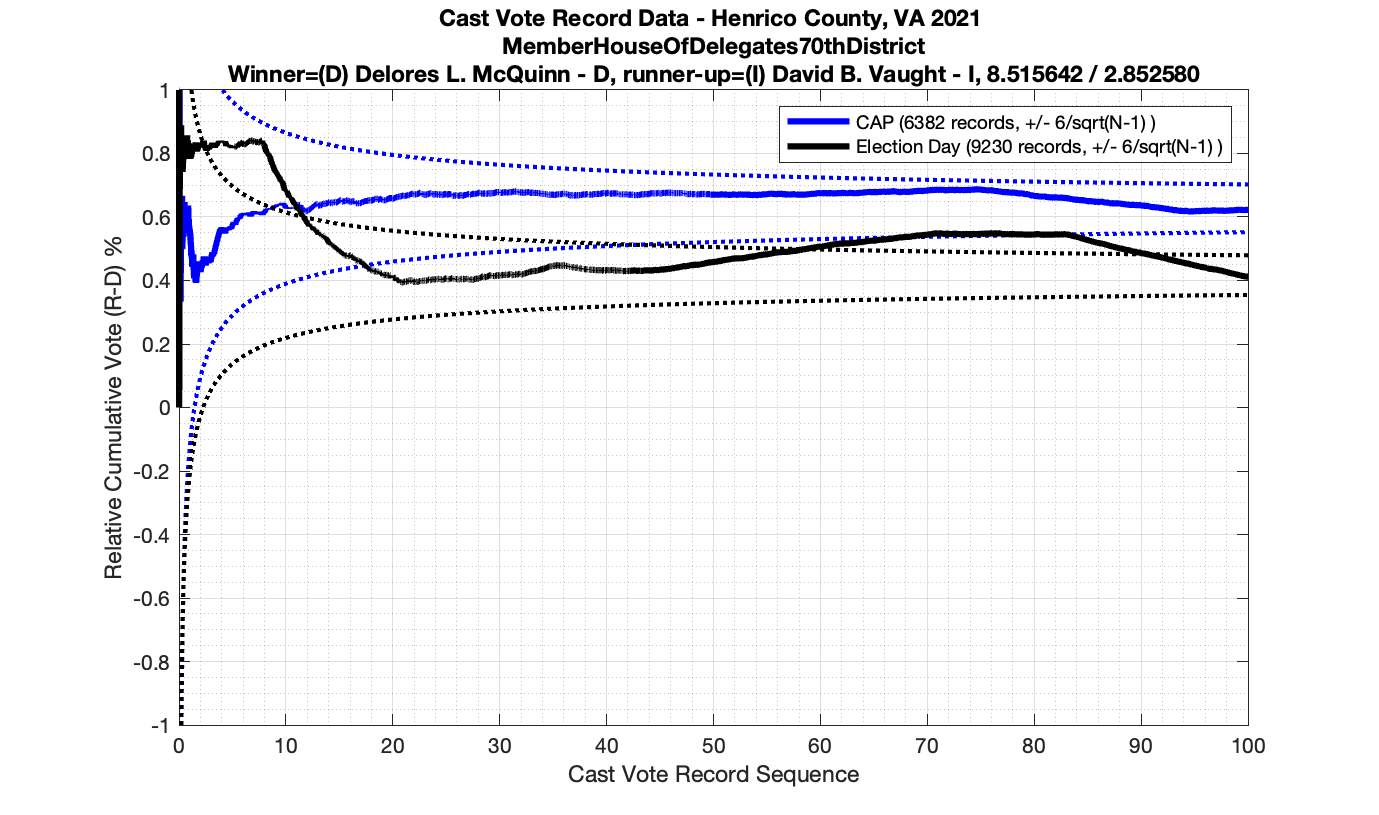
The bad news … is pretty much everything else doesn’t. I cannot tell you why these curves have such differences from statistical expectation, just that they do. We must have further investigation and analysis of these races to determine root cause. I’ve presented all of the races that had sufficient number of ballots below (1000 minimum for the race a whole, and 100 ballot minimum for each ballot type).