Here is the changes to the voter registration numbers for each VA locality over the course of the 2022 general election. These files will be updated automatically as the data becomes available. The first graph below is the percent change with the color coding clamped to +/- 3 x the standard deviation, and the second is the absolute percent change.
Update 10-17-2022: There has been an issue with the VERIS system (the database that runs behind the scenes at the VA department of elections) where updates to the DAL files have not progressed since 10/14. On 10/17 there was a published change to the data files but the report generated was incomplete and cutoff halfway through its listing of CARROL COUNTY data. I had a phone conversation on 10/17 with ELECT and they are aware of the issue and working to correct it. Also I have included a new gallery at the bottom of the page of all of the individual localities or precincts that are automatically flagged as having issues of concern. Issues detected include any number of “vanishing” voters as defined below, “On Machine” ballot counts that decrease day-to-day, “Marked” OR “Pre-Processed” counts that decrease day-to-day, etc.
Update 10-18-2022: The publication of the DAL files has resumed. I have queries in to the department of elections as to the exact cause of the issues and will update accordingly as I find out more information.
Below is the current set of statistics from the 2022 VA General Election Daily Absentee List (DAL) file records. There are two plots below representing the same data, one plot with a linear y-axis and the other with a logarithmic y-axis. The x-axis is the date that each DAL file processed was archived and pulled from the Dept of Elections (ELECT) servers. Solid traces are directly extracted data from the DAL files. Dashed traces are computed metrics such as the number of “vanished” voters detected (described below). Red datapoints are placed on traces that exhibit questionable behavior, for example if the number of “approved” and “countable” ballots ever decreases, etc. Vertical dotted lines indicate important dates.
There are two very important fields in the DAL file that we want to pay attention to here: the APP_STATUS field, and the BALLOT_STATUS field.
DAL records with APP_STATUS = “Approved” and BALLOT_STATUS = “Issued” indicate a ballot that has been mailed to a voter.
DAL records with APP_STATUS = “Approved” and BALLOT_STATUS = “Marked” indicate a mail-in ballot that has been mailed to a voter, and then subsequently returned.
DAL records with APP_STATUS = “Approved” and BALLOT_STATUS = “Pre-Processed” indicate a mail-in ballot that has been mailed to a voter, returned and the ballot envelope has been opened and the ballot processed.
DAL records with APP_STATUS = “Approved” and BALLOT_STATUS = “On Machine” indicate a ballot record from a voter who physically walked into an early voting site and cast their vote on a tabulator machine.
DAL records with APP_STATUS = “Approved” and BALLOT_STATUS = “FWAB” indicate a Federal Worker Absentee Ballot (FWAB) mail-in ballot that has been received.
The combination of all ballots that have APP_STATUS=Approved and BALLOT_STATUS = “Marked” | “Pre-Processed” | “On Machine” | “FWAB” we term as “Countable” ballots.
I’ve computed the number of countable records that have an invalid BALLOT_RECIEPT_DATE or an invalid APP_RECIEPT_DATE. (For example if the BALLOT_RECIEPT_DATE is before the start of early voting, etc.)
I am also attempting to detect the number of duplicate voter IDs in a “countable” (as described above) state, if any, for each DAL file.
Additionally, I’ve computed and plotted the number of “Vanished” voters seen as we process the DAL files in chronological order. As each publication of the the DAL file is intended to capture information on all of the absentee ballots to date during an election, we would expect that once a unique voter ID becomes a record in the DAL file, that all subsequent DAL files should have an entry for that ID, regardless of its status. However, we know there are multiple instances where a voter ID will show up in the DAL record on a given date, and then be completely missing from a future DAL file.
Upon asking the department of elections for clarification as to how this can occur, their answer given was that if the voter has their registration cancelled for any reason, they are also removed from the DAL file. This holds true, even if live ballots had been issued for that voter, or if the voters vote has already been fed into a tabulator. This means that there is NO ACCOUNTING for these ballots in the DAL record. Note that the department of elections also does the same thing with the Voter History List (VHL) and the List of Those Who Voted (LTWV) data files. This is apparently standard operating procedure for the VERIS database(s) at ELECT, and (I quote) “… nothing unusual …” or to be concerned about as far as the department of elections is concerned. I vehemently disagree, and think that removing these records from the DAL while the election is ongoing is extremely problematic, to put it politely.
I will continue to update these plots as the election progresses. as more data comes in I will also be publishing these types of graphs for selected localities and precincts.
All of the latest plots for every locality and precinct as well as the corresponding underlying CSV data files will be updated daily, and you can download them here.
The semilog versions of the plots for all localities or precincts that appear in the DAL data that have flagged issues of concern are shown in the gallery below. The image carousel below might take a moment to load, btw.
No permissions to browse the folder or the folder does not exist
Since I posted my initial analysis of the Henrico CVR data, one comment was made to me by a member of the Texas election integrity group I have been working with: We have been assuming, based on vendor documentation and the laws and requirements in various states, that when a cast vote record is produced by vendor software the results are sorted by the time the ballot was recorded onto a scanner. However, when looking at the results that we’ve been getting so far and trying to figure out plausible explanations for what we were seeing, he realized it might be the case that the ordering of the CVR entries are being done by both time AND USB stick grouping (which is usually associated with a specific scanner or precinct) but then simply concatenating all of those results together.
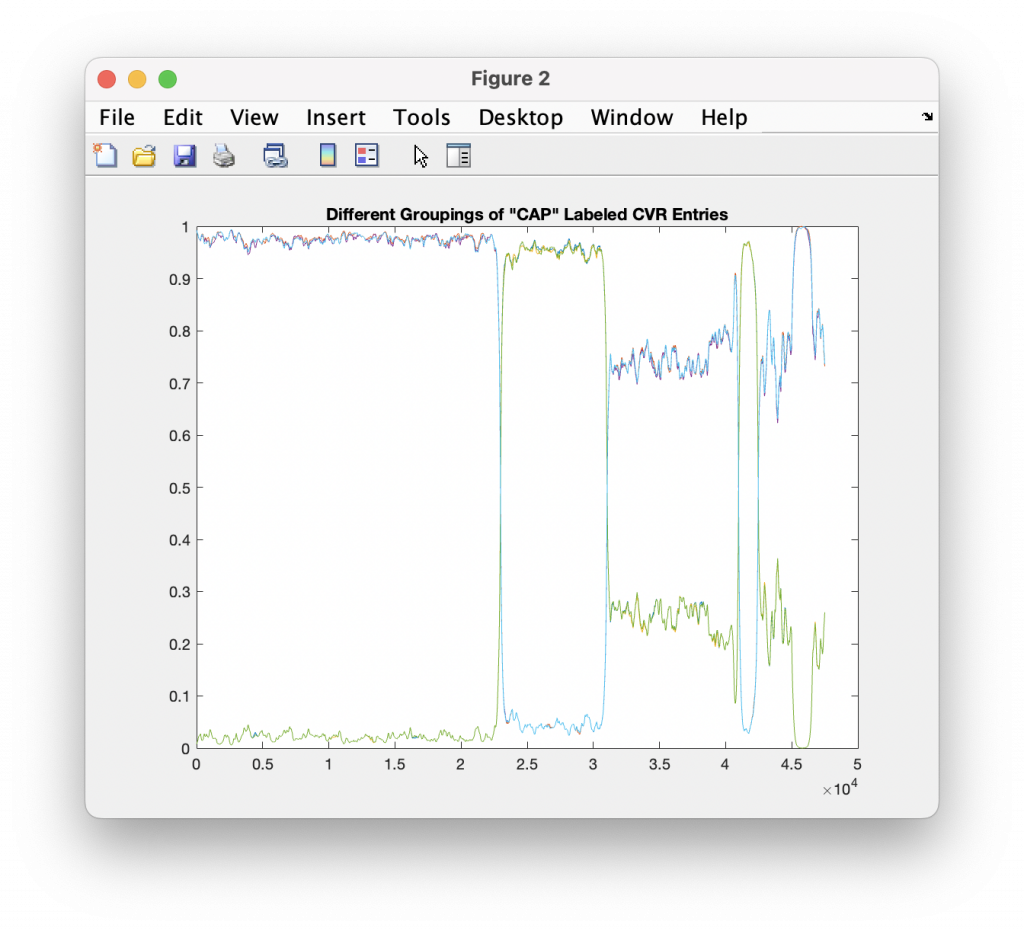
While there isn’t enough information in the Henrico CVR files to breakout the entries by USB/Scanner, and the Henrico data has record ID numbers instead of actual timestamps, there is enough information to break out them by Precinct, District and Race, with the exception of the Central Absentee Precincts (CAP) entries where we can only break them out by district given the metadata alone. However, with some careful MATLAB magic I was able to cluster the results marked as just “CAP” into at least 5 different sub-groupings that are statistically distinct. (I used an exponential moving average to discover the boundaries between groupings, and looking at the crossover points in vote share.) I then relabeled the entries with the corresponding “CAP 1”, “CAP 2”, … , “CAP 5” labels as appropriate. My previous analysis was only broken out by Race ID and CAP/Non-CAP/Provisional category.
Processing in this manner makes the individual distributions look much cleaner, so I think this does confirm that there is not a true sequential ordering in the CVR files coming out of the vendor software packages. (If they would just give us the dang timestamps … this would be a lot easier!)
I have also added a bit more rigor to the statistics outlier detection by adding plots of the length of observed runs (e.g. how many “heads” did we get in a row?) as we move through the entries, as well as the plot of the probability of this number of consecutive tosses occurring. We compute this probability for K consecutive draws using the rules of statistical independence, which is P([a,a,a,a]) = P(a) x P(a) x P(a) x P(a) = P(a)^4. Therefore the probability of getting 4 “heads” in a row with a hypothetical 53/47 weighted coin would be .53^4 = 0.0789. There are also plotted lines for a probability 1/#Ballots for reference.
Results
The good news is that this method of slicing the data and assuming that the Vendor is simply concatenating USB drives seems to produce much tighter results that look to obey the expected IID distributions. Breaking up the data this way resulted in no plot breaking the +/- 3/sqrt(N-1) boundaries, but there still are a few interesting datapoints that we can observe.
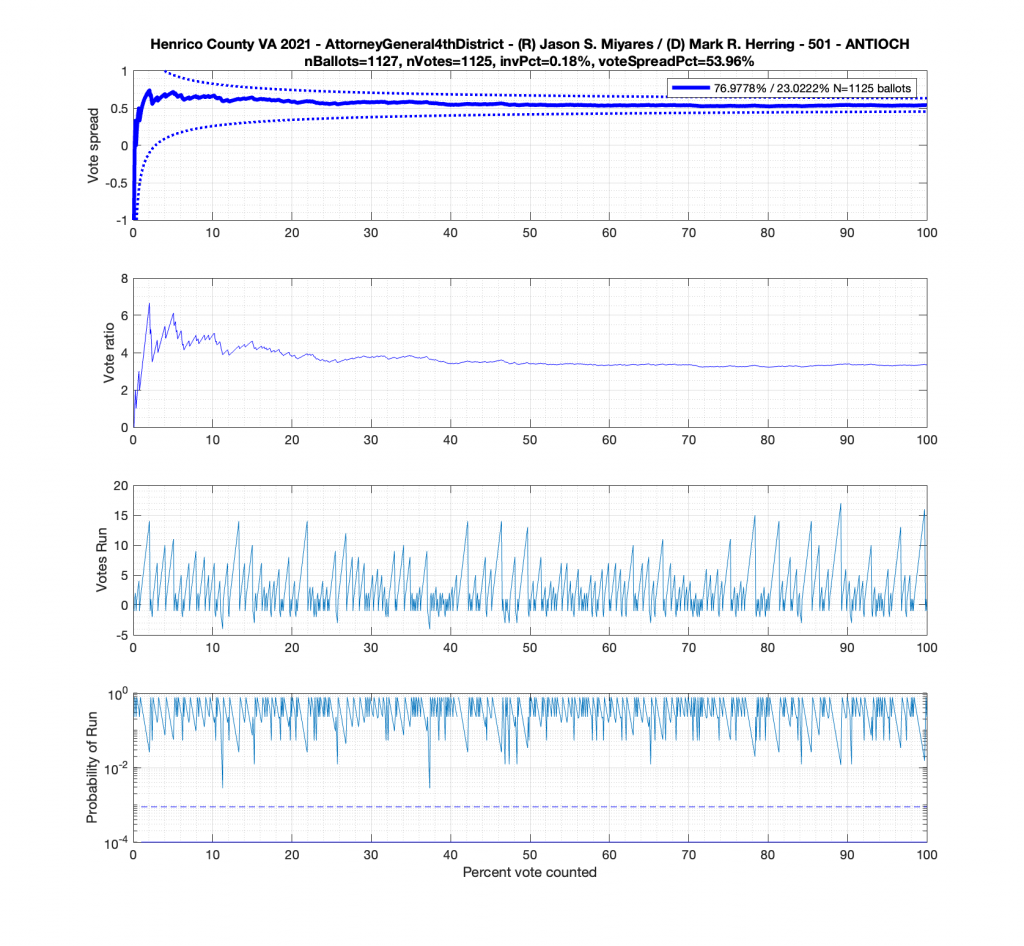
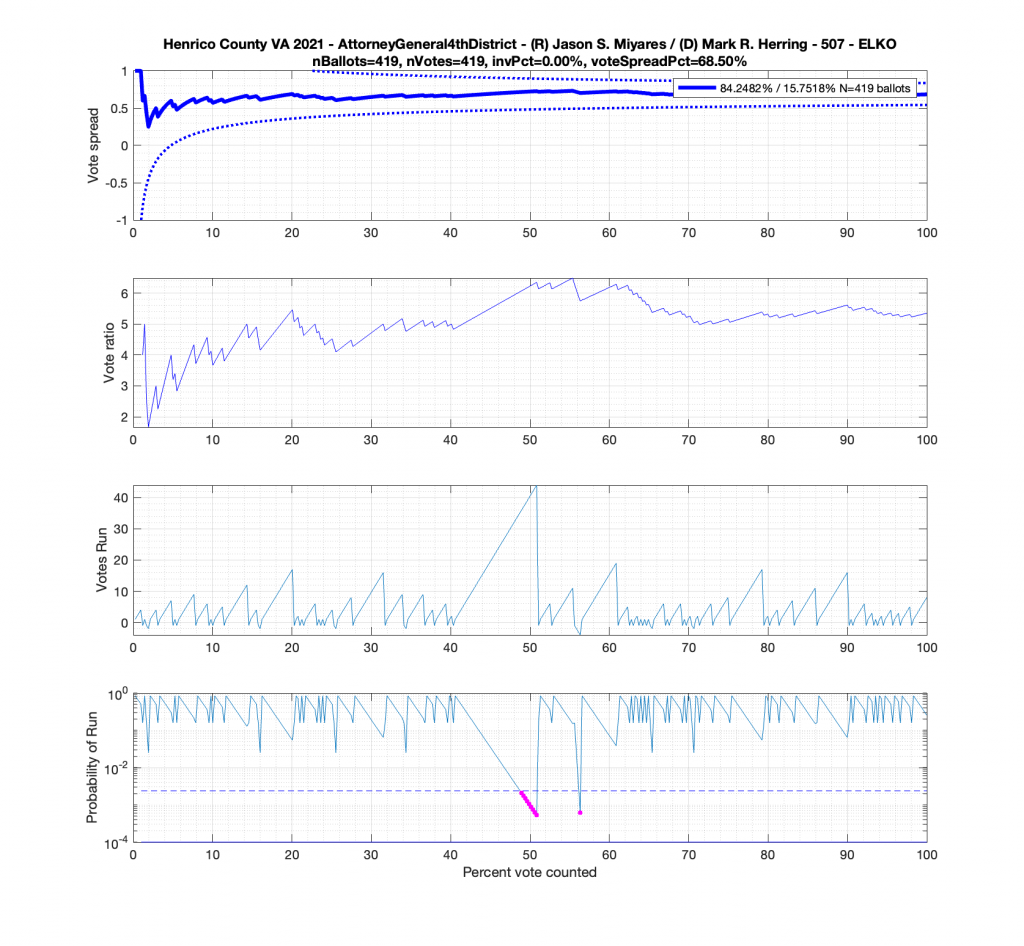
In the plot below we have the Attorney Generals race in the 4th district from precinct 501 – Antioch. This is a district that Miyares won handily 77%/23%. We see that the top plot of the cumulative spread is nicely bounded by the +/- 3/sqrt(N-1) lines. The second plot from the top gives the vote ratio in order to compare with the work that Draza Smith, Jeff O’Donnell and others are doing with CVR’s over at Ordros.com. The second from bottom plot gives the number k of consecutive ballots (in either candidates favor) that have been seen at each moment in the counting process. And the bottom plot raises either the 77% or 23% overall probability to the k-th power to determine the probability associated with pulling that many consecutive Miyares or Herring ballots from an IID distribution. The most consecutive ballots Miyares received in a row was just over 15, which had a .77^15 = 0.0198 or 1.98% chance of occurring. The most consecutive ballots Herring received was about 4, which equates to a probability of occurrence of .23^4 = 0.0028 or 0.28% chance. The dotted line on the bottom plot is referenced at 1/N, and the solid line is referenced at 0.01%.
But let’s now take a look at another plot for the Miyares contest in another blowout locality with 84% / 16% for Miyares. The +/- 3/sqrt(N-1) limit nicely bounds our ballot distribution again. There is, however, an interesting block of 44 consecutive ballots for Miyares about halfway through the processing of ballots. This equates to .84^44 = 0.0004659 or a 0.04659% chance of occurrence from an IID distribution. Close to this peak is a run of 4 ballots for Herring which doesn’t sound like much, but given the 84% / 16% split, the probability of occurrence for that small run is .16^4 = 0.0006554 or 0.06554%!
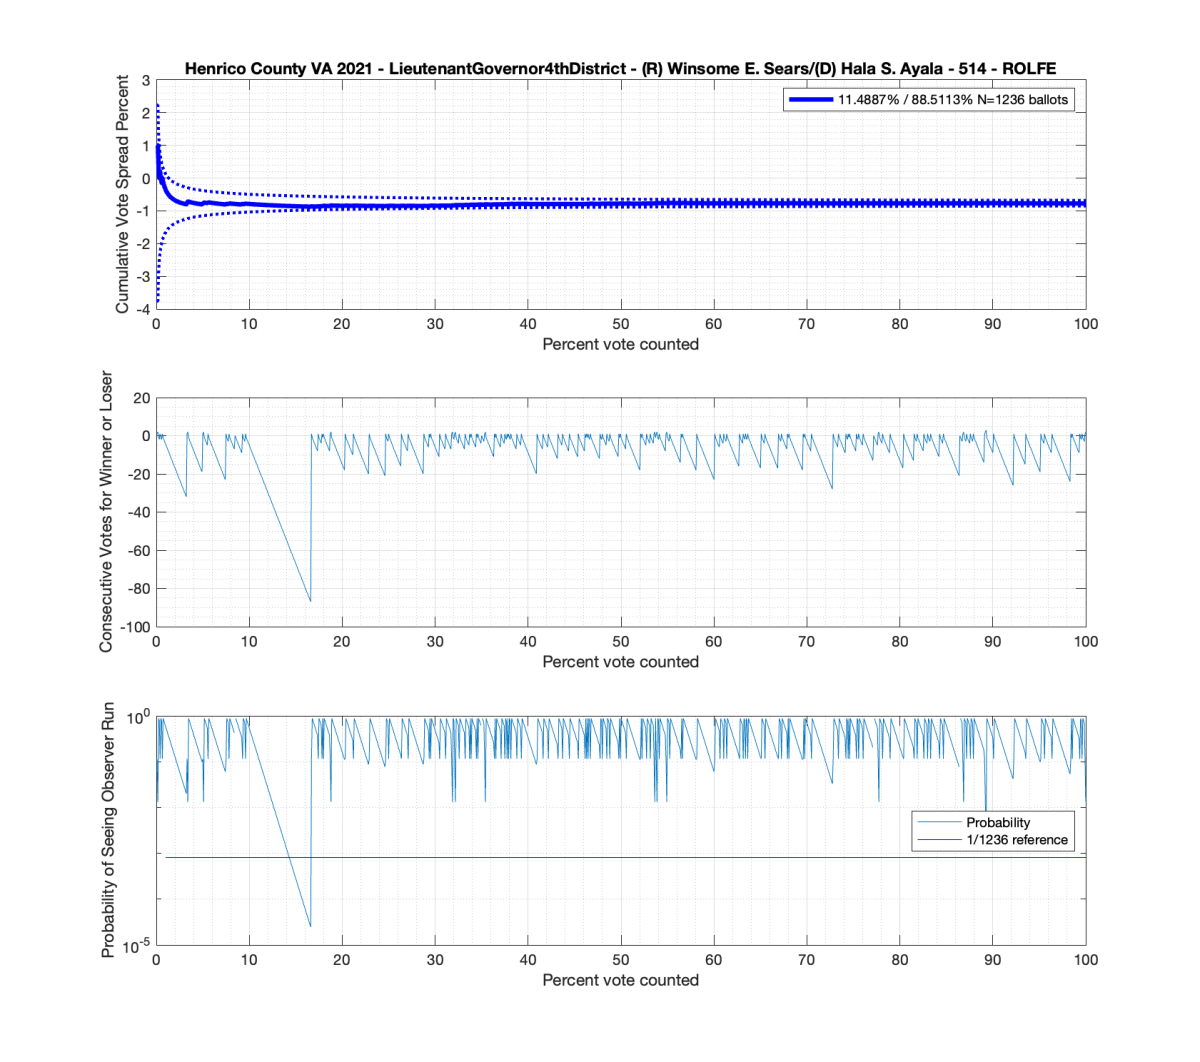
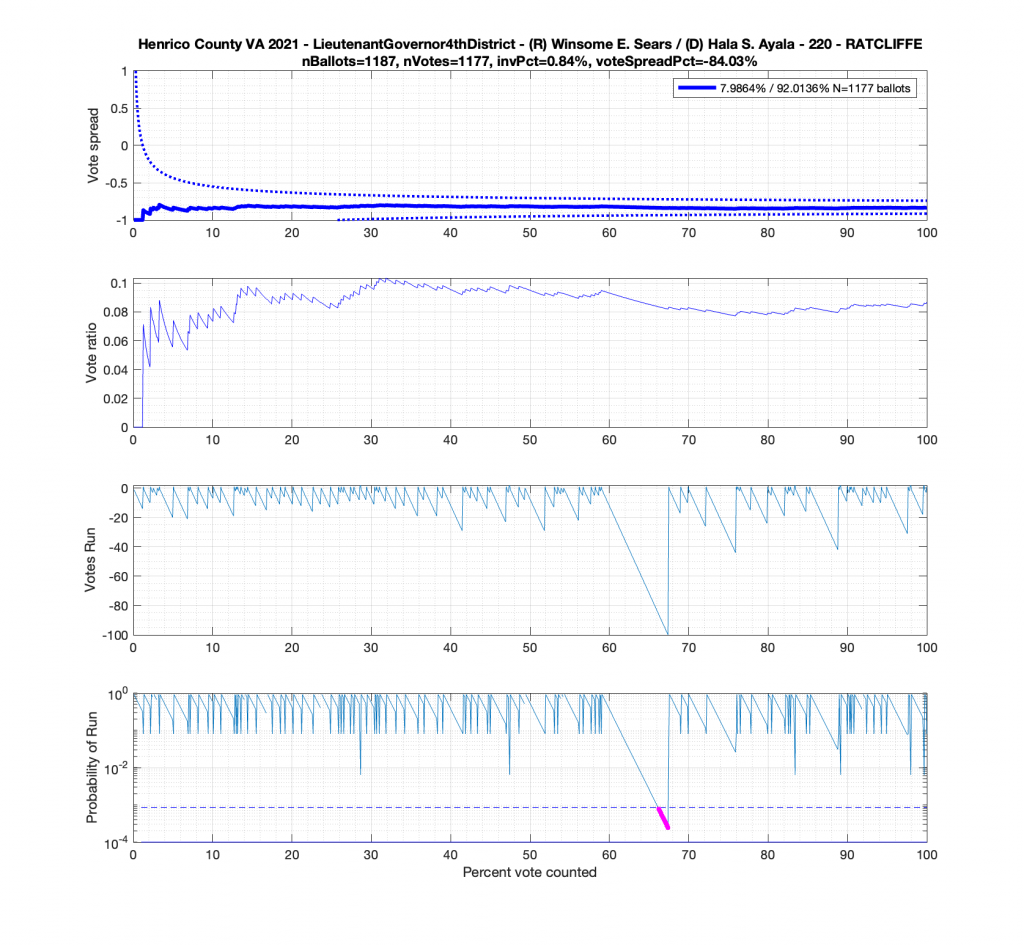
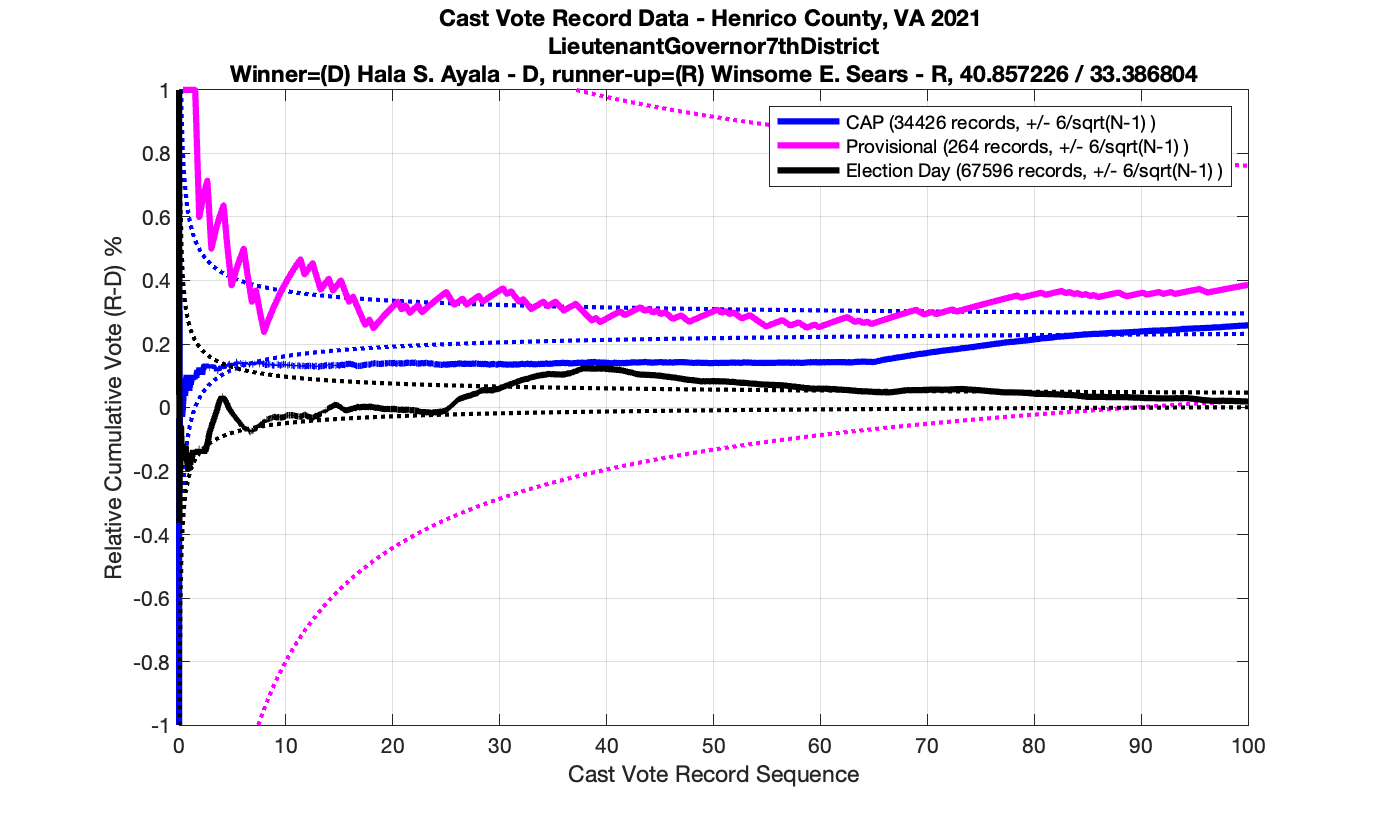
Moving to the Lt. Governors race we see an interesting phenomenon where where Ayala received a sudden 100 consecutive votes a little over midway through the counting process. Now granted, this was a landslide district for Ayala, but this still equates to a .92^100 = 0.000239 or 0.0239% chance of occurrence.
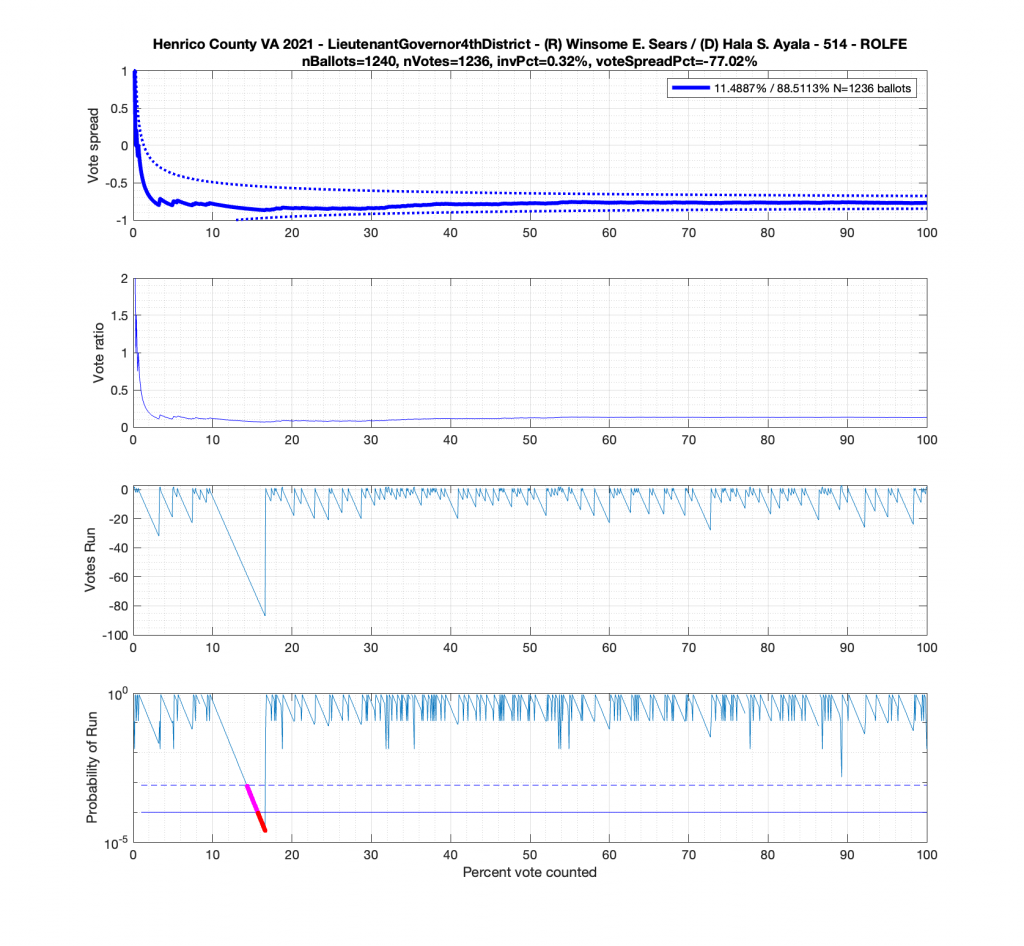
And here’s another large block of contiguous Ayala ballots equating to about .89^84 = 0.00005607 or 0.0056% chance of occurrence.
Tests for Differential Invalidation (added 2022-09-19):
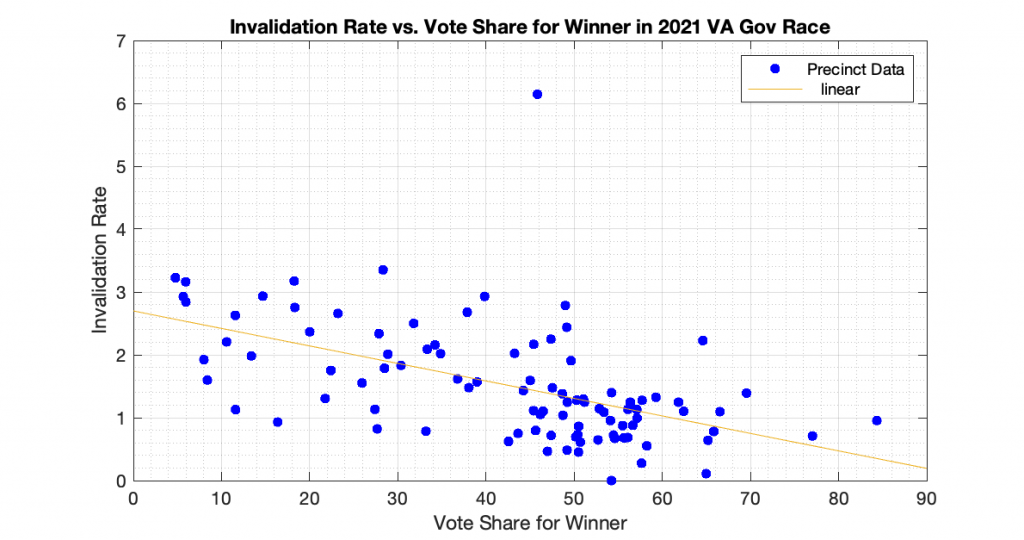
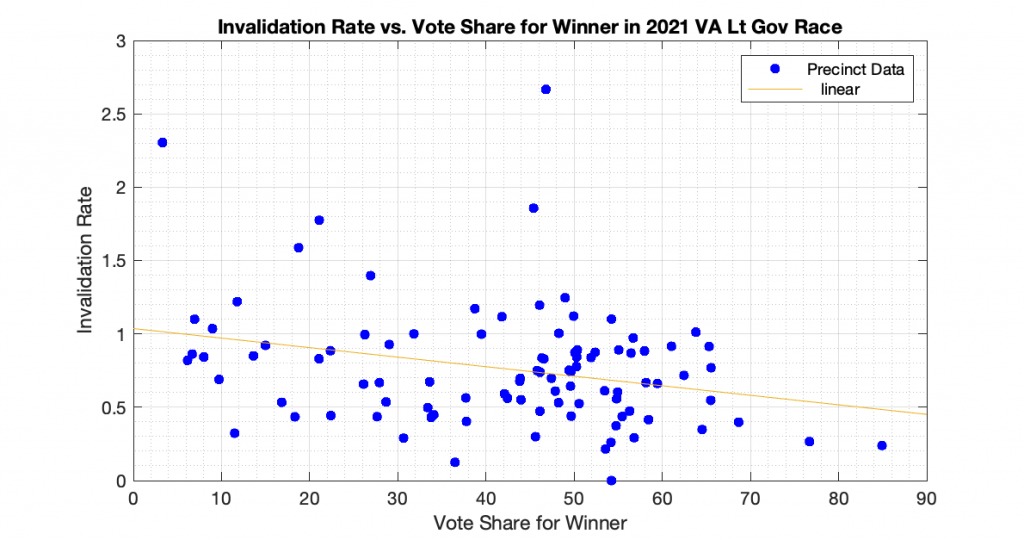
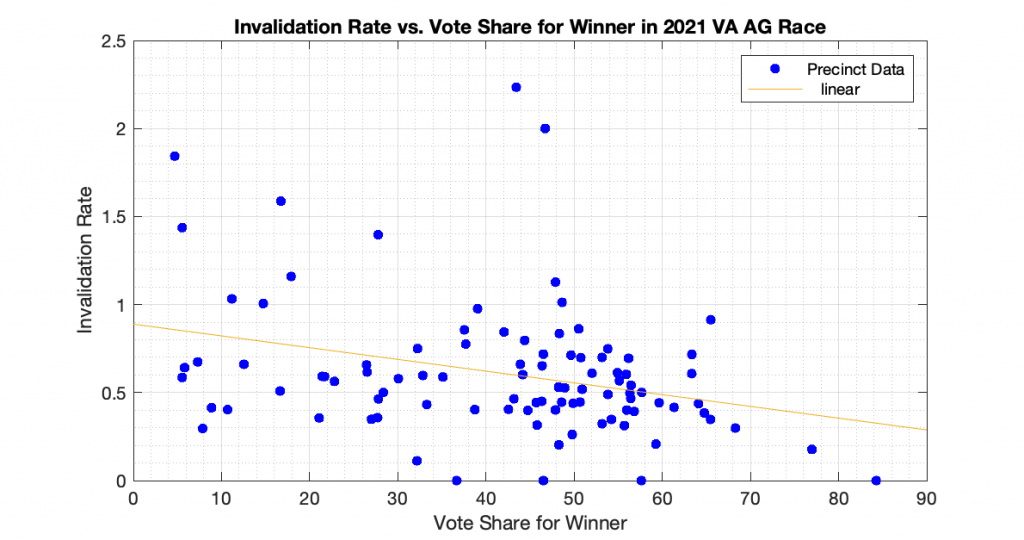
“Differential invalidation” takes place when the ballots of one candidate or position are invalidated at a higher rate than for other candidates or positions. With this dataset we know how many ballots were cast, and how many ballots had incomplete or invalid results (no recorded vote in the cvr, but the ballot record exists) for the 3 statewide races. In accordance with the techniques presented in [1] and [2], I computed the plots of the Invalidation Rate vs the Percent Vote Share for the Winner in an attempt to observe if there looks to be any evidence of Differential Invalidation ([1], ch 6). This is similar to the techniques presented in [2], which I used previously to produce my election fingerprint plots and analysis that plotted the 2D histograms of the vote share for the winner vs the turnout percentage.
The generated the invalidation rate plots for the Gov, Lt Gov and AG races statewide in VA 2021 are below. Each plot below is representing one of the statewide races, and each dot is representing the ballots from a specific precinct. The x axis is the percent vote share for the winner, and the y axis is computed as 100 – 100 * Nvotes / Nballots. All three show a small but statistically significant linear trend and evidence of differential invalidation. The linear regression trendlines have been computed and superimposed on the data points in each graph.
To echo the warning from [1]: a differential invalidation rate does not directly indicate any sort of fraud. It indicates an unfairness or inequality in the rate of incomplete or invalid ballots conditioned on candidate choice. While it could be caused by fraud, it could also be caused by confusing ballot layout, or socio-economic issues, etc.
[1] Forsberg, O.J. (2020). Understanding Elections through Statistics: Polling, Prediction, and Testing (1st ed.). Chapman and Hall/CRC. https://doi.org/10.1201/9781003019695
[2] Klimek, Peter & Yegorov, Yuri & Hanel, Rudolf & Thurner, Stefan. (2012). Statistical Detection of Systematic Election Irregularities. Proceedings of the National Academy of Sciences of the United States of America. 109. 16469-73. https://doi.org/10.1073/pnas.1210722109.
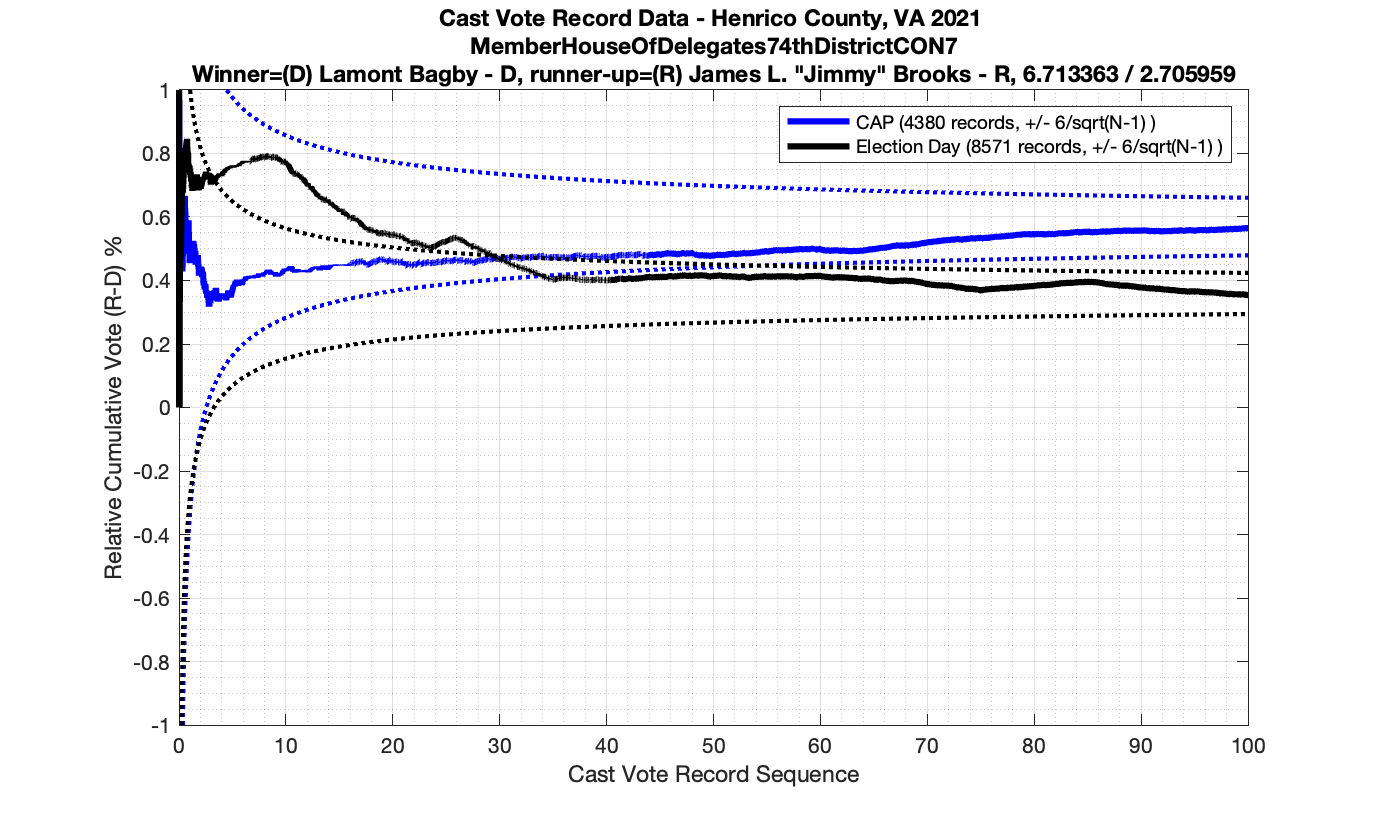
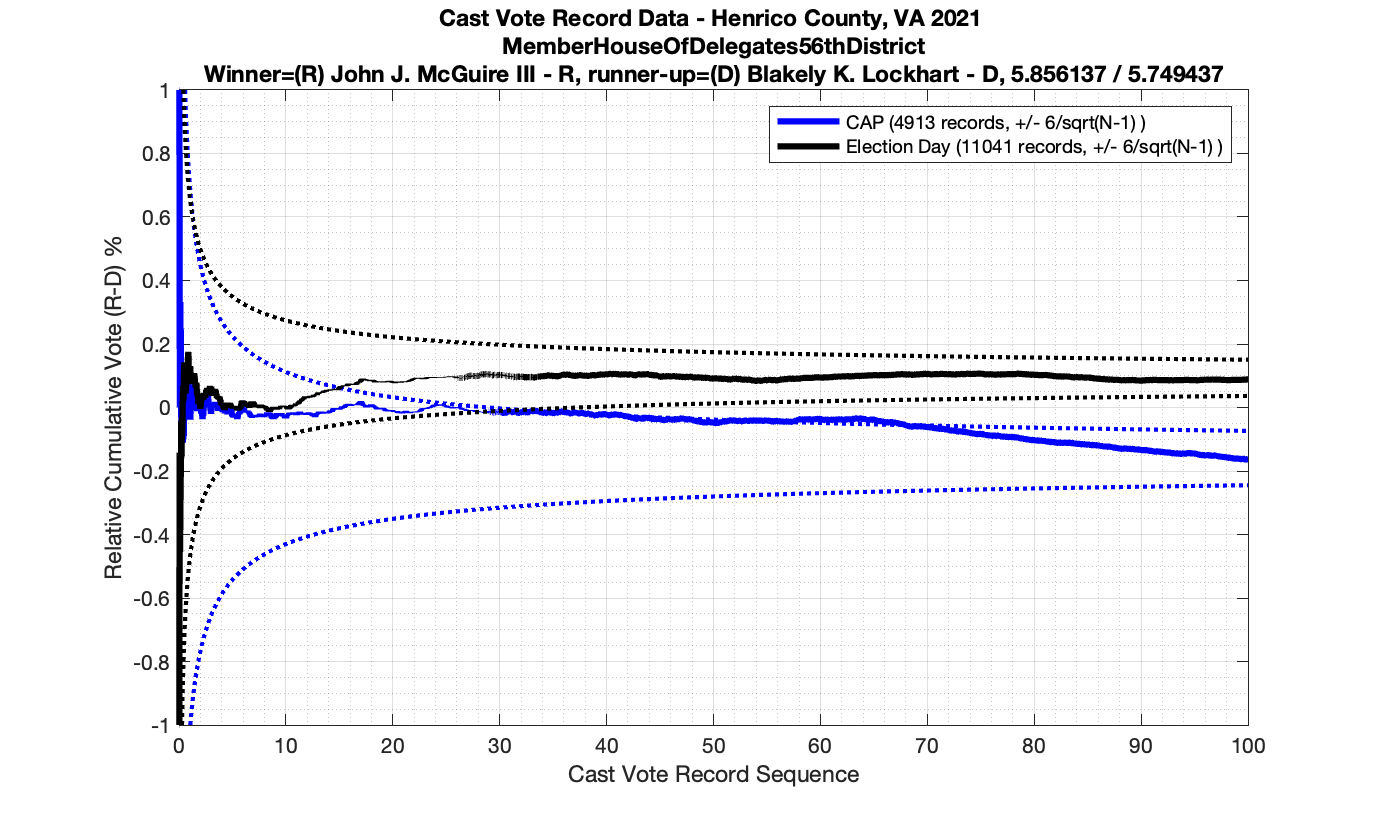
Update 2022-08-29 per observations by members of the Texas team I am working with, we’ve been able to figure out that (a) the vendor was simply concatenating data records from each machine and not sorting the CVR results and (b) how to mostly unwrap this affect on the data to produce much cleaner results. The results below are left up for historical reference.
For background information, please see my introduction to Cast Vote Records processing and theory here: Statistical Detection of Irregularities via Cast Vote Records. This entry will be specifically documenting the results from processing the Henrico County Virginia CVR data from the 2021 election.
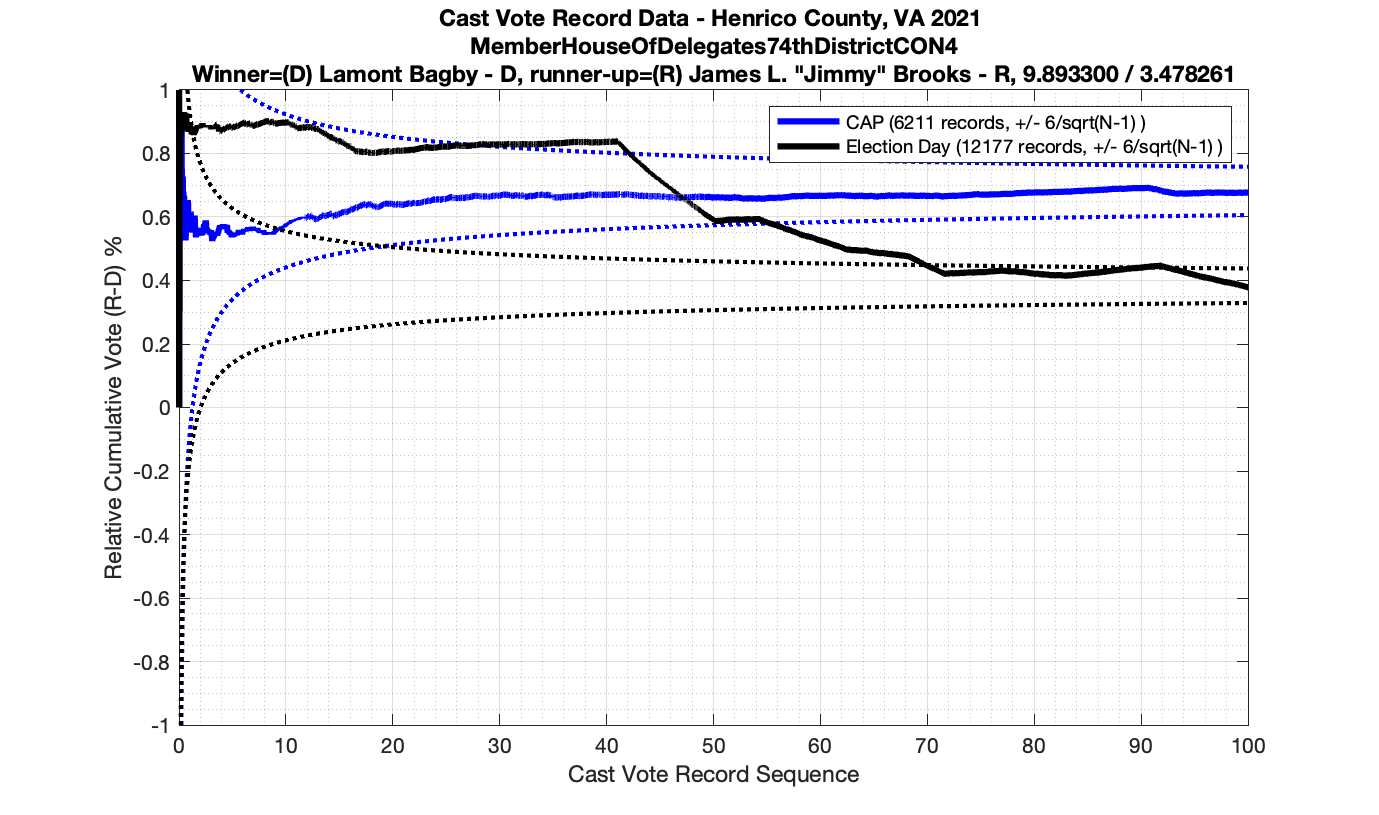
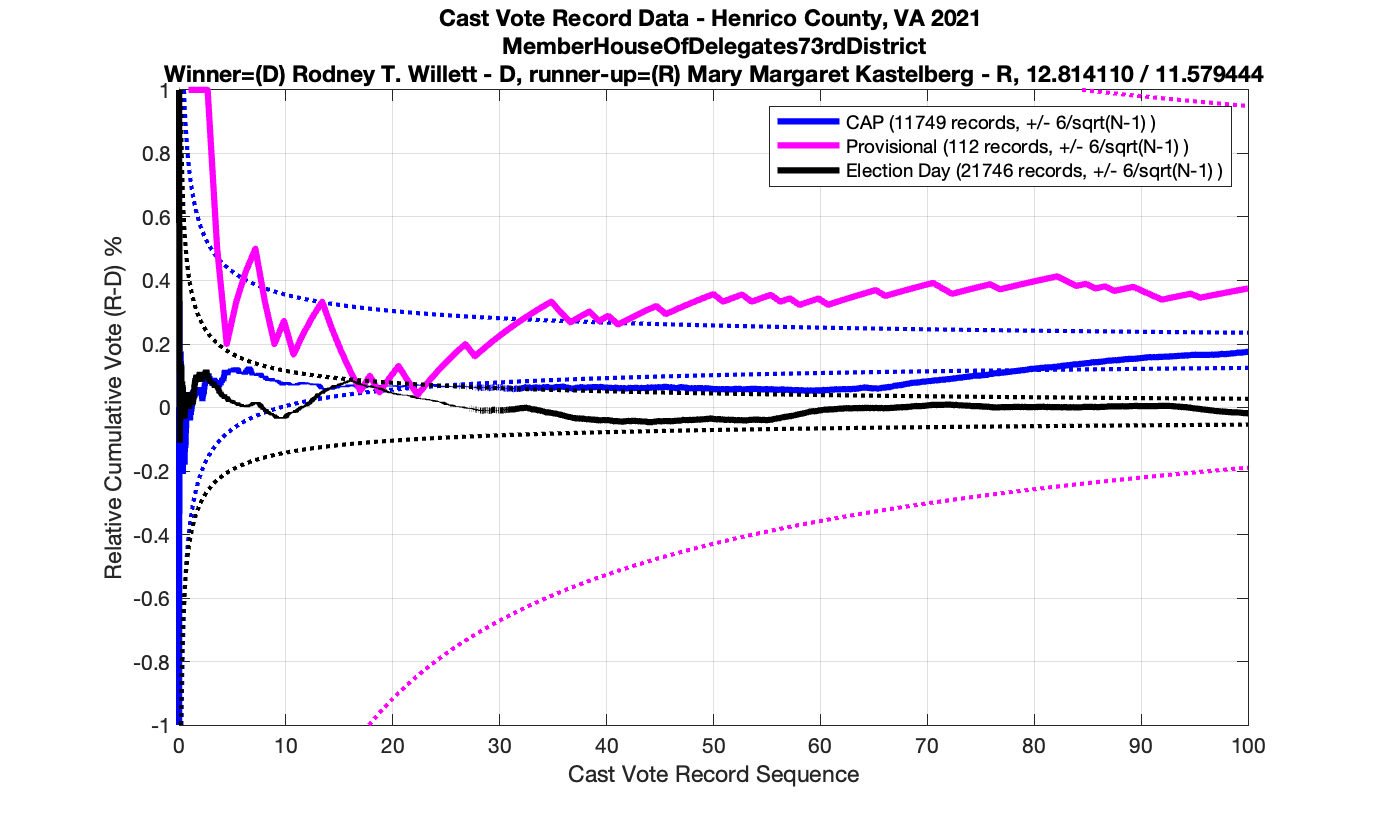
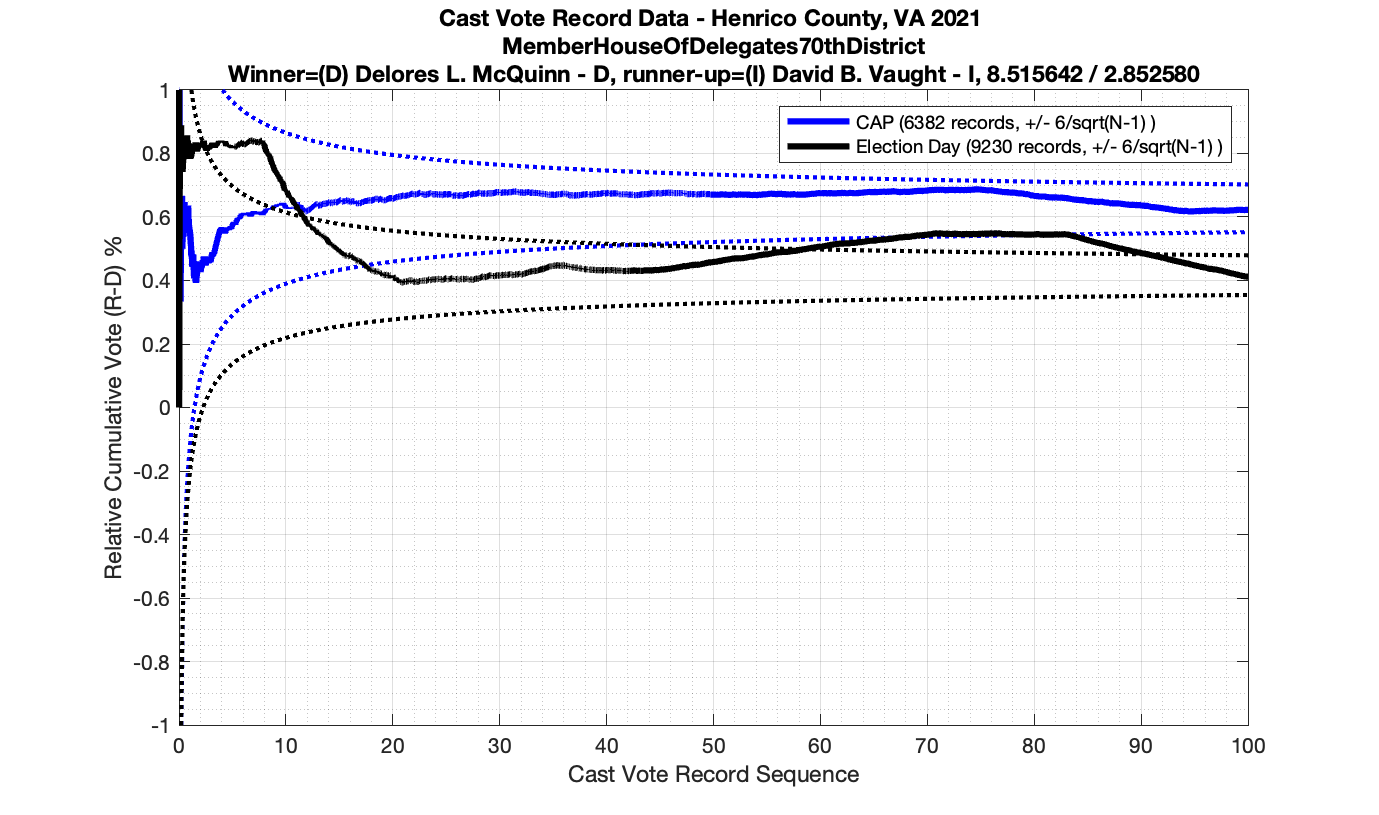
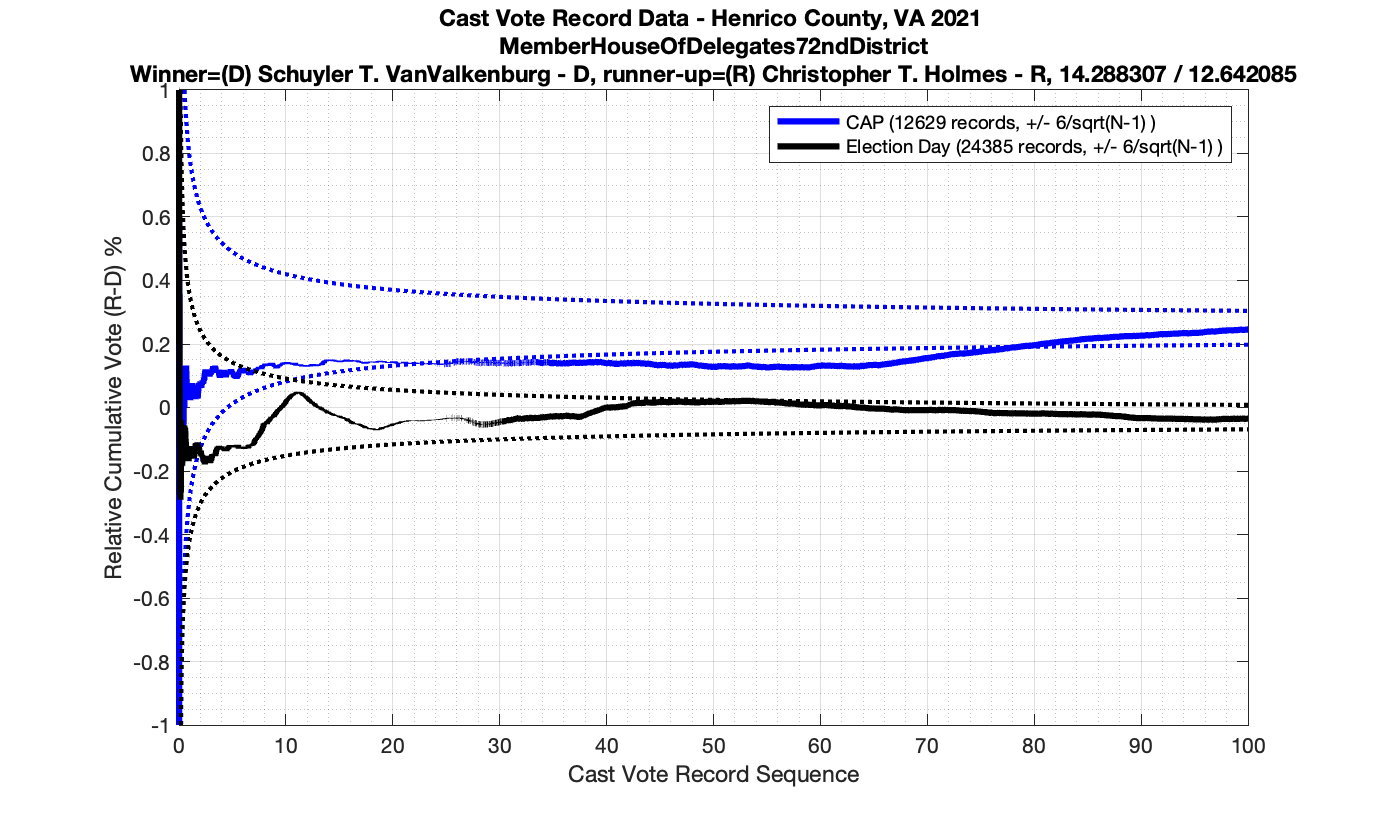
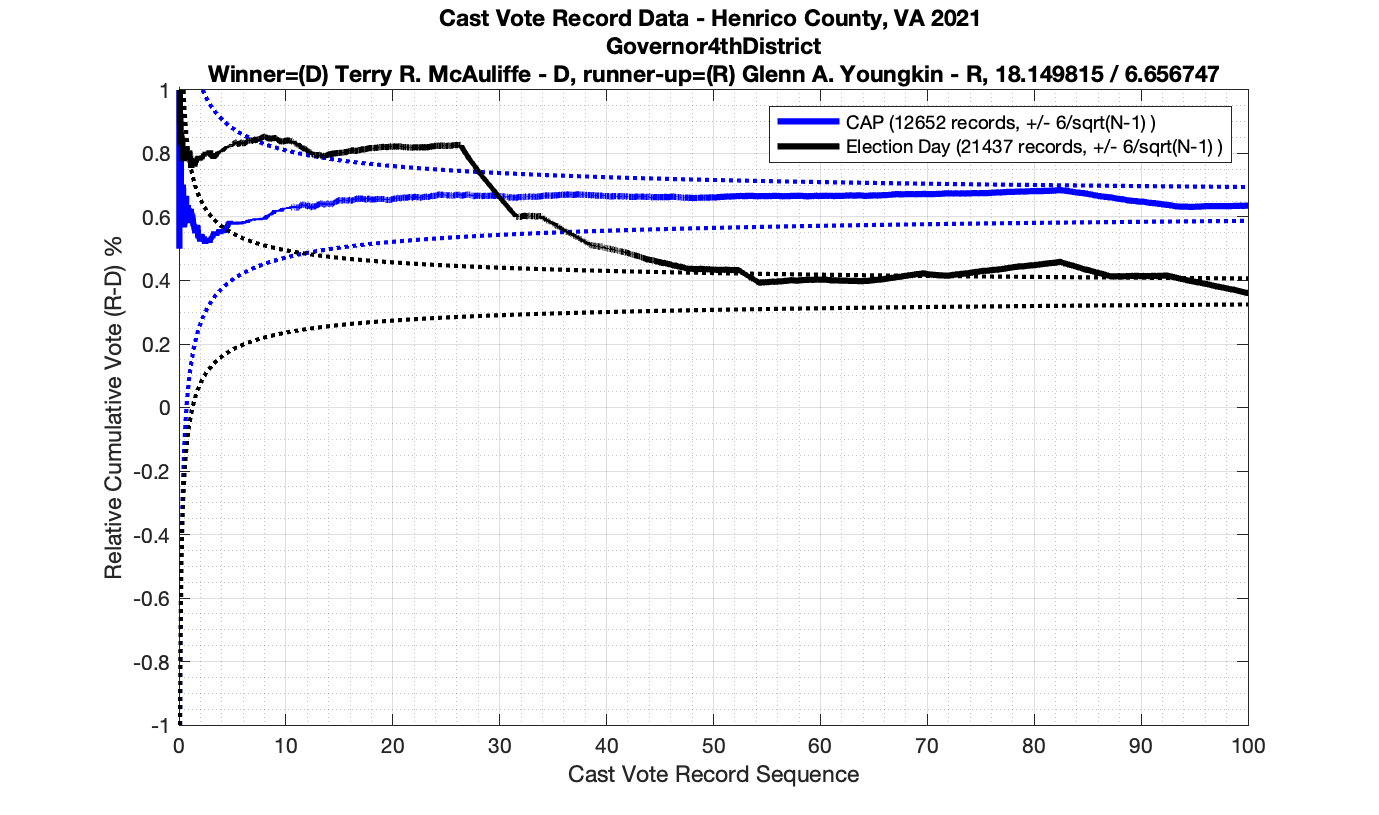
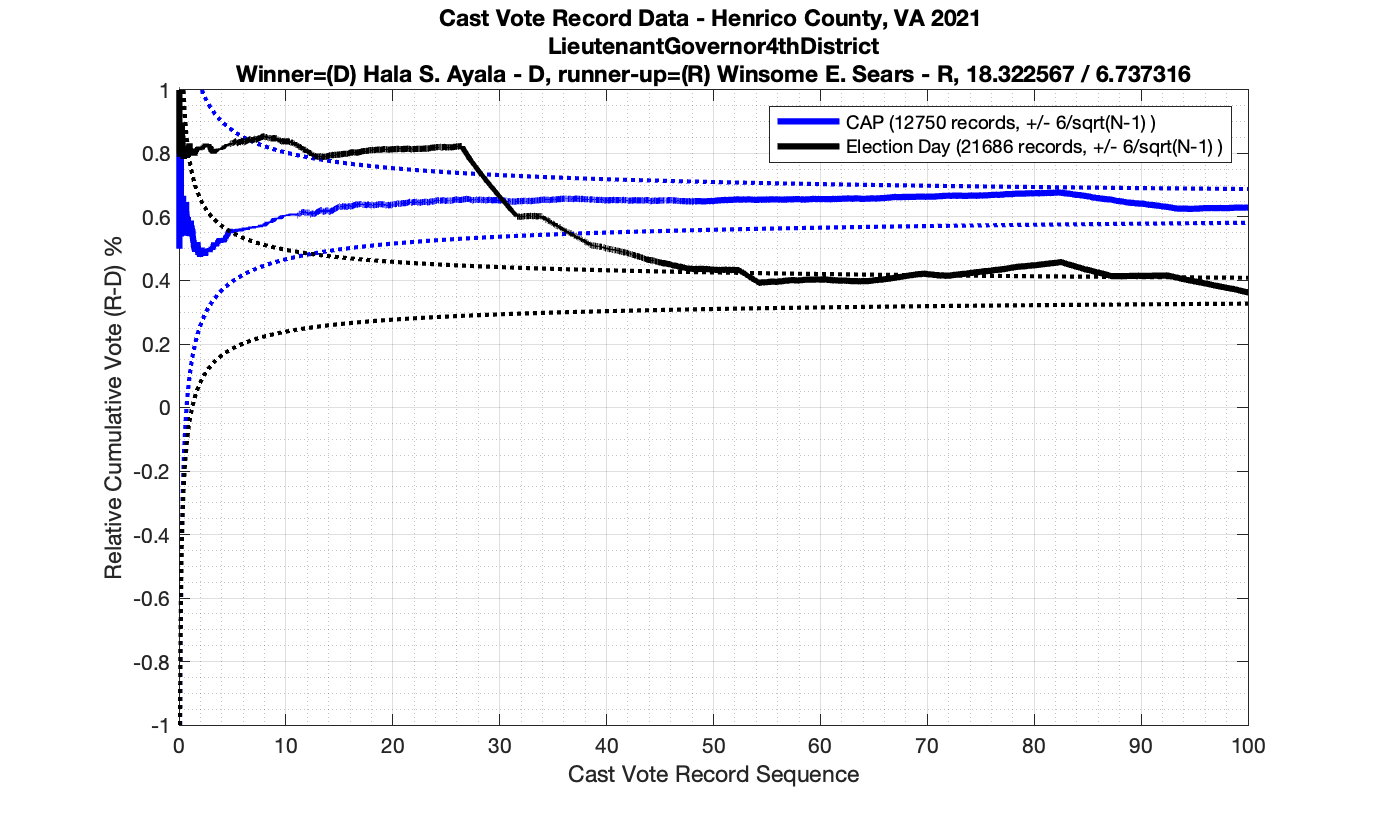
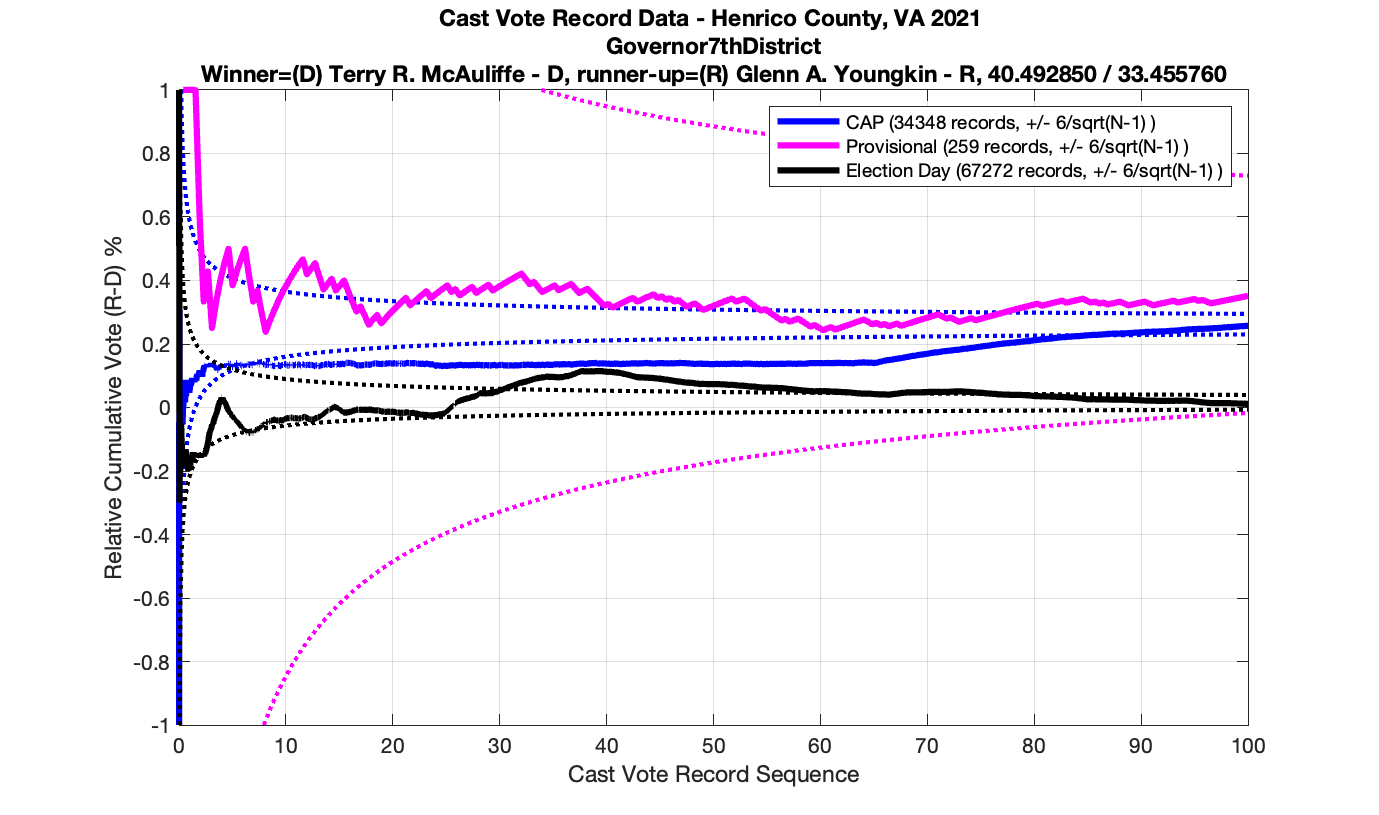
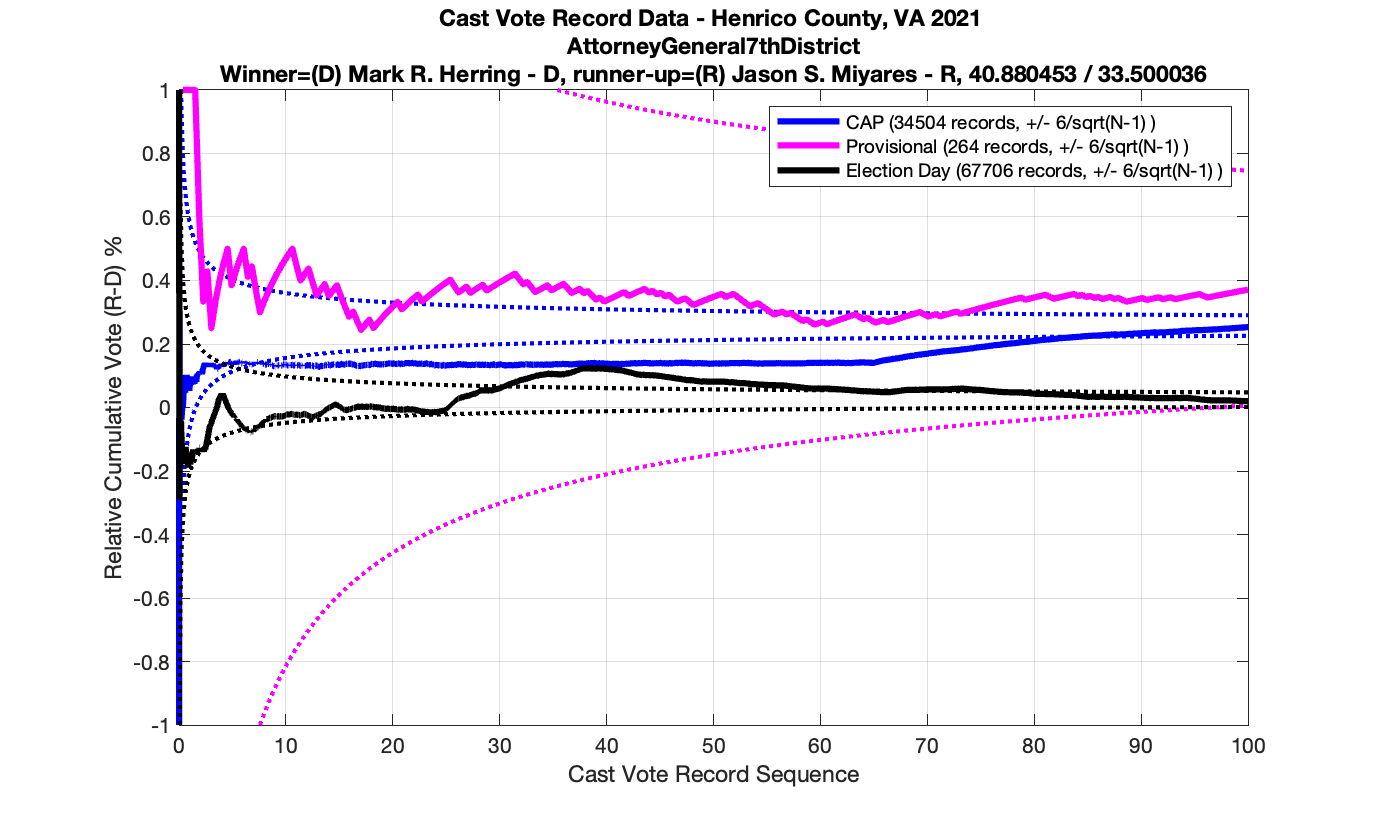
As in the results from the previous post, I expanded the theoretical error bounds out to 6/sqrt(N) instead of 3/sqrt(N) in order to give a little bit of extra “wiggle room” for small fluctuations.
However the Henrico dataset could only be broken up by CAP, Non-CAP or Provisional. So be aware that the CAP curves presented below contain a combination of both early-vote and mail-in ballots.
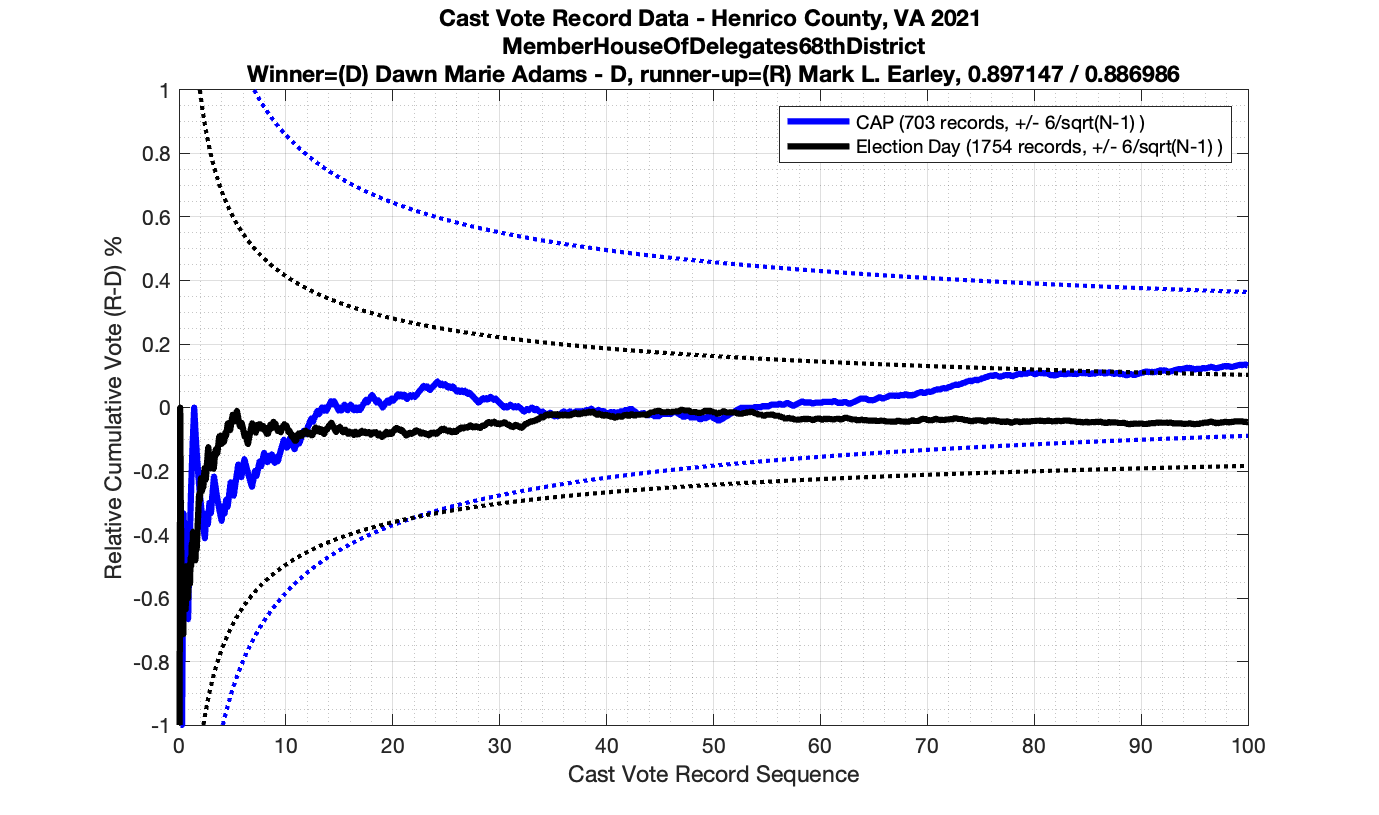
The good news is that I’ve at least found one race that seems to not have any issues with the CVR curves staying inside the error boundaries. MemberHouseOfDelegates68thDistrict did not have any parts of the curves that broke through the error boundaries.
The bad news … is pretty much everything else doesn’t. I cannot tell you why these curves have such differences from statistical expectation, just that they do. We must have further investigation and analysis of these races to determine root cause. I’ve presented all of the races that had sufficient number of ballots below (1000 minimum for the race a whole, and 100 ballot minimum for each ballot type).
There has been a good amount of commotion regarding cast vote records (CVRs) and their importance lately. I wanted to take a minute and try and help explain why these records are so important, and how they provide a tool for statistical inspection of election data. I also want to try and dispel any misconceptions as to what they can or can’t tell us.
I have been working with other local Virginians to try and get access to complete CVRs for about 6 months (at least) in order to do this type of analysis. However, we had not had much luck in obtaining real data (although we did get a partial set from PWC primaries but it lacked the time-sequencing information) to evaluate until after Jeff O’Donnell (a.k.a. the Lone Raccoon) and Walter Dougherity did a fantastic presentation at the Mike Lindell Moment of Truth Summit on CVRs and their statistical use. That presentation seems to have broken the data logjam, and was the impetus for writing this post.
Just like the Election Fingerprint analysis I was doing earlier that highlighted statistical anomalies in election data, this CVR analysis is a statistics based technique that can help inform us as to whether or not the election data appears consistent with expectations. It only uses the official results as provided by state or local election authorities and relies on standard statistical principles and properties. Nothing more. Nothing less.
What is a cast vote record?
A cast vote record is part of the official election records that need to be maintained in order for election systems to be auditable. (see: 52 USC 21081 , NIST CVR Standard, as well as the Virginia Voting Systems Certification Standards) They can have many different formats depending on equipment vendor, but they are effectively a record of each ballot as it was recorded by the equipment. Each row in a CVR data table should represent a single ballot being cast by a voter and contain, at minimum, the time (or sequence number) when the ballot was cast, the ballot type, and the result of each race. Other data might also be included such as which precinct and machine performed the scanning/recording of the ballot, etc. Note that “cast vote records” are sometimes also called “cast voter records”, “ballot reports” or a number of other different names depending on the publication or locality. I will continue to use the “cast vote record” language in this document for consistency.
Why should we care?
The reason these records are so important, is based on statistics and … unfortunately … involves some math to fully describe. But to make this easier, let’s try first to walk through a simple thought experiment. Let’s pretend that we have a weighted, or “trick” coin, that when flipped it will land heads 53% of the time and land tails 47% of the time. We’re going to continuously flip this coin thousands of times in a row and record our results. While we can’t predict exactly which way the coin will land on any given toss, we can expect that, on average, the coin will land with the aforementioned 53/47 split.
Now because each coin toss constitutes an independent and identically distributed (IID) probability function, we can expect this sequence to obey certain properties. If as we are making our tosses, we are computing the “real-time” statistics of the percentage of head/tails results, and more specifically if we plot the spread (or difference) of those percentage results as we proceed we will see that the spread has very large swings as we first begin to toss our coin, but very quickly the variability in the spread becomes stable as more and more tosses (data) are available for us to average over. Mathematically, the boundary on these swings is inversely proportional to the square root of how many tosses are performed. In the “Moment of Truth” video on CVRs linked above, Jeff and Walter refer to this as a “Cone of Probability”, and he generates his boundary curves experimentally. He is correct. It is a cone of probability as its really just a manifestation of well-known and well-understood Poisson Noise characteristic (for the math nerds reading this). In Jeff’s work he uses the ratio of votes between candidates, while I’m using the spread (or deviation) of the vote percentages. Both metrics are valid, but using the deviation has an easy closed-form boundary curve that we don’t need to generate experimentally.
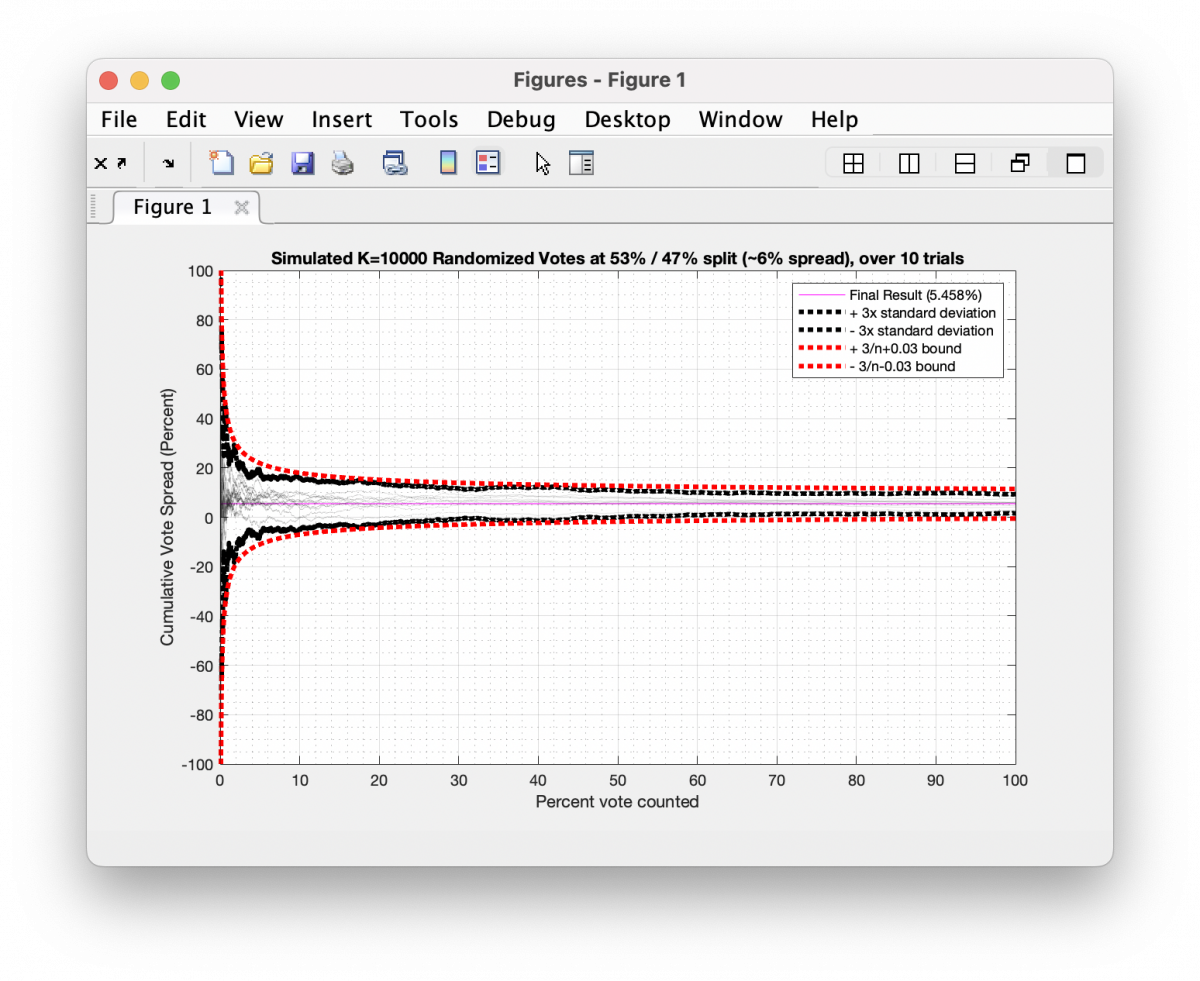
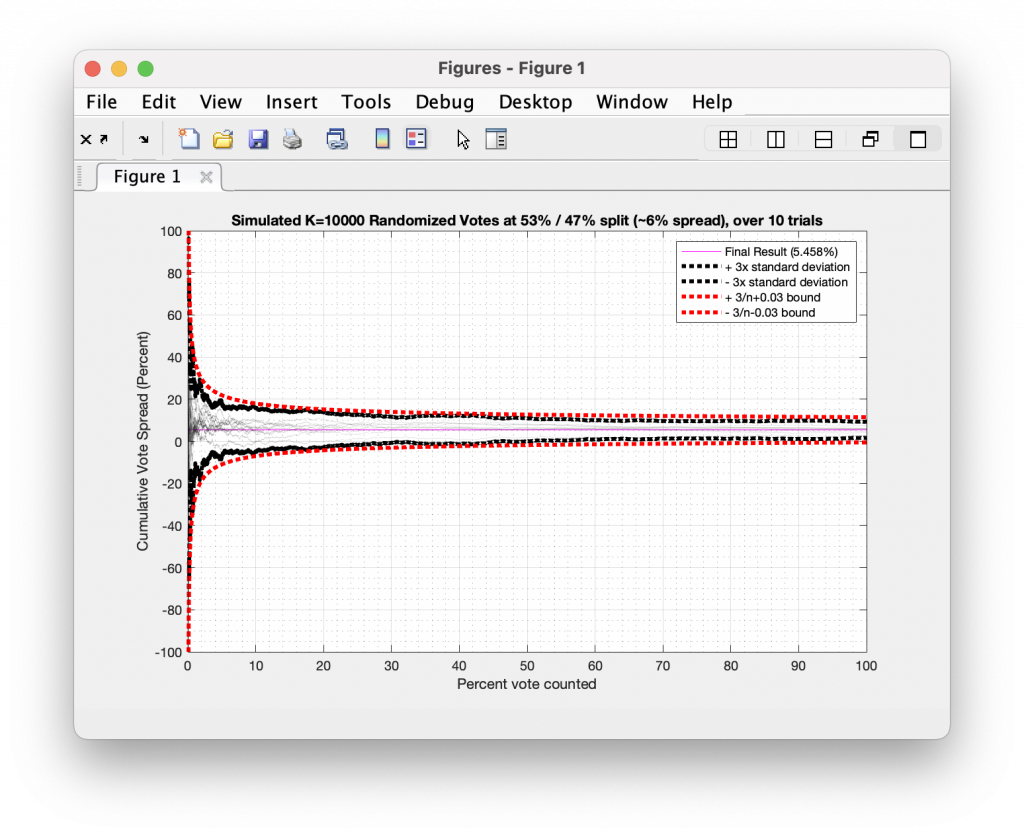
In the graphic below I have simulated 10 different trials of 10,000 tosses for a distribution that leans 53/47, which is equivalent to a 6% spread overall. Each trial had 10,000 random samples generated as either +1 or -1 values (a.k.a. a binary “Yes” or “No” vote) approximating the 53/47 split and I plotted the cumulative running spread of the results as each toss gets accumulated. The black dotted outline is the 95% confidence interval (or +/-3x the standard deviation) across the 10 trials for the Nth bin, and the red dotted outline is the 3/sqrt(n-1) analytical boundary.
So how does this apply to election data?
In a theoretically free and perfectly fair election we should see similar statistical behavior, where each coin toss is replaced with a ballot from an individual voter. In a perfect world we would have each vote be completely independent of every other vote in the sequence. In reality we have to deal with the fact that there can be small local regions of time in which perfectly legitimate correlations in the sequence of scanned ballots exist. Think of a local church who’s congregation is very uniform and they all go to the polls after Sunday mass. We would see a small trend in the data corresponding to this mass of similar thinking peoples going to the polls at the same time. But we wouldn’t expect there to be large, systematic patterns, or sharp discontinuities in the plotted results. A little bit of drift and variation is to be expected in dealing with real world election data, but persistent and distinct patterns would indicate a systemic issue.
Now we cannot isolate all of the variables in a real life example, but we should try as best as possible. To that effect, we should not mix different ballot types that are cast in different manners. We should keep our analysis focused within each sub-group of ballot type (mail-in, early-vote, day-of, etc). It is to the benefit of this analysis that the very nature of voting, and the procedures by which it occurs, is a very randomized process. Each sub-grouping has its own quasi-random process that we can consider.
While small groups (families, church groups) might travel to the in-person polls in correlated clusters, we would expect there to be fairly decent randomization of who shows up to in-person polls and when. The ordering of who stands in line before or after one another, how fast they check-in and fill out their ballot, etc, are all quasi-random processes.
Mail-in ballots have their own randomization as they depend on the timing of when individuals request, fill-out and mail their responses, as well as the logistics and mechanics of the postal service processes themselves providing a level of randomization as to the sequence of ballots being recorded. Like a dealer shuffling a deck of cards, the process of casting a mail-in vote provides an additional level of independence between samples.
No method is going to supply perfect theoretical independence from ballot to ballot in the sequence, but theres a general expectation that voting should at least be similar to an IID process.
Also … and I cannot stress this enough … while these techniques can supply indications of irregularities and discrepancies in elections data, they are not conclusive and must be coupled with in-depth investigations.
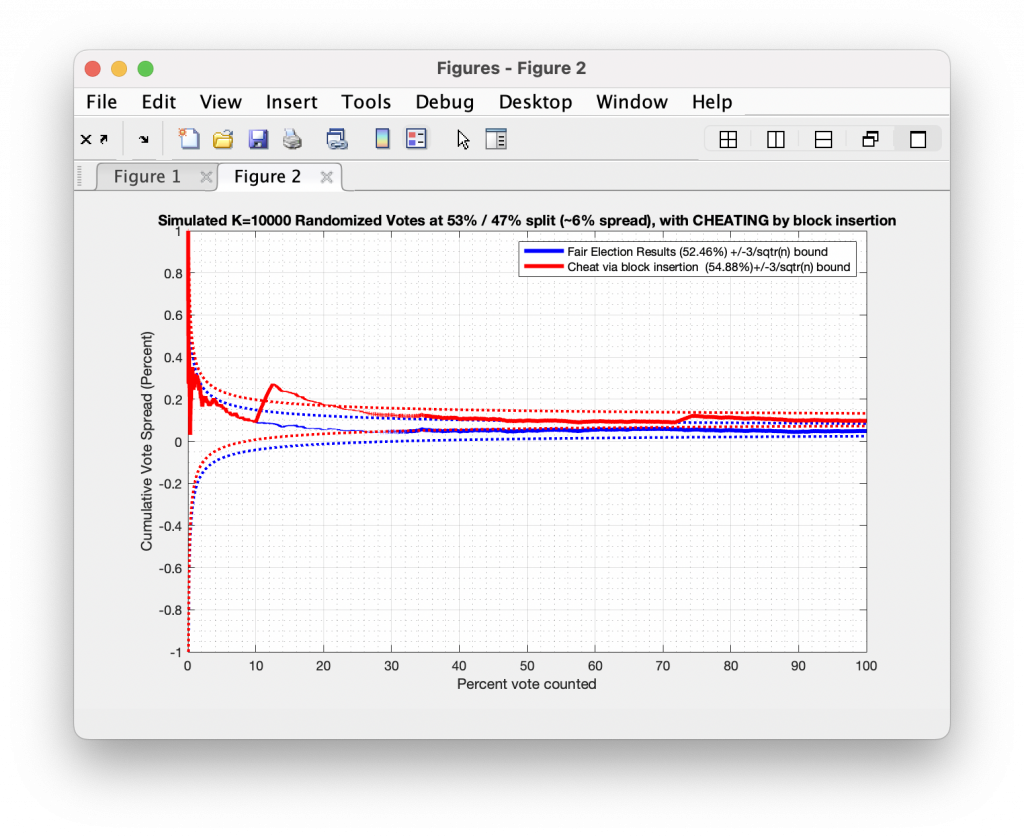
So going back to the simulation we generated above … what does a simulation look like when cheating occurs? Let’s take a very simple cheat from a random “elections” of 10,000 ballots, with votes being representative of either +1 (or “Yes”) or -1 (or “No”) as we did above. But lets also cheat by randomly selecting two different spots in the data stream to place blocks of 250 consecutive “Yes” results.
The image below shows the result of this process. The blue curve represents the true result, while the red curve represents the cheat. We see that at about 15% and 75% of the vote counted, our algorithm injected a block of “Yes” results, and the resulting cumulative curve breaks through the 3/sqrt(N-1) boundary. Now, not every instance or type of cheat will break through this boundary, and there may be real events that might explain such behavior. But looking for CVR curves that break our statistical expectations is a good way to flag items that need further investigation.
Computing the probability of a ballot run:
Section added on 2022-09-18
We can also a bit more rigor to the statistics outlier detection by computing the probability of the length of observed runs (e.g. how many “heads” did we get in a row?) occurring as we move through the sequential entries. We can compute this probability for K consecutive draws using the rules of statistical independence, which is P([a,a,a,a]) = P(a) x P(a) x P(a) x P(a) = P(a)^4. Therefore the probability of getting 4 “heads” in a row with a hypothetical 53/47 weighted coin would be .53^4 = 0.0789.
Starting with my updated analysis of 2021 Henrico County VA, I’ve started adding this computation to my plots. I have not yet re-run the Texas data below with this new addition, but will do so soon and update this page accordingly.
Real Examples
UPDATE 2022-09-18:
I have finally gotten my hands on some data for 2020 in VA. I will be working to analyze that data and will report what I find as soon as I can, but as we are approaching the start of early voting for 2022, my hands are pretty full at the moment so it might take me some time to complete that processing.
As noted in my updates to the Henrico County 2021 VA data, and in my section on computing the probability of given runs above, the Texas team noticed that we could further break apart the Travis county data into subgroups by USB stick. I will update my results below as soon as I get the time to do so.
So I haven’t gotten complete cast vote records from VA yet (… which is a whole other set of issues …), but I have gotten my Cheeto stained fingers on some data from the Travis County Texas 2020 race.
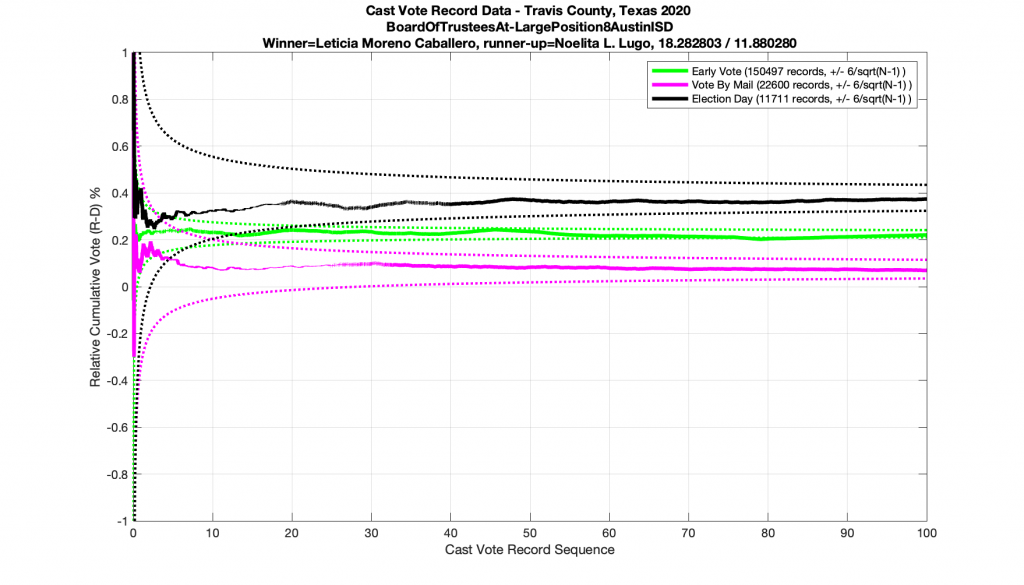
So let us first take a look at an example of a real race where everything seems to be obeying the rules as set out above. I’ve doubled my error bars from 3x to 6x of the inverse square standard (discussed above) in order to handle the quasi-IID nature of the data and give some extra margin for small fluctuating correlations.
The plot below shows the Travis County Texas 2020 BoardOfTrusteesAt_LargePosition8AustinISD race, as processed by the tabulation system and stratified by ballot type. We can see that all three ballot types start off with large variances in the computed result but very quickly coalesce and approach their final values. This is exactly what we would expect to see.
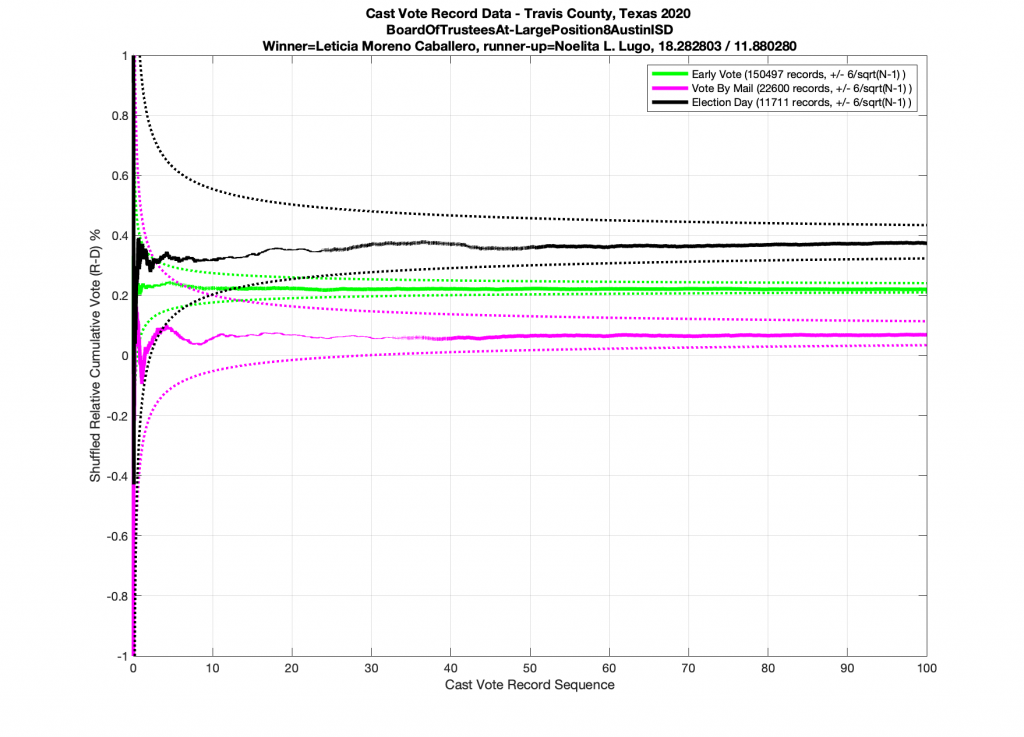
Now if I randomly shuffle the ordering of the ballots in this dataset and replot the results (below) I get a plot that looks unsurprisingly similar, which suggests that these election results were likely produced by a quasi-IID process.
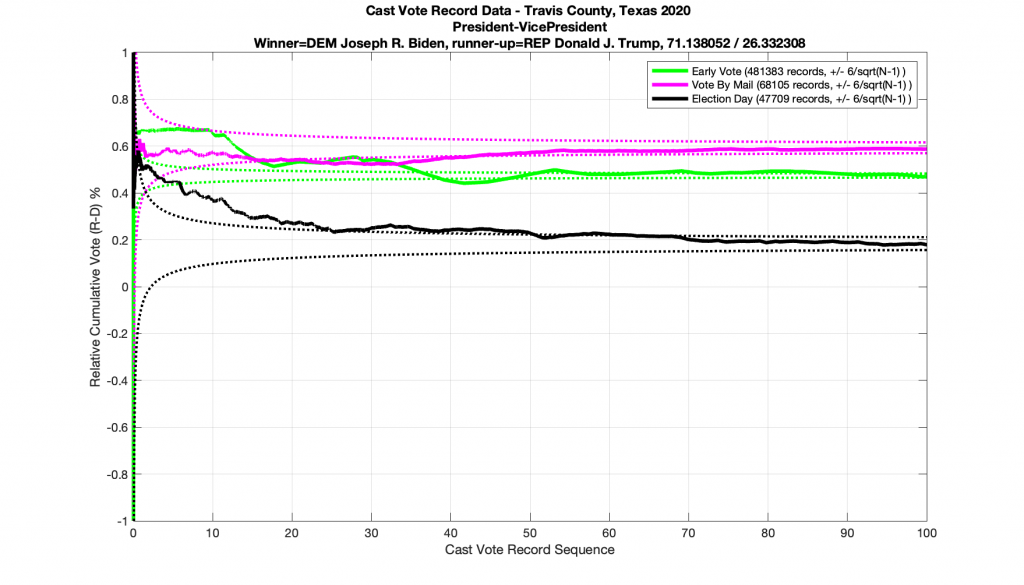
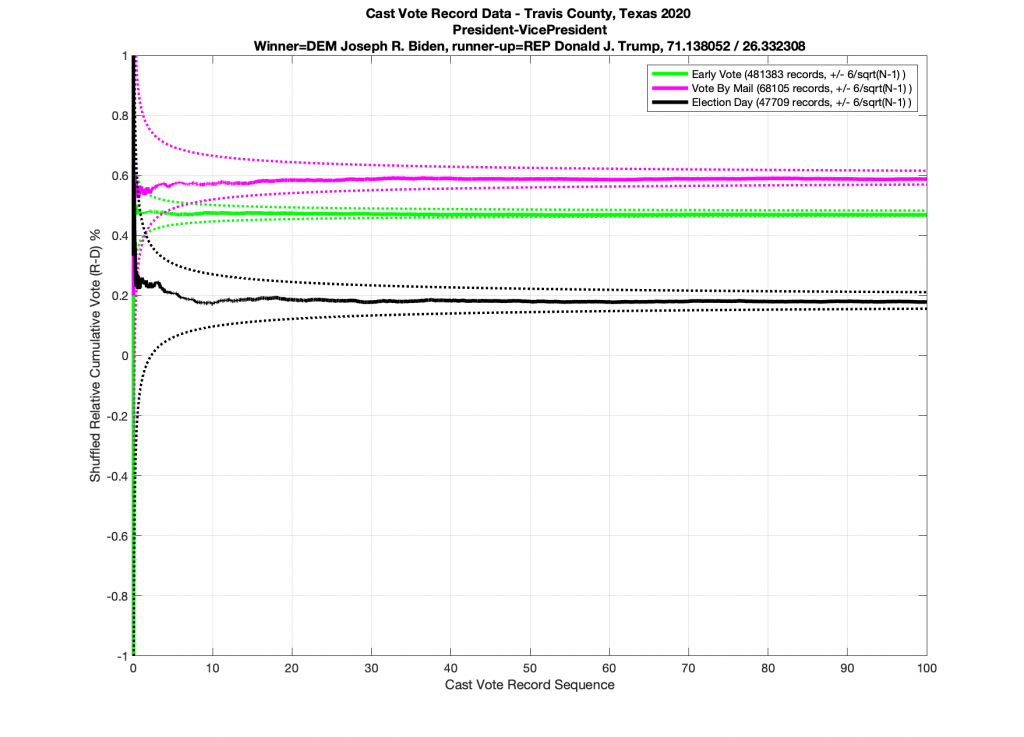
Next let’s take a look at a race that does NOT conform to the statistics we’ve laid out above. (… drum-roll please … as this the one everyone’s been waiting for). Immma just leave this right here and just simply point out that all 3 ballot type plots below in the Presidential race for 2020 go outside of the expected error bars. I also note the discrete stair step pattern in the early vote numbers. It’s entirely possible that there is a rational explanation for these deviations. I would sure like to hear it, especially since we have evidence from the exact same dataset of other races that completely followed the expected boundary conditions. So I don’t think this is an issue with a faulty dataset or other technical issues.
And just for completeness, when I artificially shuffle the data for the Presidential race, and force it to be randomized, I do in fact end up with results that conform to IID statistics (below).
I will again state that while these results are highly indicative that there were irregularities and discrepancies in the election data, they are not conclusive. A further investigation must take place, and records must be preserved, in order to discover the cause of the anomalies shown.
Running through each race that had at least 1000 ballots cast and automatically detecting which races busted the 6/sqrt(n-1) boundaries produces the following tabulated results. A 1 in the right hand column indicates that the CVR data for that particular race in Travis County has crossed the error bounds. A 0 in the right hand column indicates that all data stayed within the error bound limits.
[1] Forsberg, O.J. (2020). Understanding Elections through Statistics: Polling, Prediction, and Testing (1st ed.). Chapman and Hall/CRC. https://doi.org/10.1201/9781003019695
[2] Klimek, Peter & Yegorov, Yuri & Hanel, Rudolf & Thurner, Stefan. (2012). Statistical Detection of Systematic Election Irregularities. Proceedings of the National Academy of Sciences of the United States of America. 109. 16469-73. https://doi.org/10.1073/pnas.1210722109.
Second time’s the charm! See here for my (corrected) first attempt. My apologies for the coding error in my first effort to compute the 2020 CSV Estimates.
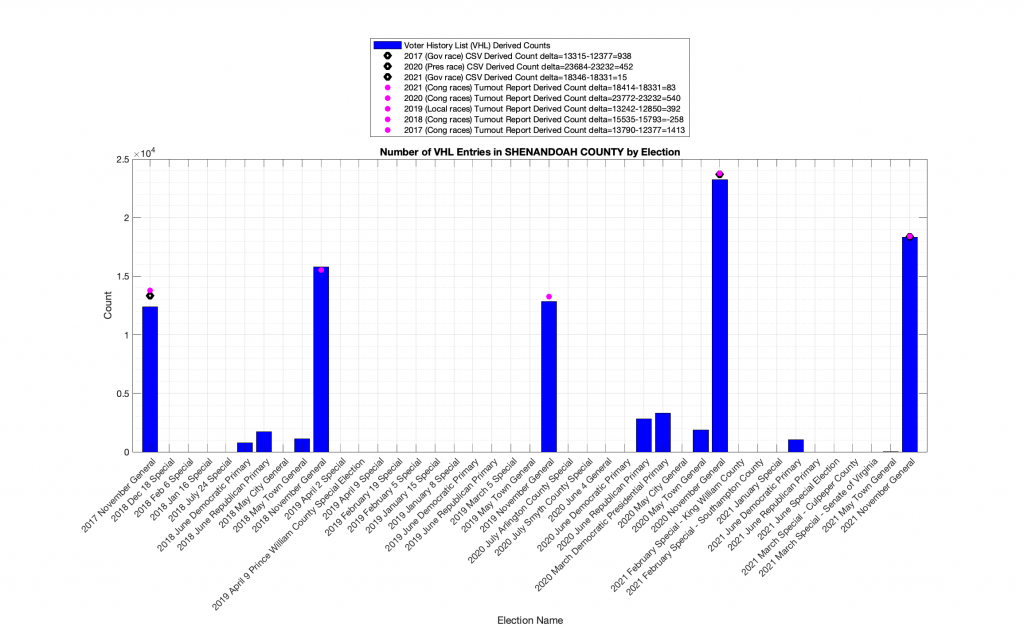
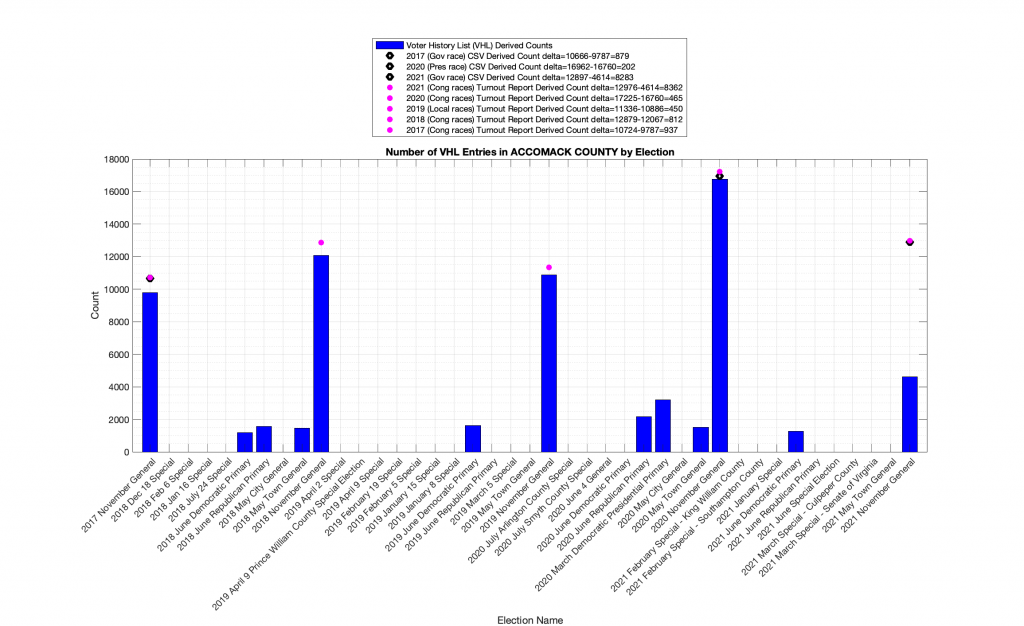
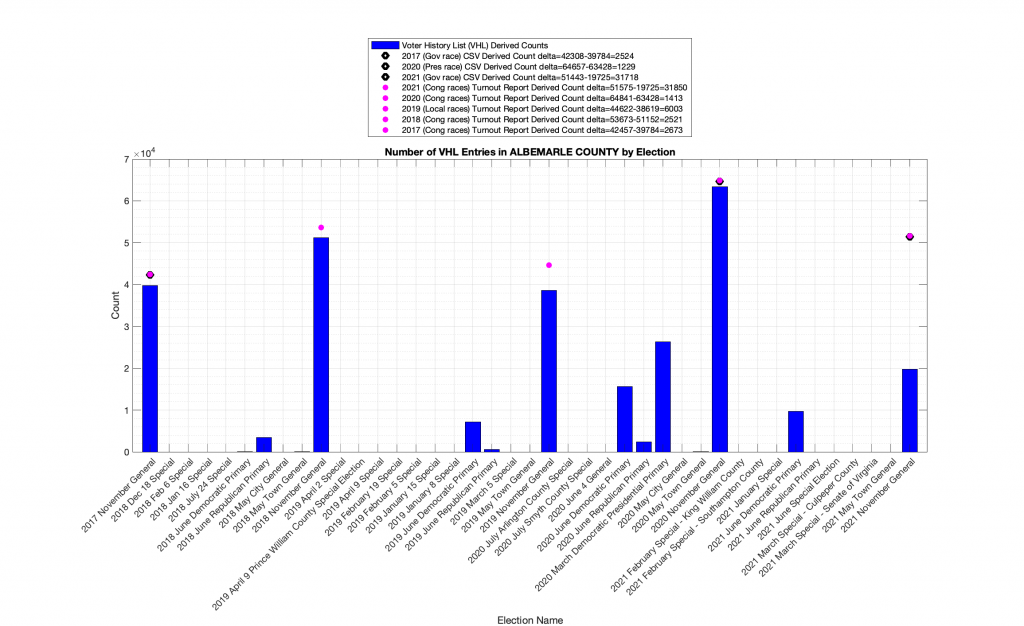
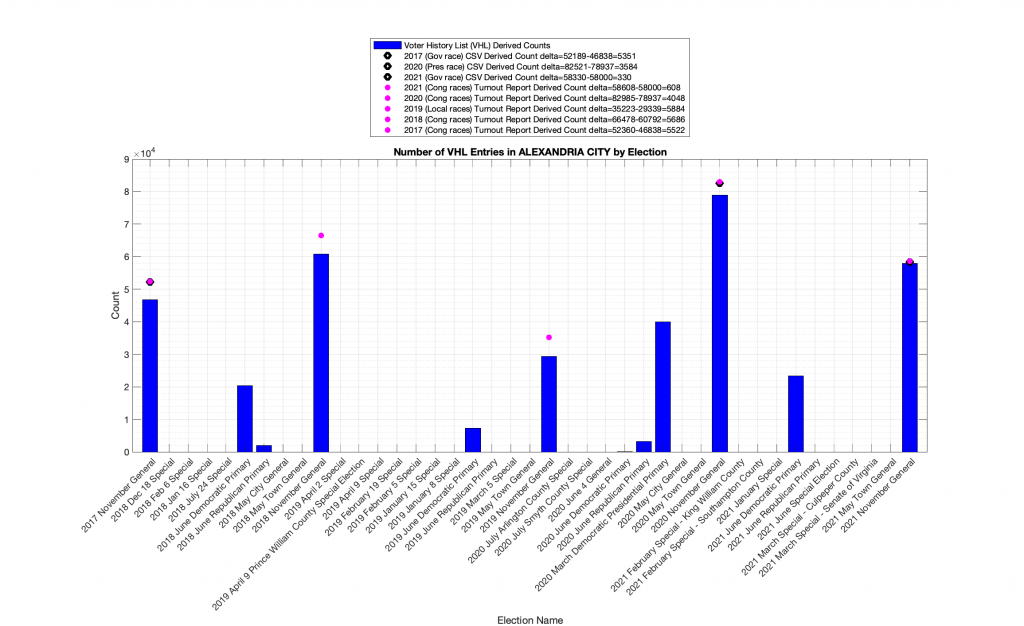
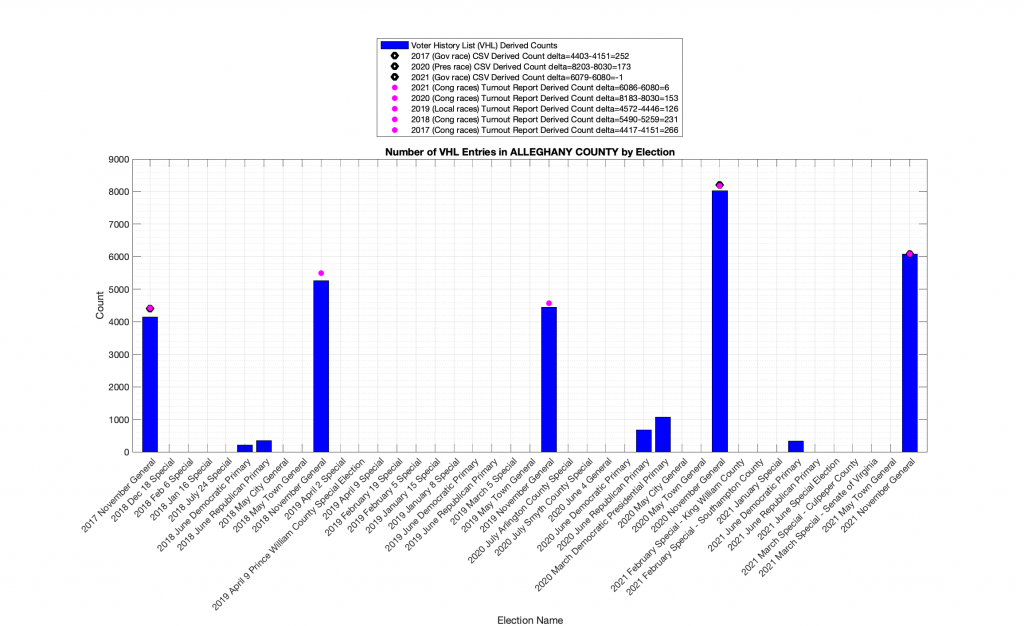
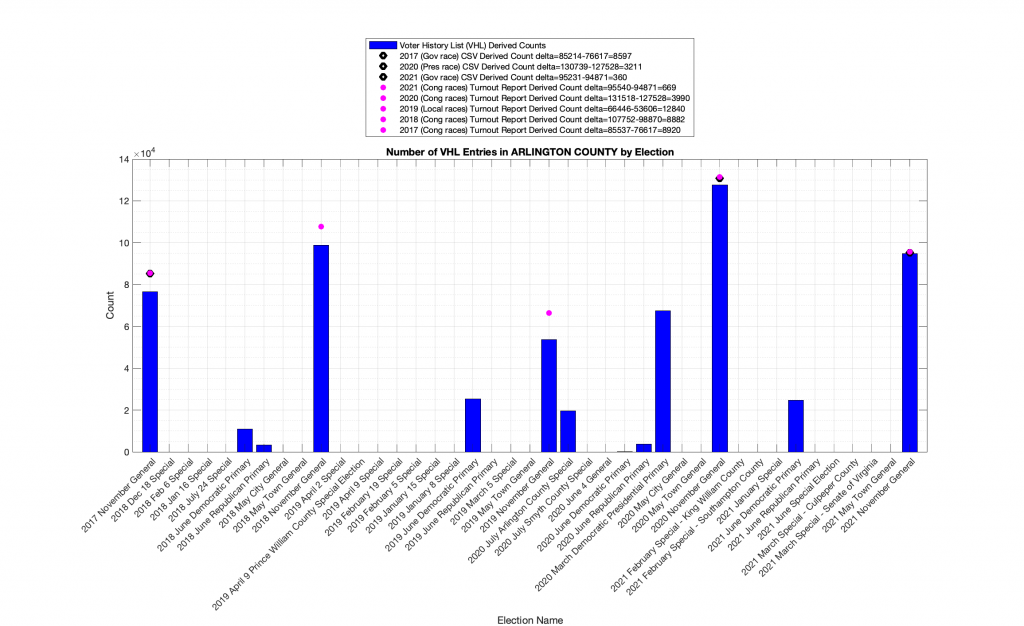
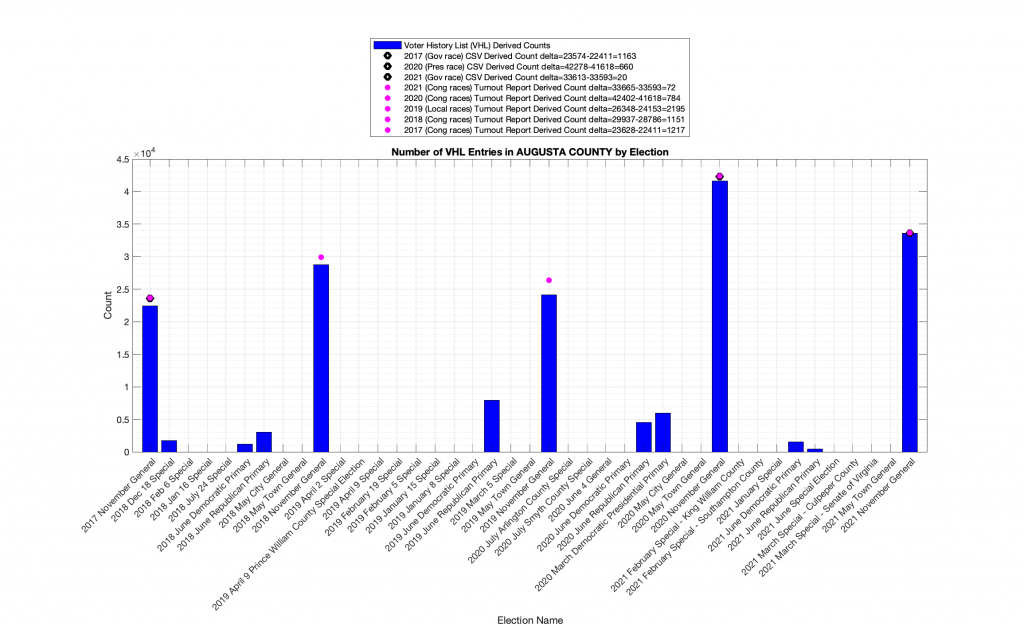
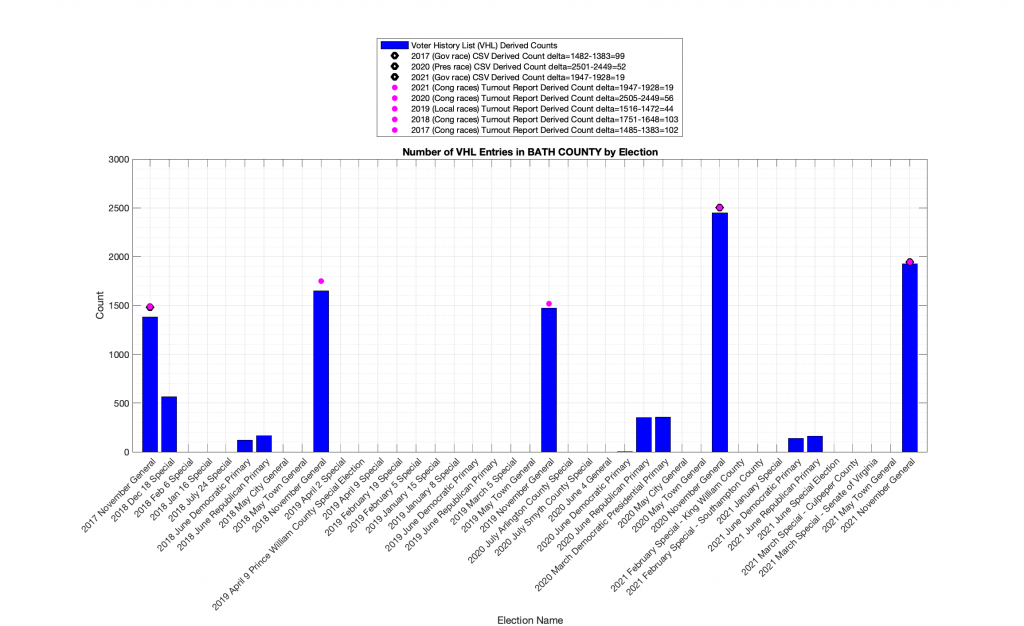
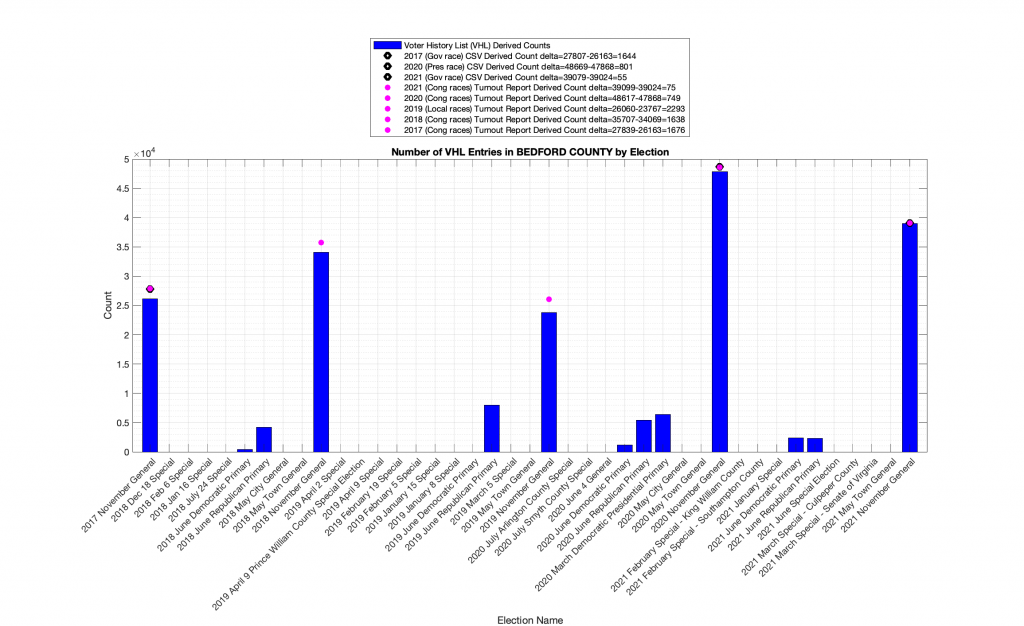
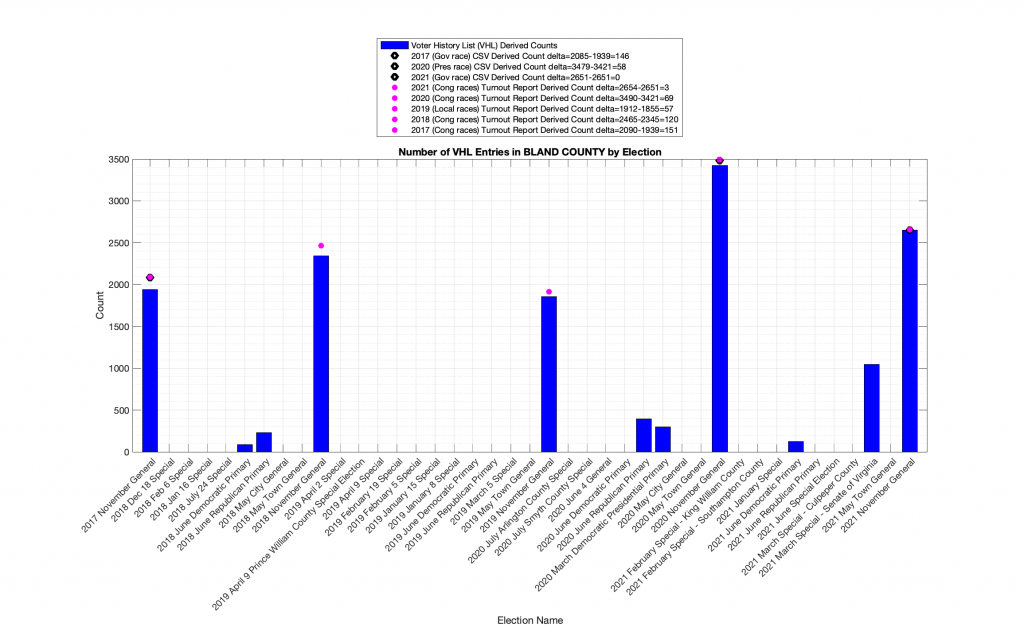
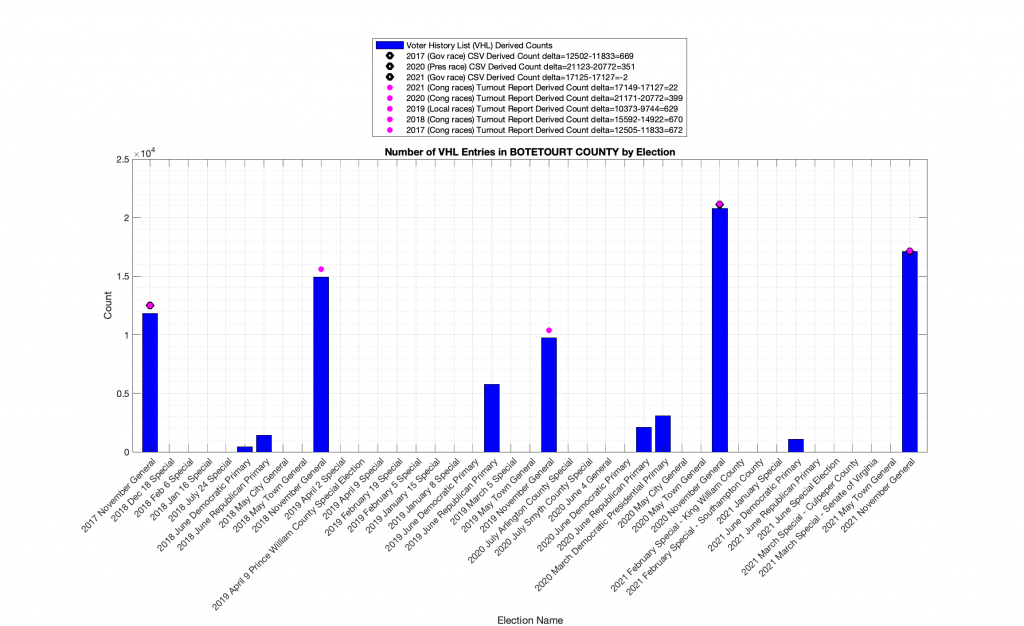
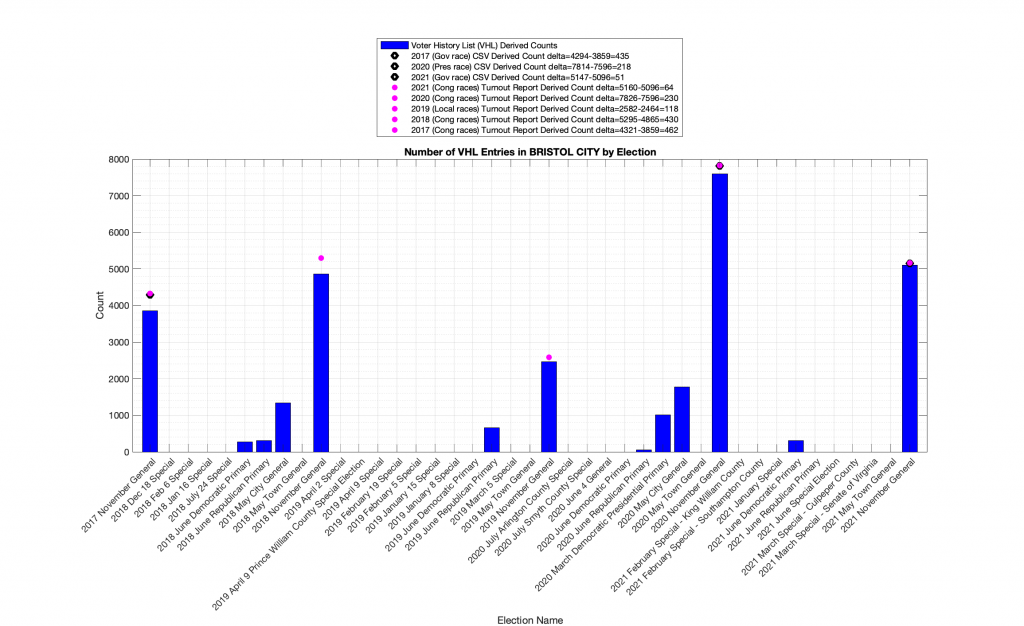
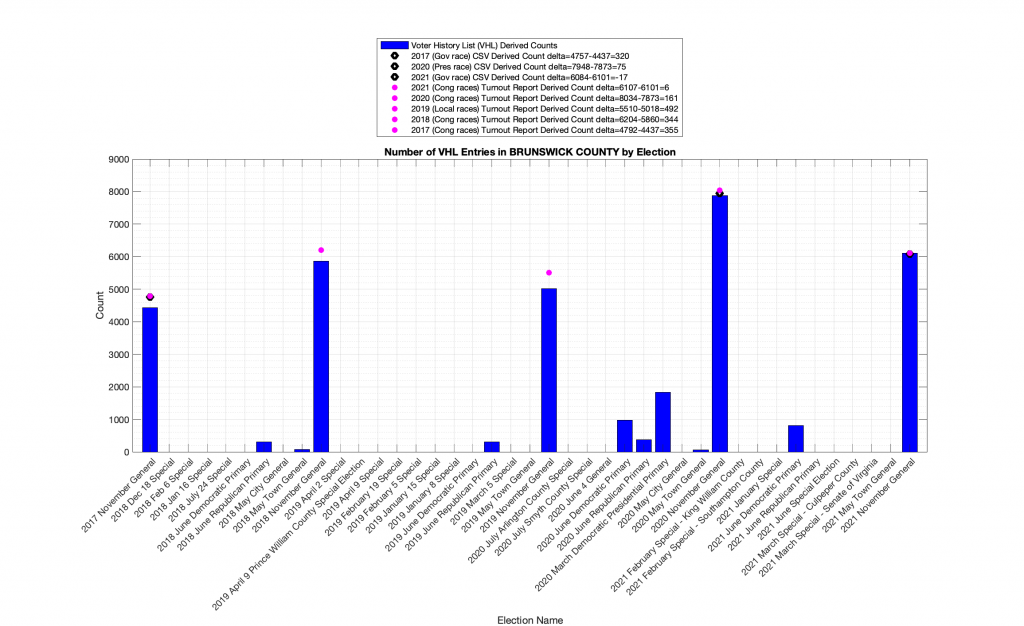
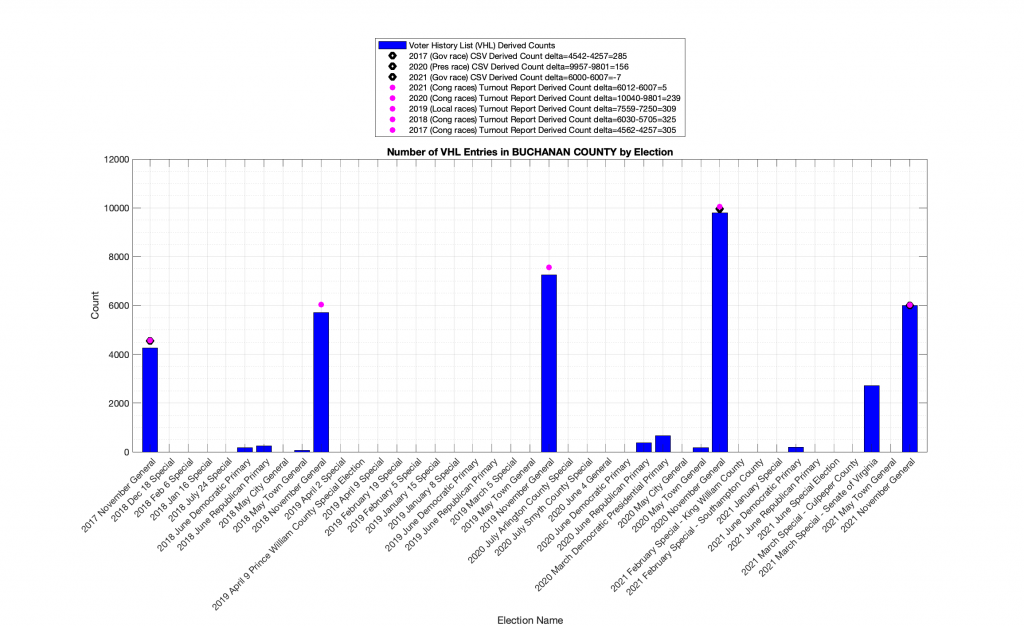
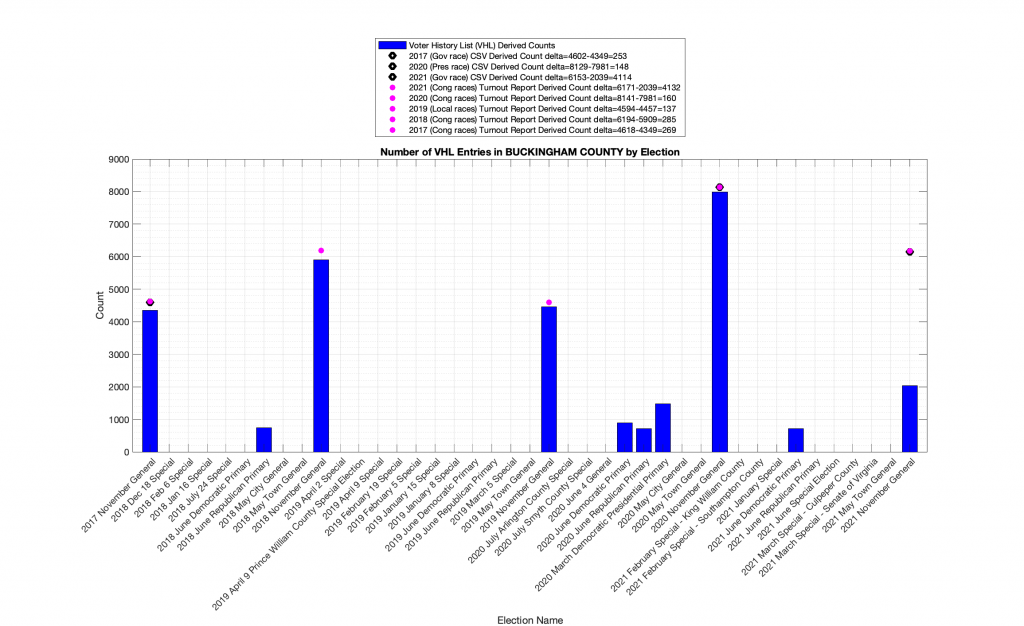
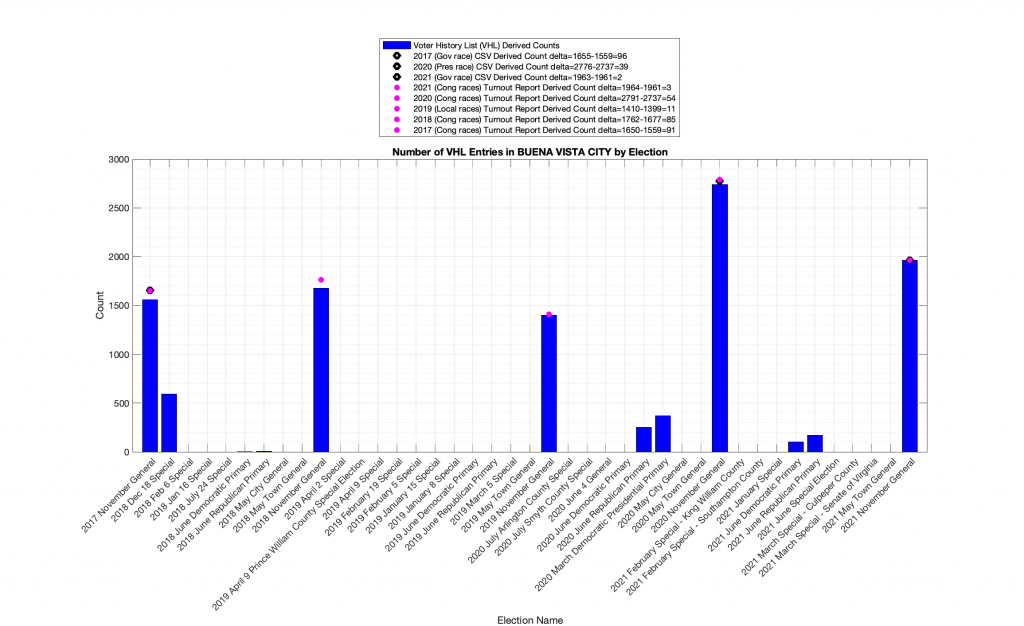
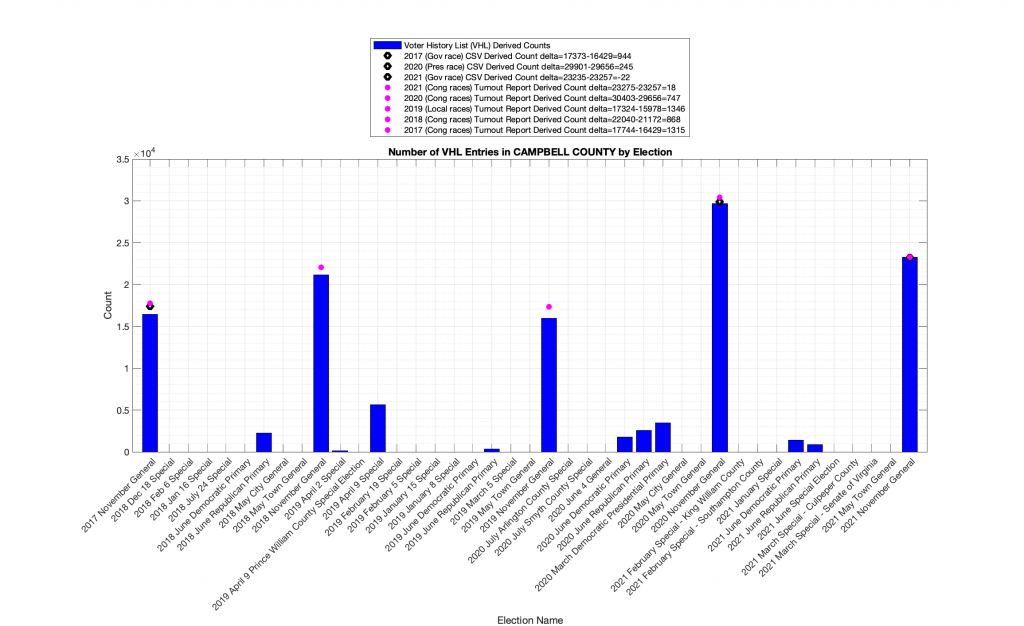
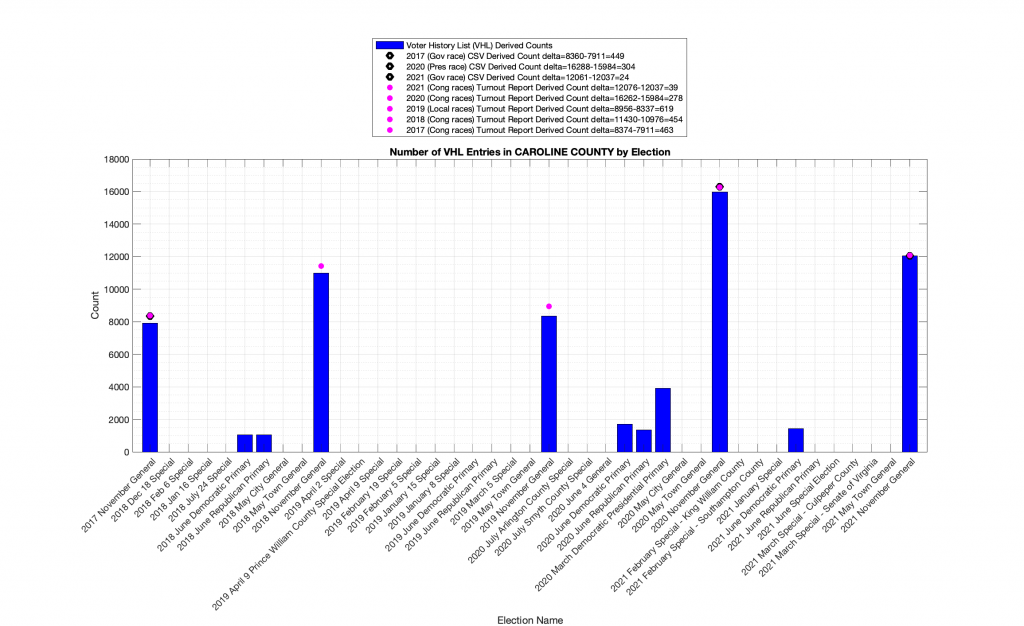
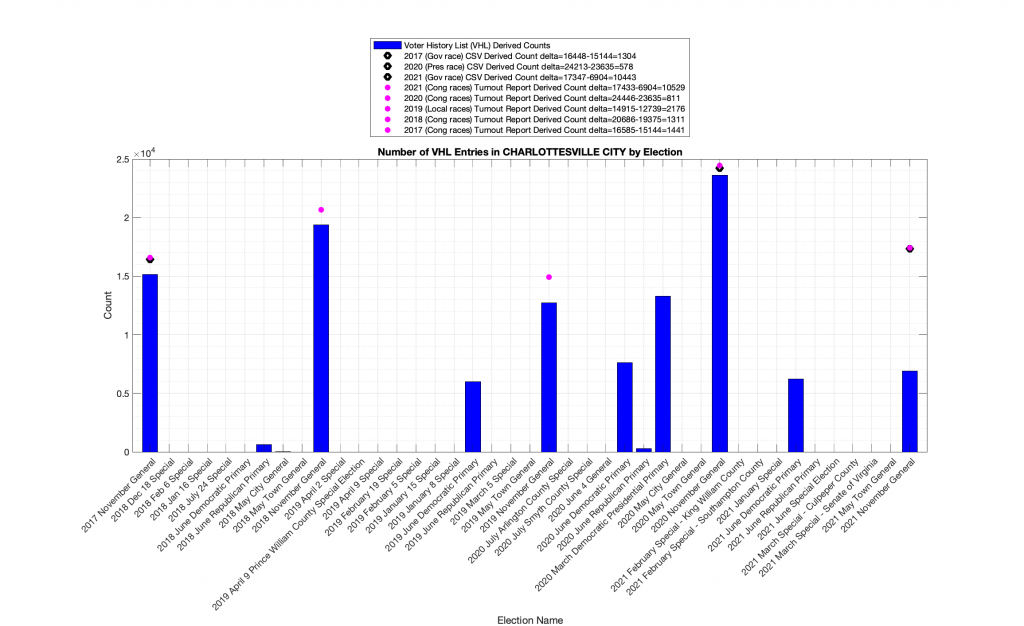
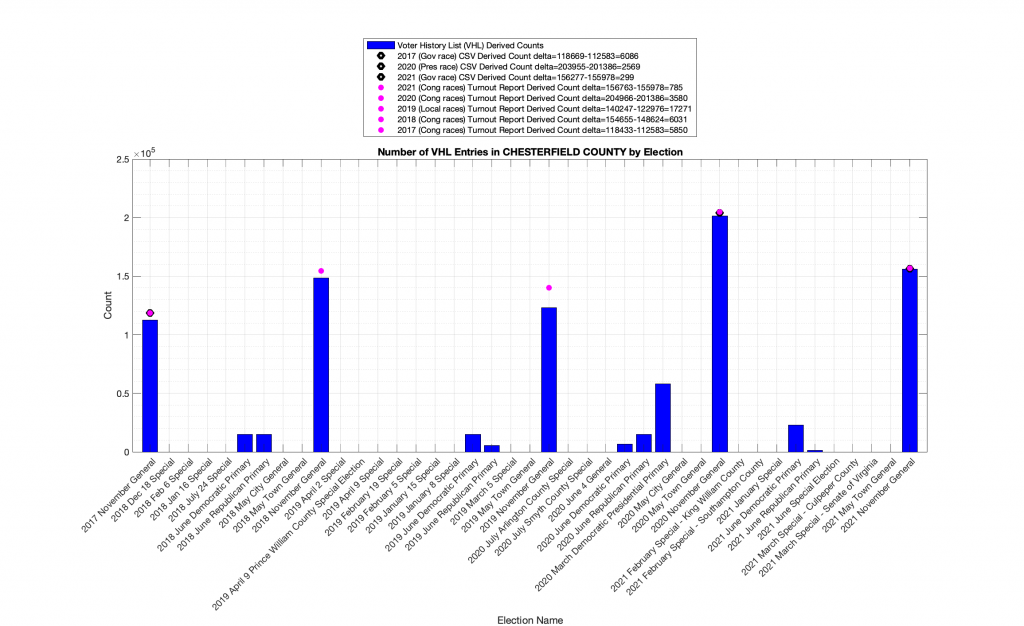
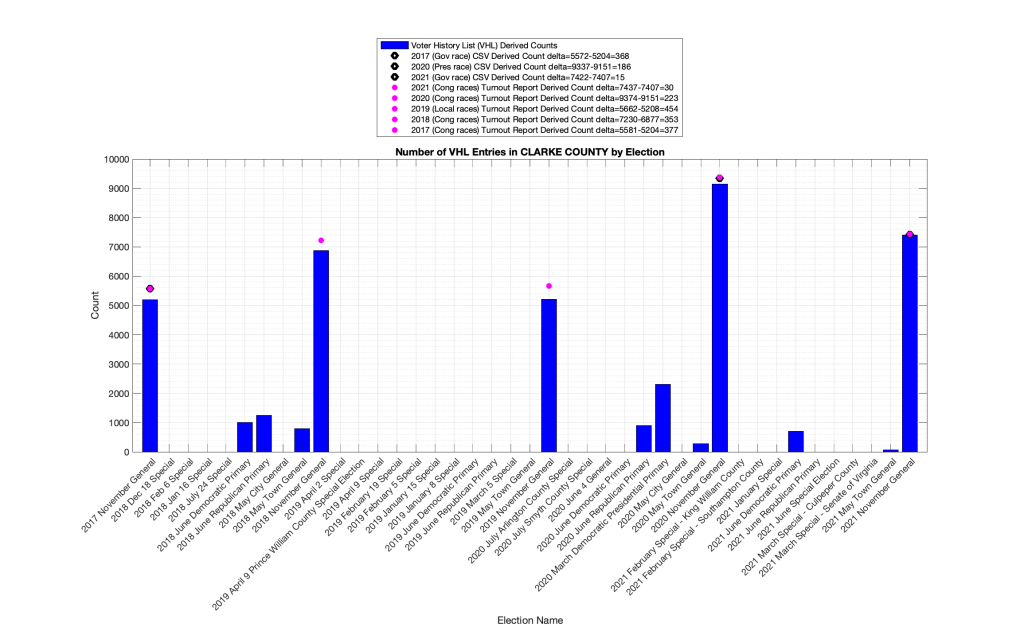
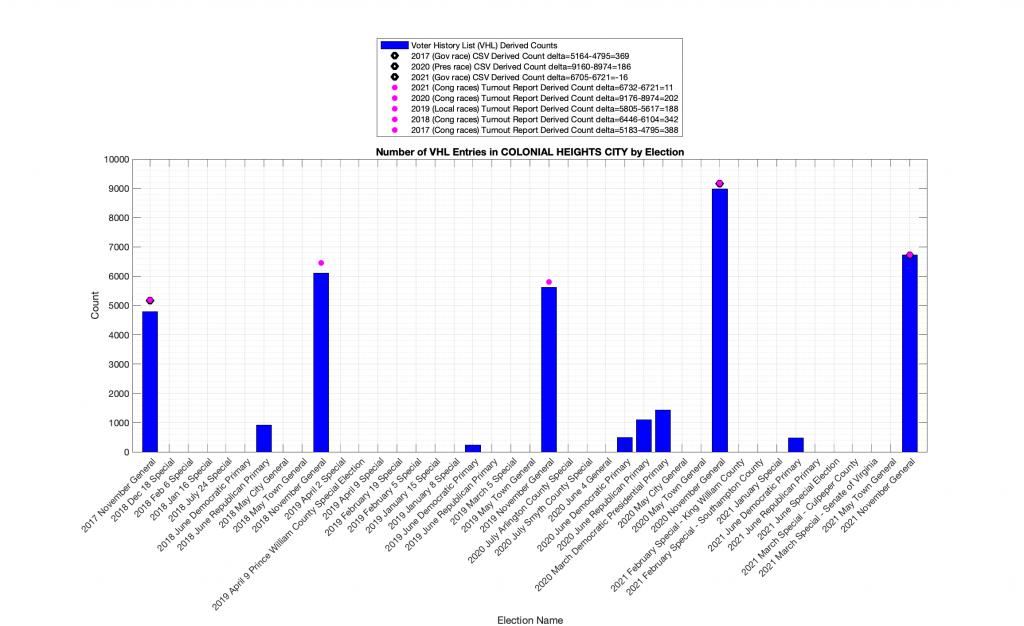
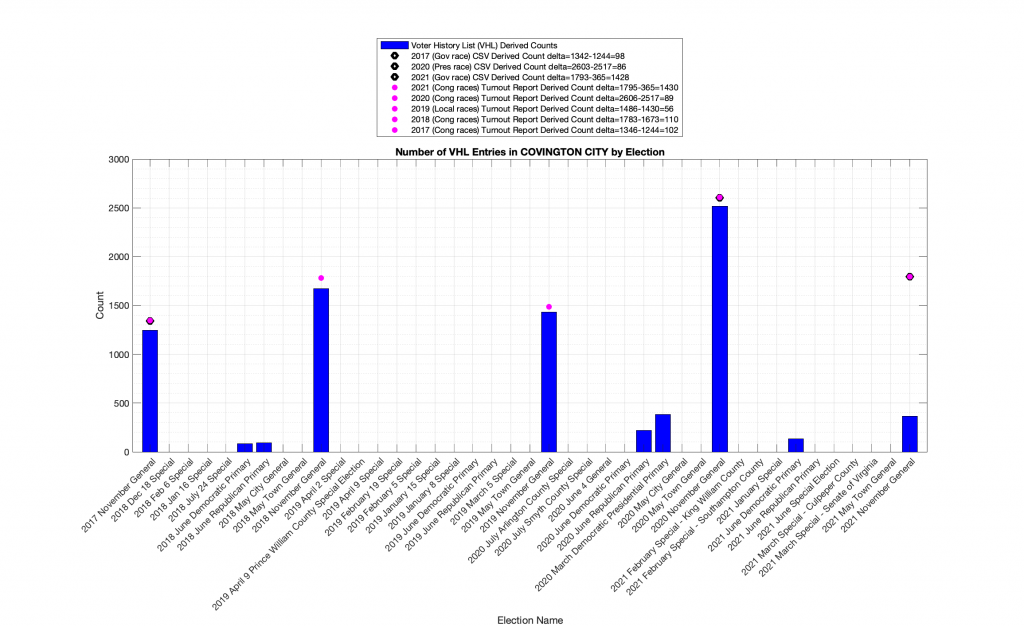
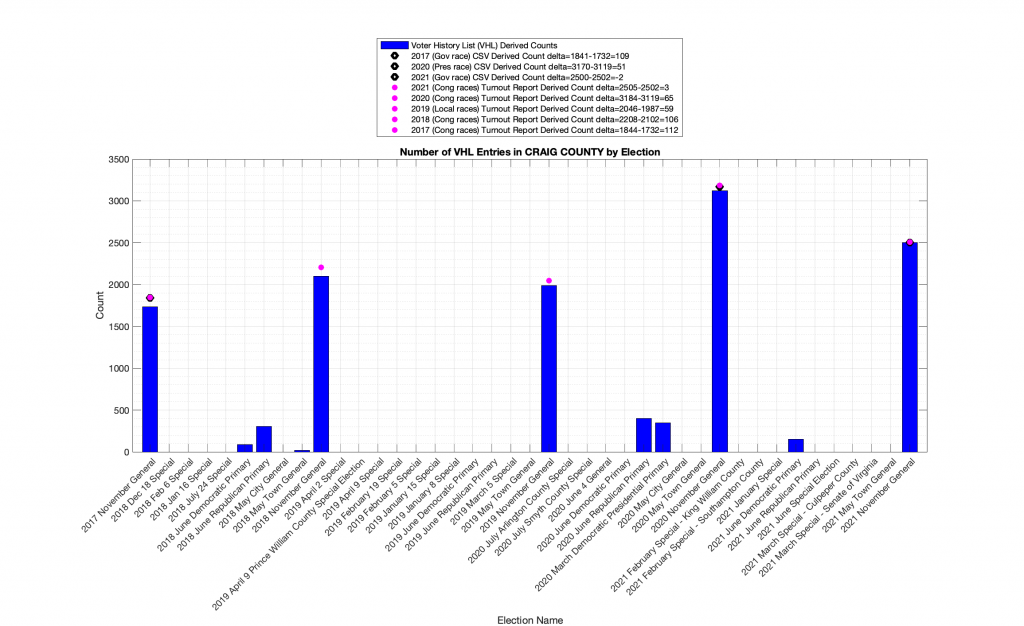
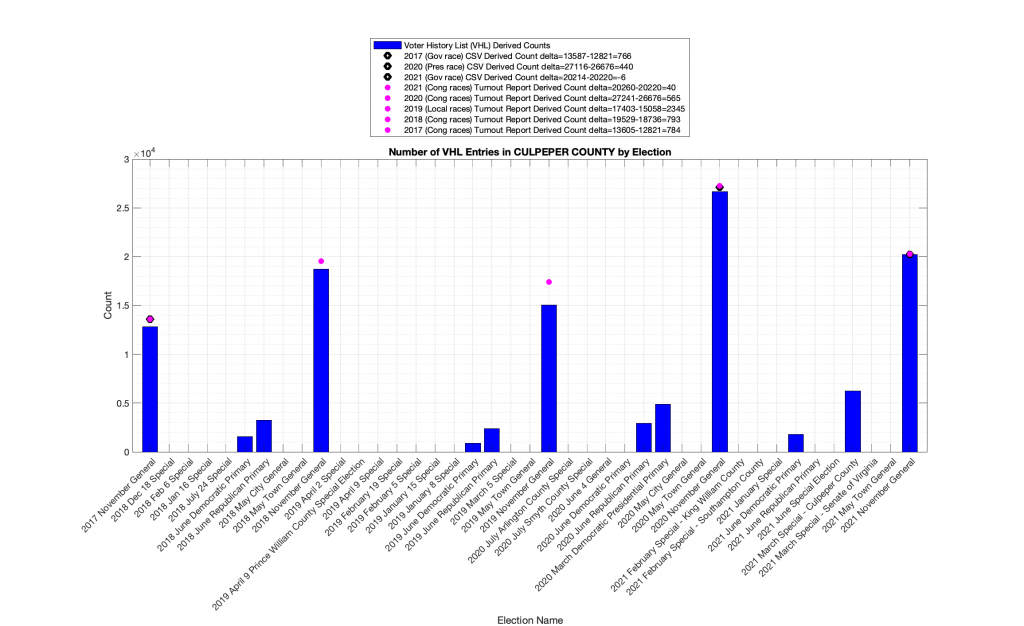
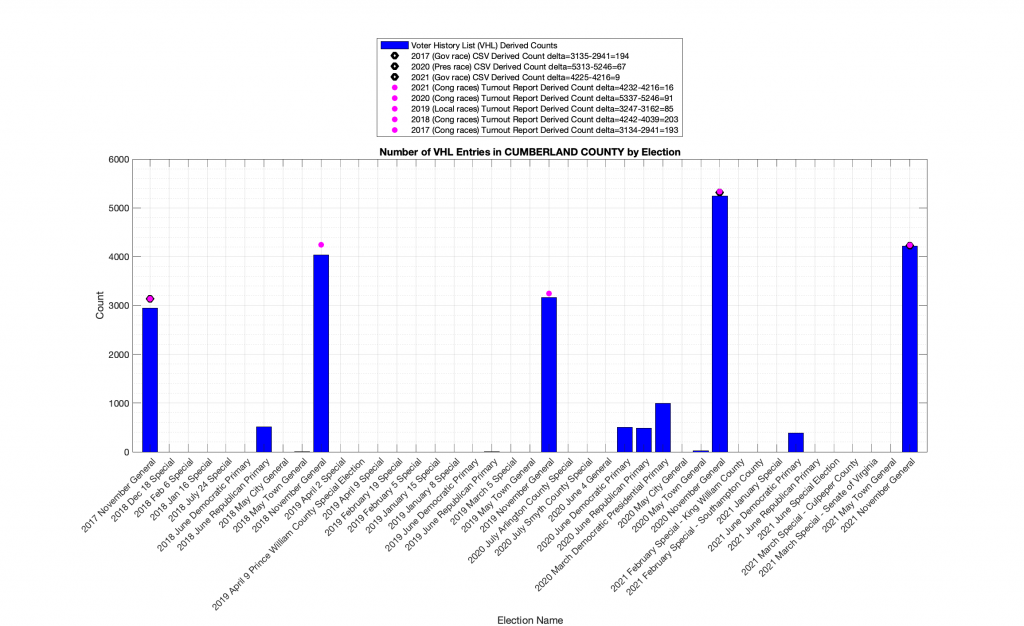
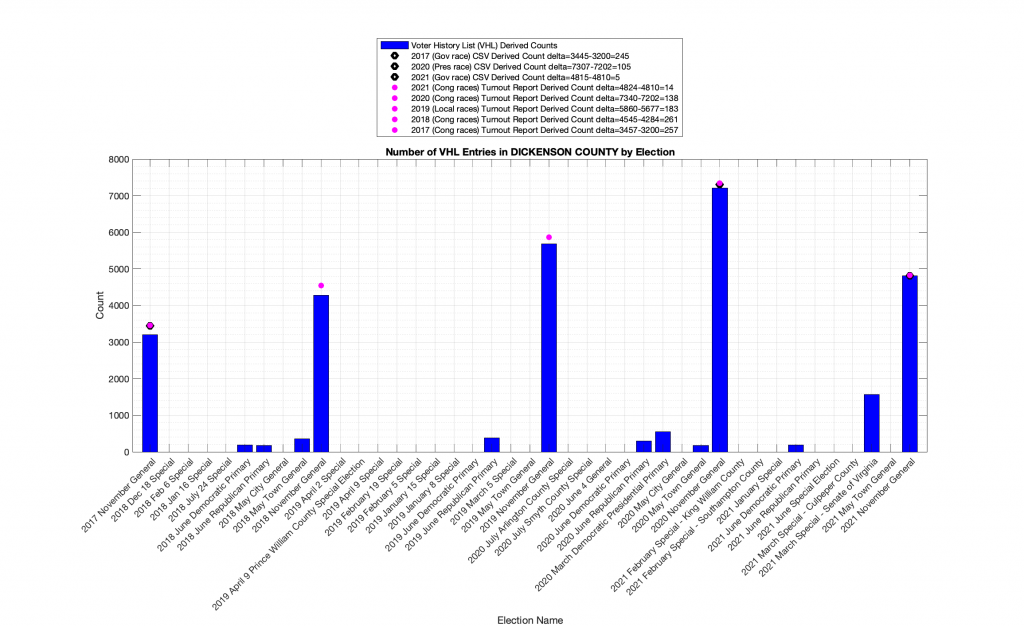
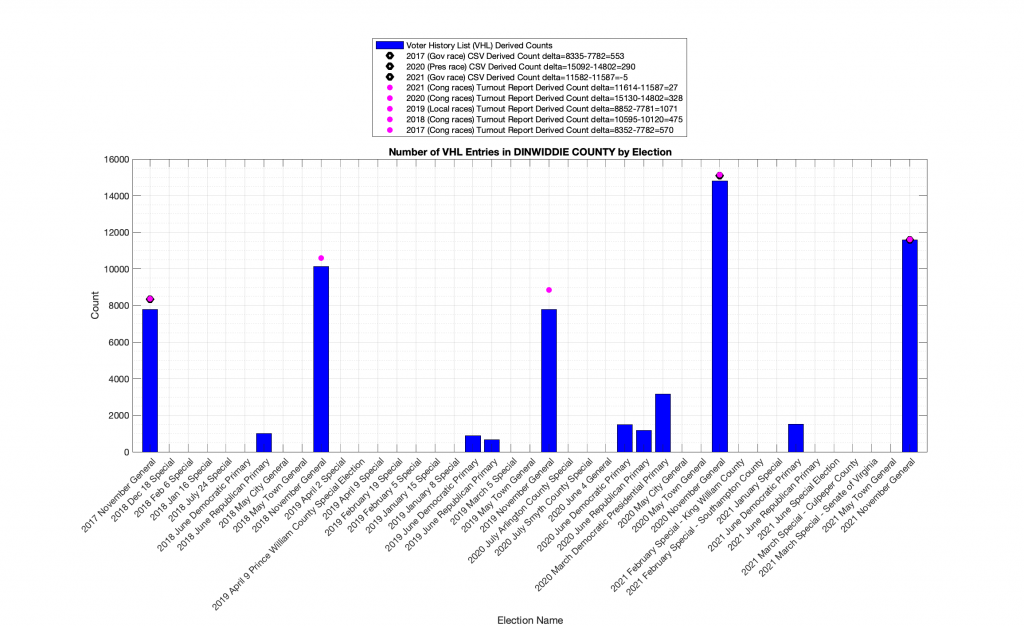
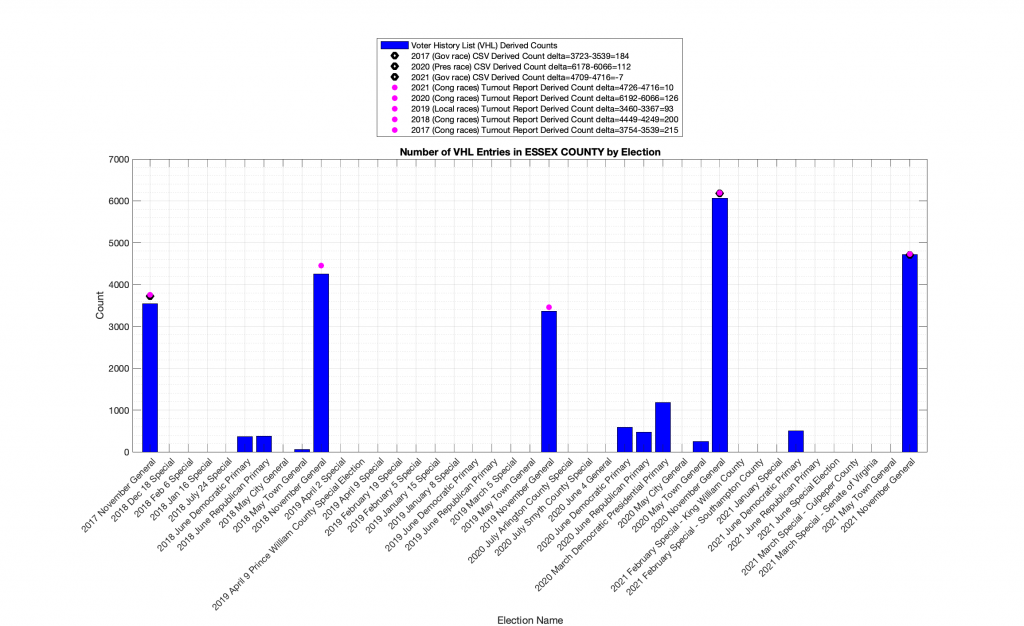
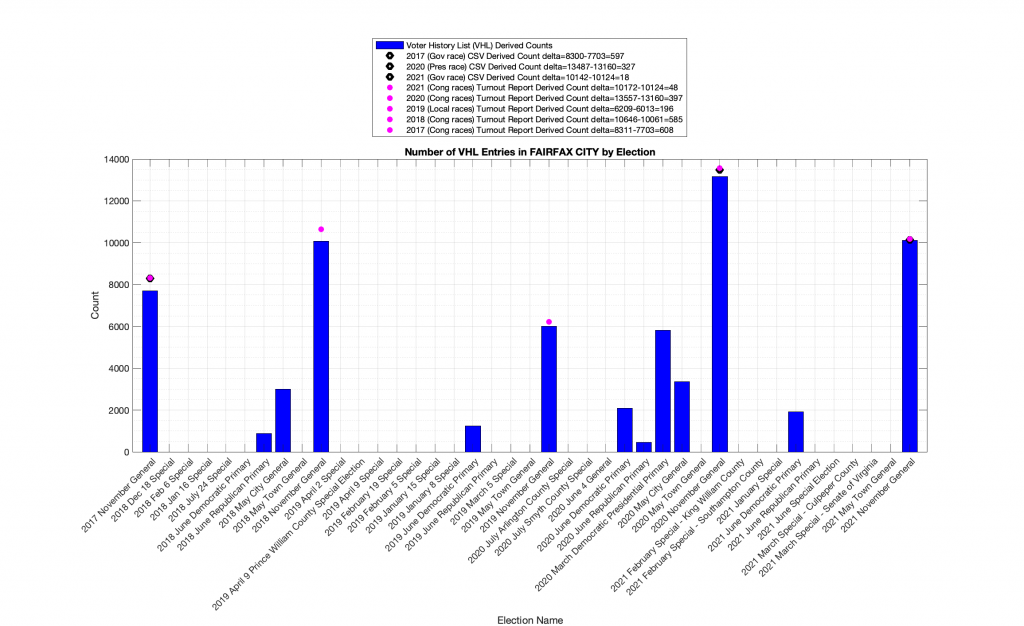
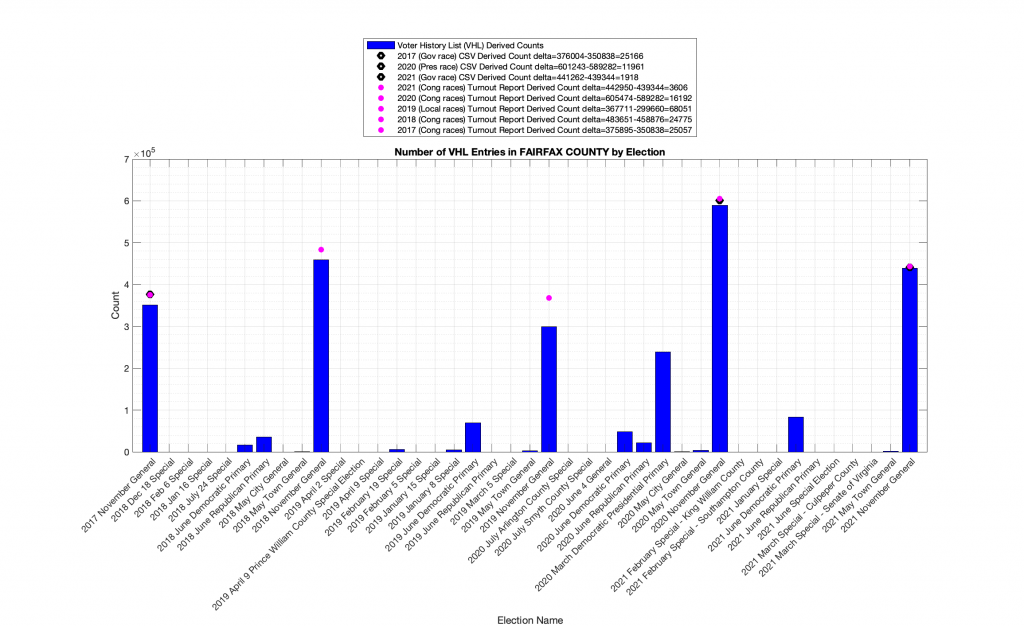
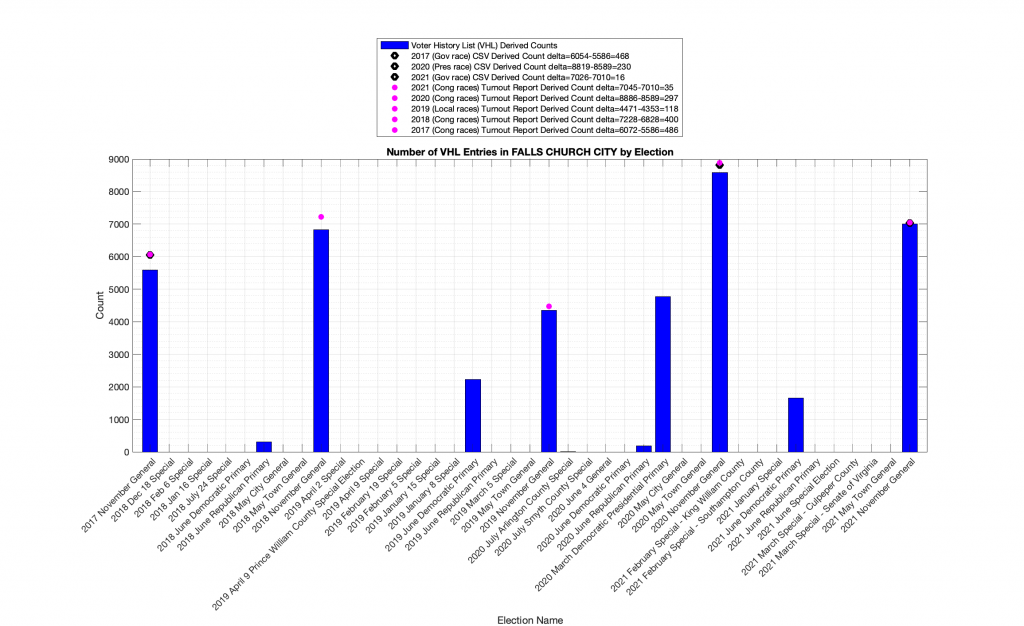
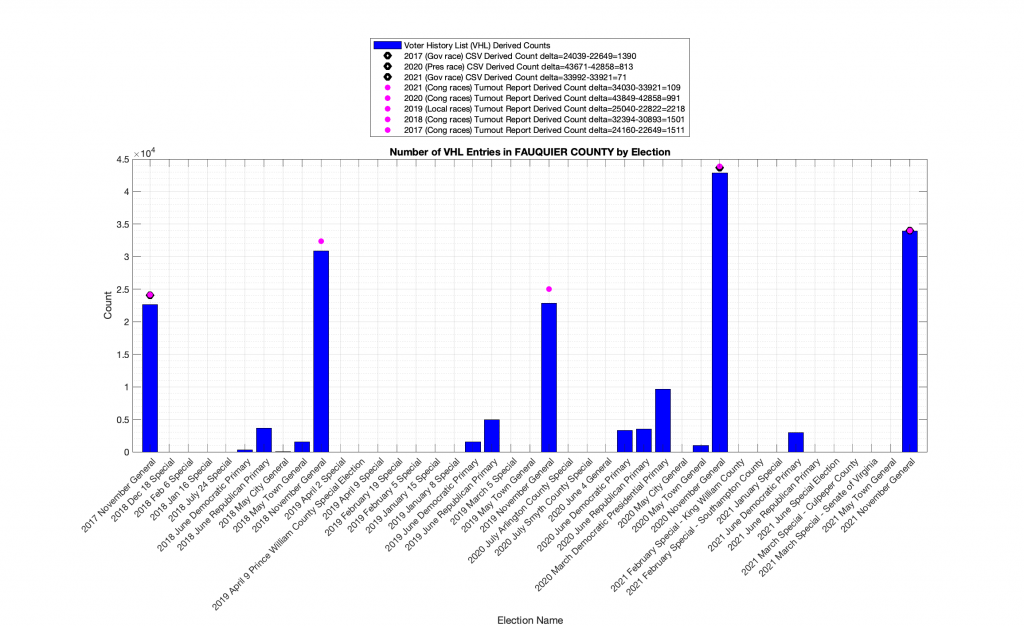
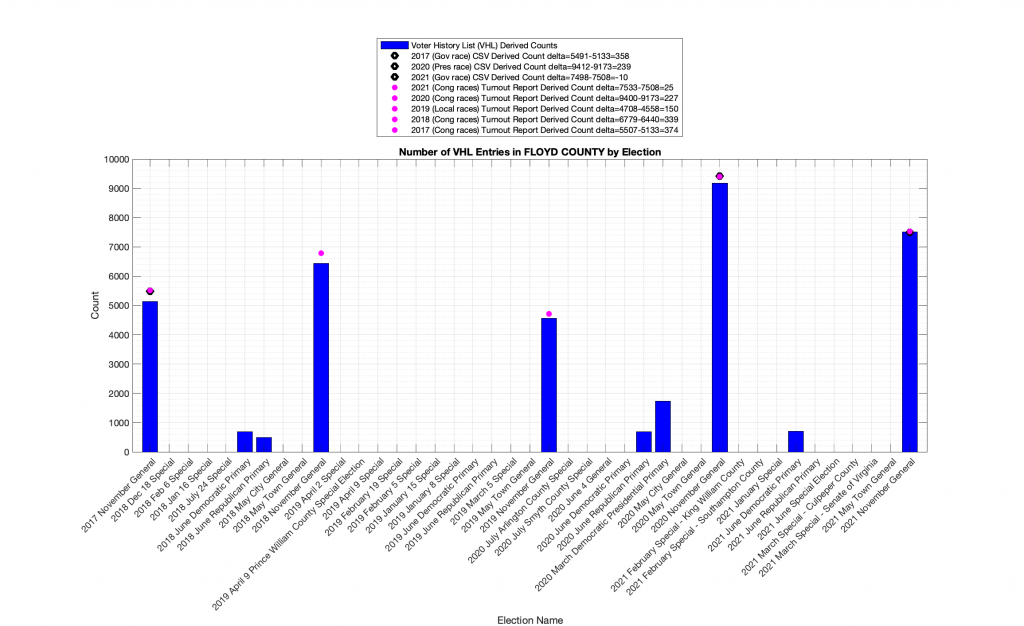
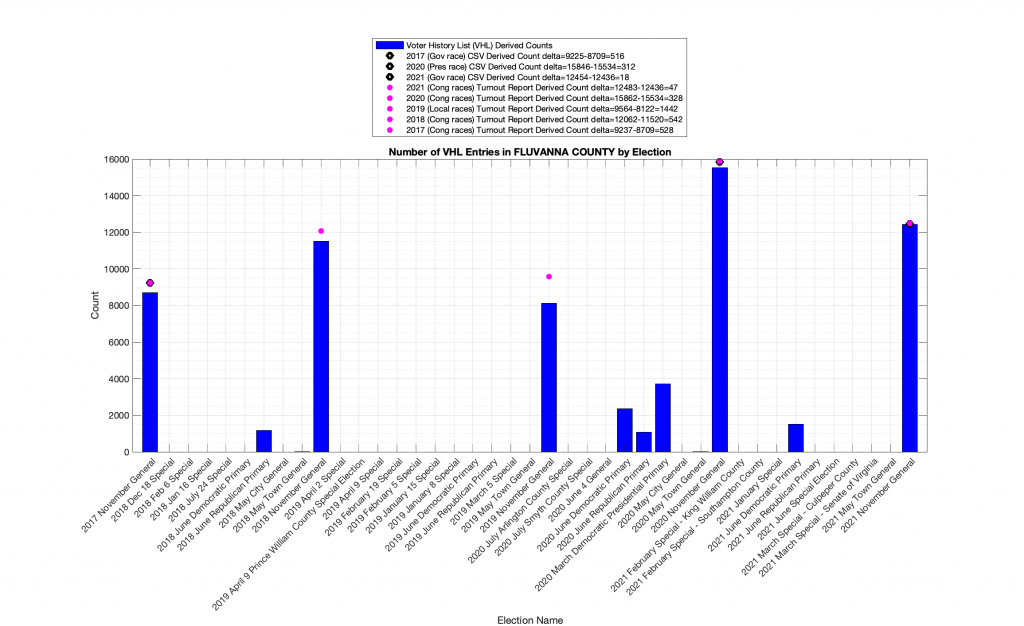
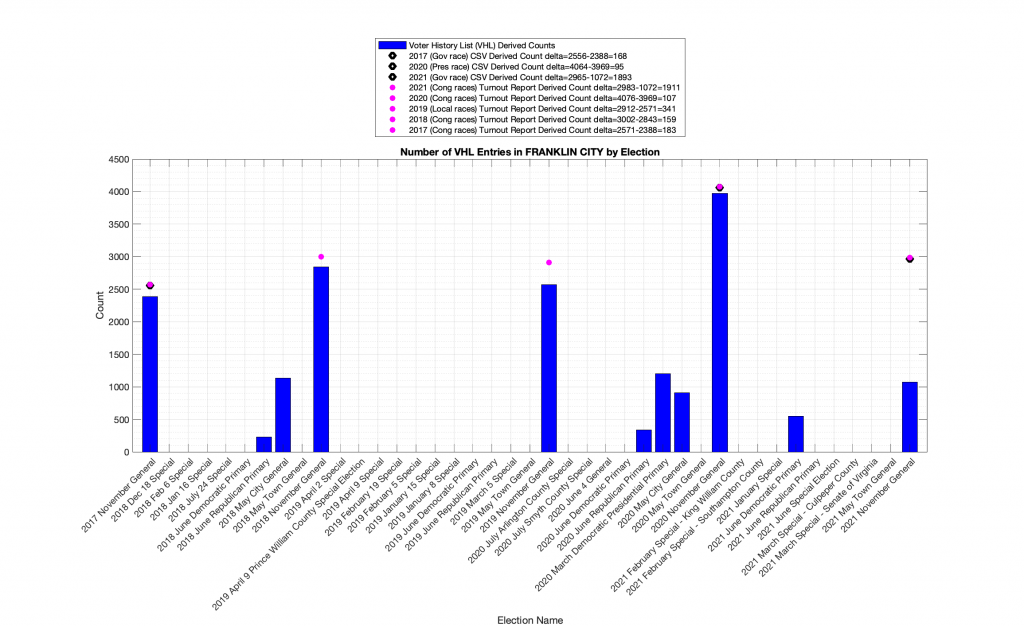
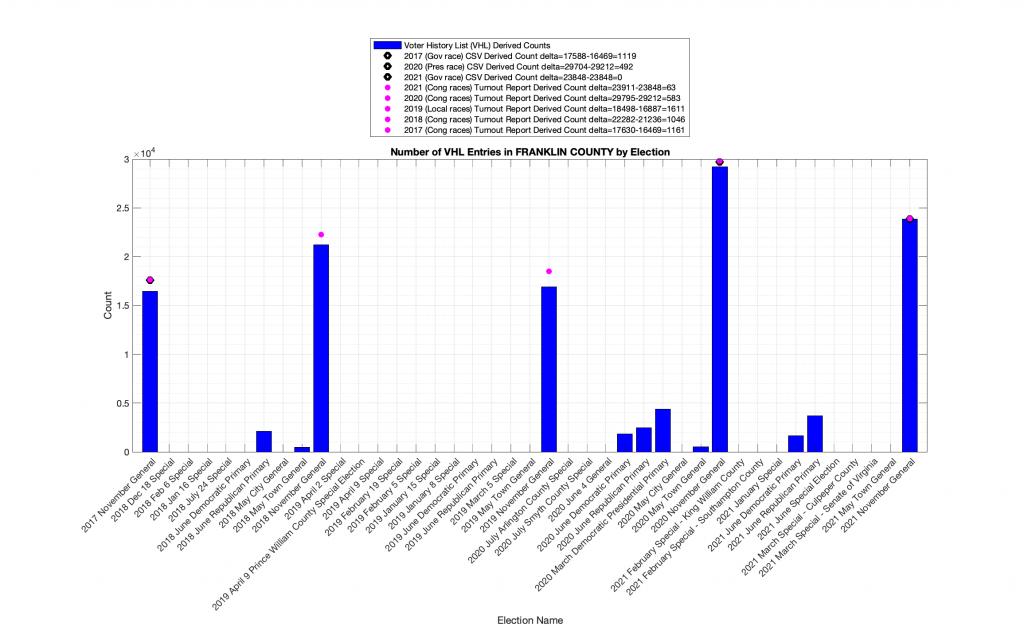
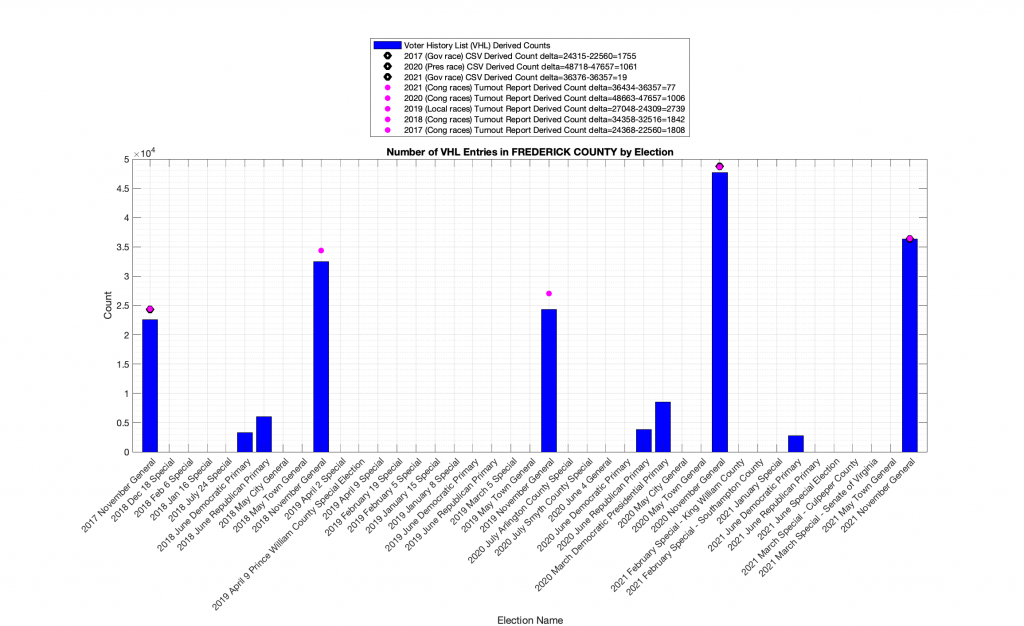
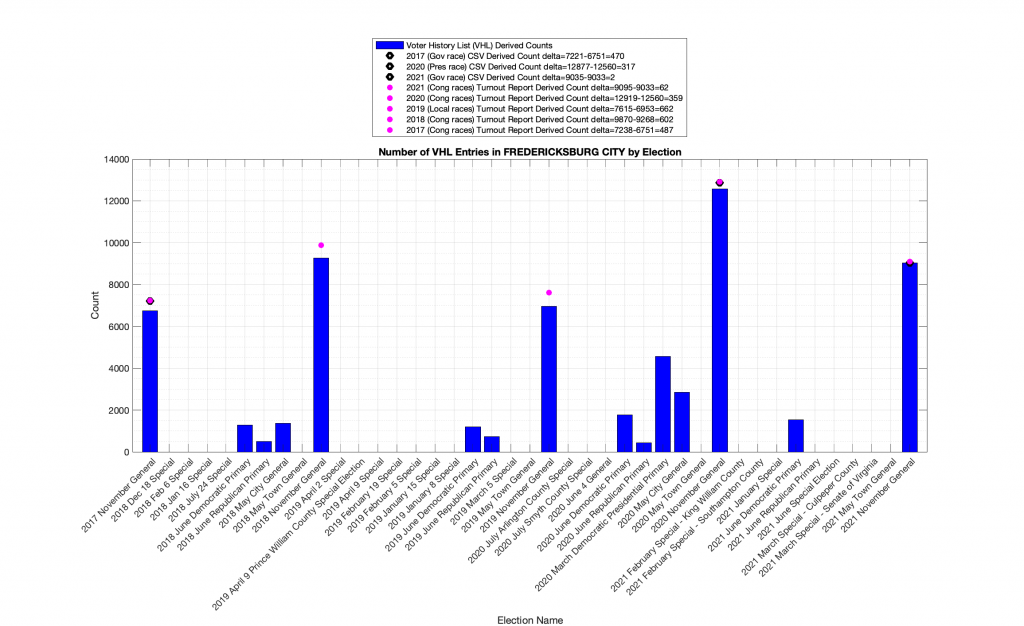
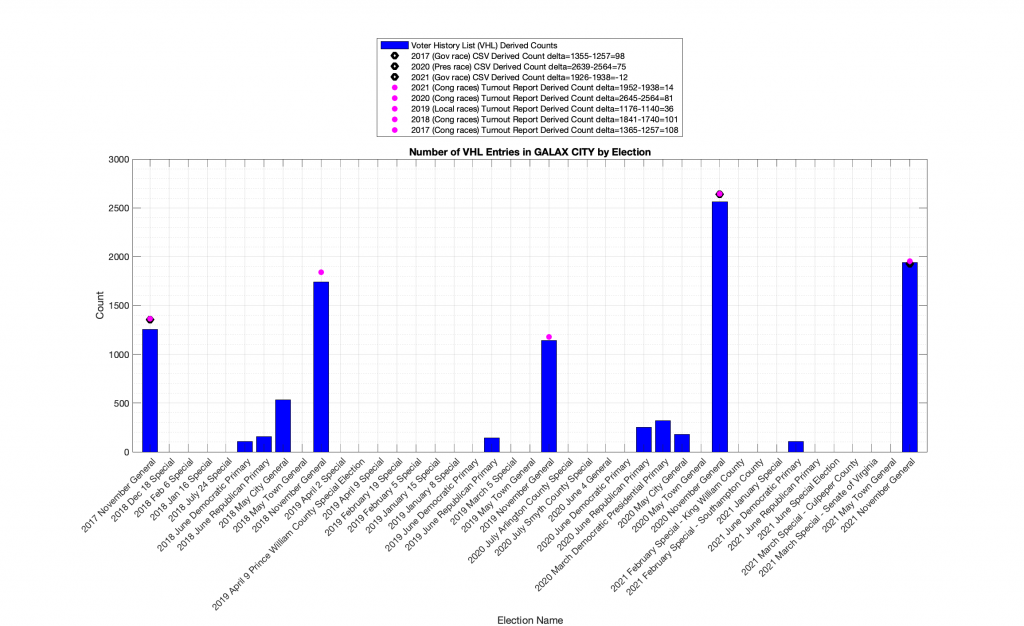
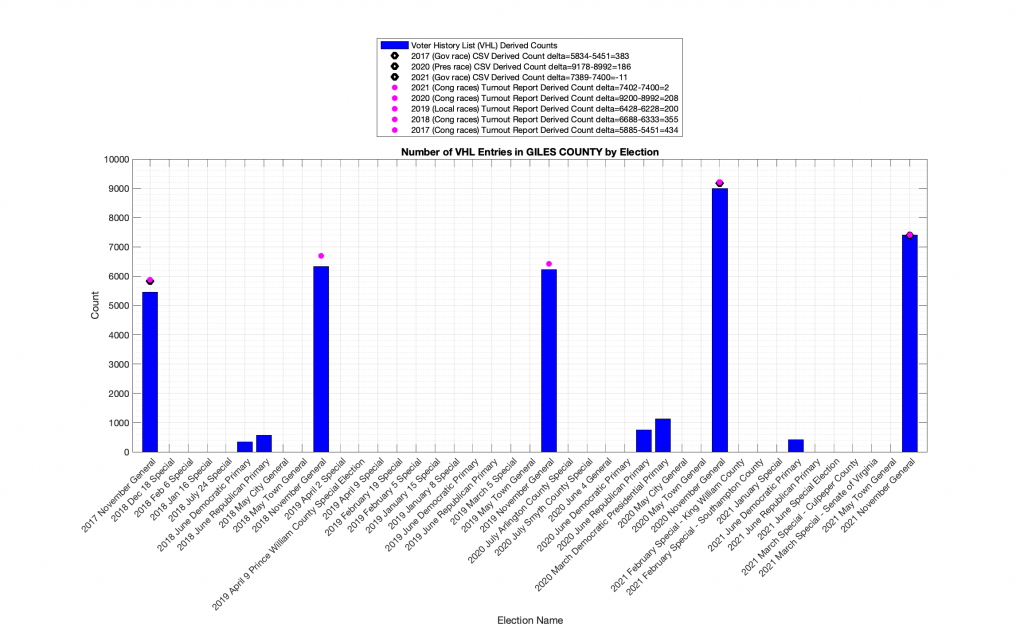
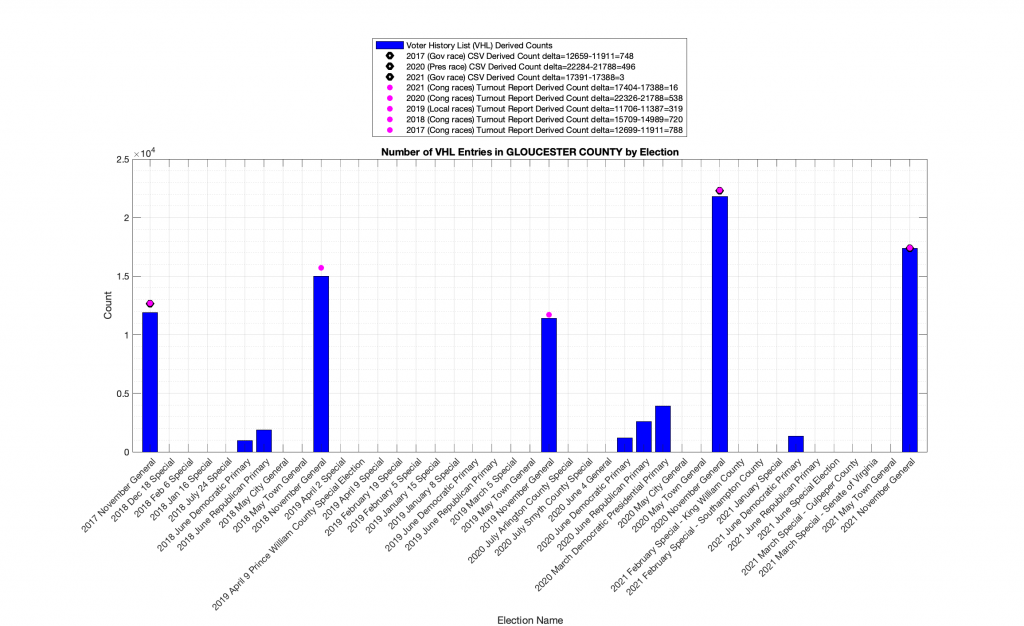
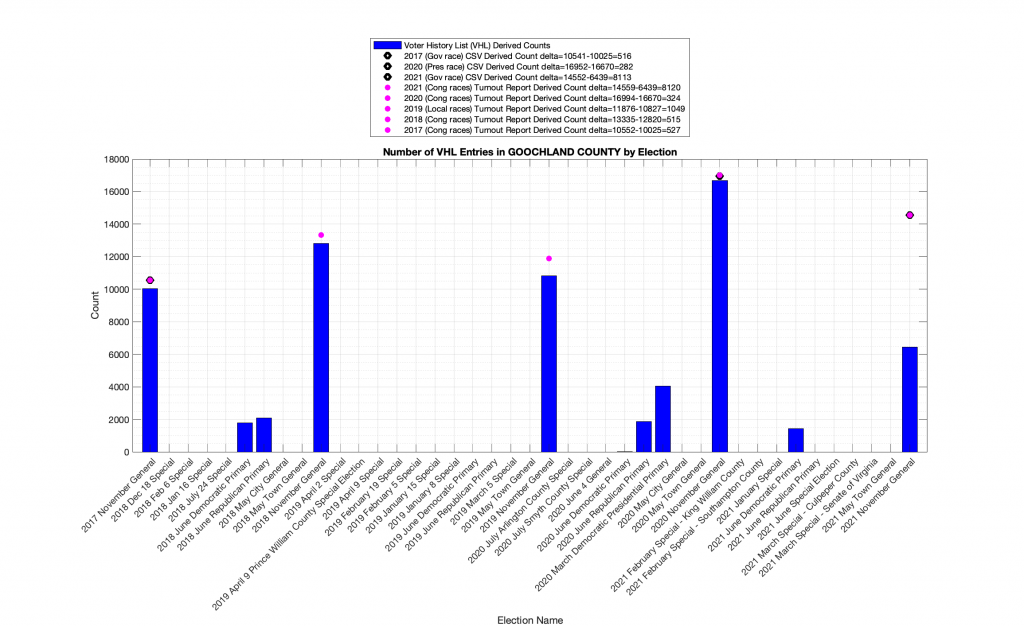
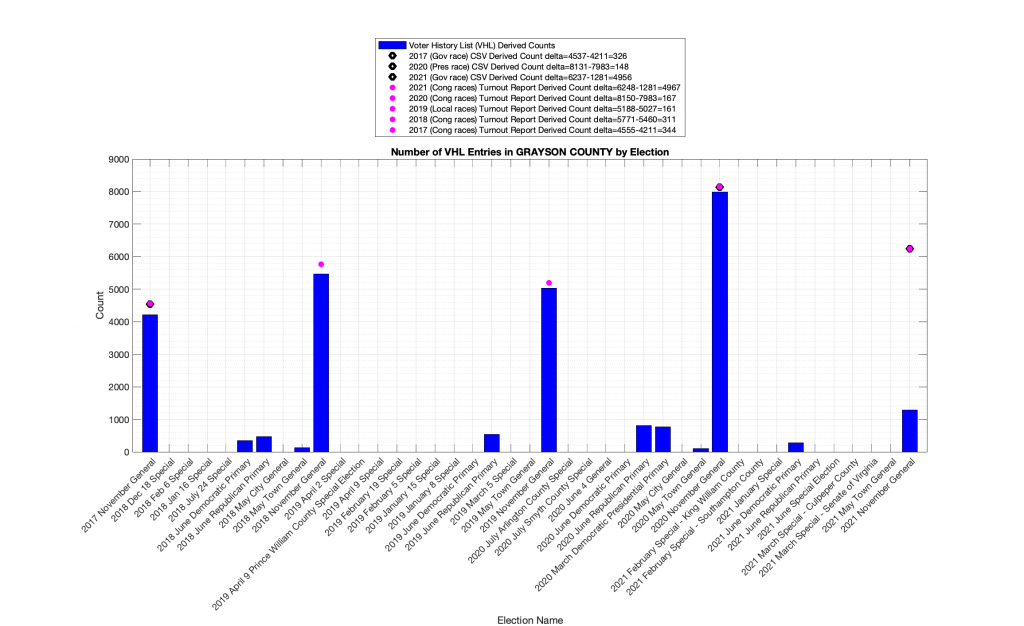
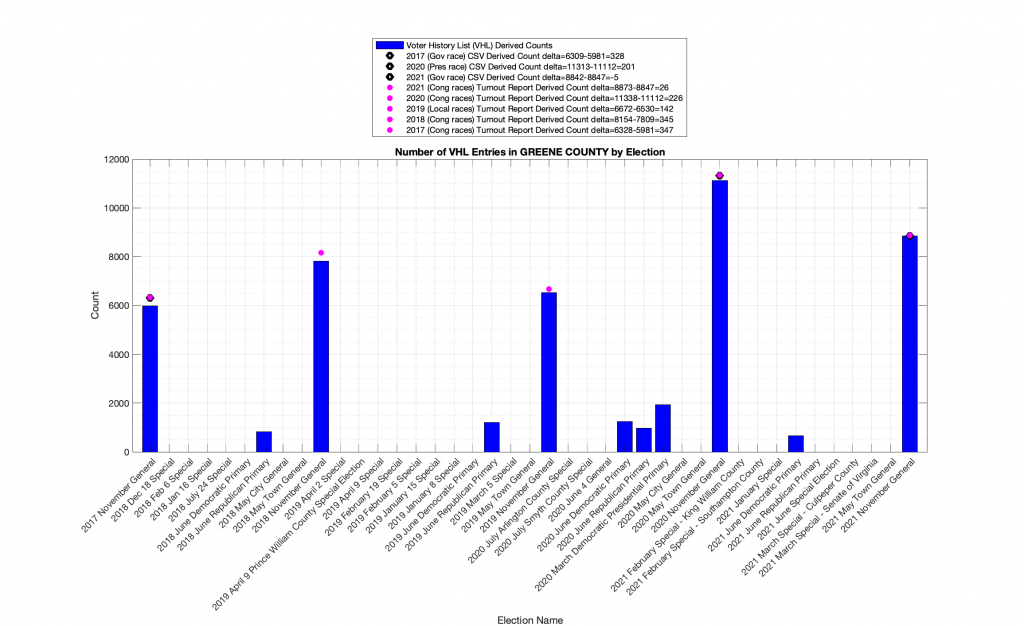
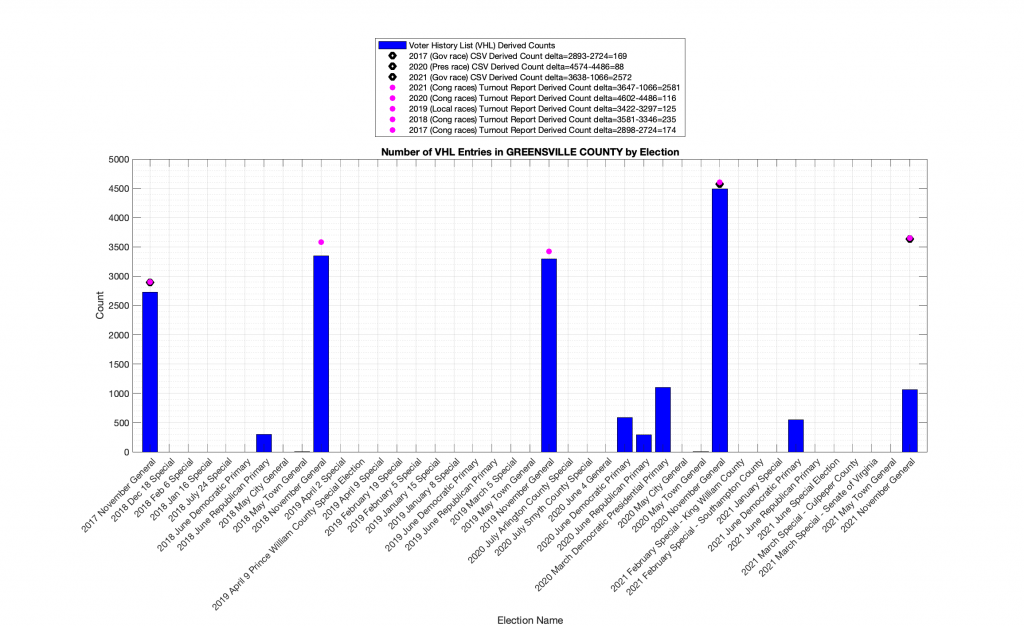
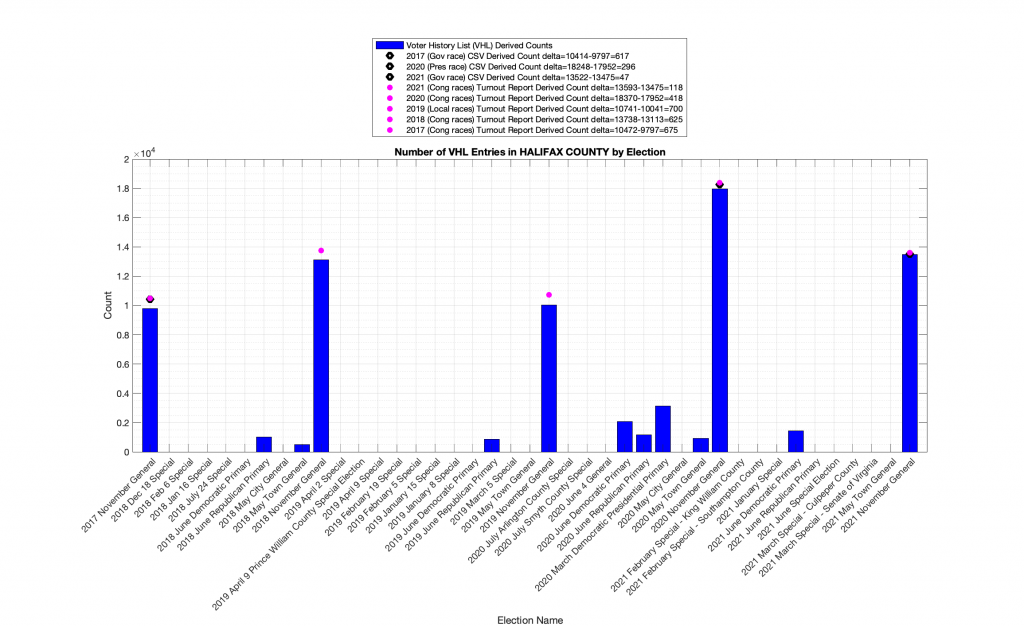
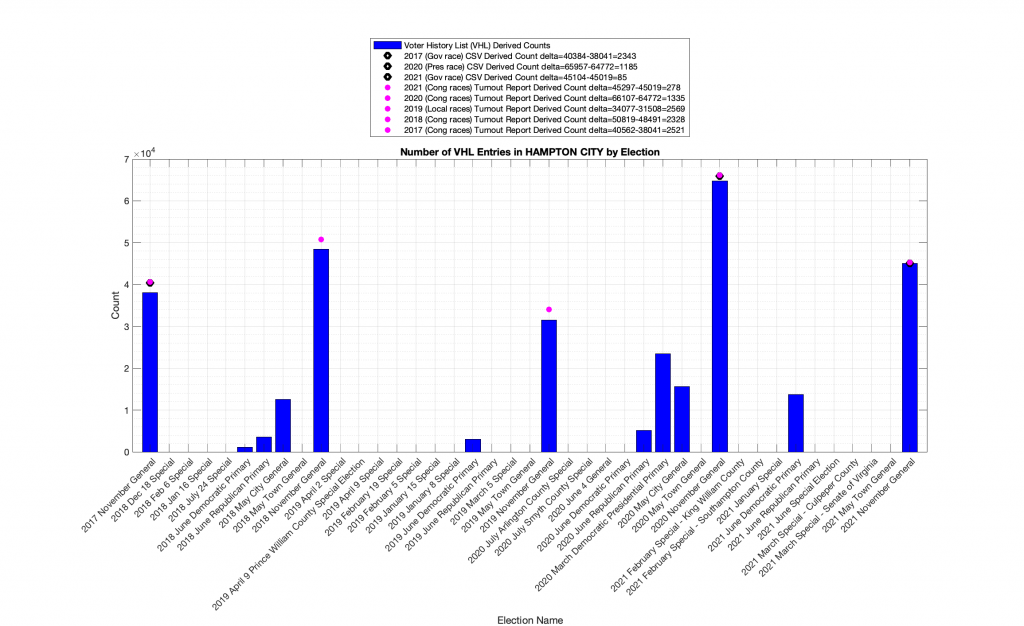
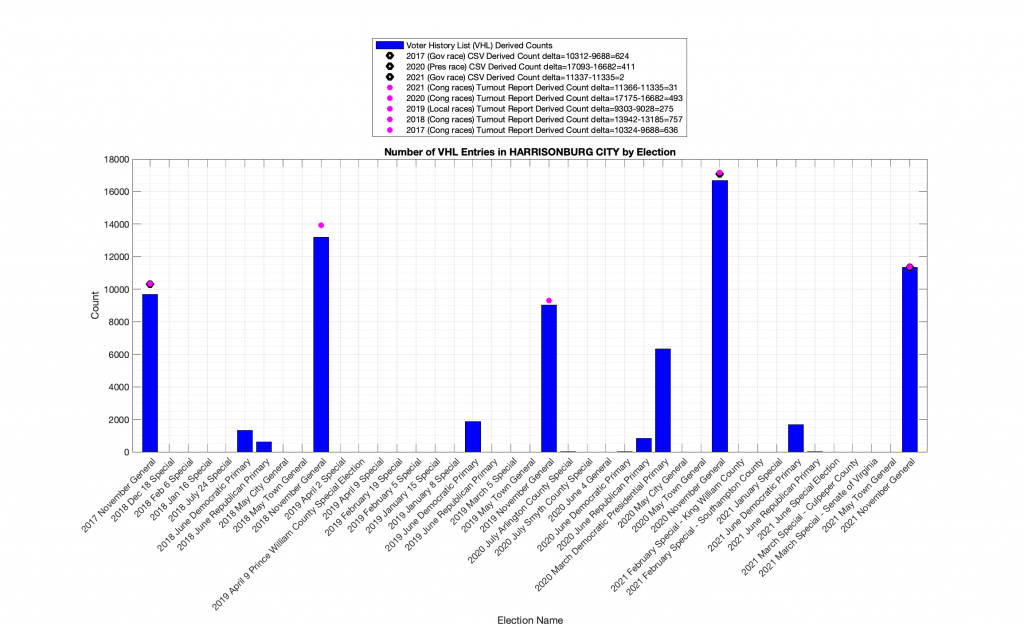
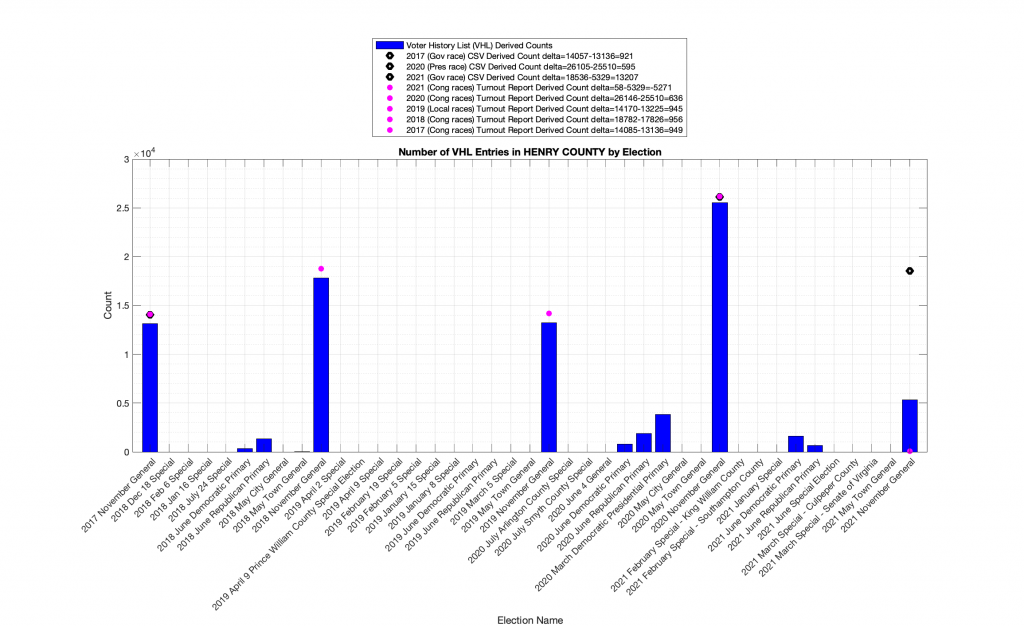
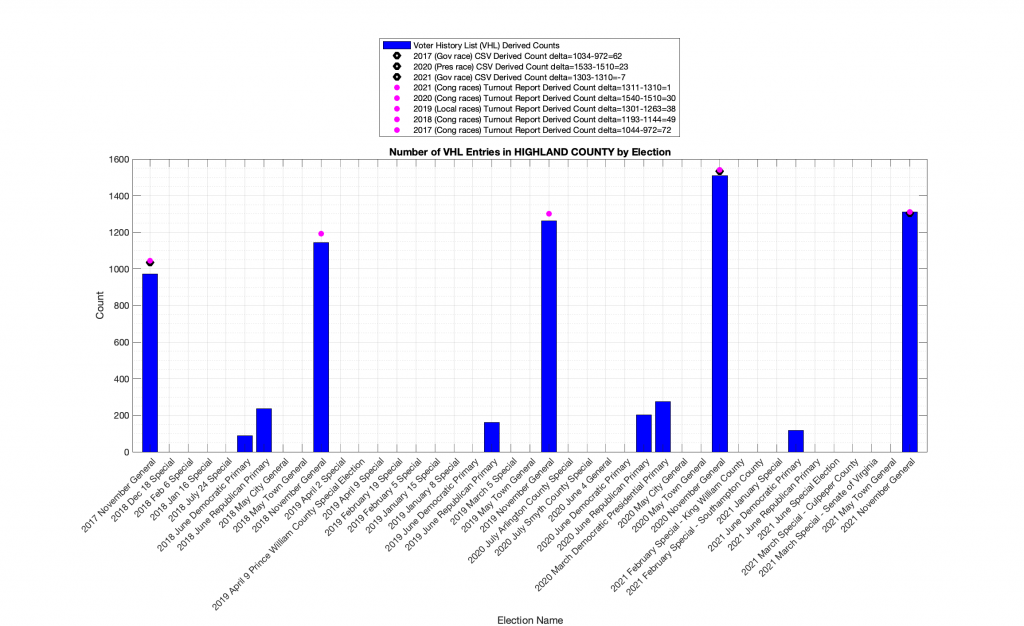
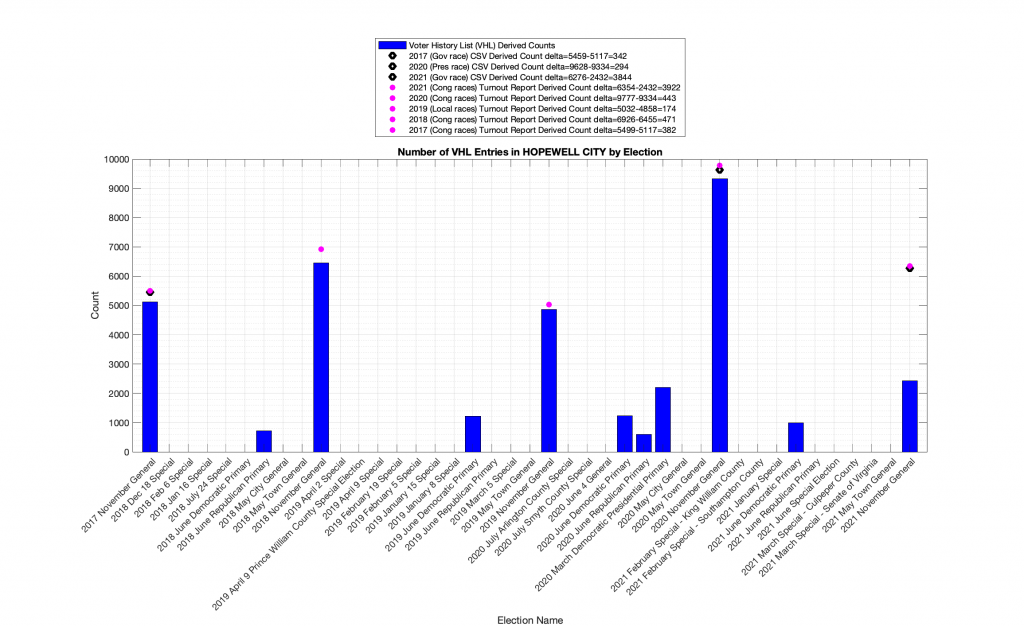
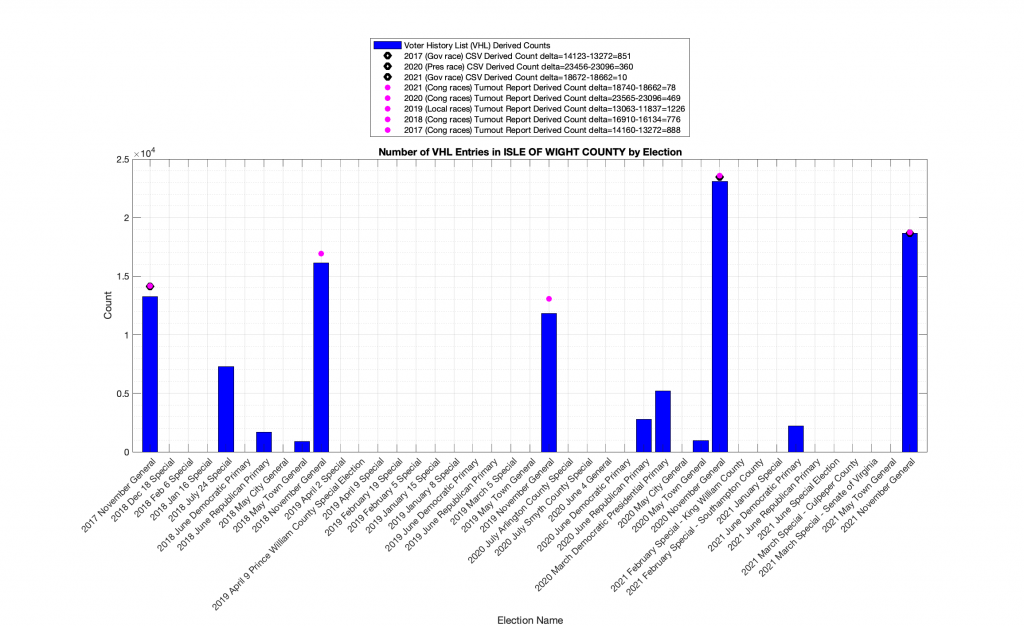
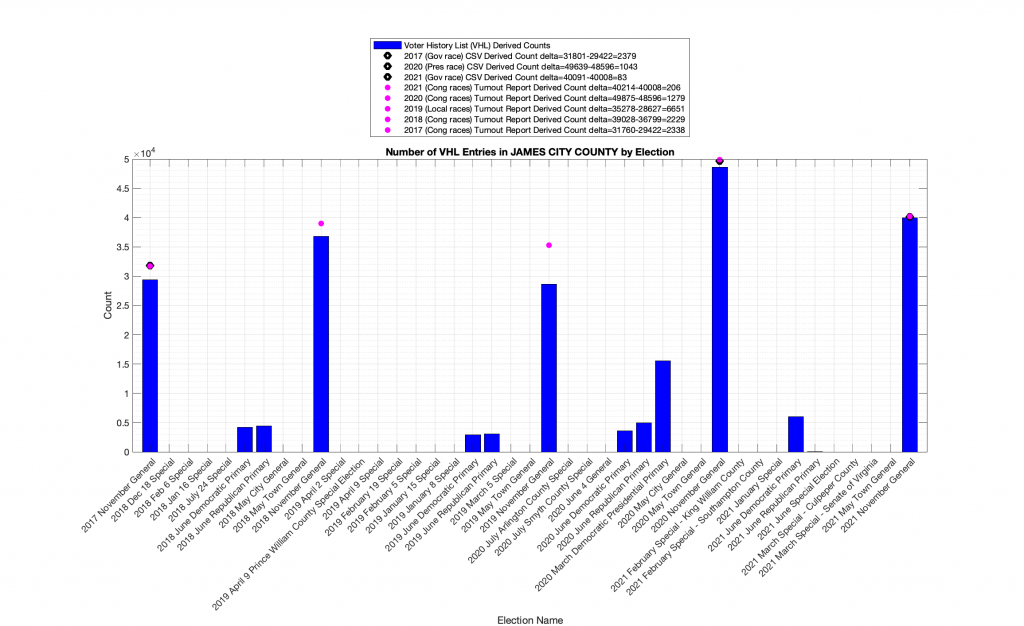
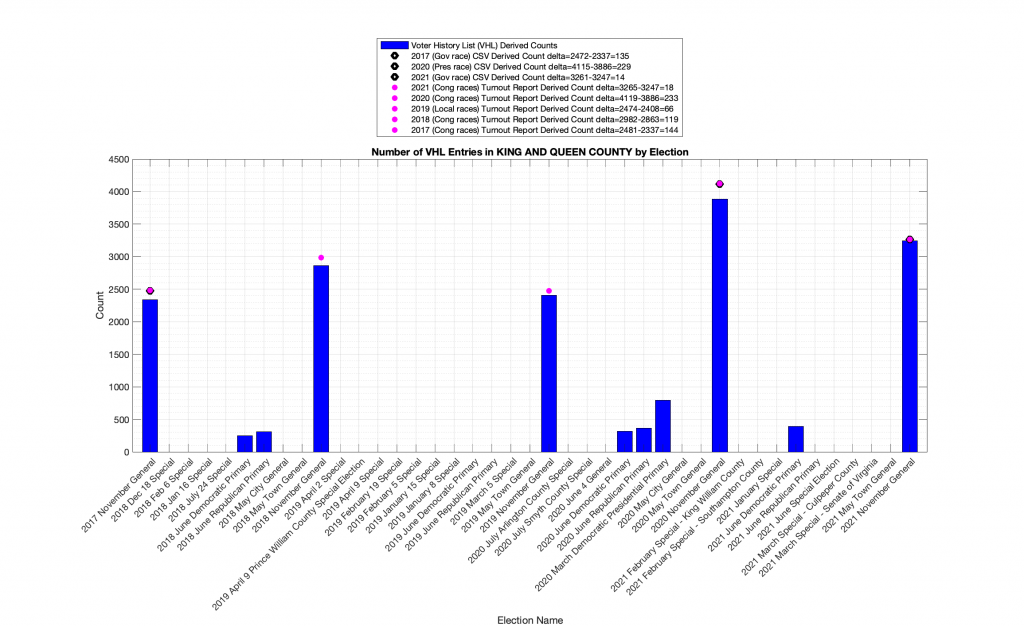
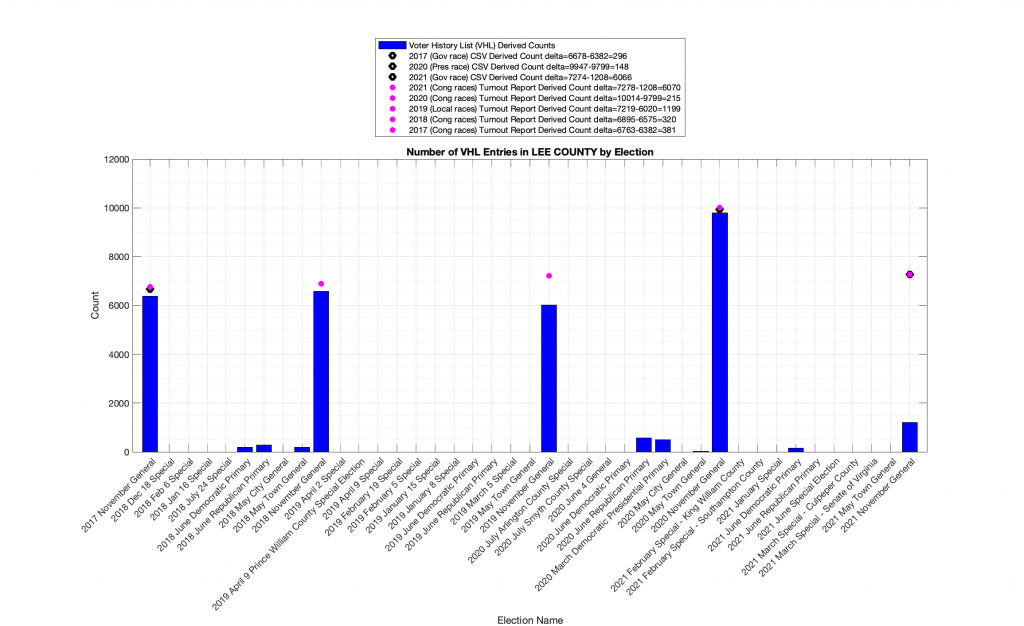
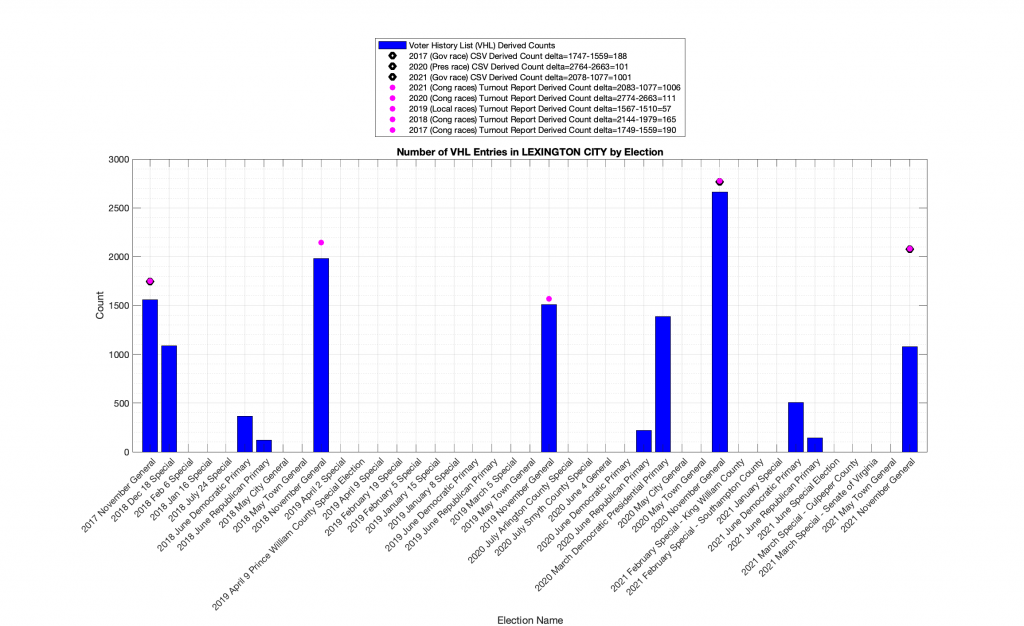
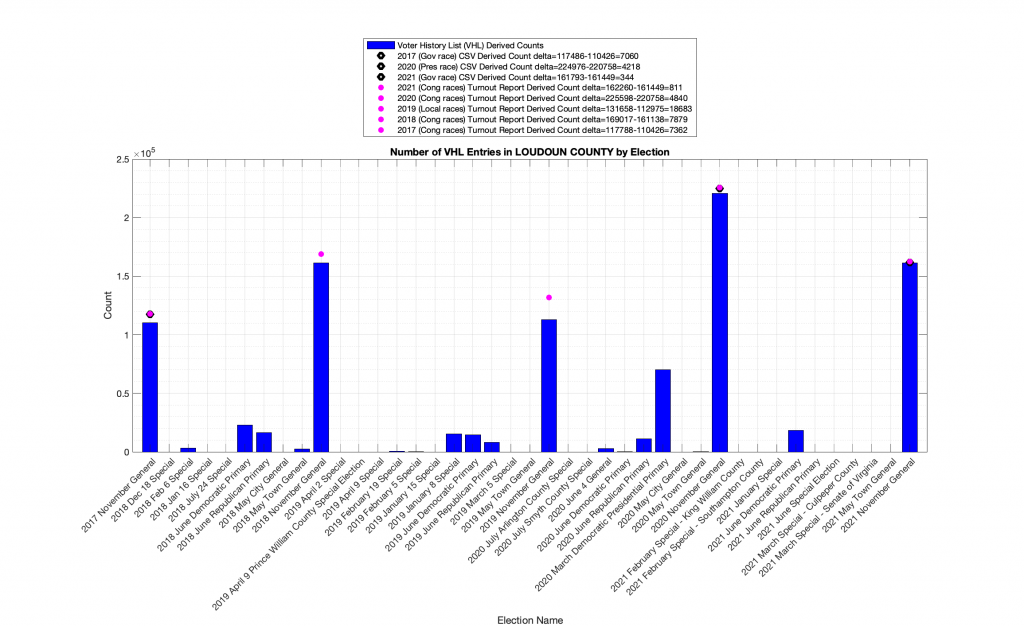
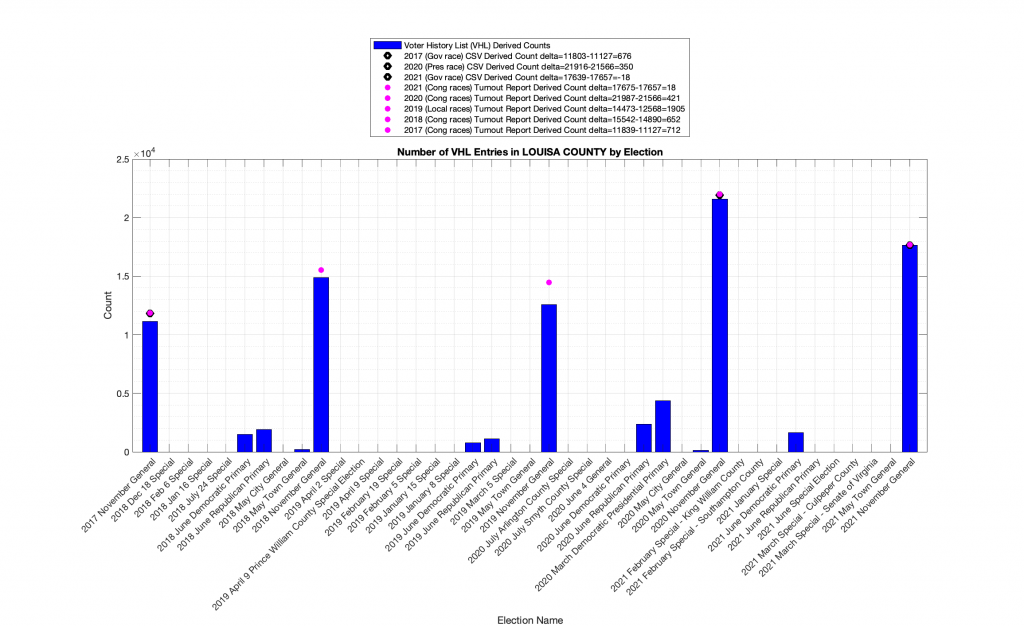
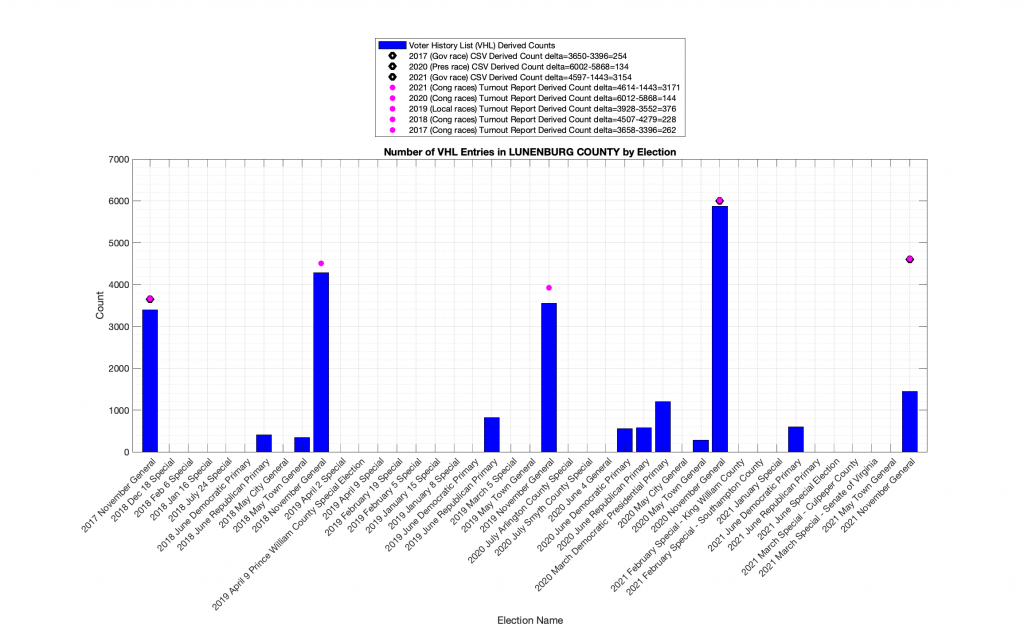
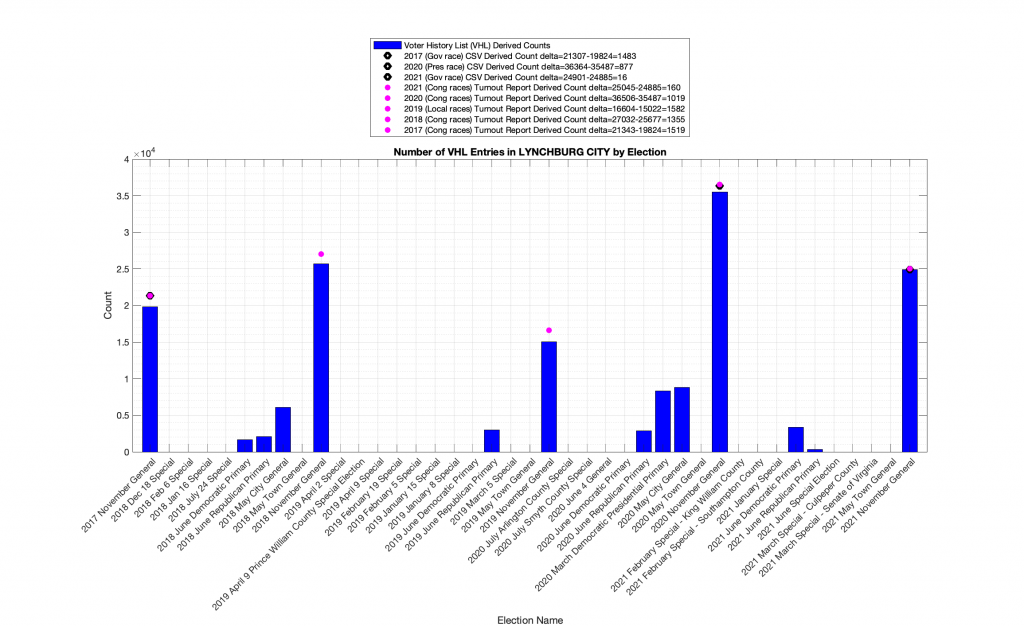
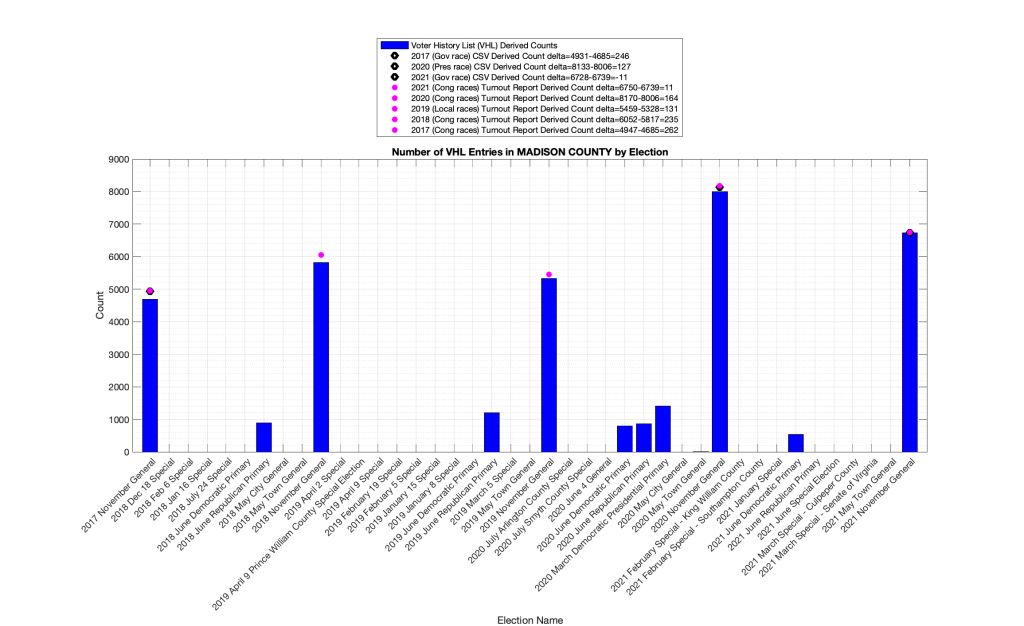
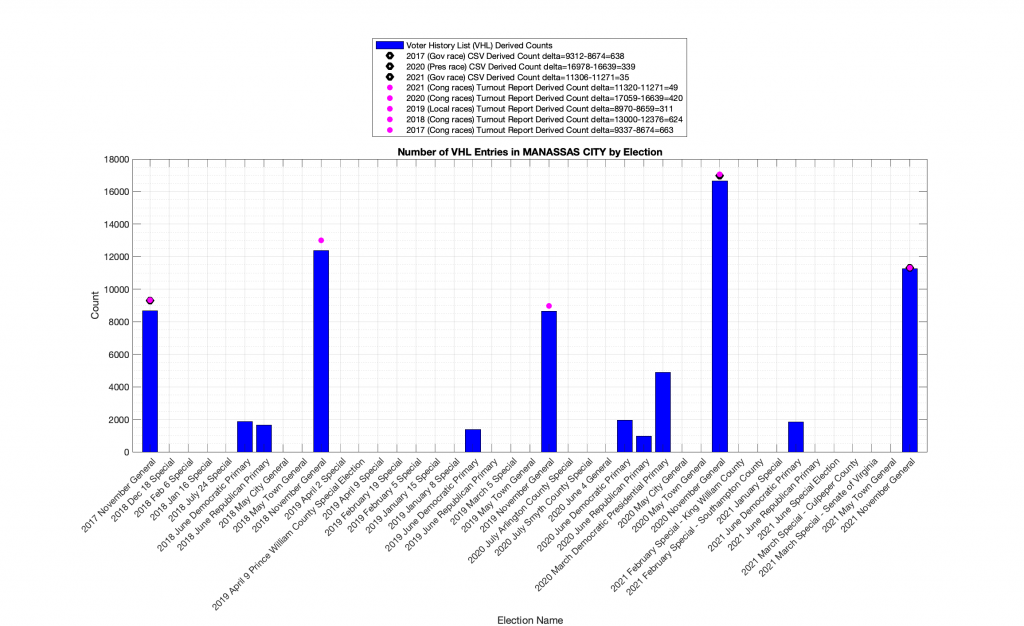
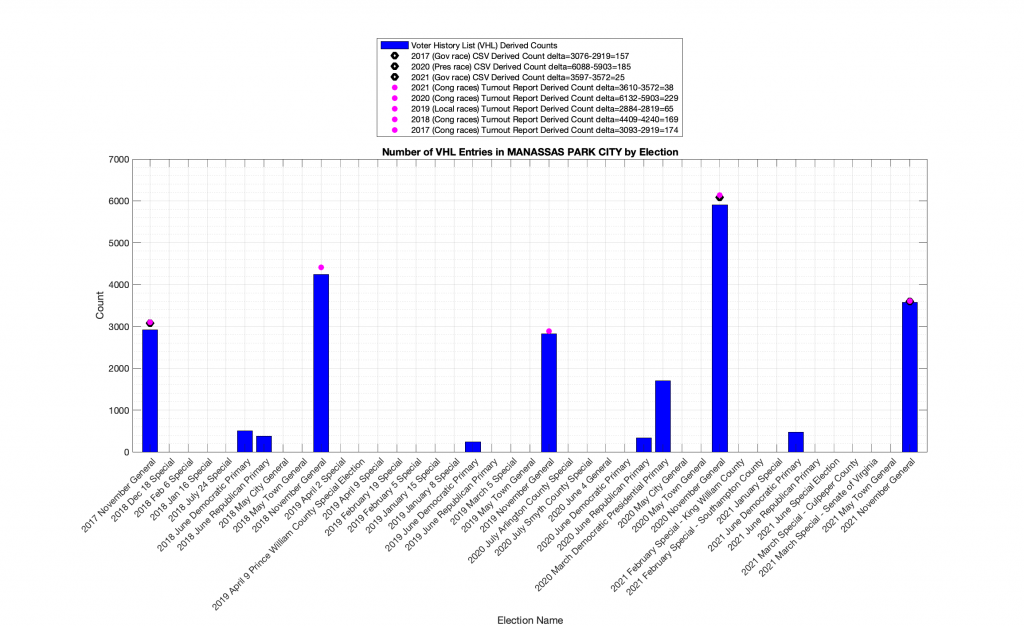
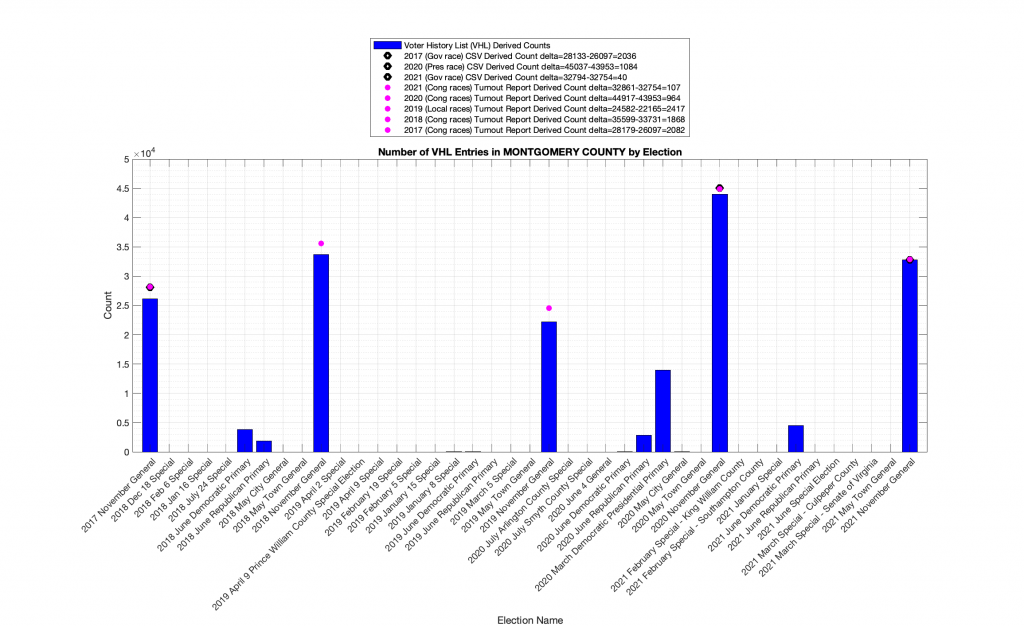
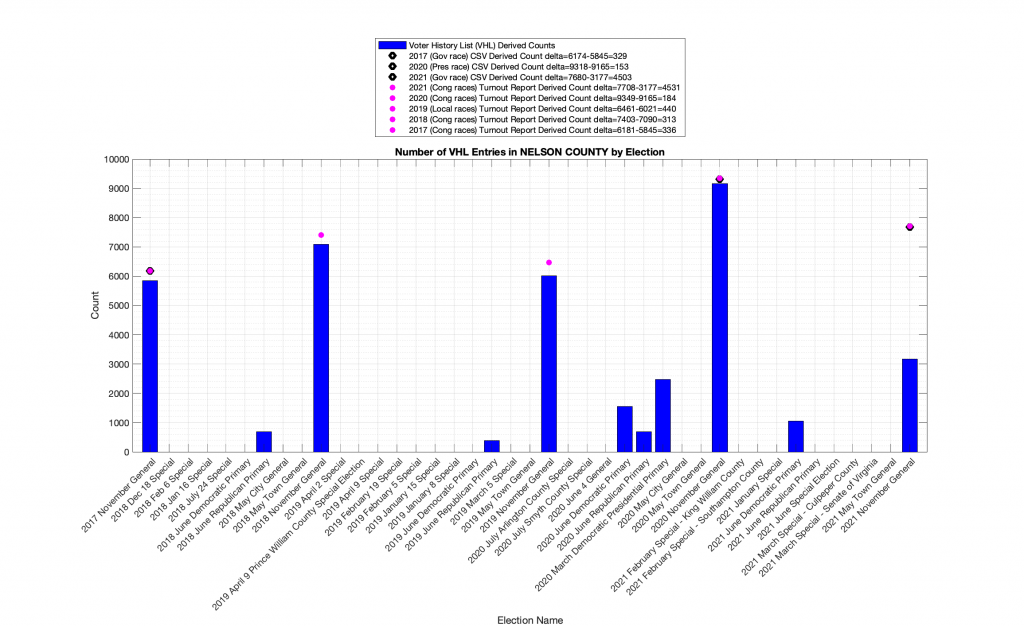
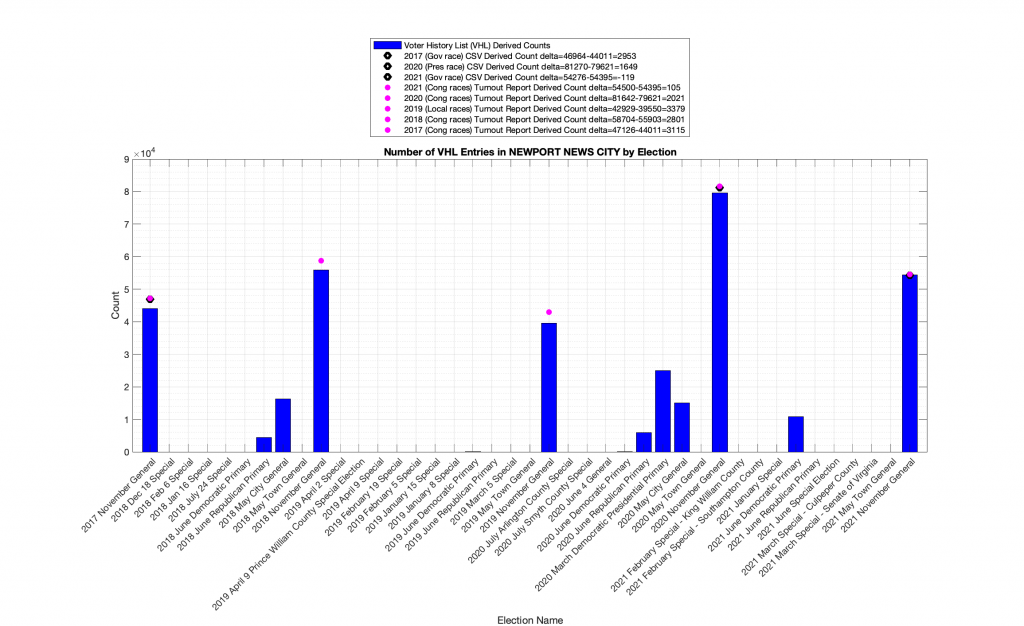
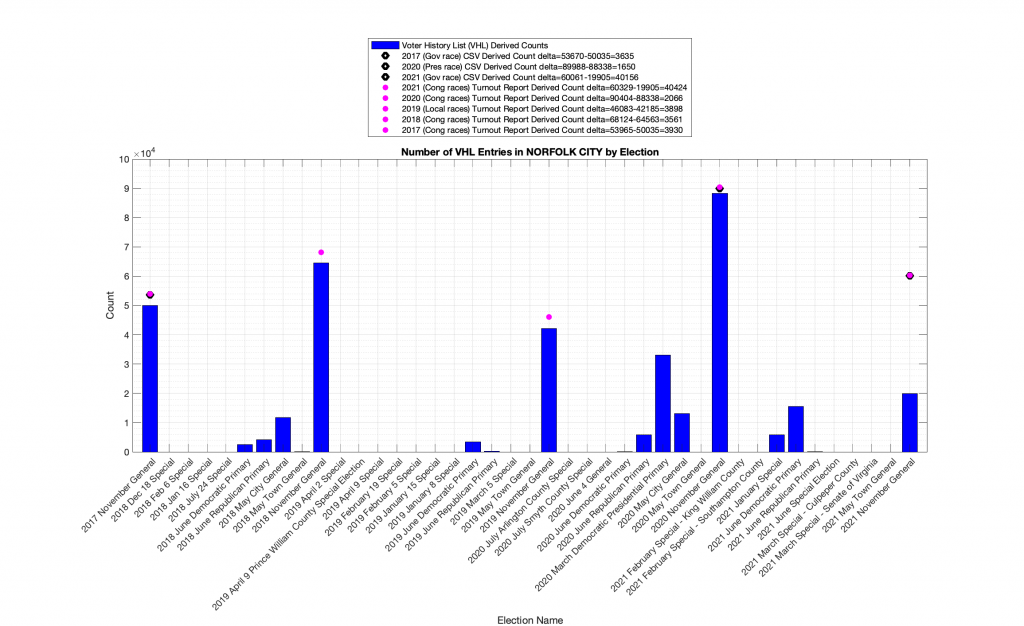
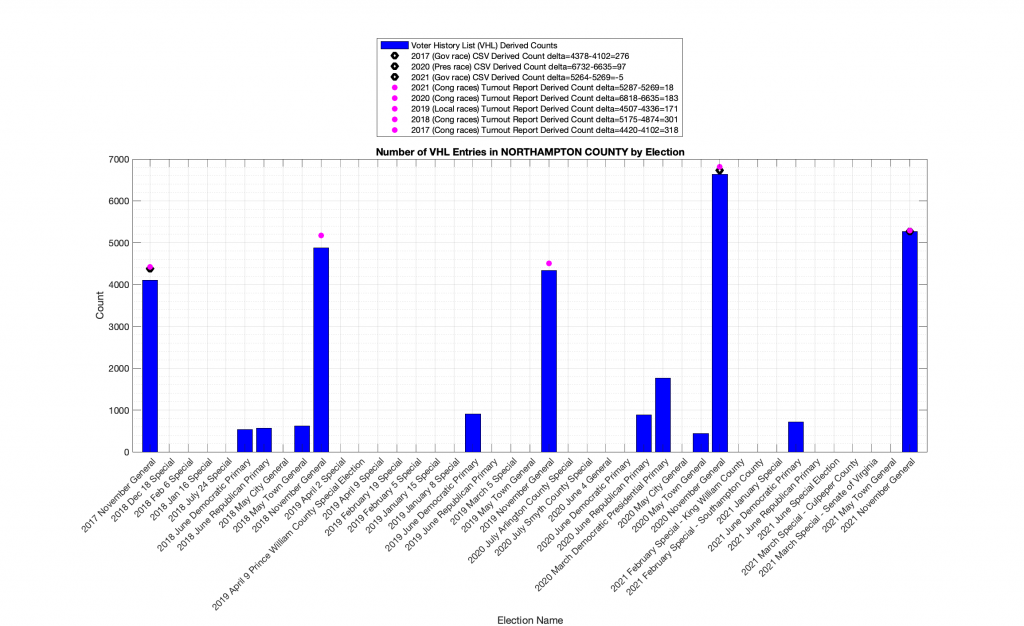
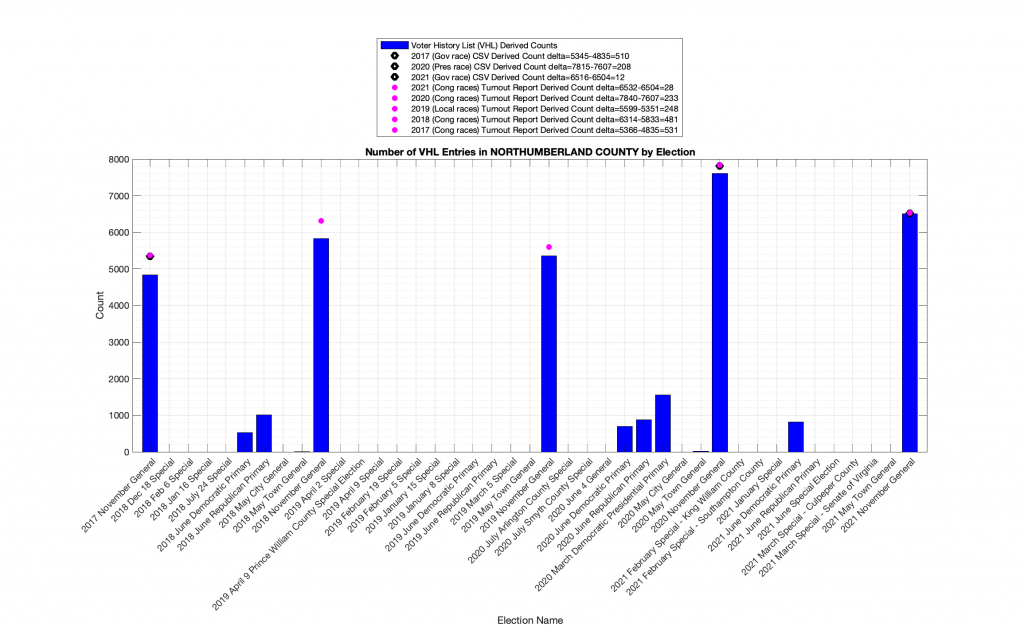
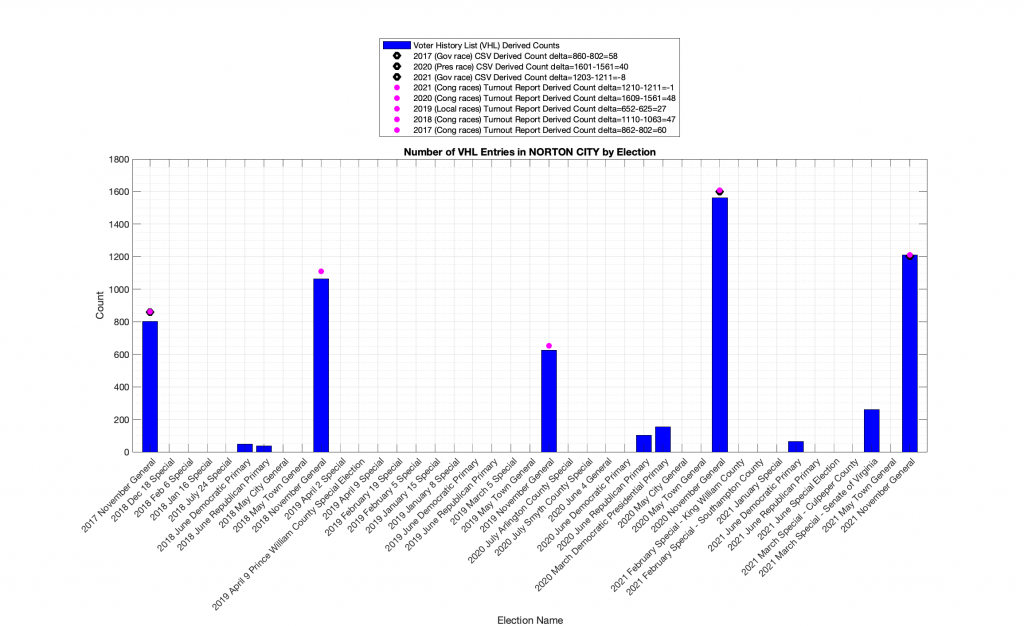
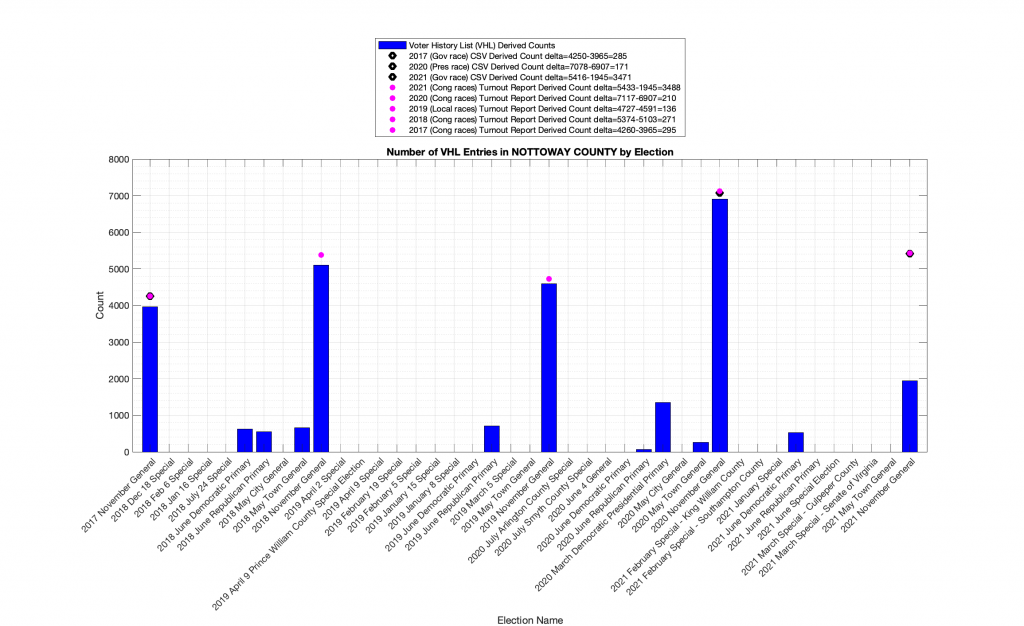
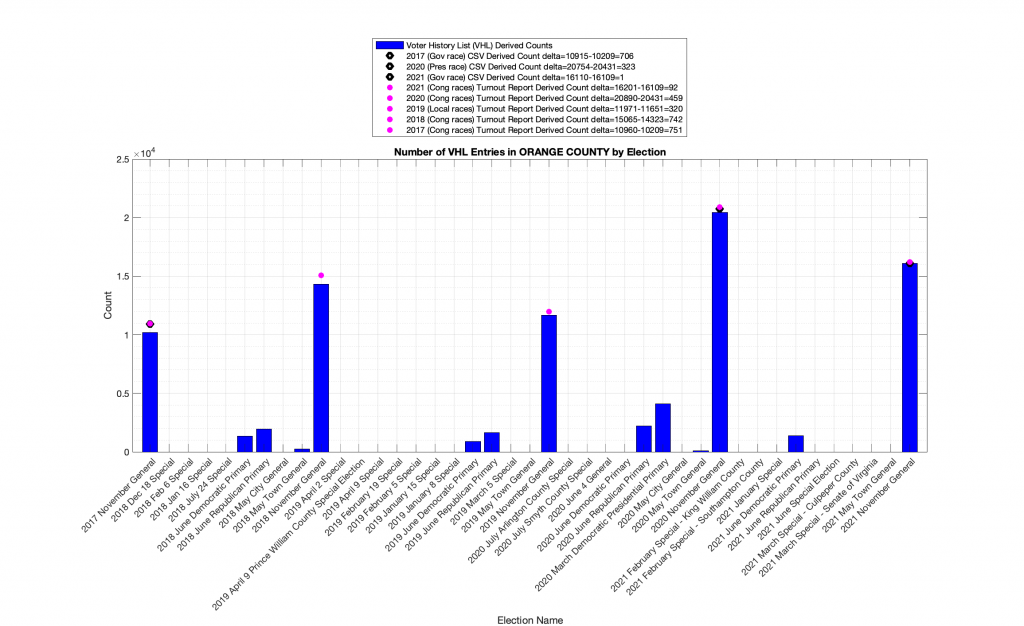
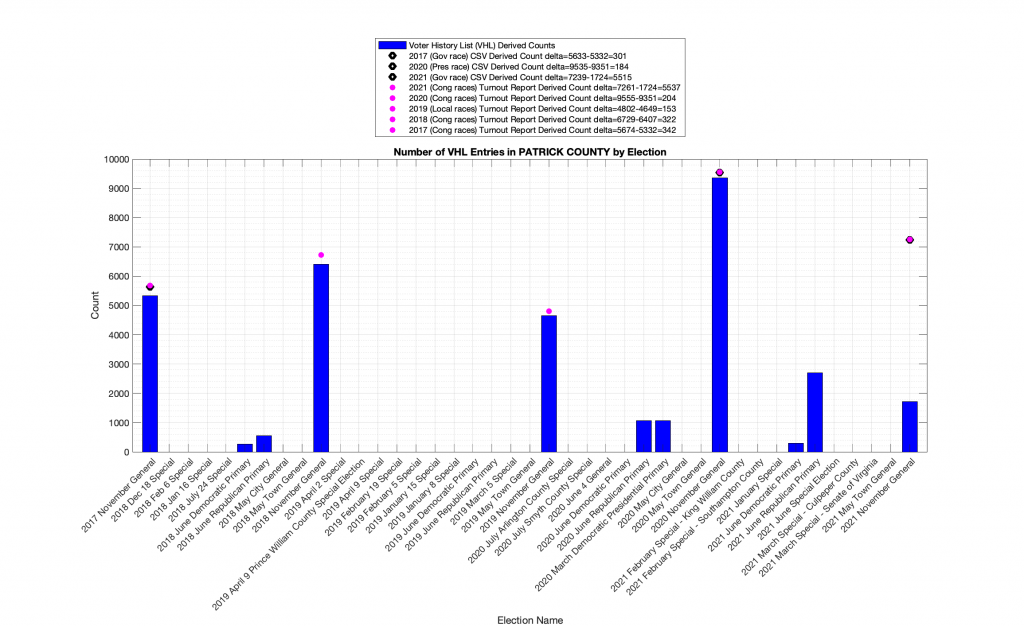
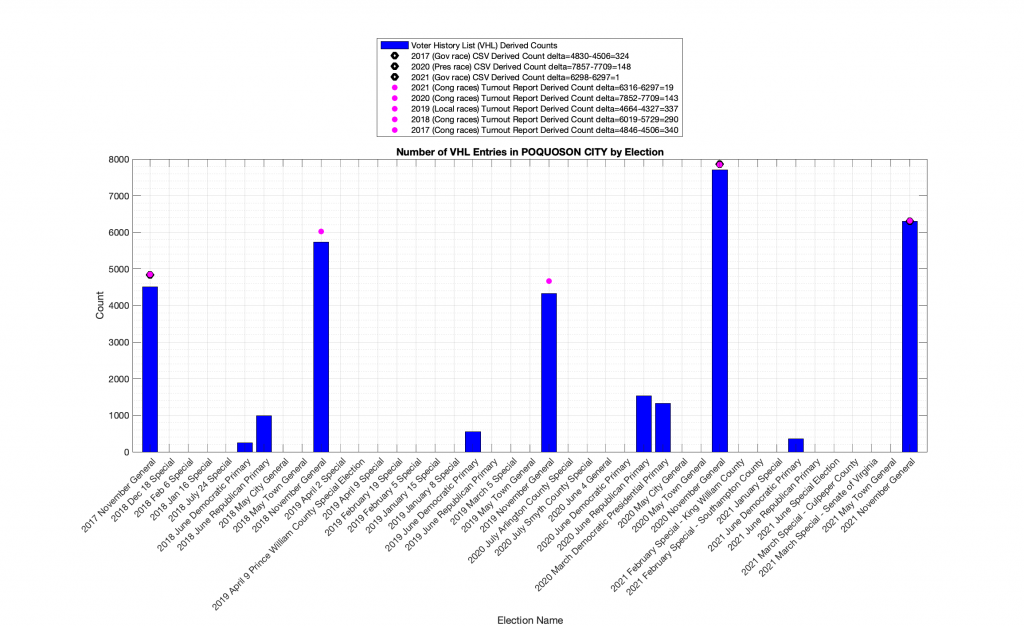
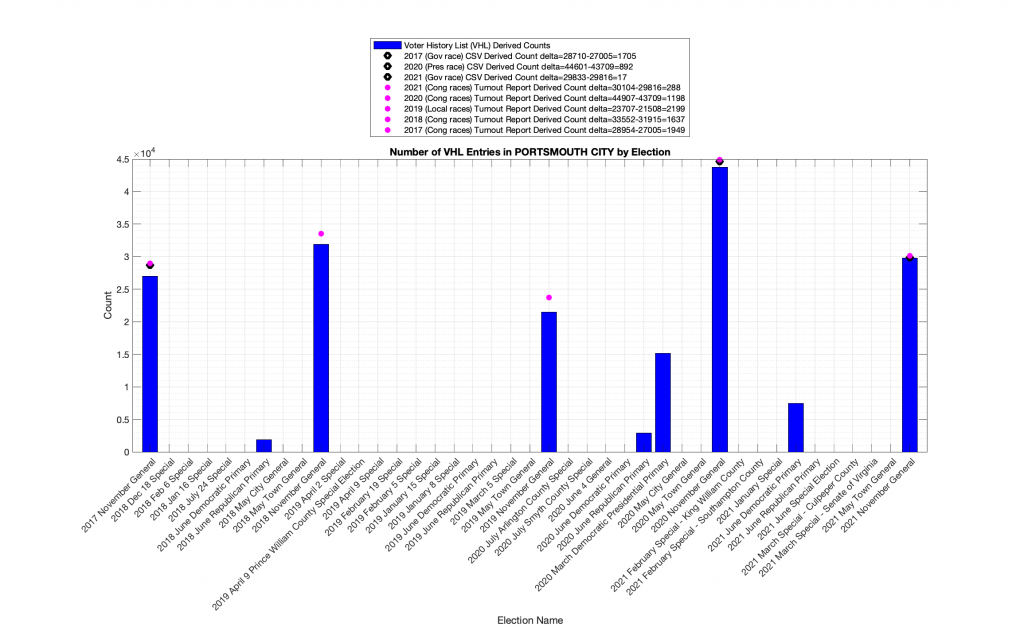
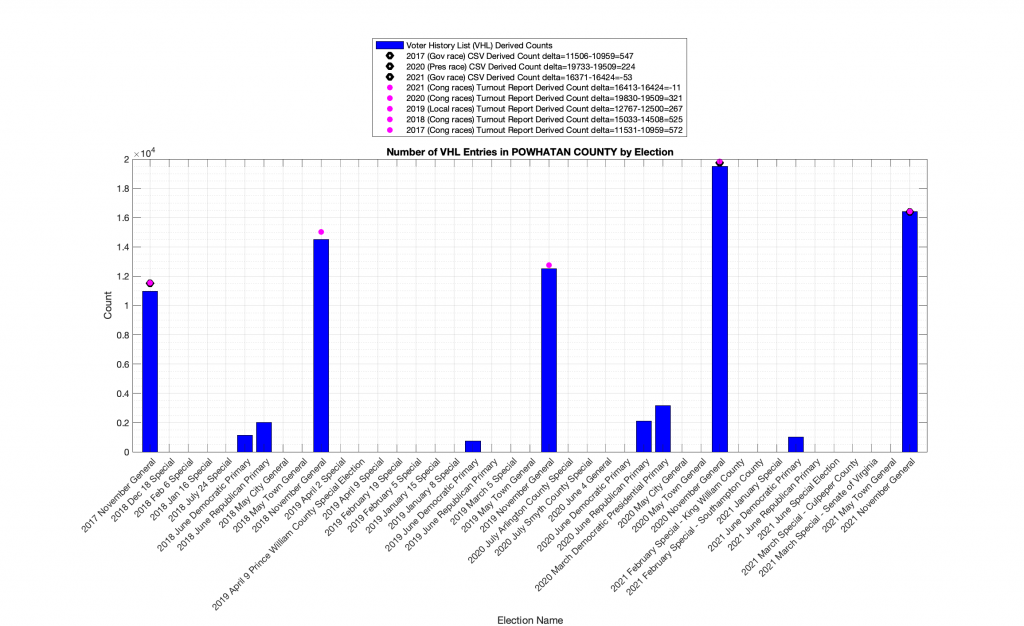
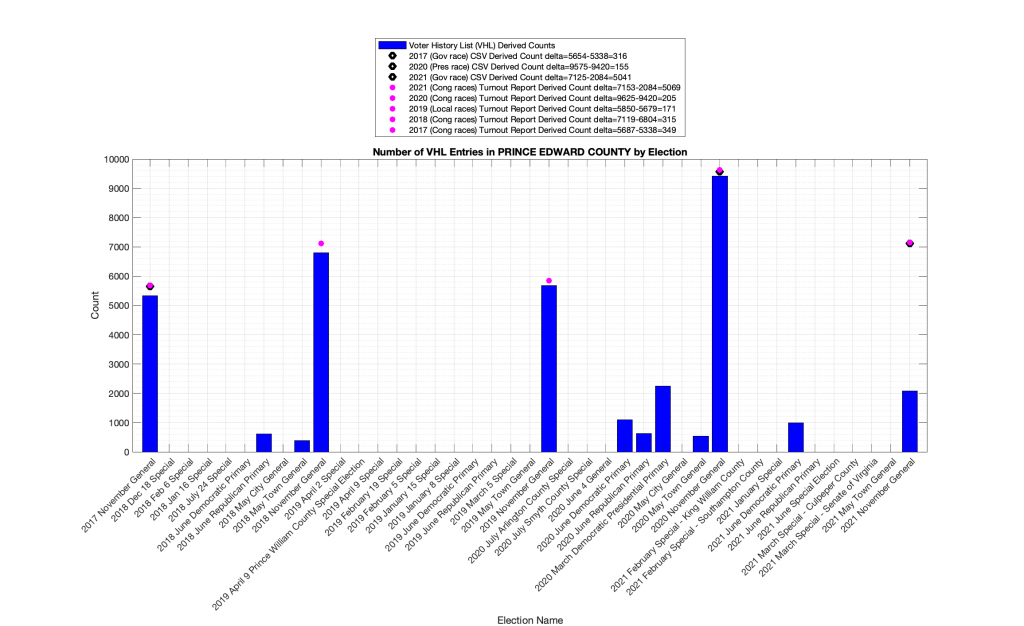
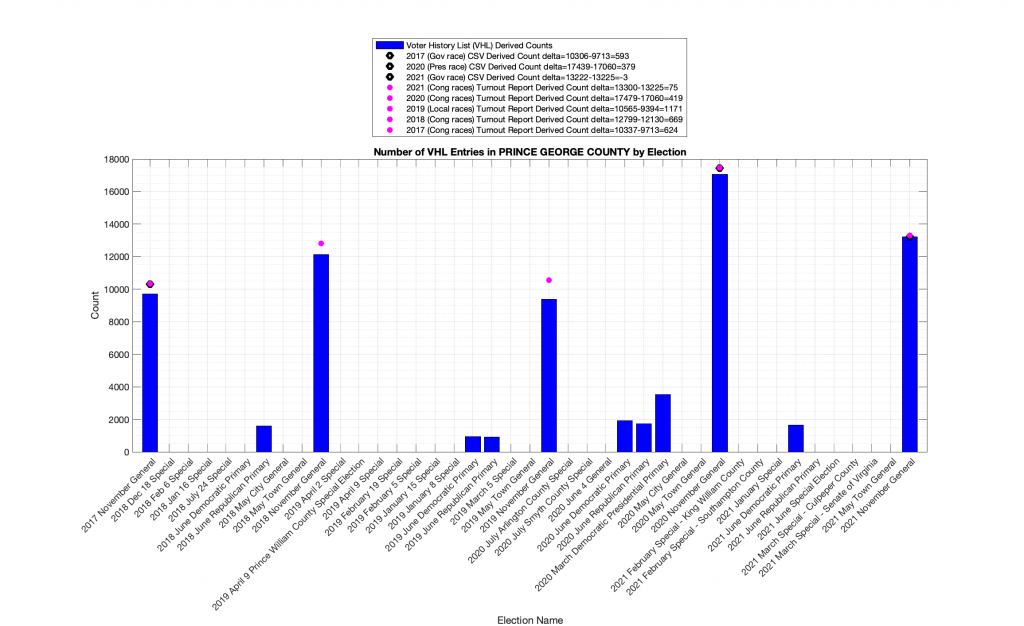
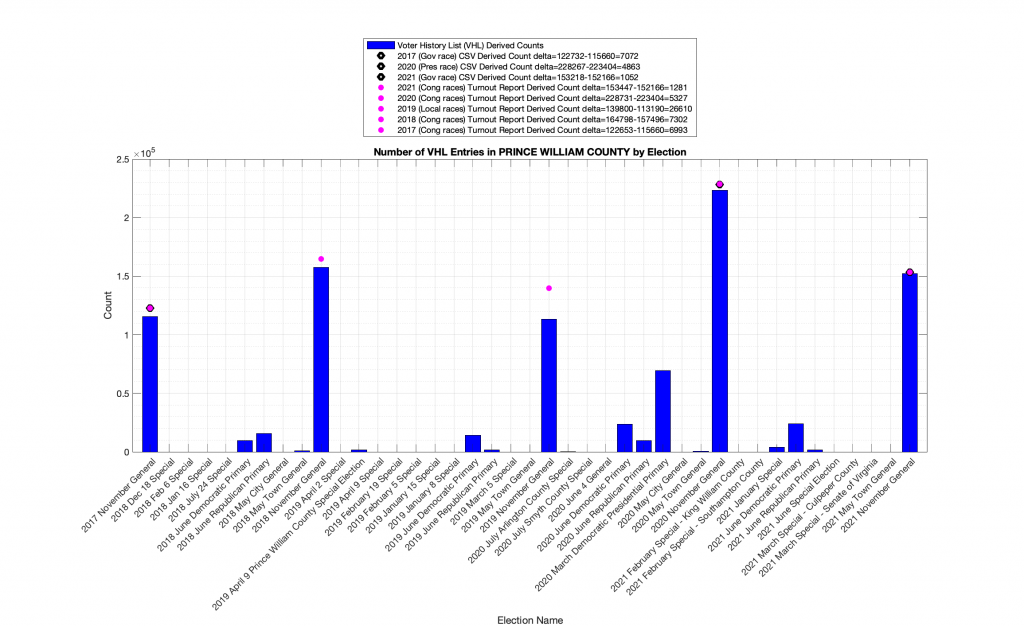
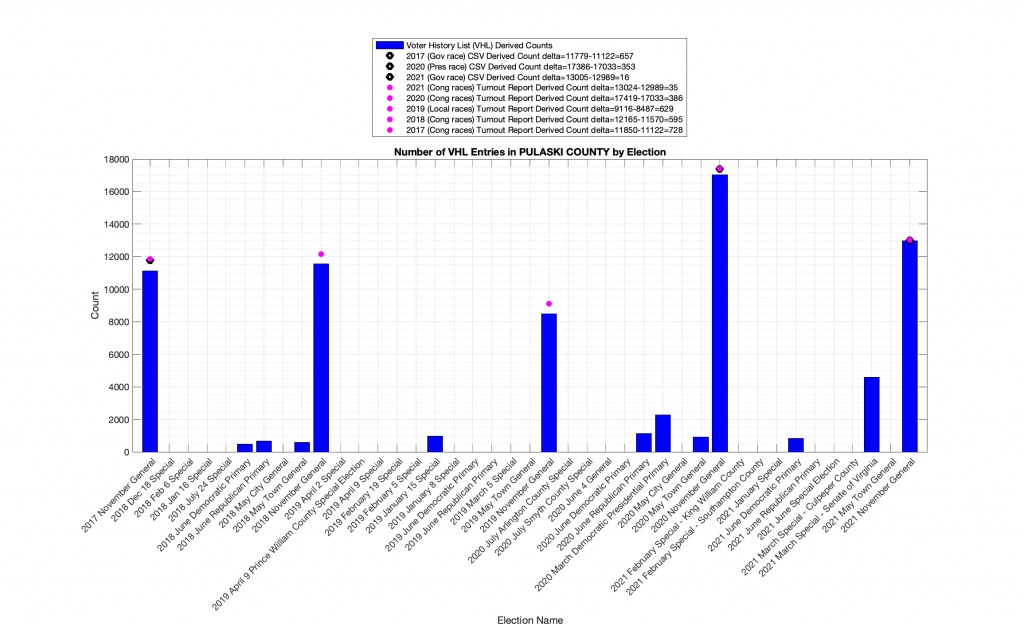
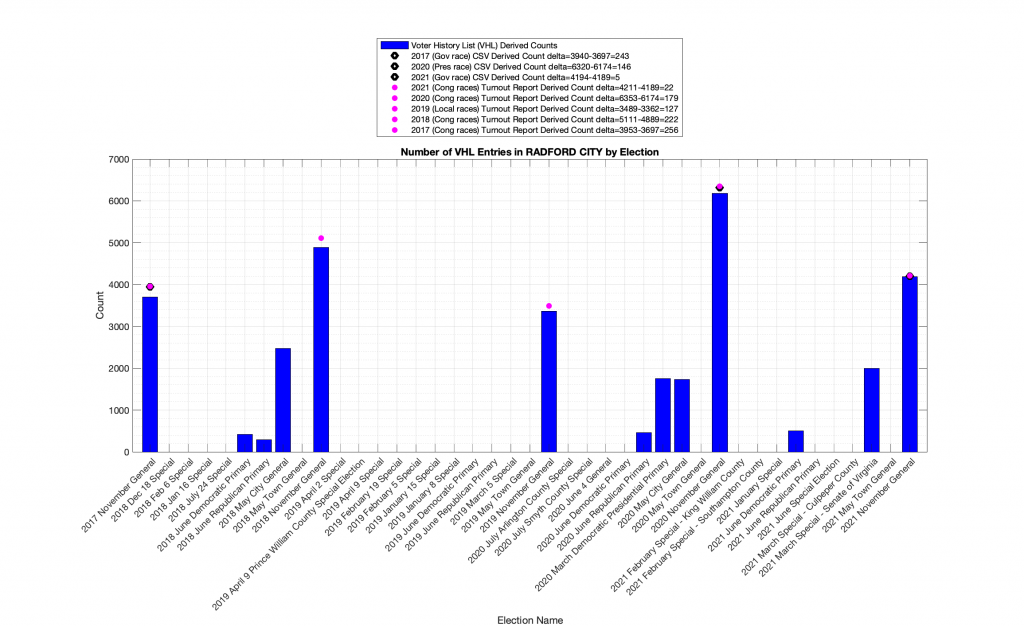
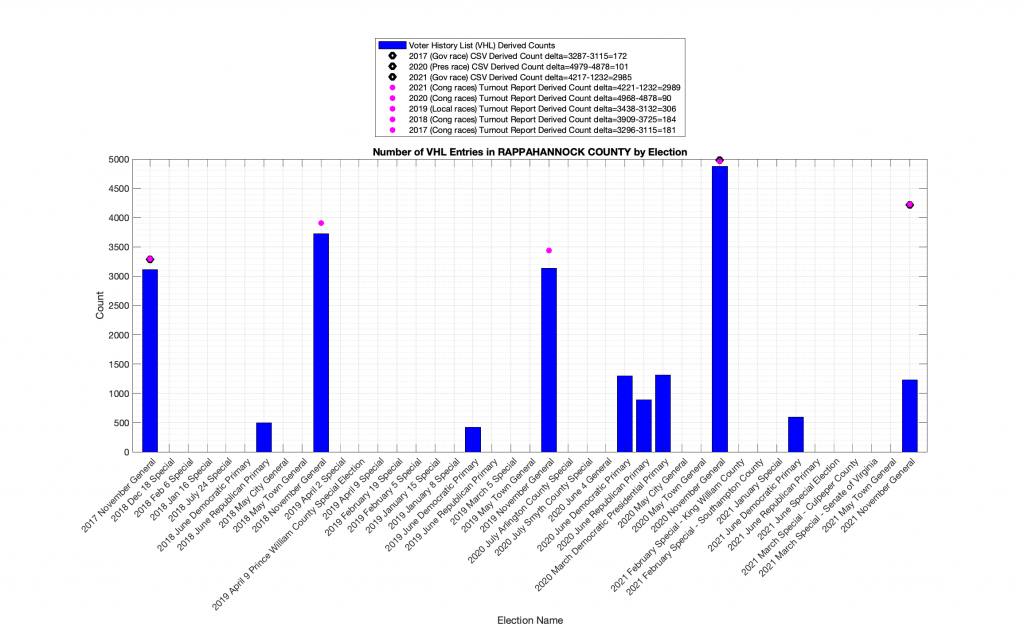
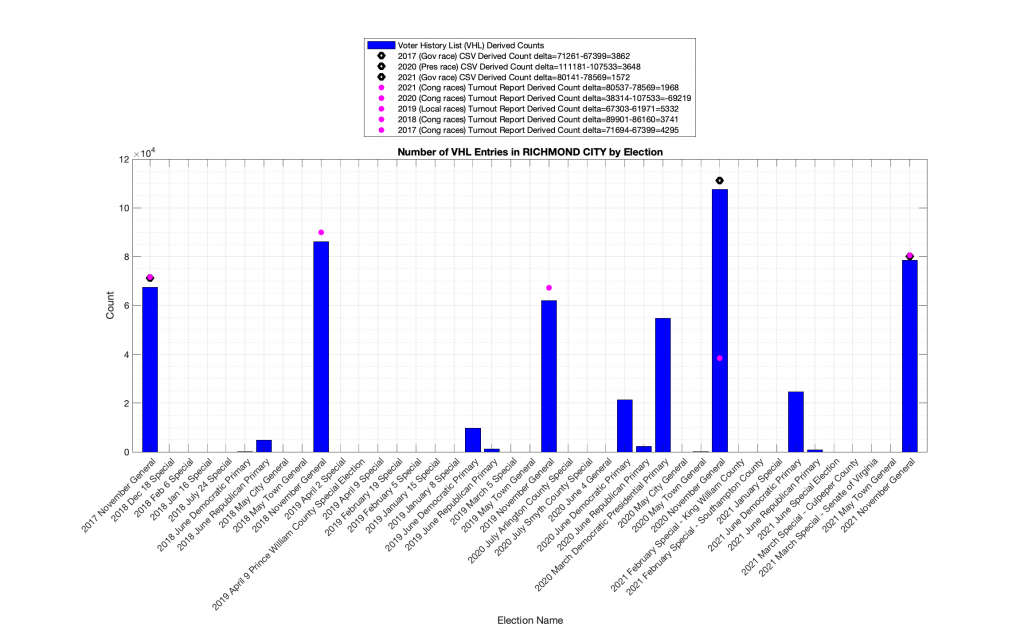
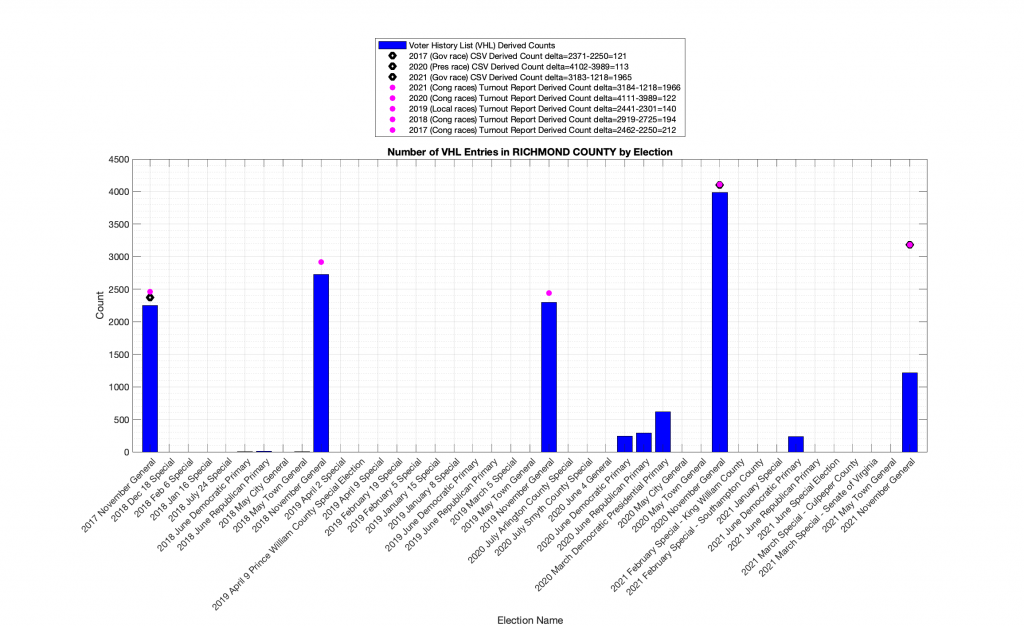
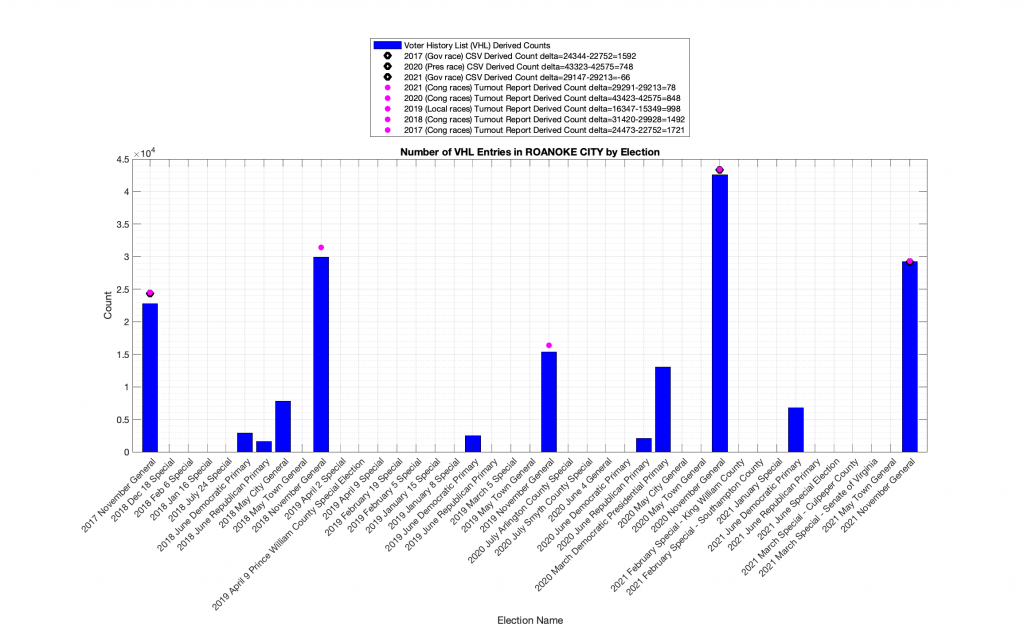
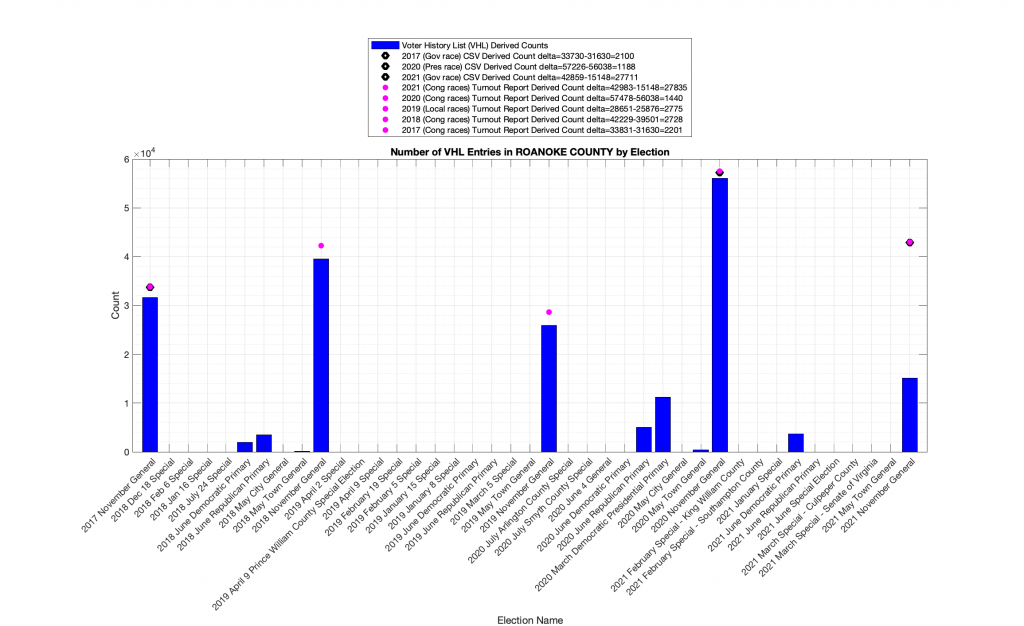
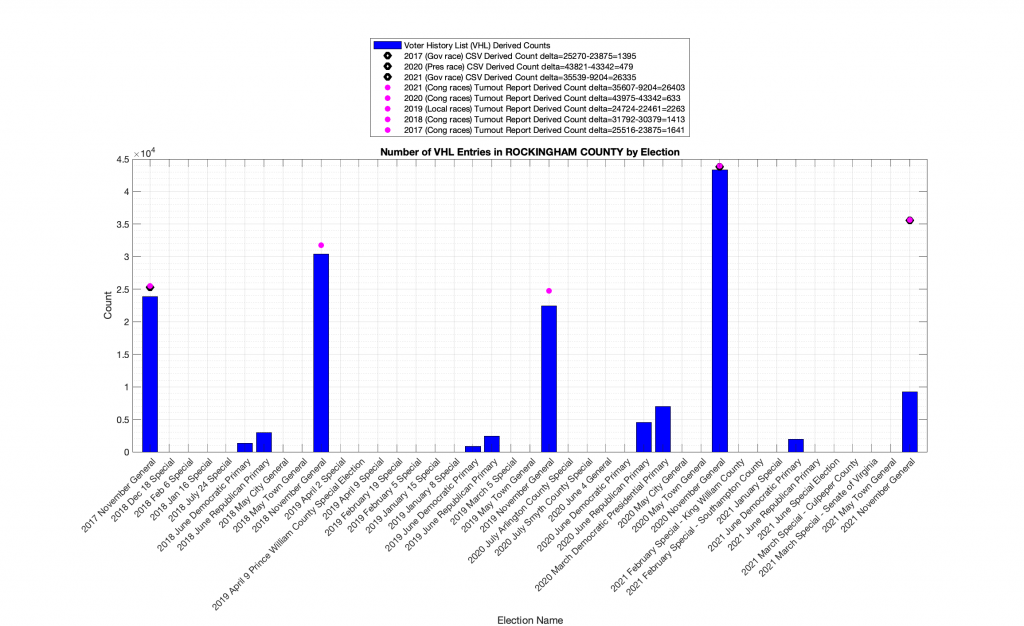
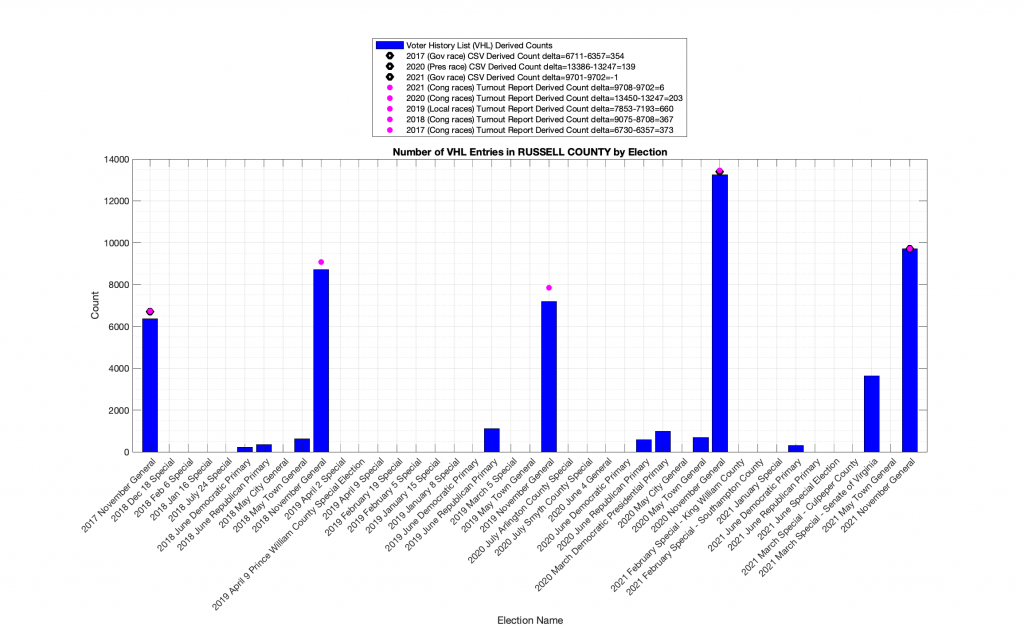
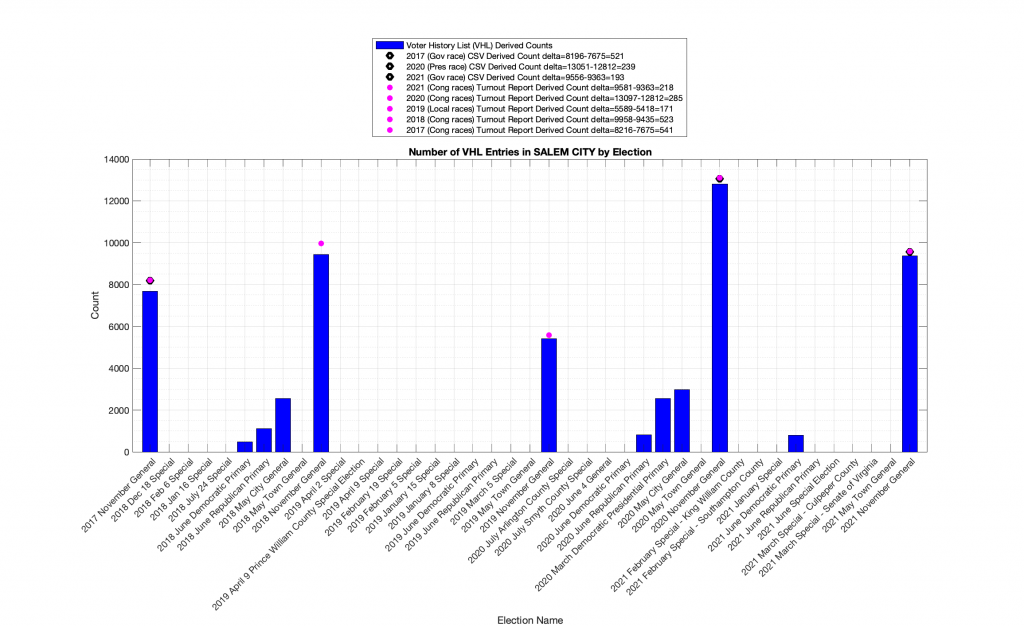
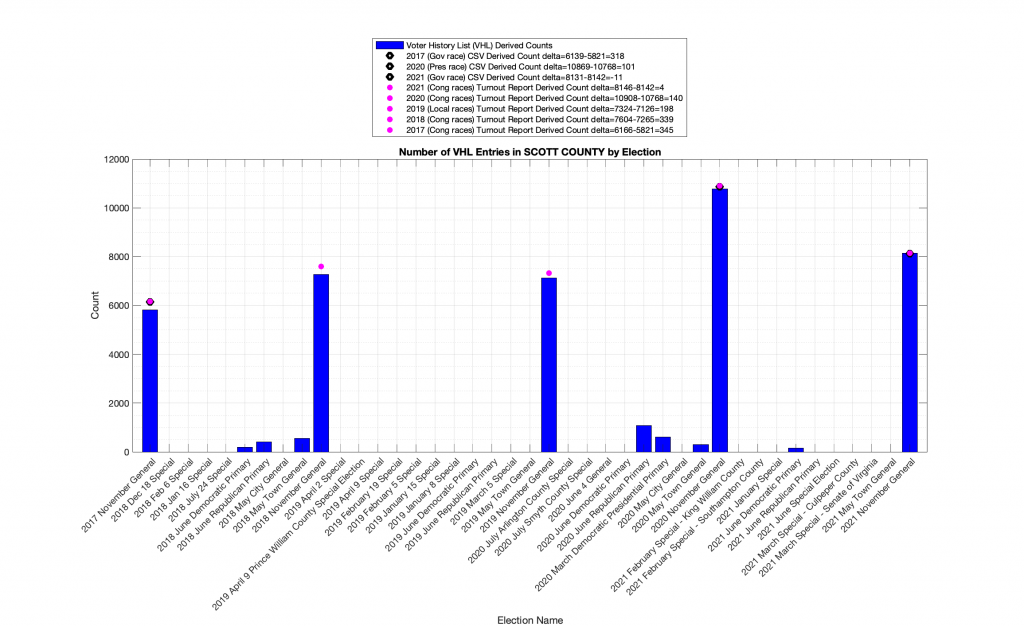
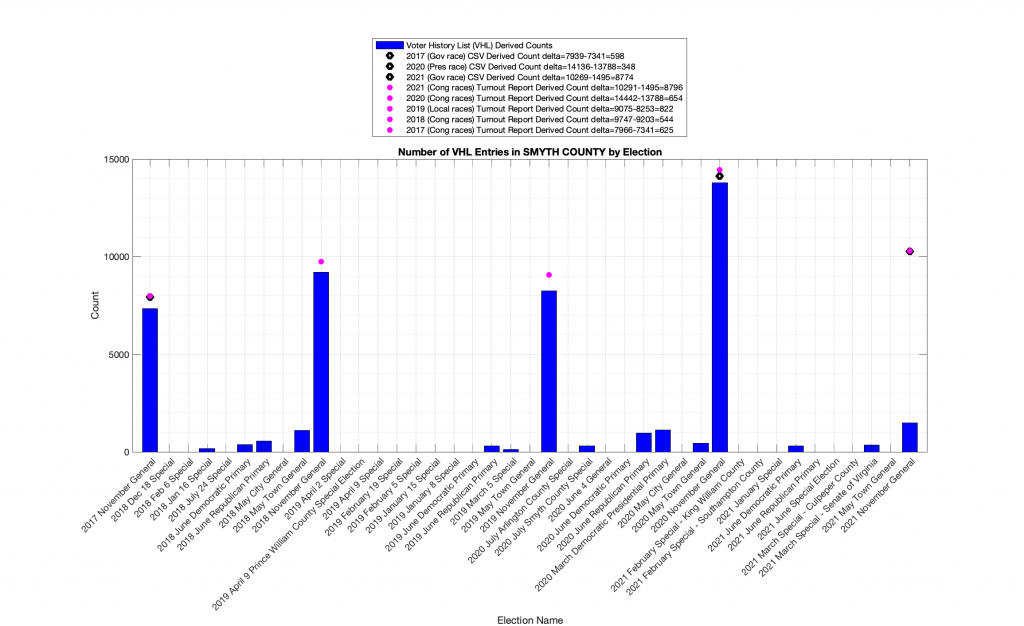
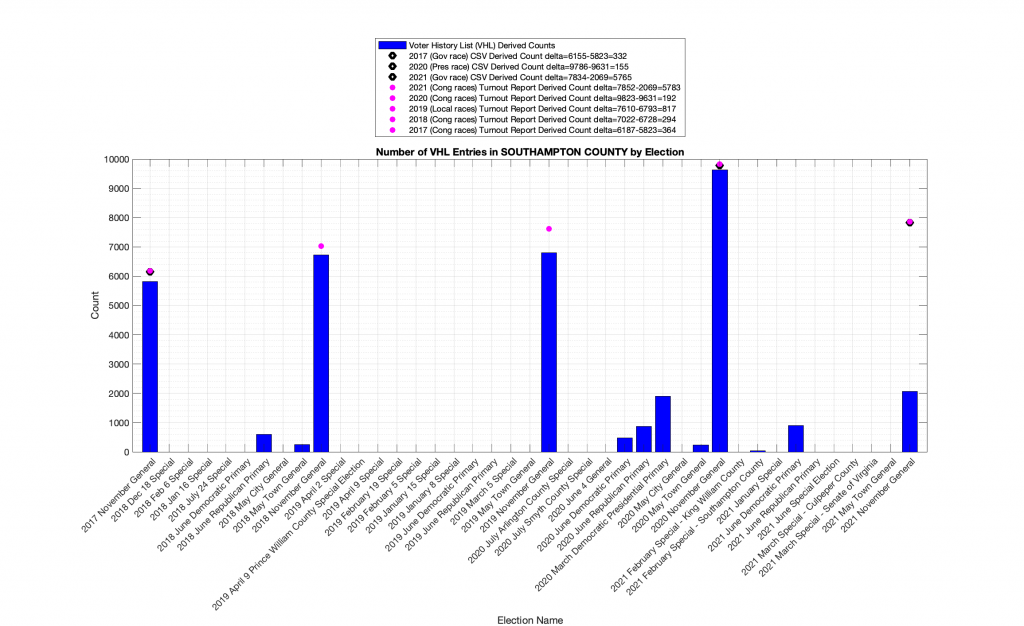
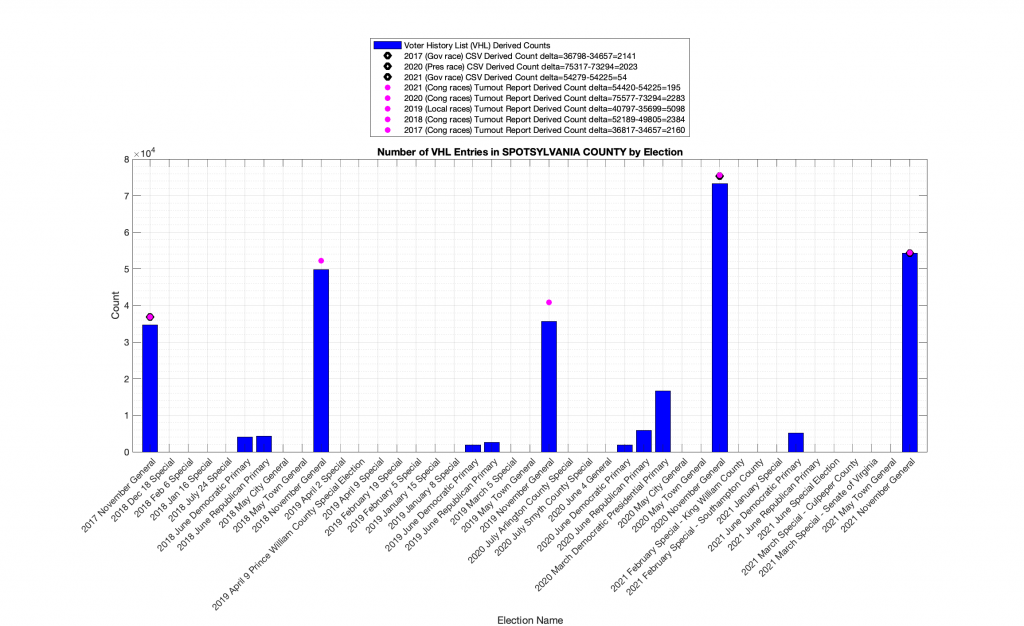
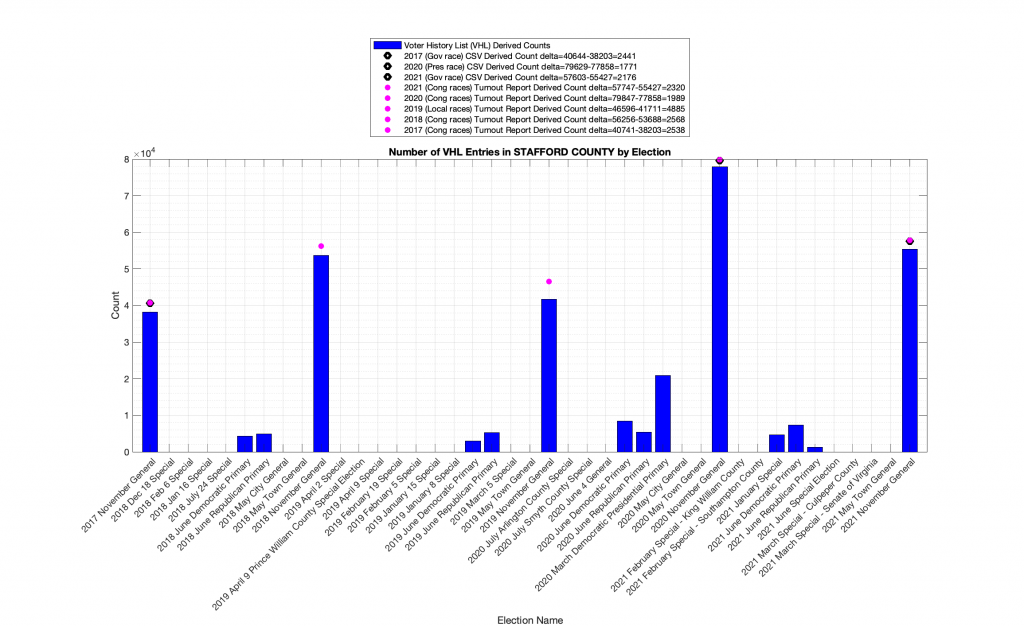
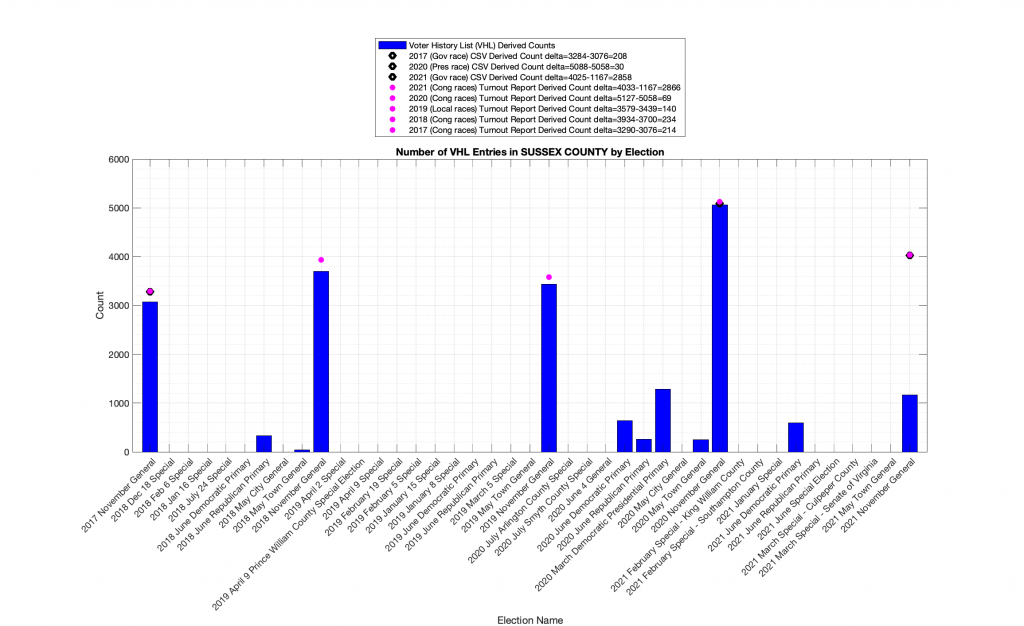
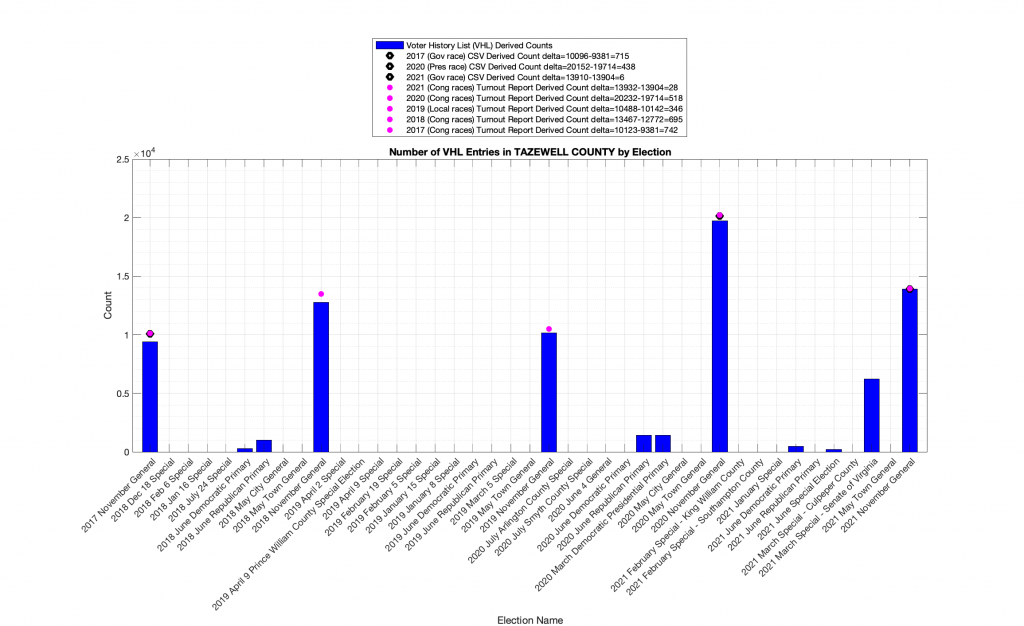
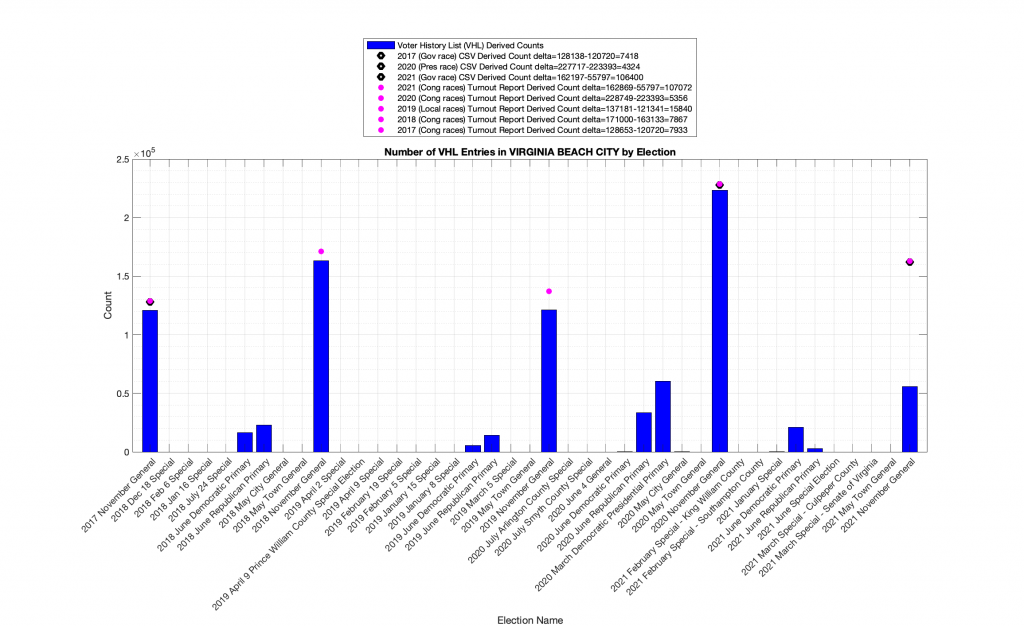
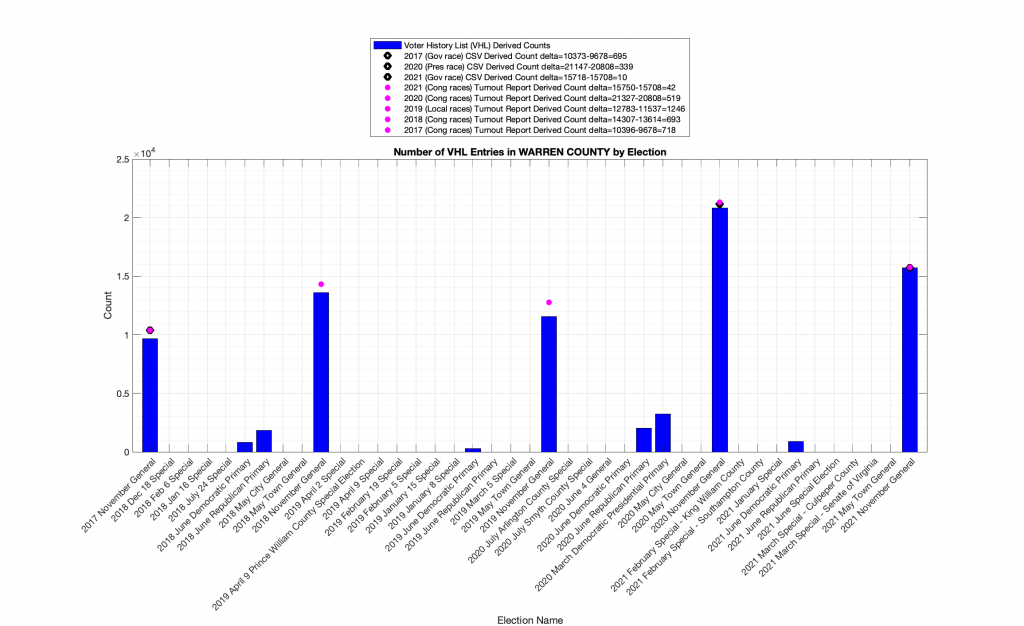
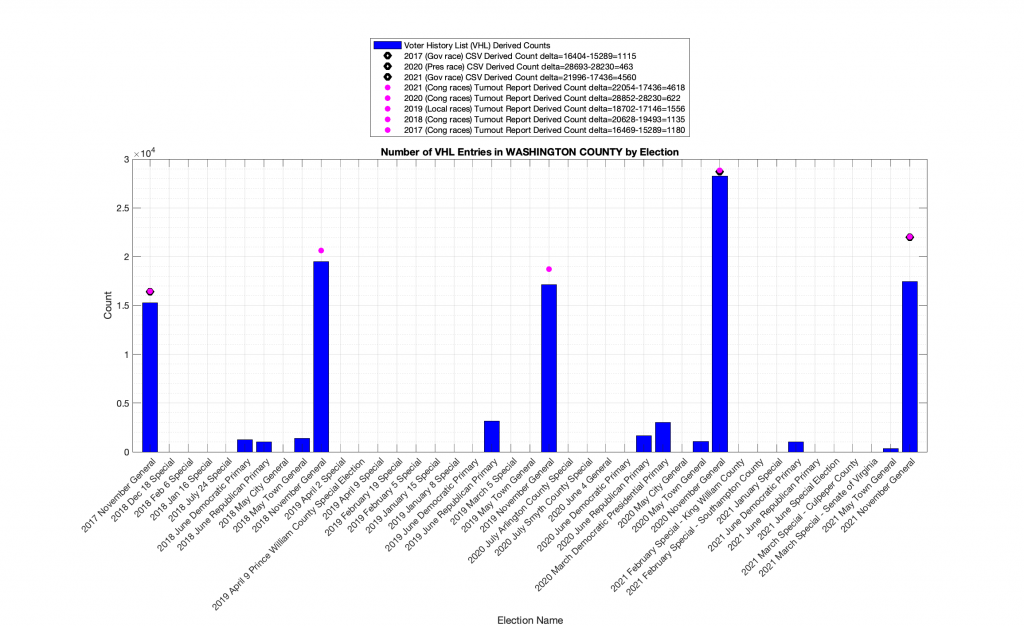
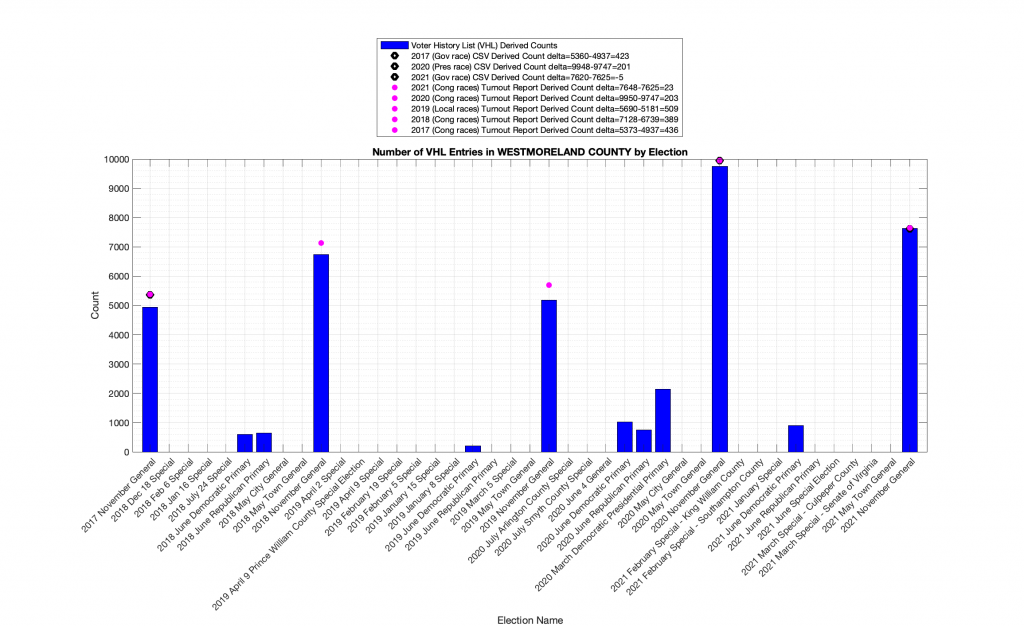
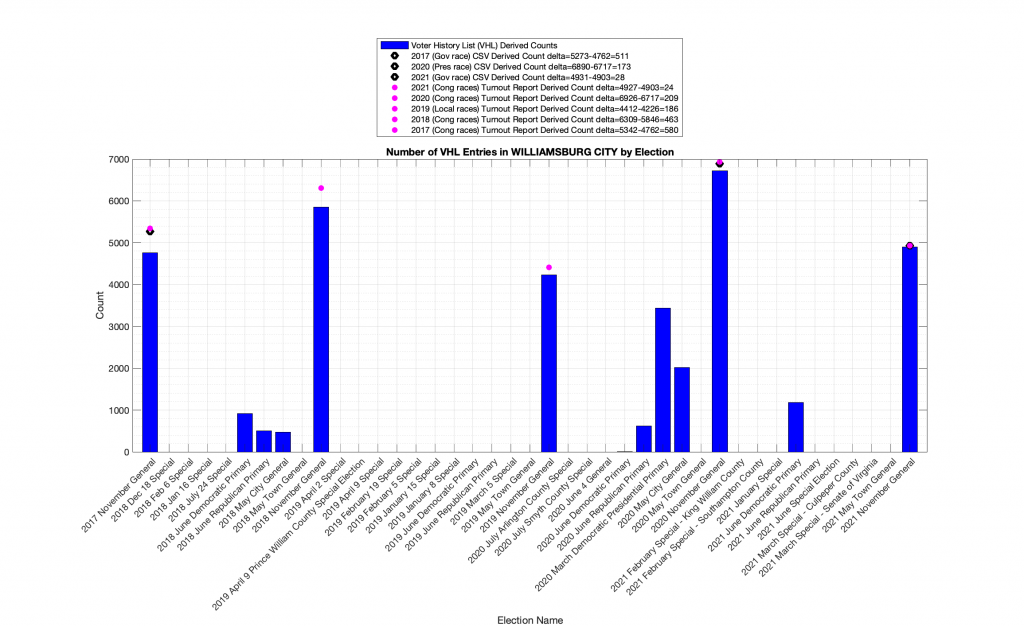
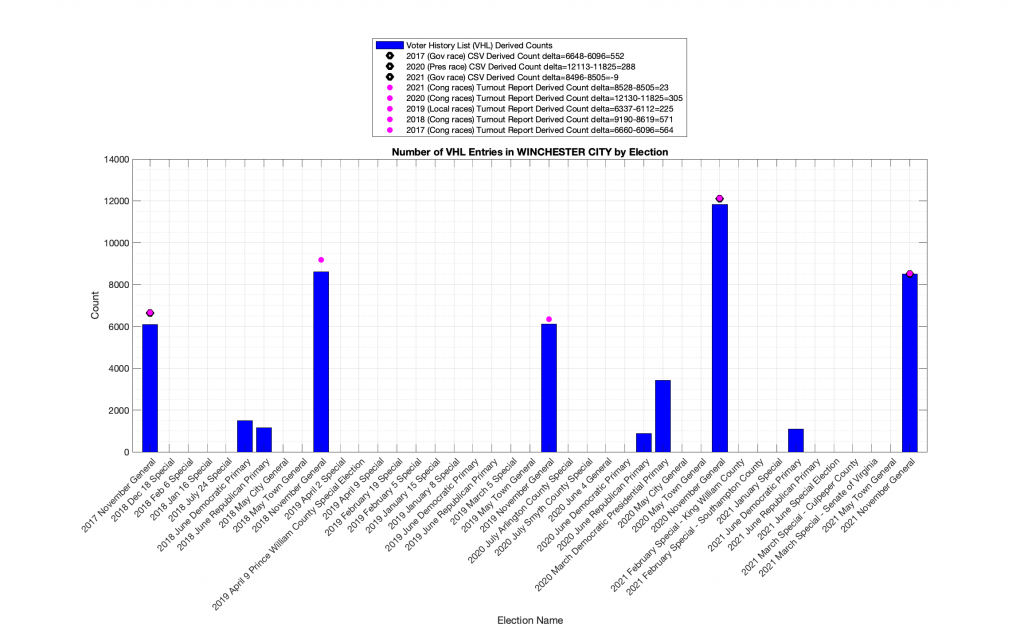
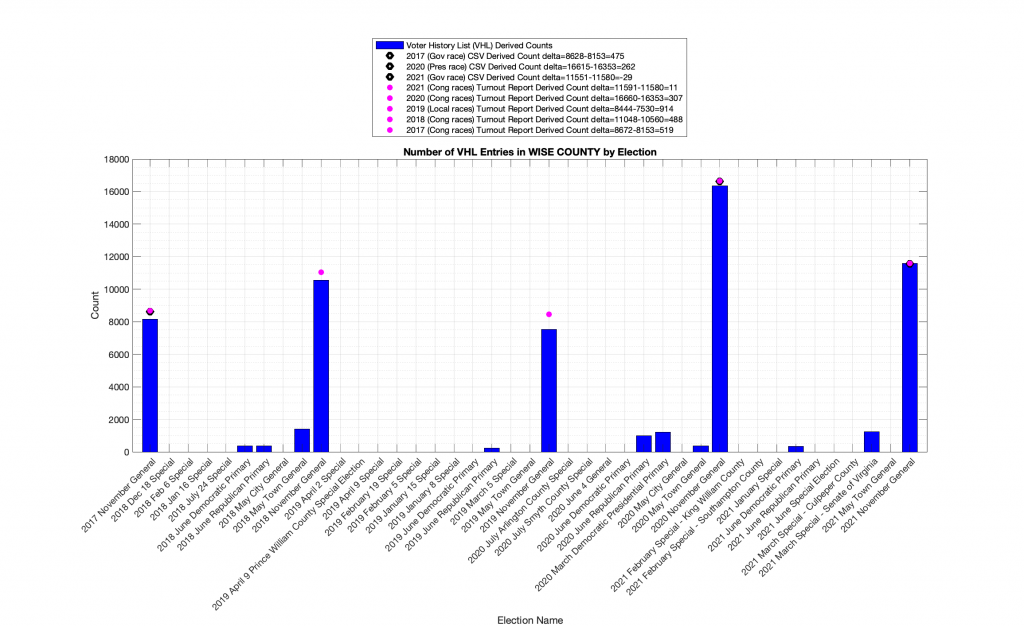
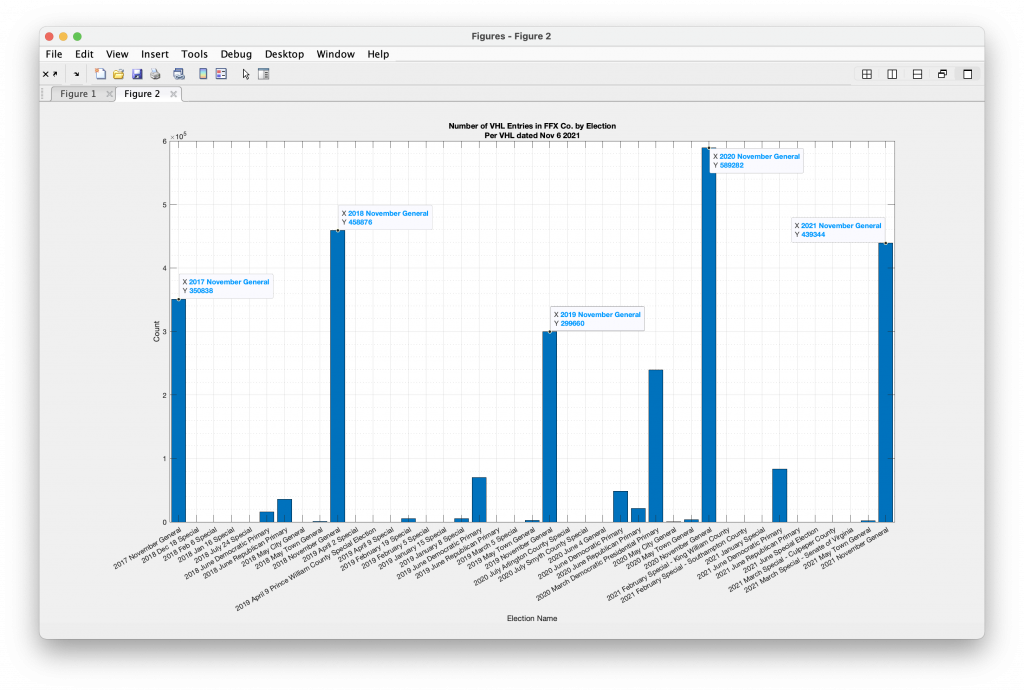
Per a question that I received I took a look at the difference between the number of voters that the VA department of elections (“ELECT”) says participated in a given election (via their Voter History List files), the number of ballots that ELECT says were counted in an election (via the public CSV Election Results files), and the amount of turnout that occurred in a given election (via the ELECT public Turnout CSV files).
Theoretically, all of these sources should give the same (or extremely similar) results. Note that the VHL is counting people, and the CSV is counting votes cast in the respective races, but the numbers should still be roughly similar between the two sources. Also the Results CSV “Total Vote” field, and the Turnout CSV files used for this analysis should be including overvotes, write-ins, etc so that should not the source of the discrepancies. Furthermore, the 11-06-2021 VHL data file is identical to the VHL datafile I downloaded on 12-14-2021, so there is no “missing data” from the VHL file for the 2021 election, unless ELECT has a significant lag in their updating of voter credit. From my conversations with multiple registrars and elections staff, the voter credit is applied when the canvas is completed and the results are certified, so this also should not be a source of error. Update 2022-07-31 23:05 per email discussion with ELECT staff there IS a significant lag in the updating of the VHL data from the time of canvas and certification. This explains the incomplete 2021 VHL. The voter credit is supposed to be applied as of the canvas and certification, but there is often lag in the data being entered and/or replicated. I am not exactly sure how long of a lag is to be expected. Also, while the links for the DAL file given out by ELECT after a user purchases the data are “live” and updated daily over a 30 day window, the links for the RVL and VHL are NOT! So all of this data should be considered as of Nov 6 2021.
Finally, note that by definition the Voter History List information will slightly undercount the number of voters that participated in previous elections, because voters that have been removed from the registered voter list in between the end of an election period and when the a given VHL file is downloaded (11-6-2021 and 12-14-2021 in this case) will have had their corresponding records also deleted from the VHL. This means that as the date of the VHL file you are using gets further and further away from the election that you are interested in, the VHL data becomes more and more inaccurate by design. This seems like a pretty bad way to do record keeping in my opinion, but thats the way ELECT is handling the data.
Results:
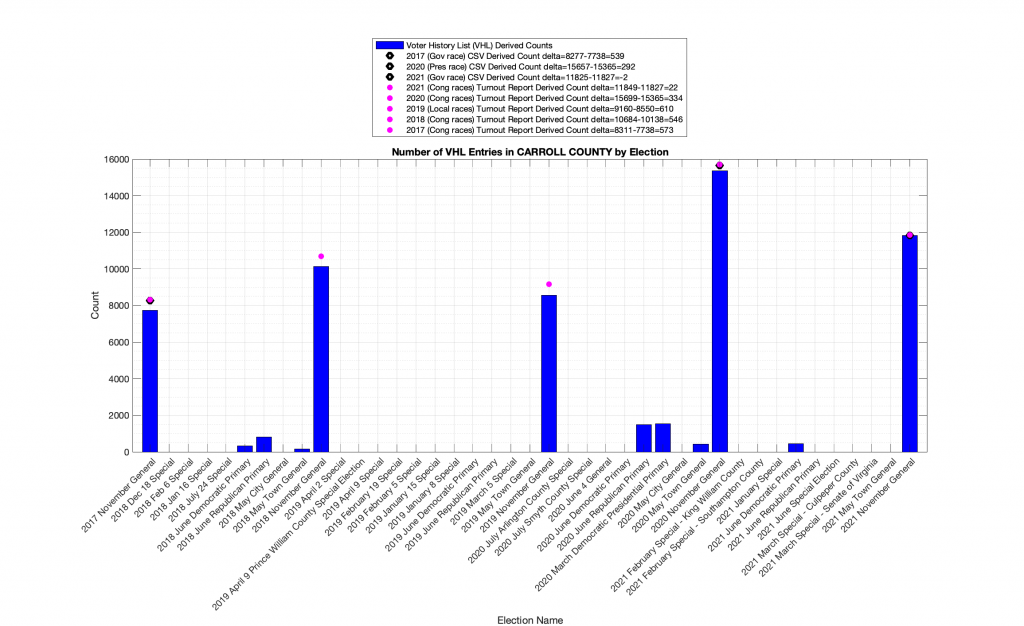
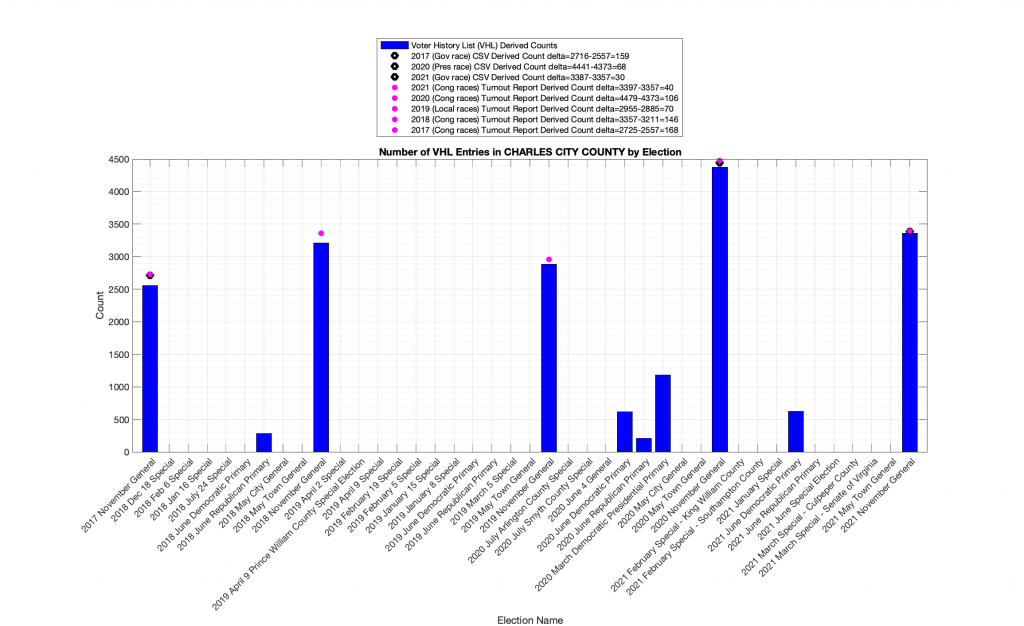
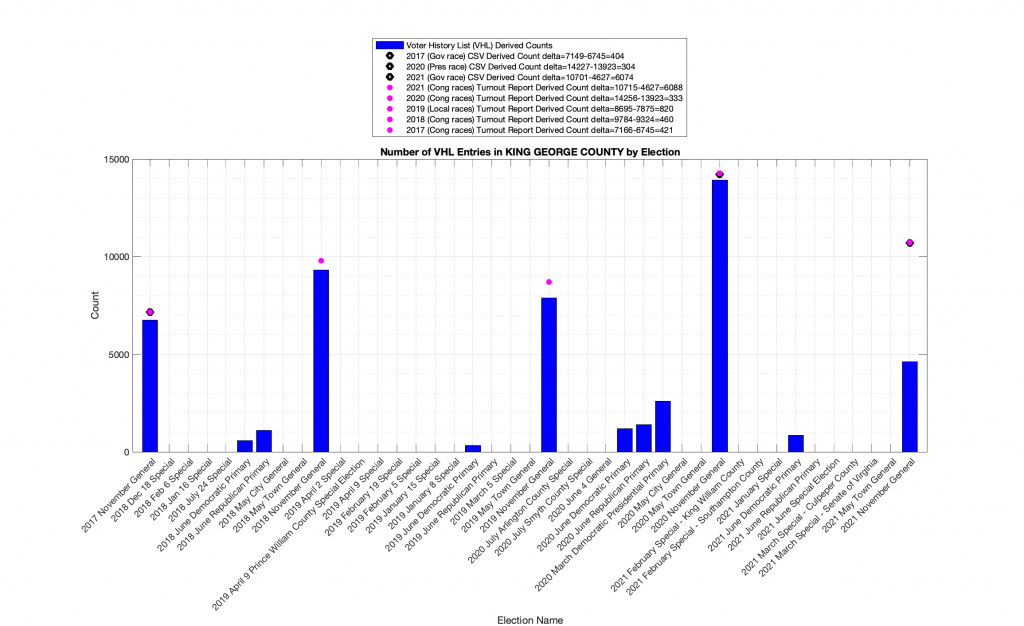
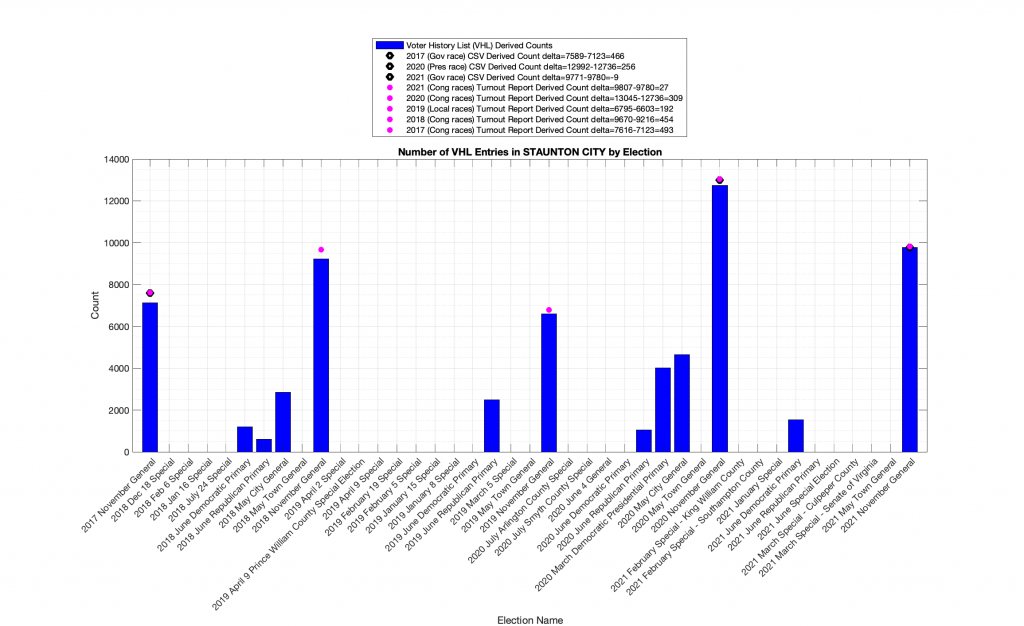
One interesting thing to note, is that even though ELECT and registrars state that the “Voter Credit” (i.e. updates to the VHL) are applied at the conclusion of the canvas and before certification of the election, it appears that there are significant differences with the VHL for 2021 from the Turnout and Result CSV files. The VHL file I am using was first downloaded on 11-06-2021 after the canvas and certification was completed, and I continued to download and archive versions of the the live URL link I received from ELECT until 12-14-2021. There was no change in the content of the VHL file for that entire period. (See my update note above) An example from King George County is shown below.
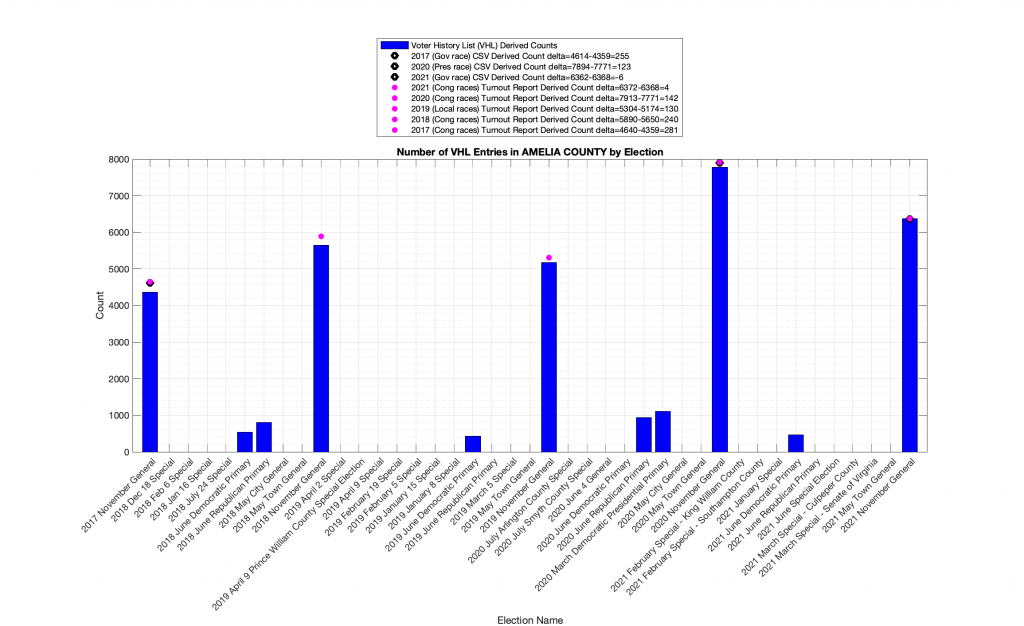
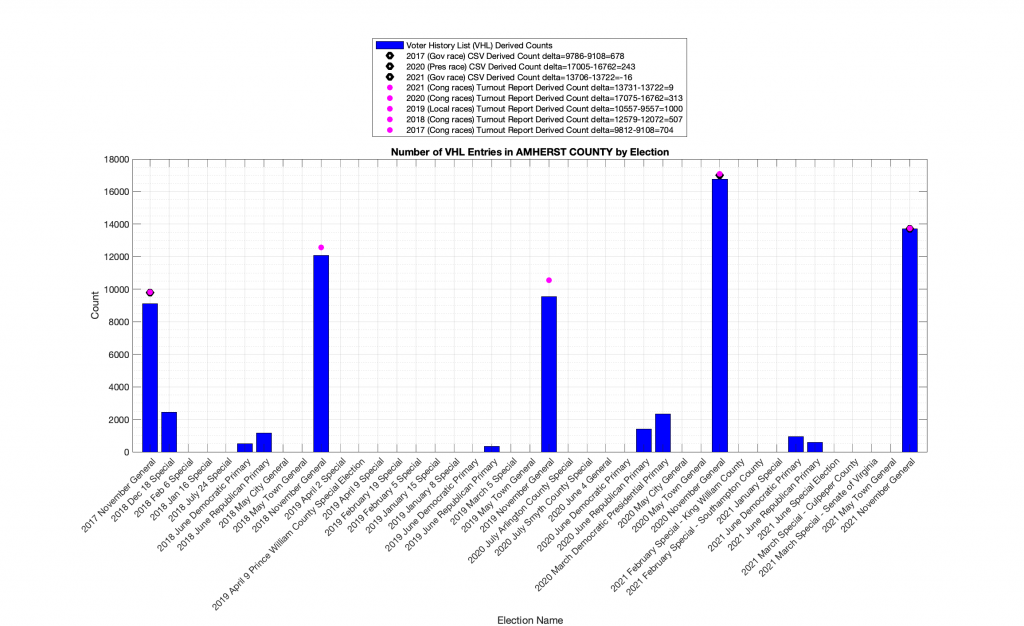
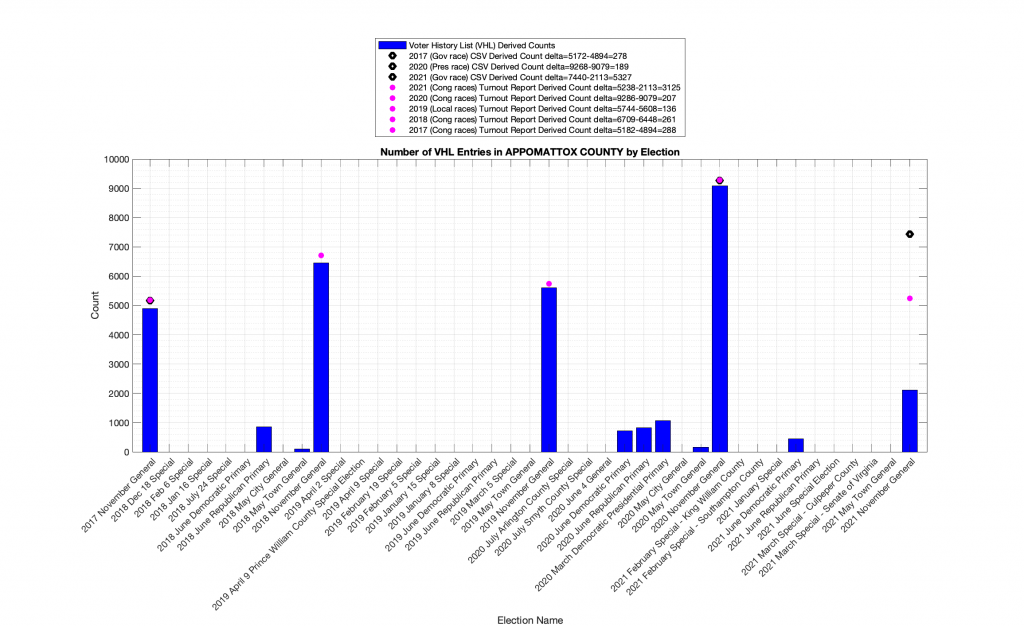
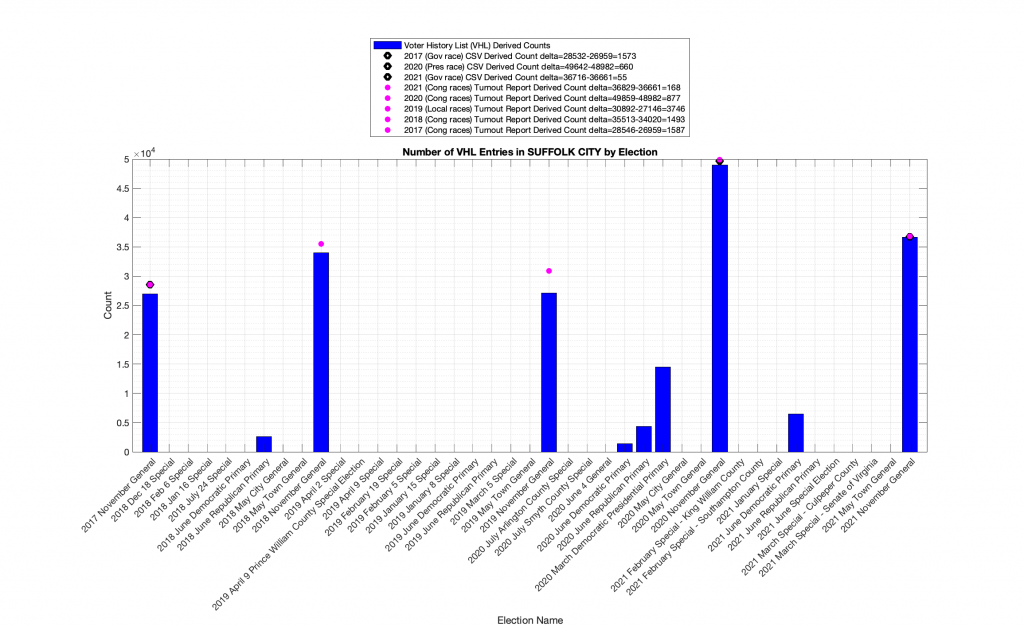
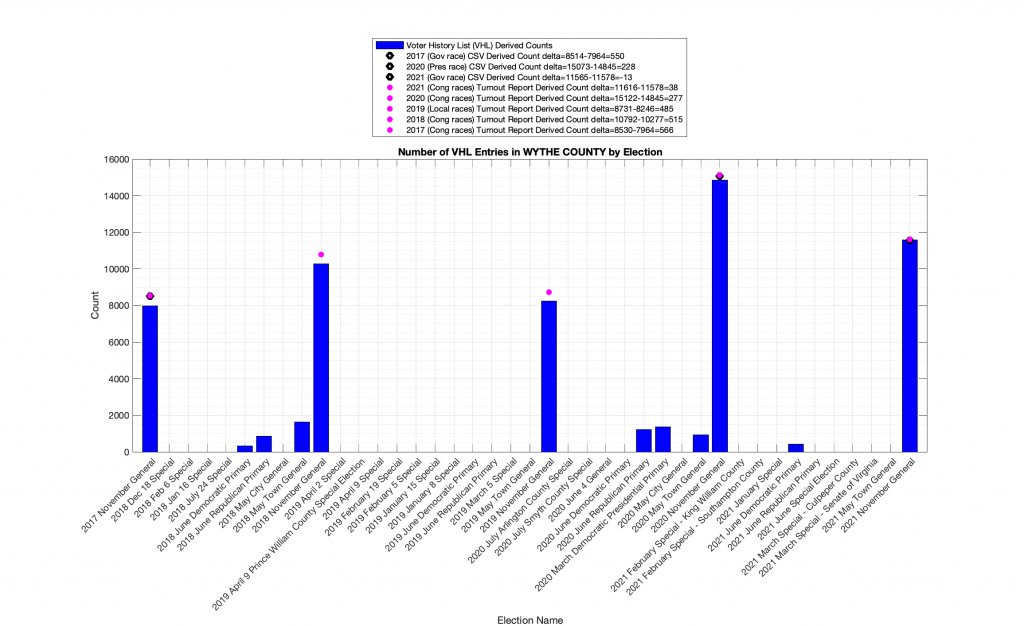
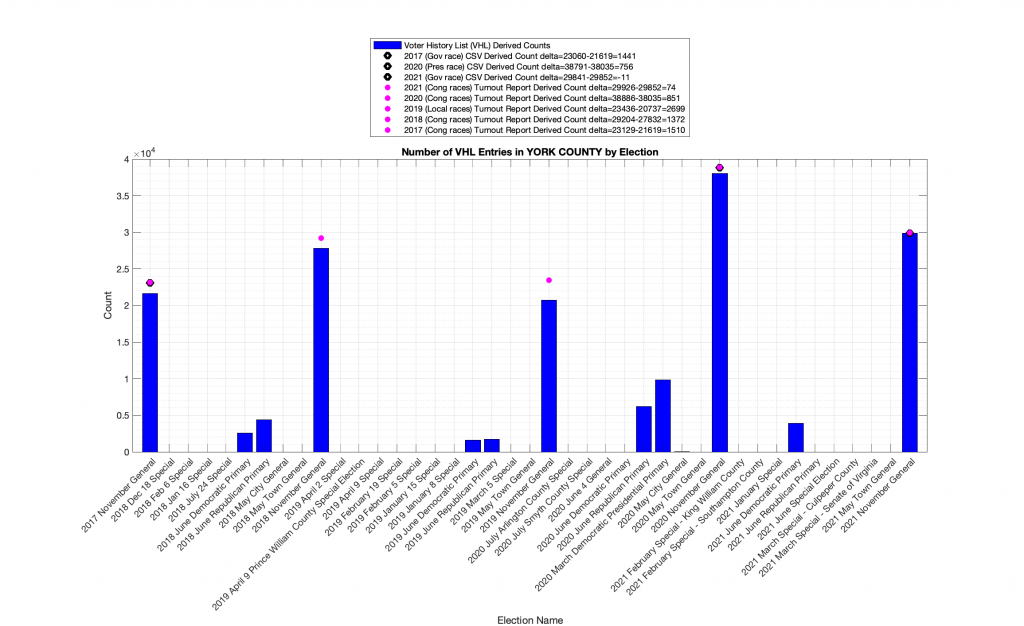
Another interesting thing to observe is that the CSV Election Results and CSV Turnout Results tend to agree for the most part, while the VHL data discrepancies trend negatively as we move further and further away from past elections. As discussed above, this might be attributable to the fact that changes to the voter registrations are mirrored in updates to the Voter History List. An example from Highland County that shows this small but increasing deviation as we move into the past is shown below.
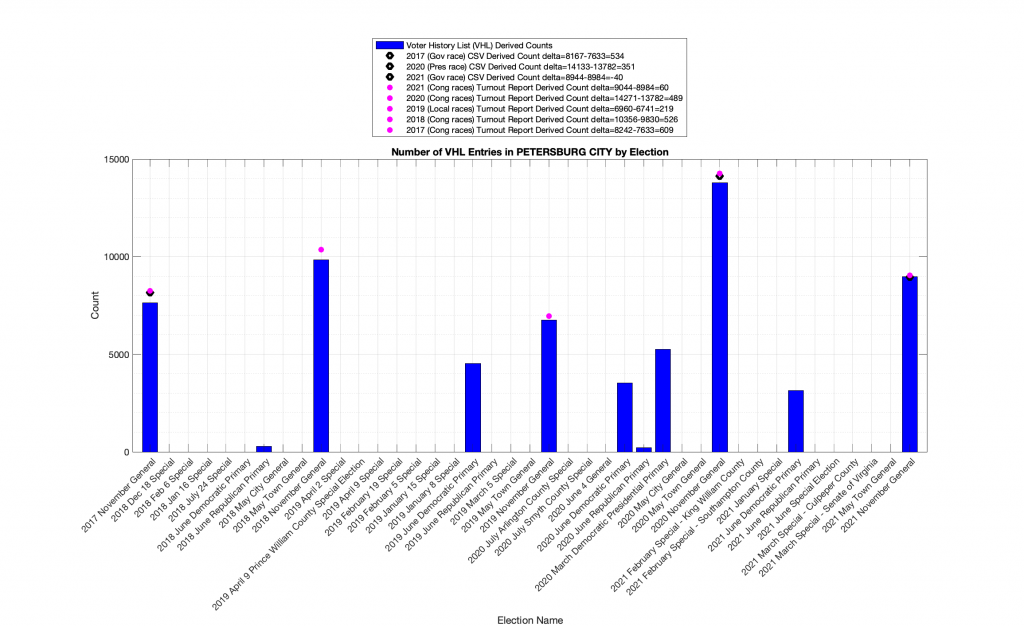
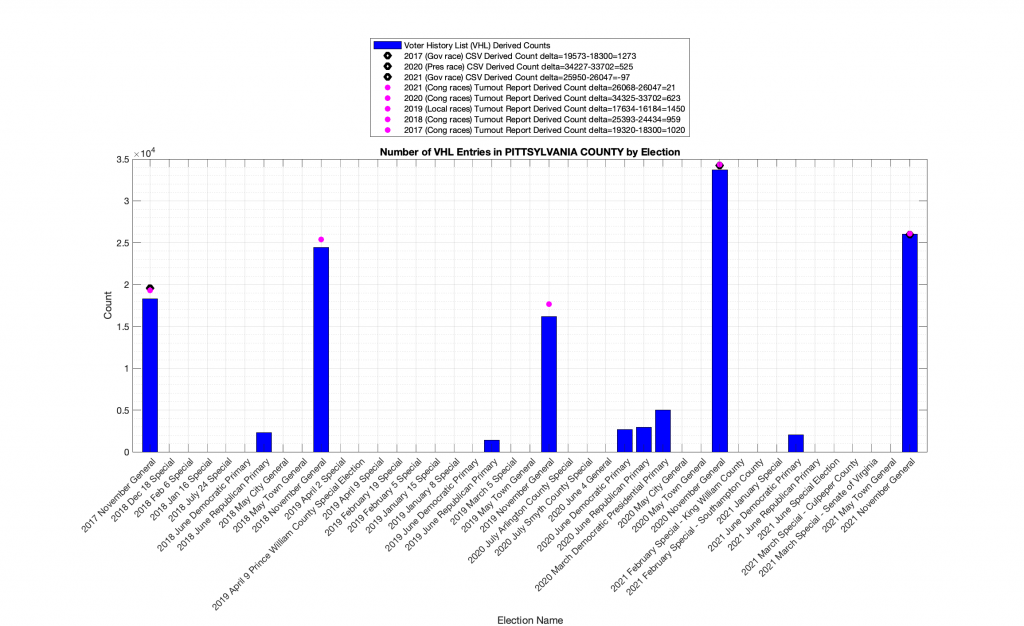
One specific interesting datapoint is the below plot from Page county, where the 2020 Results CSV and Turnout CSV numbers significantly deviate, with a much smaller deviation between the VHL numbers and the Results CSV. I don’t have any explanation as to why this occurs in the data.
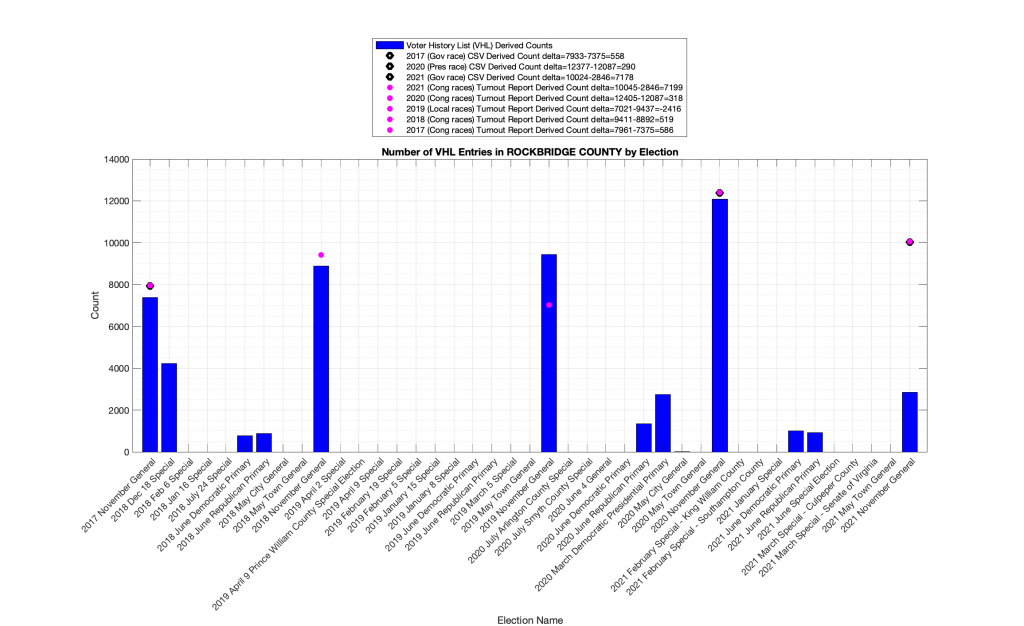
Another specifically interesting datapoint is that the turnout numbers from 2019 in Rockbridge County are significantly less than the number of voters that supposedly participated in the elections according to the VHL. (Note that there were no congressional district races in 2019 November General.) This is particularly interesting considering that we presume, per discussion above, that the VHL undercounts the number of participating voters as we look further and further into the past, as the VHL has voters removed as they are purged from the voter roles. So how does the number of participating voters (from VHL) outnumber the number of votes tallied by ~2400?
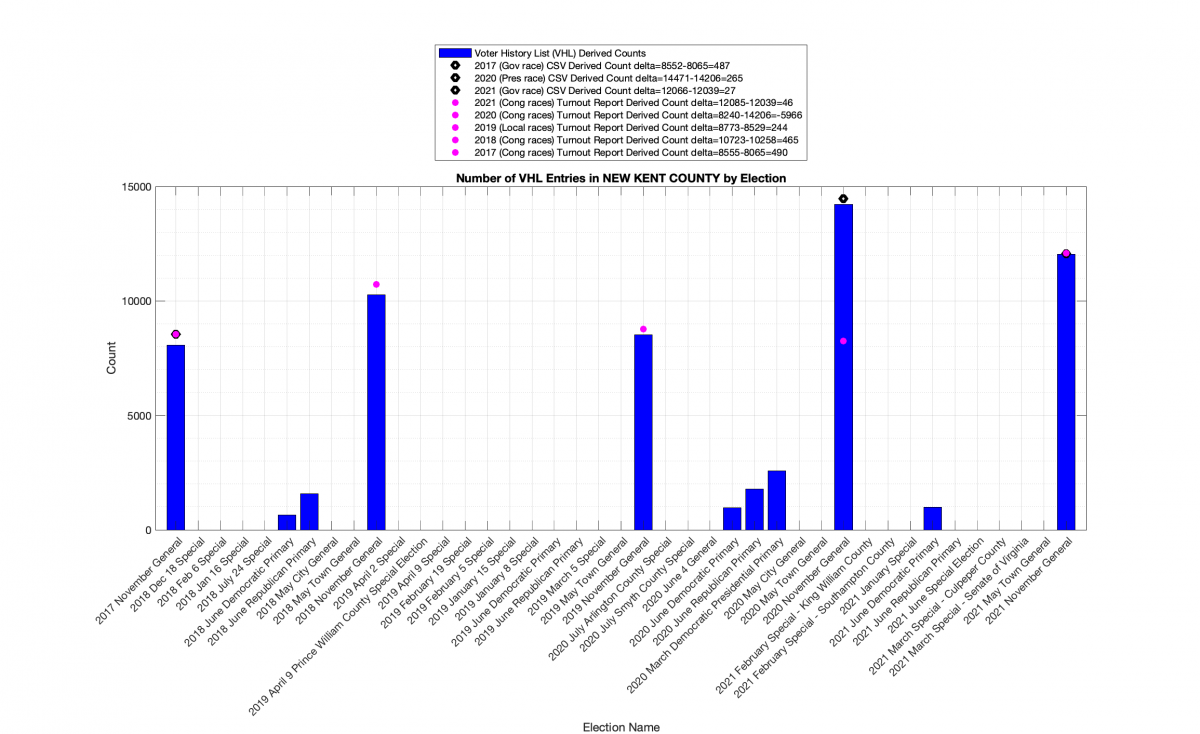
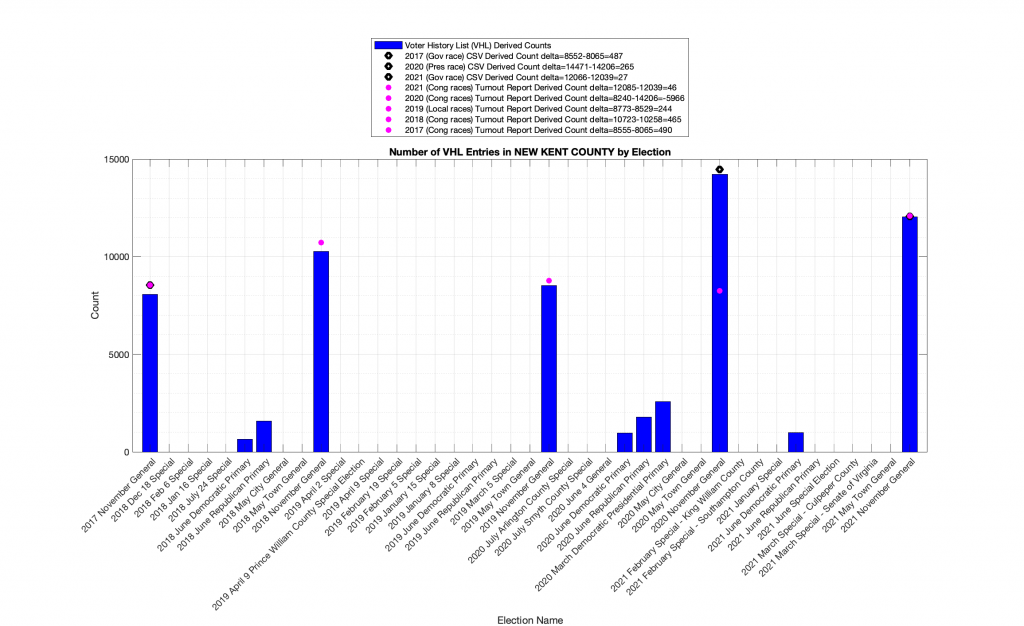
A similar occurrence in New Kent County in 2020 can be observed below, with a deviation of nearly -6000 estimated ballots. The VHL file shows there were ~6000 more voters that participated in the election than the Turnout CSV file records, yet the CSV file for the number of votes cast is within 265 votes of the VHL estimate. Whats going on here?
A similar situation occurs in Shenandoah County in 2018, but by a much smaller margin.
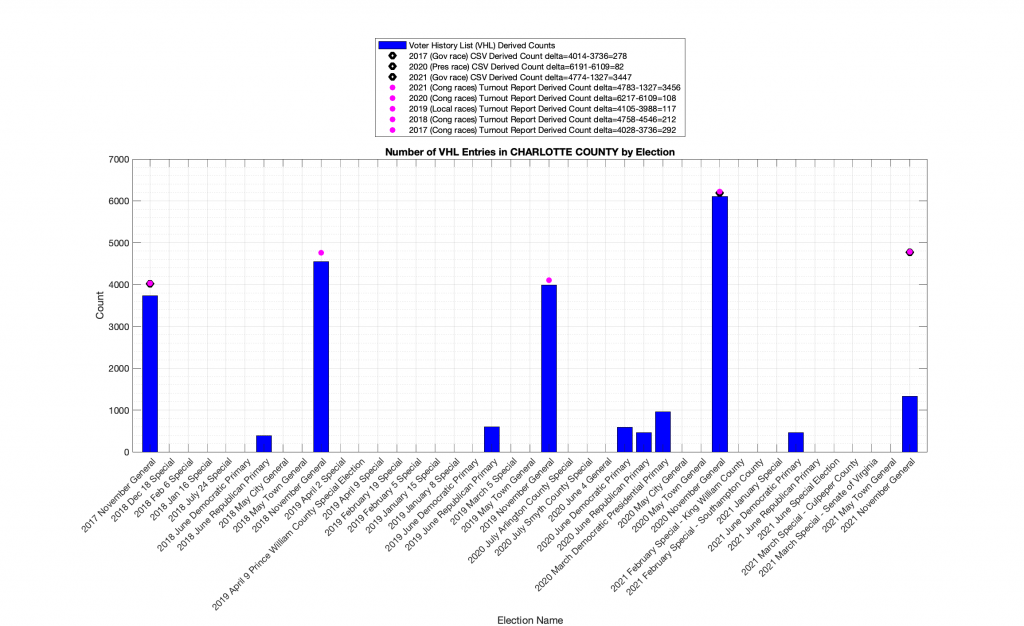
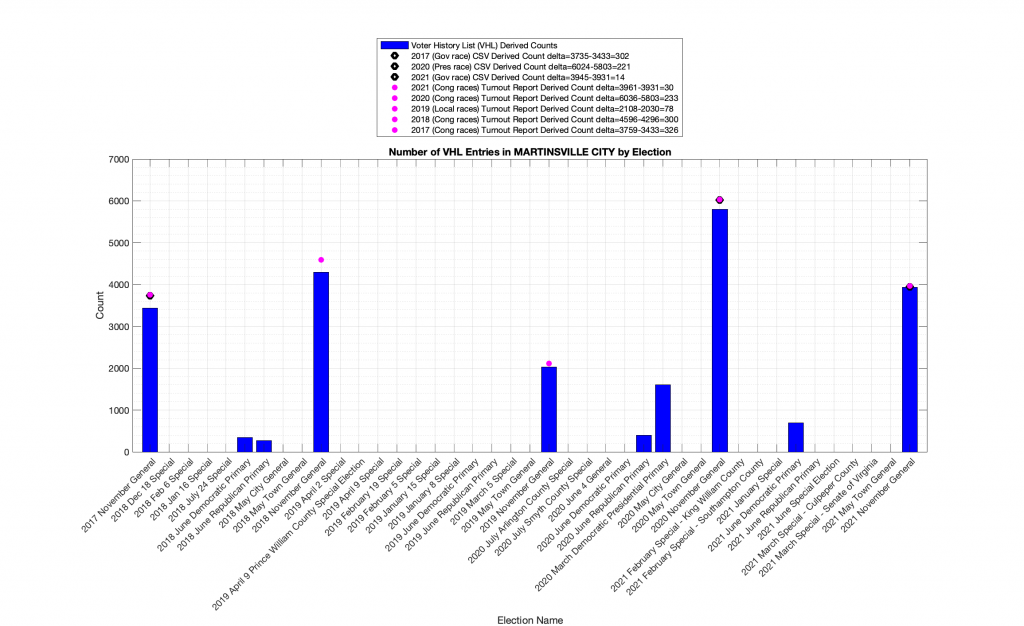
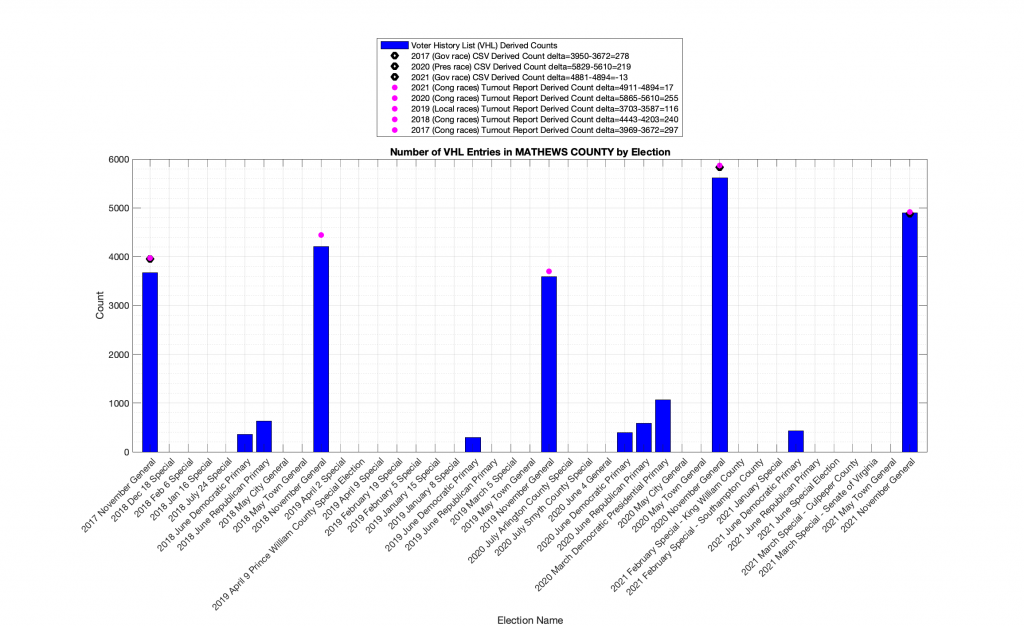
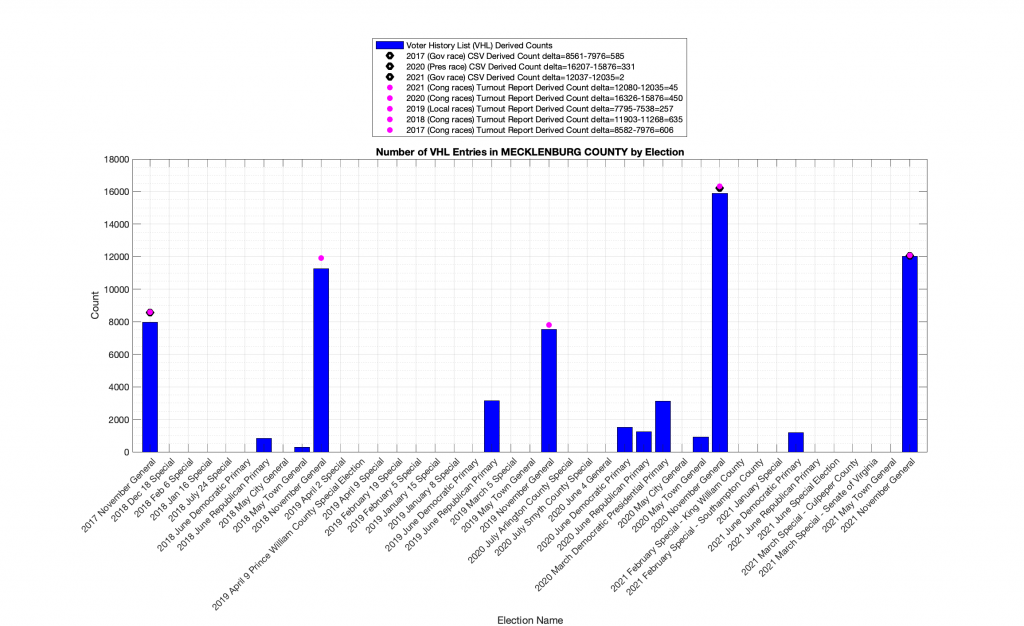
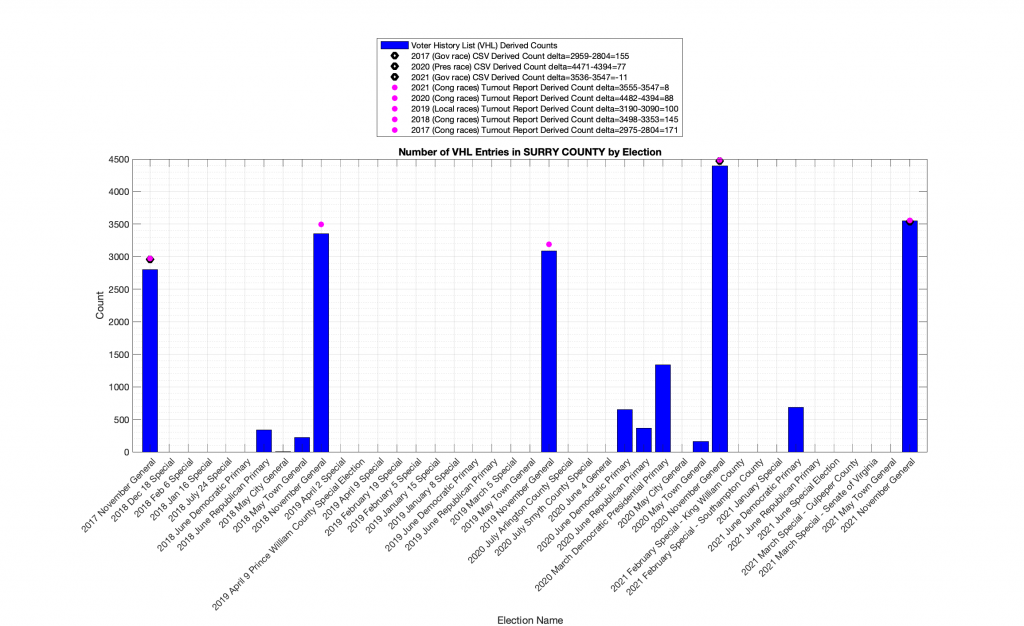
Complete Gallery:
Below is a complete gallery of every Locality’s computed results for completeness.
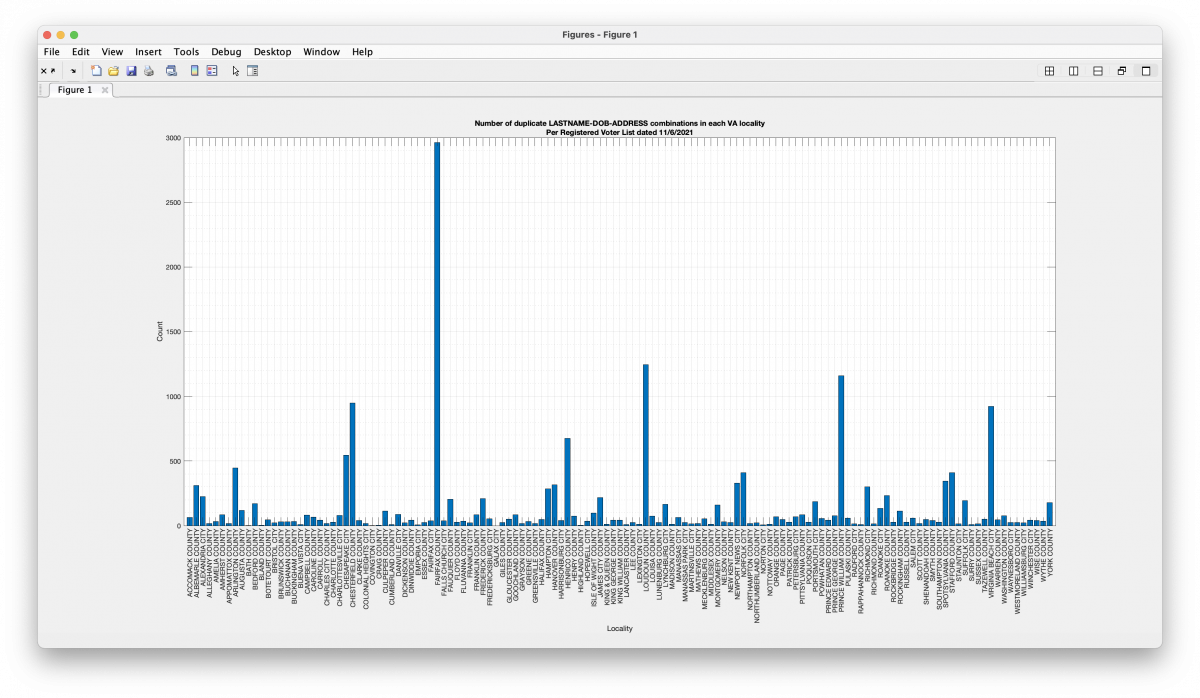
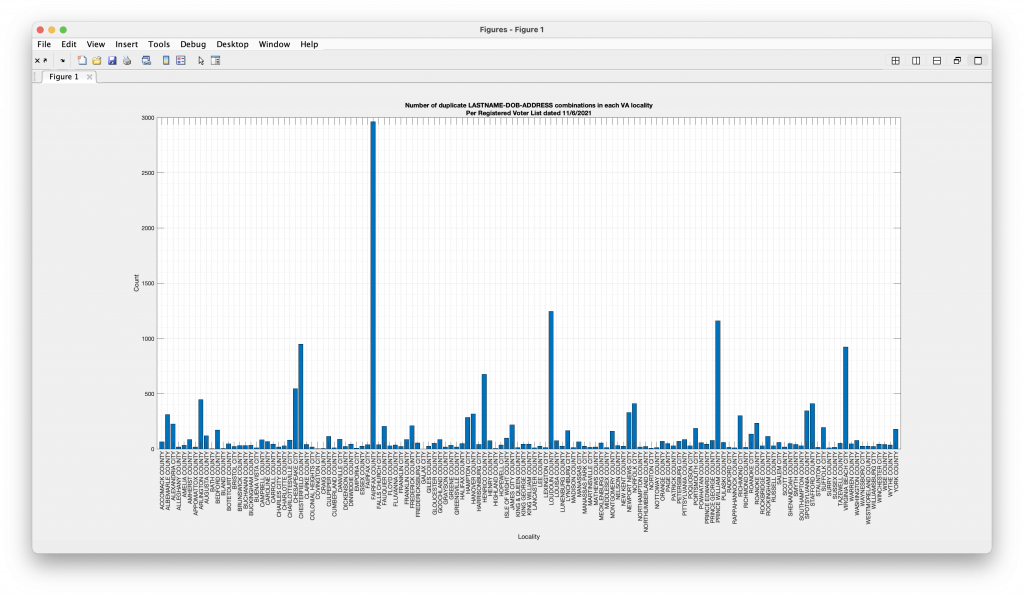
Computed below is the number of duplicated voter records in each locality as of the 11/06/21 VA Registered Voter List (RVL). The computation is based on performing an exact match of LAST_NAME, DOB and ADDRESS fields between records in the file.
Note: If the combination of the name “Jane Smith”, with DOB “1/1/1980”, at “12345 Some Road, Ln.” appears 3 times in the file, there are 3 counts added to the results below. If the combination appears only once, there are 0 counts added to the results below, as there is no repetition.
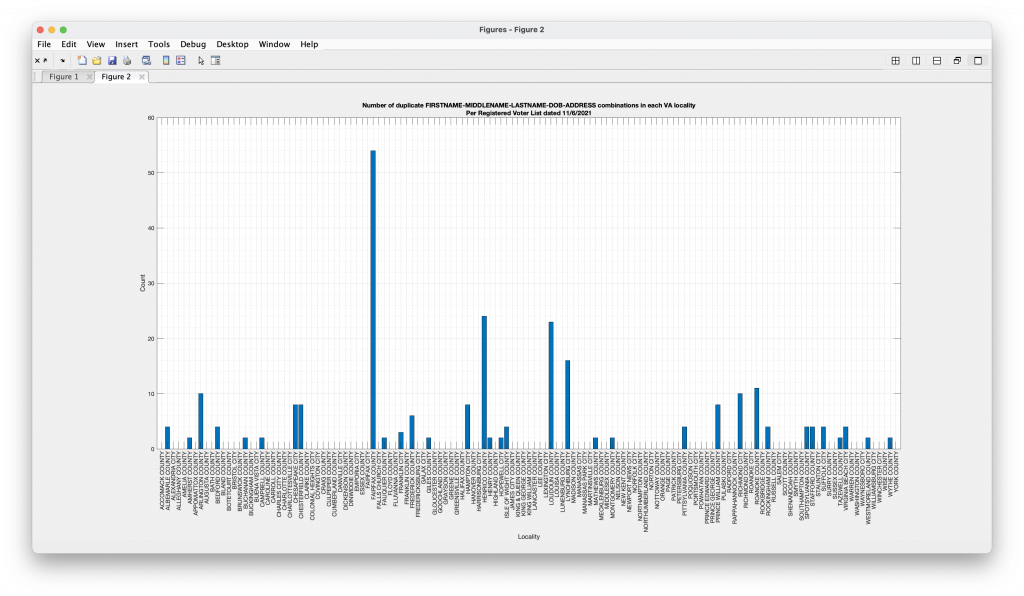
Additionally I’ve done an even more restrictive matching which requires exact match on FIRST, MIDDLE and LAST name, DOB and ADDRESS fields in the second graphic and list presented below.
The first, more lenient, criteria will correctly flag multiple records with the same first or middle name, but misspelled such as “Muhammad” vs “Mahammad”, but could also include occurrences of voting age twins who live together or spouses with the same DOB.
The second, more strict, criteria requires that multiple rows flagged have exactly the same spelling and punctuation for FIRST, MIDDLE, LAST, DOB and ADDRESS fields. This has less false positive, but more false negatives, as it will likely miss common misspellings between entries, etc.
There are no attempts to match for common misspellings, etc. I did do a simple cleanup for multiple contiguous whitespace elements, etc., before attempting to match.
I have summarized the data here so as not to reveal any personally identifiable information (PII) from the RVL in adherence to VA law.
Update 2022-07-13 12:30: I have sent the full information, for both the lenient and strict criteria queries, to the Prince William County and Loudoun County Registrars. The Loudoun deputy registrar has responded and stated that all but 1 of the duplications in the stricter criteria had already been caught by the elections staff, but he has not yet looked at the entries in the more lenient criteria results file. I have also attempted to contact the Henrico County, Lynchburg City, and York County registrars but have not yet received a response or request to provide them with the full data.
Update 2022-07-31 23:03: I have also heard back from the PWC Registrar (Eric Olsen). Most of the entries that I had flagged in the 11/6/2021 RVL list have already been taken care of by the PWC staff already. There were only a couple that had not yet been noticed or marked as duplicates. Also, per our discussion, I should reiterate and clarify that the titles on the plots below simply refer to duplicated entries of the data files according to the filtering choice. It is a technically accurate description and should not be read as I am asserting other than the results of the matching operation.
MAJOR CORRECTION (2022-07-17): The below analysis incorrectly computed the CSV totals for each of the 3 counties. I had an indexing error into my CSV file list and erroneously computed the 2020 totals from the CSV’s. I have since updated and recomputed all of the VHL and CSV results, and have additionally added a check against the Turnout report numbers as reported by ELECT. These new results will be forthcoming in an upcoming blog post. While there are still discrepancies between the VHL and CSV, their magnitude is not as large as was originally presented here. My apologies for the error. Corrected numbers for the 2020 CSV totals are shown in red below with my original estimates in strikethrough font.
(Edited 2022-07-10 17:31 EST to add better explanation of VHL and CSV files to first paragraph.)
Per Request – Prince William, Fairfax and Loudoun County
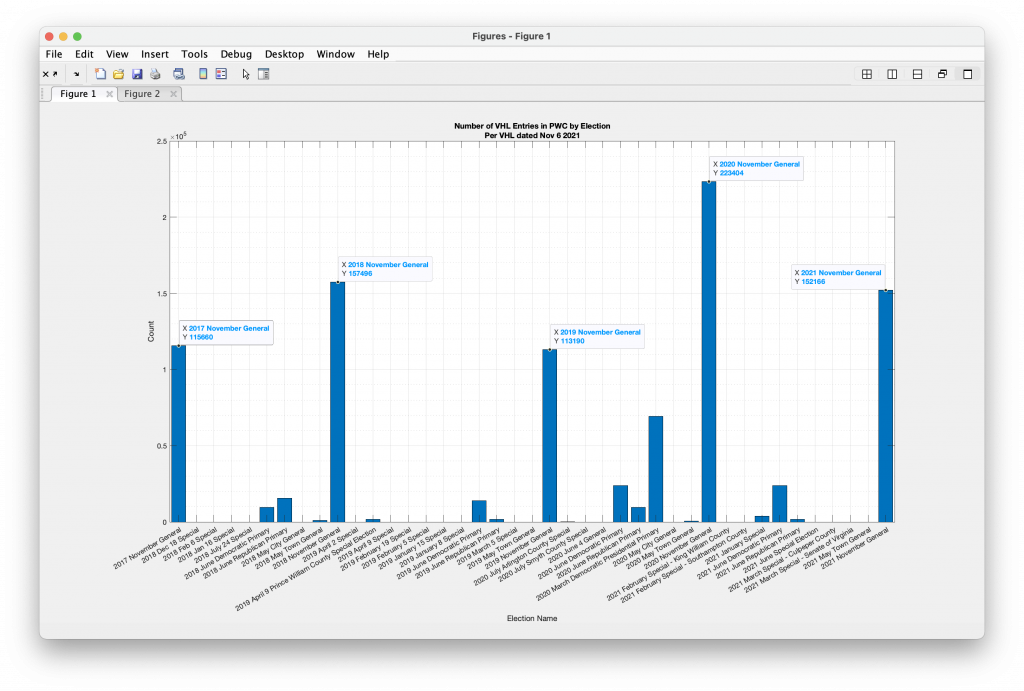
According to the CSV file hosted on the ELECT servers and downloaded on 11-30-2020, the number of votes cast in Prince William County in 2020 Presidential race was 228,267 (corrected) 137,874, which is significantly different than the number of Voters that cast ballots (223,404) in 2020 as generated from the Voter History List (VHL). The 2021 CSV file, downloaded from ELECT on 12-11-2021, gives 153,218 voters as compared to 152,166 given by the VHL data. Why the discrepancies? Note that the VHL is counting people, and the CSV is counting votes cast in the races for President(2020)/Gov(2021), but the numbers should still be roughly similar between the two sources. Also the CSV “Total Vote” field should be including overvotes, write-ins, etc so that is not the source of the discrepancies. Furthermore, the 11-06-2021 VHL data file is identical to the VHL datafile downloaded on 12-14-2021, so there is no missing data from the VHL file for the 2021 election. Finally, note that by definition the Voter History List information will undercount the number of voters that participated in the 2020 election, because voters that have been removed from the registered voter list in between the end of the 2020 election period and when the file was downloaded (11-6-2021) will have had their corresponding records deleted from the VHL.
According to the CSV file hosted on the ELECT servers and downloaded on 11-30-2020, the number of votes cast in Fairfax County was 601,243 (corrected) 487232, which is significantly different than the number (589282) generated from the VHL. The 2021 CSV file, downloaded from ELECT on 12-11-2021, give 441262 voters as compared to 439344 given by the VHL data. Why the discrepancies?
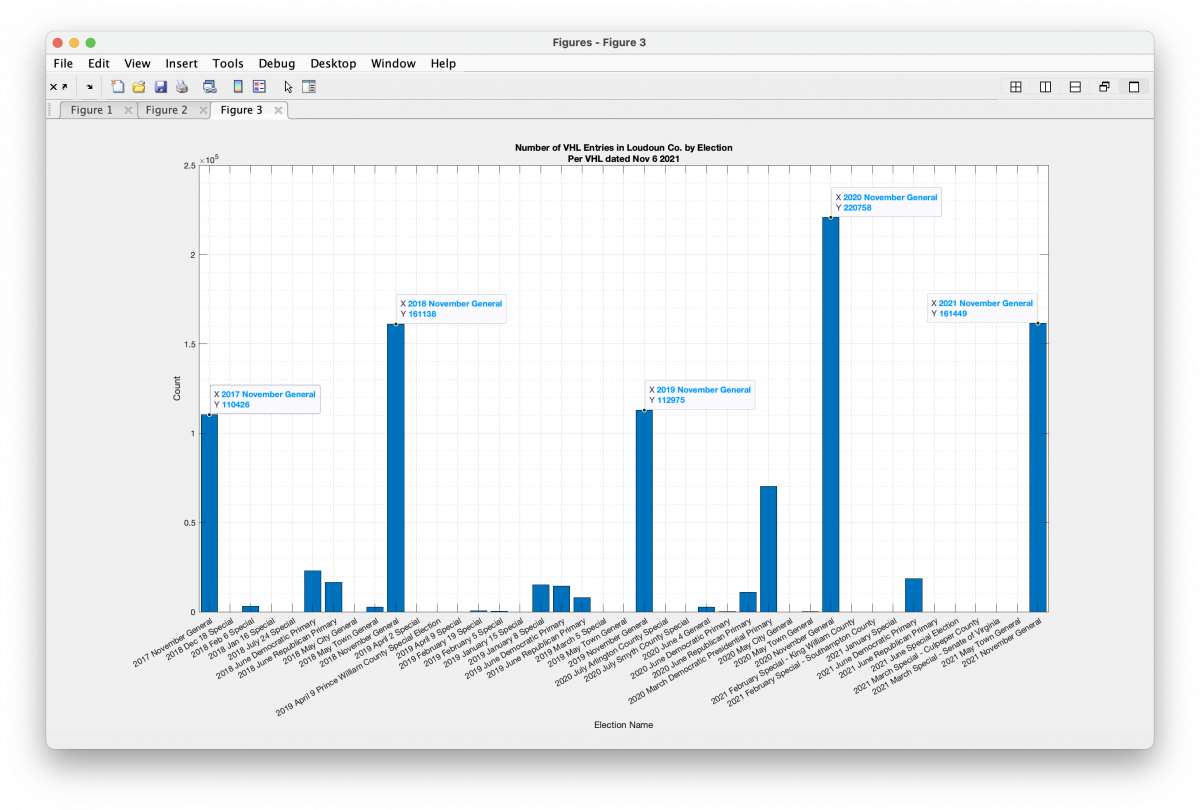
According to the CSV file hosted on the ELECT servers and downloaded on 11-30-2020, the number of votes cast in Loudoun County was 224,976 (corrected) 111655, which is significantly different than the number (220758) generated from the VHL. The 2021 CSV file, downloaded from ELECT on 12-11-2021, give 161793 voters as compared to 161449 given by the VHL data. Why the discrepancies?
Many election integrity investigators are looking through registration records and trying to find suspicious registrations based on the number of records attributed to a specific address as an initial way of identifying records of interest and of need of further scrutiny. This can often produce false positives for things like nursing homes, college dormitories, etc. Additionally, one of the concerns that has been raised is the risk of potential elder abuse, ID theft, manipulation or improper use of ballots for occupants of nursing home, hospice care or assisted living facilities.
According to https://npino.com : “The National Provider Identifier (NPI) is a unique identification number for covered health care providers (doctors, dentists, chiropractors, nurses and other medical staff). The NPI is a 10-digit, intelligence-free numeric identifier. This means that the numbers do not carry other information about healthcare providers, such as the state in which they live or their medical specialty. The NPI must be used in lieu of legacy provider identifiers in the HIPAA standards transactions. Covered health care providers and all health plans and health care clearing houses must use the NPIs in the administrative and financial transactions adopted under HIPAA (Health Insurance Portability and Accountability Act).”
I’ve compiled a list of every nursing home, hospice care, or assisted living facility in the country based on their current NPI code. I have mirrored and scraped the entire https://npino.com site as of 5-23-2022 and compiled the list of nationwide Nursing homes, Assisted Living and Hospice Care facilities into the below CSV file and am presenting it here in the hopes that it is useful for other researchers. I did do a small amount of regular expression based cleanup to the entries (e.x. // replacing “Ste.” with “Suite”, fixing whitespace issues, etc.) as well as manually addressing a handful of obviously incorrect addresses (e.x. // repeated/spliced street addresses, etc.).
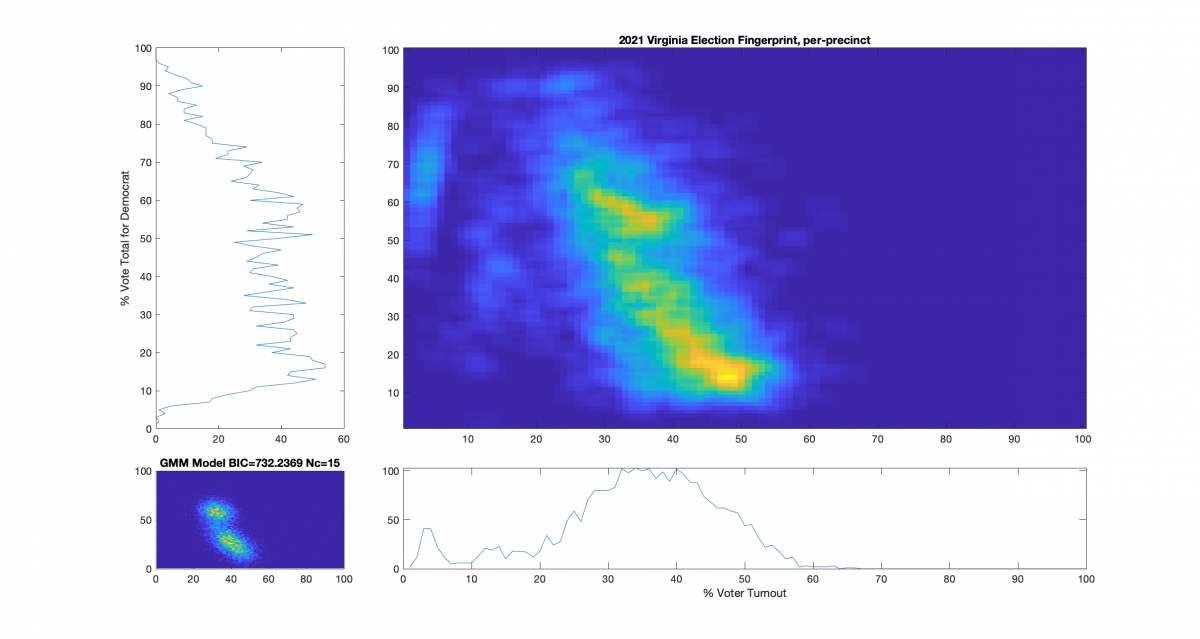
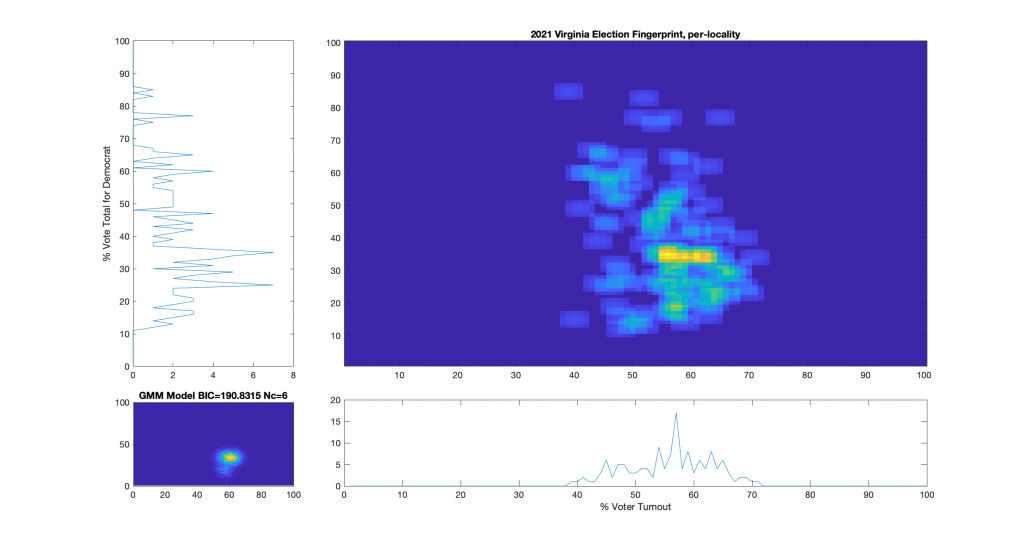
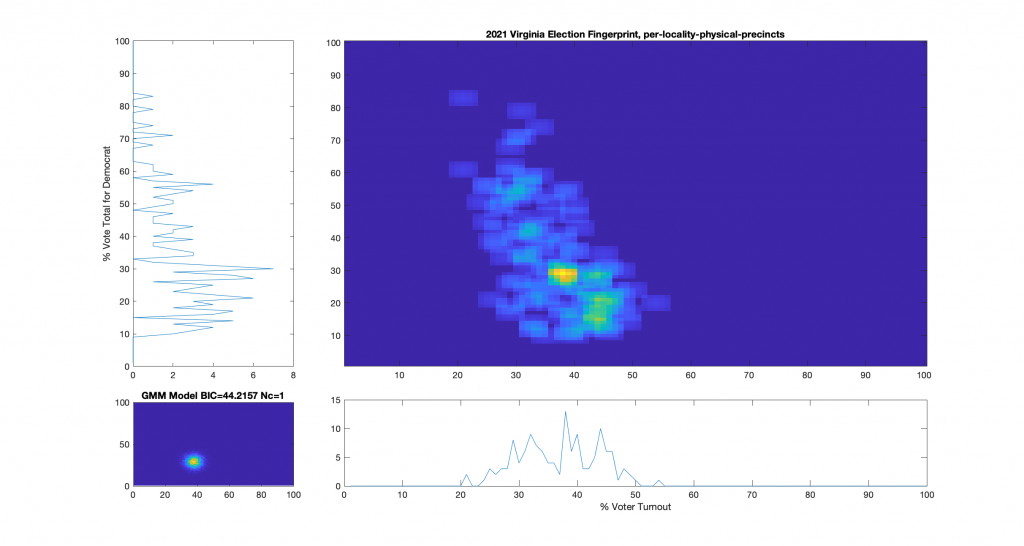
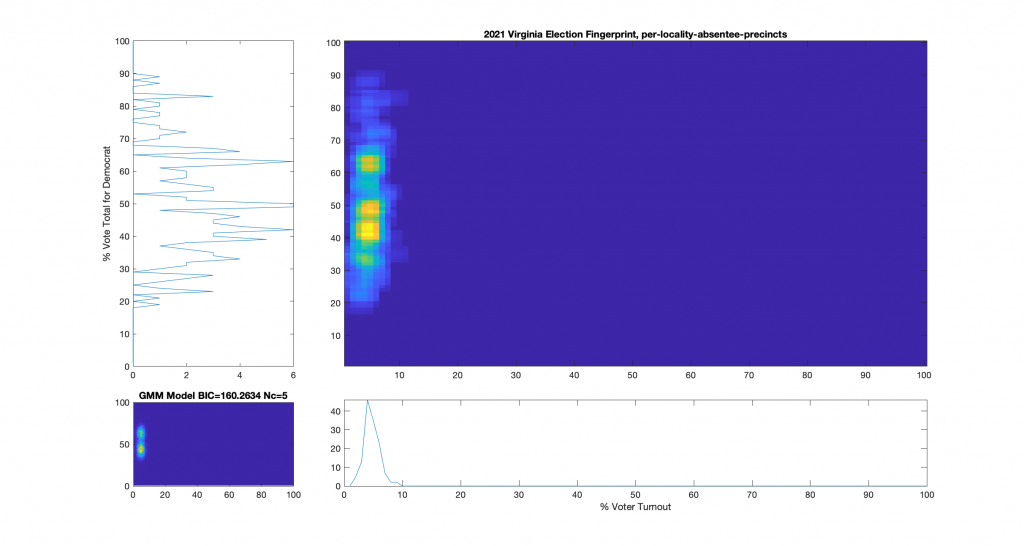
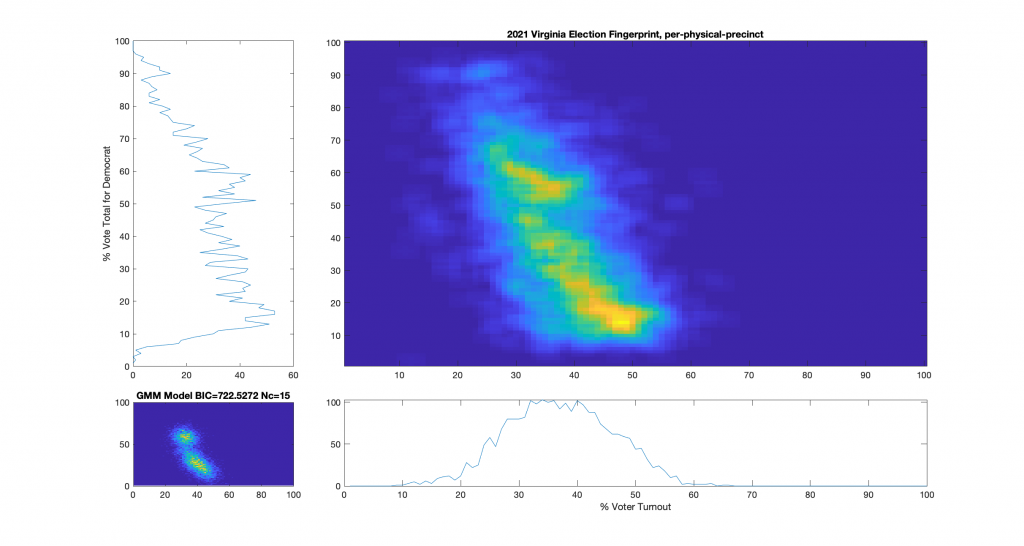
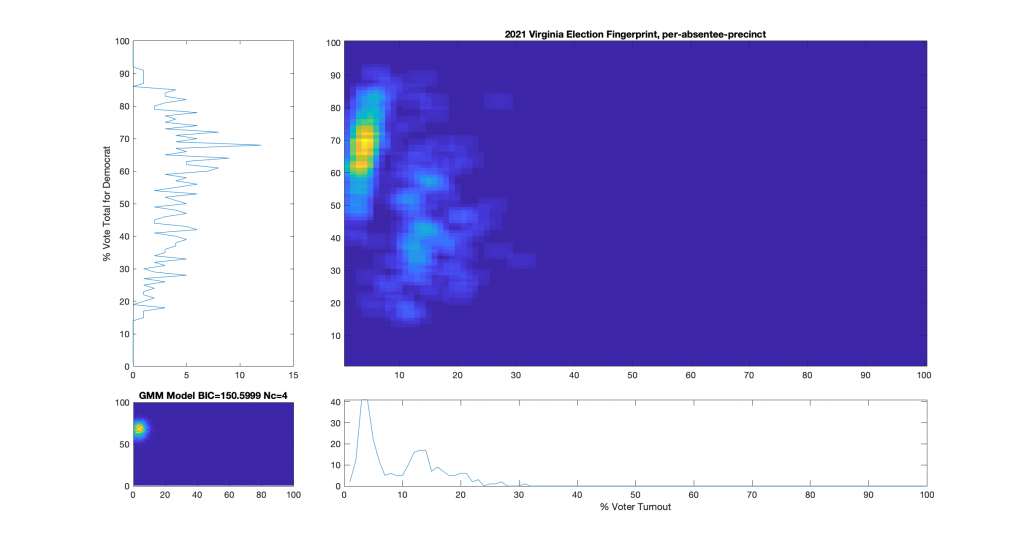
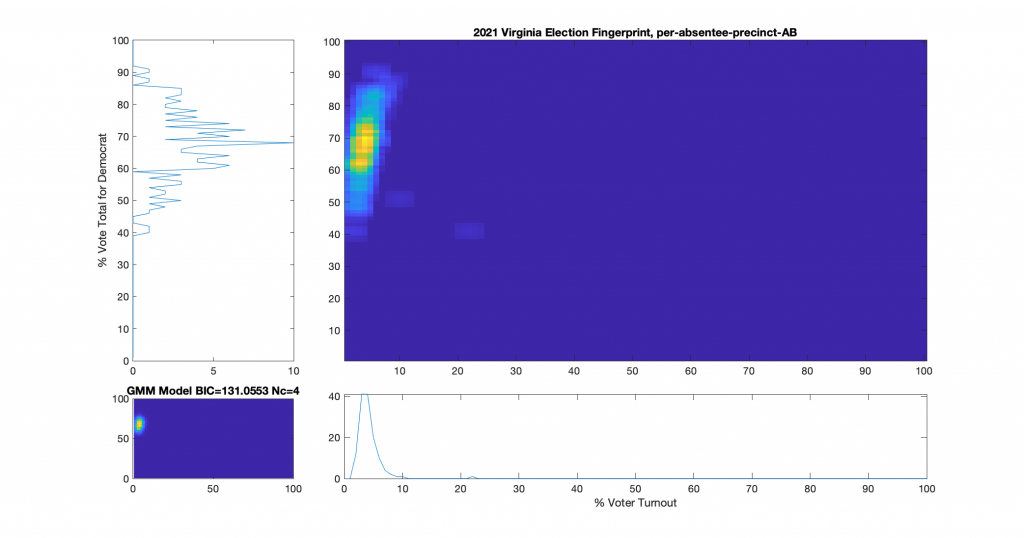
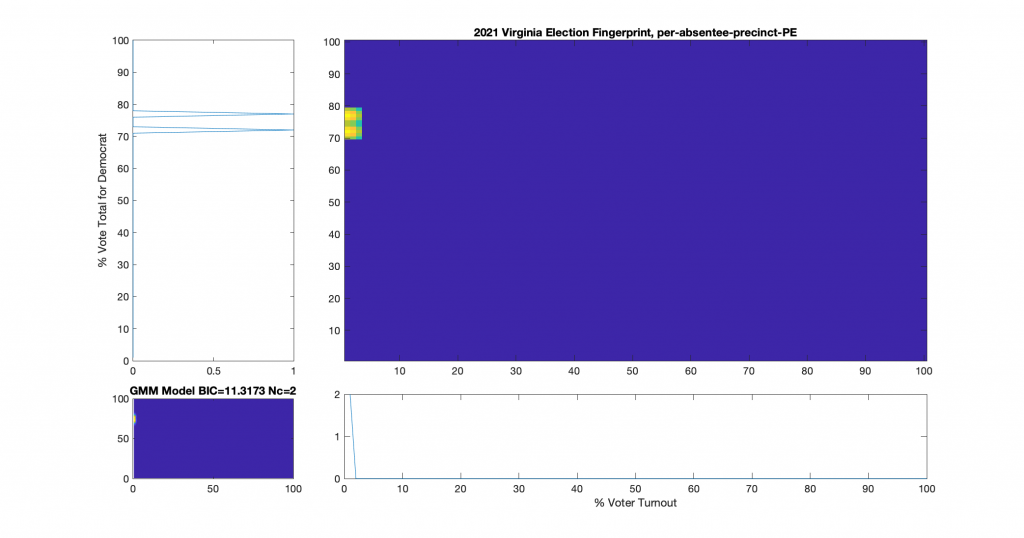
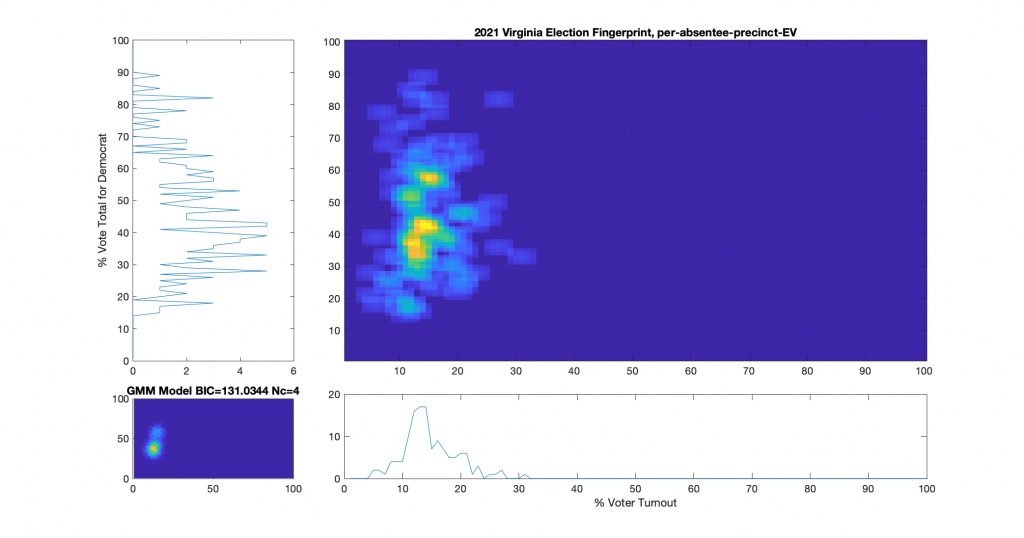
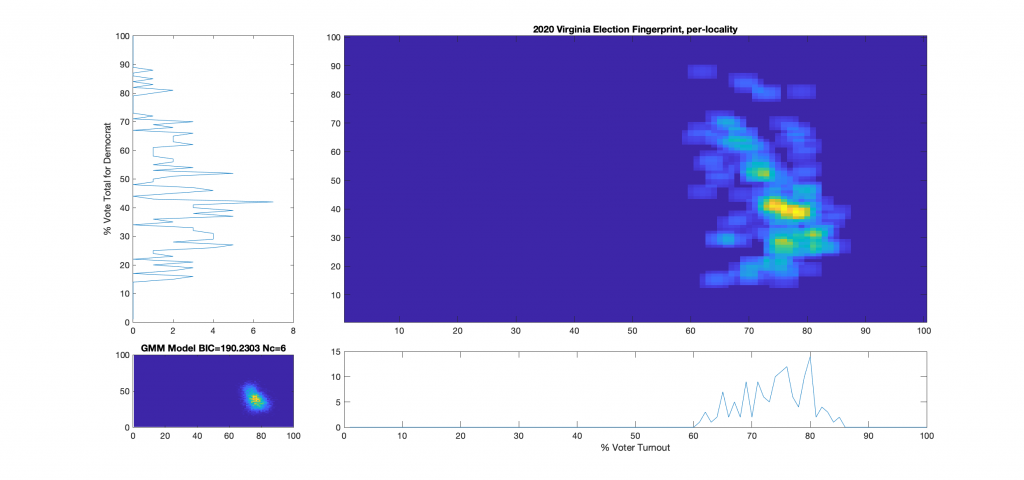
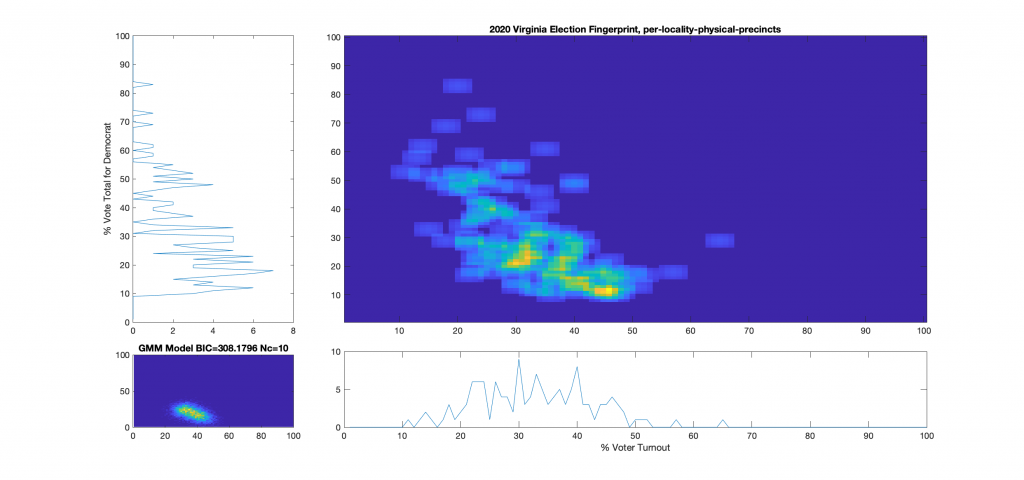
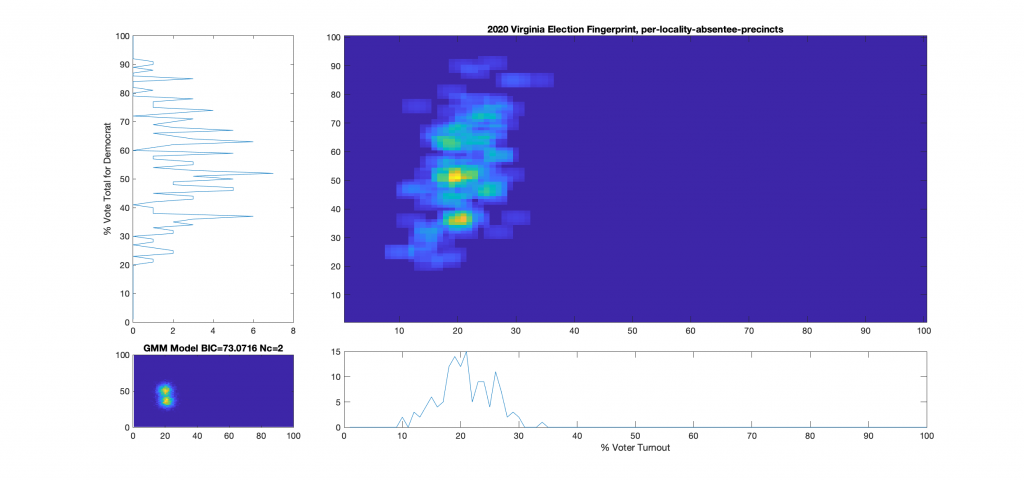
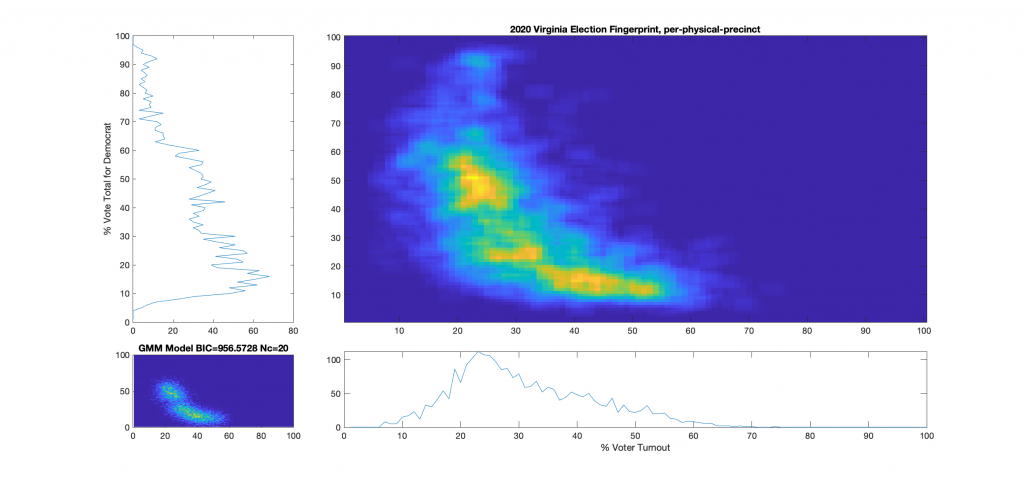
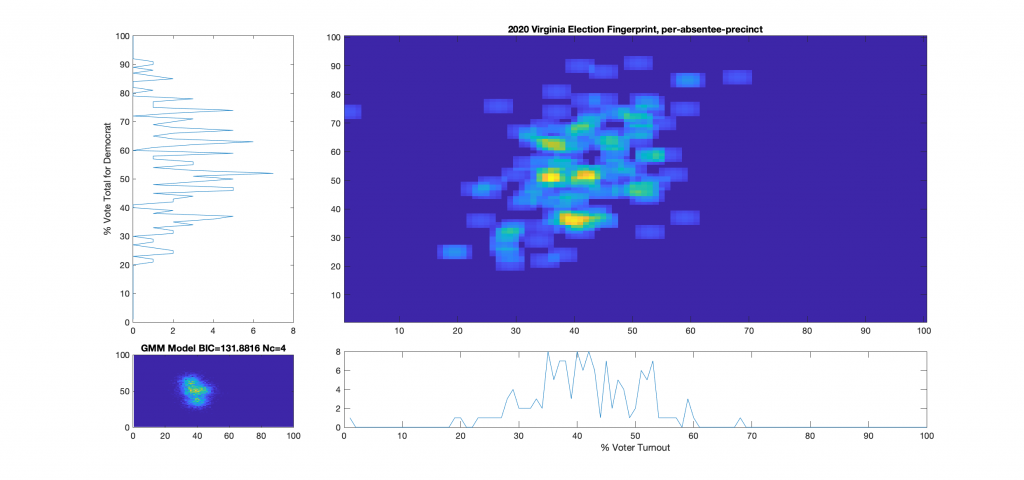
For additional background information, see here, here and here. As a reminder and summary, according to the published methods in the USAID funded National Academy of Sciences paper (here) that I based this work off of, an ideal “fair” election should look like one or two (depending on how split the electorate is) clean, compact Gaussian distributions (or “bulls-eye’s”). Other structural artifacts, while not conclusive, can be evidence and indicators of election irregularities. One such indicator with an attributed cause is that of a highly directional linear streaking, which implies an incremental fraud and linear correlation. Another known and attributed indicator is that of large distinct and extreme peaks near 100% or 0% votes for the candidate (the vertical axis) that are disconnected from the main Gaussian lobe which the authors label a sign of “extreme fraud”. In general, for free and fair elections, we expect these 2D histograms to show a predominantly uncorrelated relationship between the variables of “% Voter Turnout” (x-axis) and “% Vote Share” (y-axis).
Note that even though the republican (Youngkin) won in VA, the y-axis of these plots presented here was computed as the % vote share for the democratic candidate (McCauliffe) in order to more easily compare with the 2020 results. I can produce Yougkin vote share % versions as well if people are interested, and am happy to do so.
While the 2021 election fingerprints look to have less correlations between the variables as compared to 2020 data, they still look very non-gaussian and concerning. While there is no clearly observable “well-known” artifacts as called out in the NAS paper, there is definitely something irregular about the Virginia 2021 election data. Specifically, I find the per-precinct absentee [mail-in + post-election + early-in-person] plot (Figure 6) interesting as there is a diffuse background as well as a linearly correlated set of virtual precincts that show low turnout but very high vote share for the democratic candidate.
One of the nice differences about 2021 VA data is that they actually identified the distinctions between mail-in, early-in-person, and post-election vote tallies in the CAP’s this year. I have broken out the individual sub-groups as well and we can see that the absentee early-in-person (Figure 9) has a fairly diffuse distribution, while the absentee mail-in (Figure 7) and absentee post-election (Figure 8) ballots show a very high McAuliffe Vote %, and what looks to be a linear correlation.
For comparison I’ve also included the 2020 fingerprints. All of the 2020 fingerprints have been recomputed using the exact same MATLAB source code that processed the 2021 data. The archive date of the “2020 November General.csv” and “Turnout 2020 November General.csv” files used was 11/30/2020.
I welcome any and all independent reviews or assistance in making and double checking these results, and will gladly provide all collated source data and MATLAB code to anyone who is interested.
Figure 1 : VA 2021 Per locality, absentee (CAP) + physical precincts
Figure 2 : VA 2021 Per locality, physical precincts only:
Figure 3 : VA 2021 Per locality, absentee precincts only:
Figure 4 : VA 2021 Per precinct, absentee (CAP) + physical precincts:
Figure 5 : VA 2021 Per precinct, physical precincts only:
Figure 6 : VA 2021 Per precinct, absentee (CAP) precincts only:
Figure 7 : VA 2021 Per precinct, CAP precincts, mail-in ballots only:
Figure 8 : VA 2021 Per precinct, CAP precincts, post-election ballots only:
Figure 9 : VA 2021 Per precinct, CAP precincts, early-in-person ballots only:
Comparison to VA 2020 Fingerprints
Figure 10 : VA 2020 Per locality, absentee (CAP) + physical precincts:
Figure 11 : VA 2020 Per locality, physical precincts only:
Figure 12 : VA 2020 Per locality, absentee precincts only:
Figure 13 : VA 2020 Per precinct, absentee (CAP) + physical precincts:
Figure 14 : VA 2020 Per precinct, physical precincts only:
Figure 15 : VA 2020 Per precinct, absentee (CAP) precincts only: