Abstract:
Using the data provided by the VA Department of Elections (ELECT), we have identified at least 1,481 unique registrations that were identified as “Determined Non-Citizen” and removed by ELECT from the voter rolls since May of 2023. Of those 1,481 there were 335 that also had corresponding records of recent ballots cast in the official Voter History record. There were 838 associated ballots cast since Feb of 2019.
We submitted a FOIA request to the VA Attorney General’s office requesting any and all documents regarding any prosecutions for non-citizen voters in the same time period as our data covers. We received a response that no relevant records were identified.
Correction Note 2024-08-27: After reviewing this article in response to a question from a local VA electoral board member, it was discovered that there are inaccuracies in the table presented below. I am working to determine the root cause. My best guess at the moment is that these errors are due to (my) human error when I was creating the pivot table to author this blog post. Updates to follow, as I am working to recreate the data analysis that went into generating this blog post from the raw source material and archived code revisions. It should be noted that more recent data and analysis on this topic has been posted here, but for completeness I want to make sure that this historical post is corrected and reviewed as well for any errors or issues.
Background:
The VA Department of Elections continuously tries to identify and remove invalid or out of date registration records from the voter rolls. One category used for removal is if a registrant has been determined to be a non-citizen. It is required by the VA Constitution that only citizens are allowed to vote in VA elections.
In elections by the people, the qualifications of voters shall be as follows: Each voter shall be a citizen of the United States, shall be eighteen years of age, shall fulfill the residence requirements set forth in this section, and shall be registered to vote pursuant to this article. …
VA Constitution, Article II, Section 1. https://law.lis.virginia.gov/constitution/article2/section1/
Additionally, according to VA Code Section 24.2-1004, the act of knowingly casting a ballot by someone who is not eligible to vote is a Class 6 felony.
A. Any person who wrongfully deposits a ballot in the ballot container or casts a vote on any voting equipment, is guilty of a Class 1 misdemeanor.
B. Any person who intentionally (i) votes more than once in the same election, whether those votes are cast in Virginia or in Virginia and any other state or territory of the United States, (ii) procures, assists, or induces another to vote more than once in the same election, whether those votes are cast in Virginia or in Virginia and any other state or territory of the United States, (iii) votes knowing that he is not qualified to vote where and when the vote is to be given, or (iv) procures, assists, or induces another to vote knowing that such person is not qualified to vote where and when the vote is to be given is guilty of a Class 6 felony.
https://law.lis.virginia.gov/vacode/title24.2/chapter10/section24.2-1004/
ELECT makes available for purchase by qualifying parties various different data sets, including the registered voter list (RVL) and the voter history list information file (VHL). Additionally, ELECT makes available a Monthly Update Service (MUS) subscription that is published at the beginning of each month and contains (almost) all of the Voter List changes and transactions for the previous period.
In the MUS data there is a “NVRAReasonCode” field that is associated with each transaction that gives the reason for the update or change in the voter record. This is in accordance with the disclosure and transparency requirements in the NVRA. One of the possible reason codes given for records that are removed is “Determined Non-Citizen.”
EPEC has been consistently purchasing and archiving all of these official records as part of our ongoing work to document and educate the public as to the ongoing operations of our elections. (If your interested in supporting this work, please head on over to our donation page, or to our give-send-go campaign to make a tax-deductible donation, as these data purchases are not cheap!)
EPEC looked at the number of records associated with unique voter identification numbers that had been identified for removal from the voter record due to non-citizenship status, per the entries in the MUS, and correlated those results with our accumulated voter history list information in order to determine how many non-citizen registrations had corresponding records of ballots cast in previous elections. We only considered those records that are currently in a non-active state as of the latest MUS transaction log, as some determinations of non-citizenship status in the historical MUS transaction log might have been due to error and subsequently corrected and reinstated to active status. That is, we are not considering those records that had a “Determined Non-Citizen” disqualification, but were then subsequently reinstated and reactivated by ELECT.
Results:
There were 1,481 unique voter records marked for removal with the reason of “Determined Non-Citizen” and not subsequently reinstated in the accumulated MUS record that EPEC began collecting in mid-2023. Of those 1,481 records there were 335 unique voter ID’s that also had a record of casting one or more ballots in the accumulated vote history data that EPEC has been gathering, for a total of 838 ballots cast that can be identified since Feb of 2019. Figure 1 shows the distribution of non-citizen voters in the cumulative MUS file history. The blue trace represent the total identified and CANCELED non-citizen registrations, and the yellow trace represents the number of those records that also had corresponding records in the accumulated voter history data.
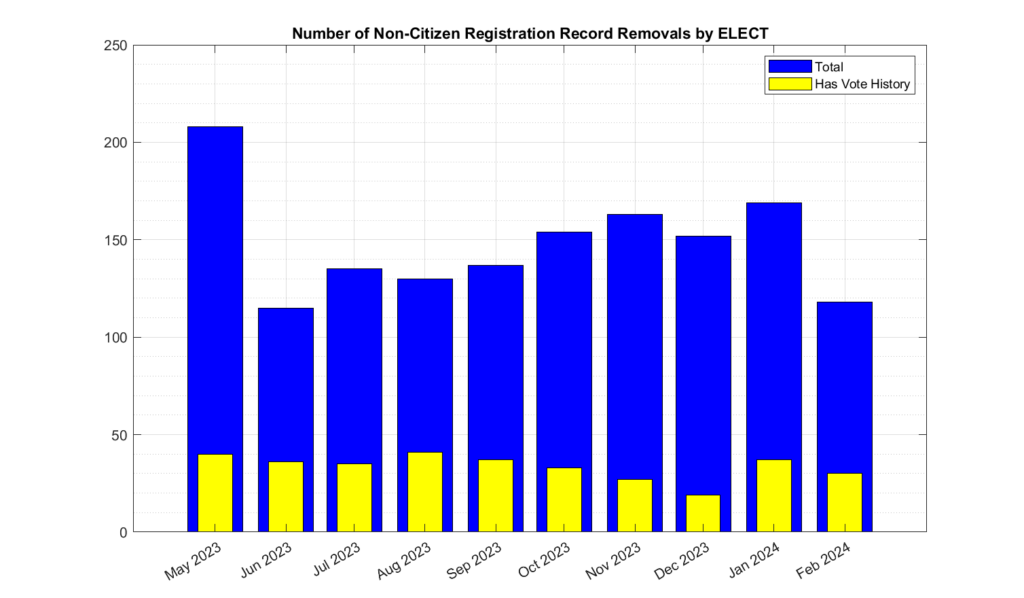
Note that the data contained in the MUS updates often covers more than a single month period. In other words, the individual MUS files are oversampled. Subsequent MUS files can therefore also have repeated entries from previous versions, as their data may overlap. Our analysis used the first unique entry for a given voter ID marked as “Determined Non-Citizen” in the cumulative MUS record in order to build Figure 1. This data oversampling in the MUS helps explain the relative increase in the May 2023 bin, and similar decrease in Feb 2024 that can be observed in Figure 1.
The distribution of identified unique voter ID’s for the 335 identified non-citizen voters per VA locality is given below in Table 1. It should be noted that each ballot record has a specific locality associated with where the ballot was cast, whereas unique individuals might move between localities over time. The assignment of unique identified individuals to each locality in table 1 is therefore based on the locality listed in the specific MUS “Determined Non-Citizen” record for that individual, while the assignment of ballot cast to Localities is based on the individual VHL records. A person could have lived and voted multiple times in one county, then moved to another county and voted again before finally being determined as a non-citizen. The same person would have generated multiple VHL records for each ballot cast, and associated with potentially different localities. This should be kept in mind when attempting to interpret Table 1.
| Locality Name | Individuals | Ballots |
| FAIRFAX COUNTY | 58 | 135 |
| LOUDOUN COUNTY | 36 | 103 |
| PRINCE WILLIAM COUNTY | 31 | 74 |
| RICHMOND CITY | 21 | 67 |
| CHESTERFIELD COUNTY | 20 | 48 |
| ALEXANDRIA CITY | 16 | 33 |
| NORFOLK CITY | 13 | 20 |
| VIRGINIA BEACH CITY | 12 | 22 |
| ARLINGTON COUNTY | 10 | 32 |
| CHESAPEAKE CITY | 9 | 24 |
| POWHATAN COUNTY | 9 | 1 |
| YORK COUNTY | 8 | 28 |
| NORTHUMBERLAND COUNTY | 8 | 4 |
| HARRISONBURG CITY | 8 | 3 |
| SUFFOLK CITY | 7 | 18 |
| STAFFORD COUNTY | 4 | 12 |
| WARREN COUNTY | 4 | 11 |
| RUSSELL COUNTY | 4 | 1 |
| CLARKE COUNTY | 3 | 4 |
| HENRY COUNTY | 3 | 2 |
| NEWPORT NEWS CITY | 2 | 33 |
| PORTSMOUTH CITY | 2 | 31 |
| JAMES CITY COUNTY | 2 | 9 |
| HENRICO COUNTY | 2 | 7 |
| CHARLOTTESVILLE CITY | 2 | 6 |
| FAIRFAX CITY | 2 | 6 |
| WASHINGTON COUNTY | 2 | 6 |
| CAROLINE COUNTY | 2 | 5 |
| SPOTSYLVANIA COUNTY | 2 | 5 |
| NEW KENT COUNTY | 2 | 4 |
| ALBEMARLE COUNTY | 2 | 3 |
| PRINCE EDWARD COUNTY | 2 | 3 |
| LYNCHBURG CITY | 2 | 2 |
| HAMPTON CITY | 1 | 14 |
| MECKLENBURG COUNTY | 1 | 9 |
| ROCKINGHAM COUNTY | 1 | 9 |
| MANASSAS CITY | 1 | 4 |
| PETERSBURG CITY | 1 | 4 |
| AMELIA COUNTY | 1 | 3 |
| ORANGE COUNTY | 1 | 3 |
| SOUTHAMPTON COUNTY | 1 | 3 |
| SUSSEX COUNTY | 1 | 3 |
| BRUNSWICK COUNTY | 1 | 2 |
| FAUQUIER COUNTY | 1 | 2 |
| GREENE COUNTY | 1 | 2 |
| AUGUSTA COUNTY | 1 | 1 |
| BEDFORD COUNTY | 1 | 1 |
| CULPEPER COUNTY | 1 | 1 |
| DANVILLE CITY | 1 | 1 |
| DINWIDDIE COUNTY | 1 | 1 |
| FRANKLIN COUNTY | 1 | 1 |
| FREDERICK COUNTY | 1 | 1 |
| FREDERICKSBURG CITY | 1 | 1 |
| LOUISA COUNTY | 1 | 1 |
| PRINCE GEORGE COUNTY | 1 | 1 |
| SHENANDOAH COUNTY | 1 | 1 |
| WINCHESTER CITY | 1 | 1 |
| FRANKLIN CITY | 1 | 0 |
| CAMPBELL COUNTY | 0 | 6 |
| 335 | 838 |
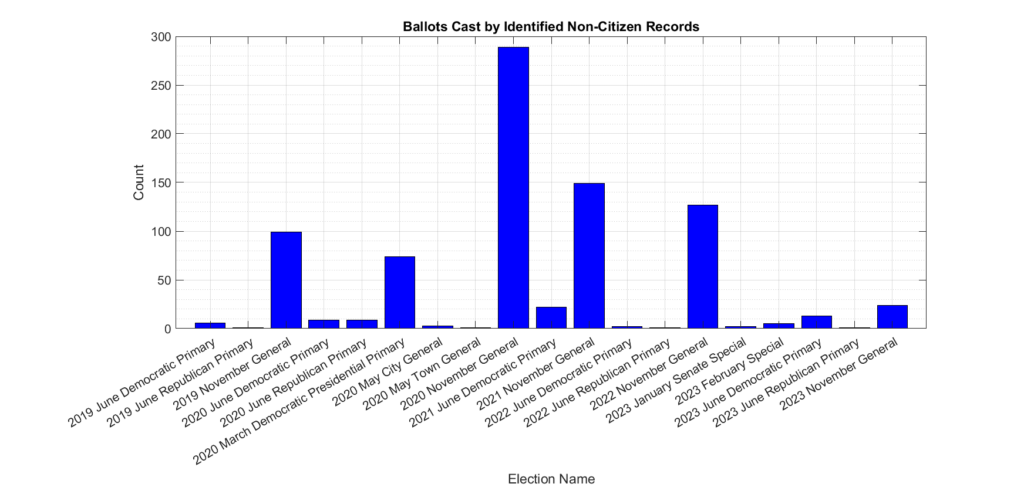
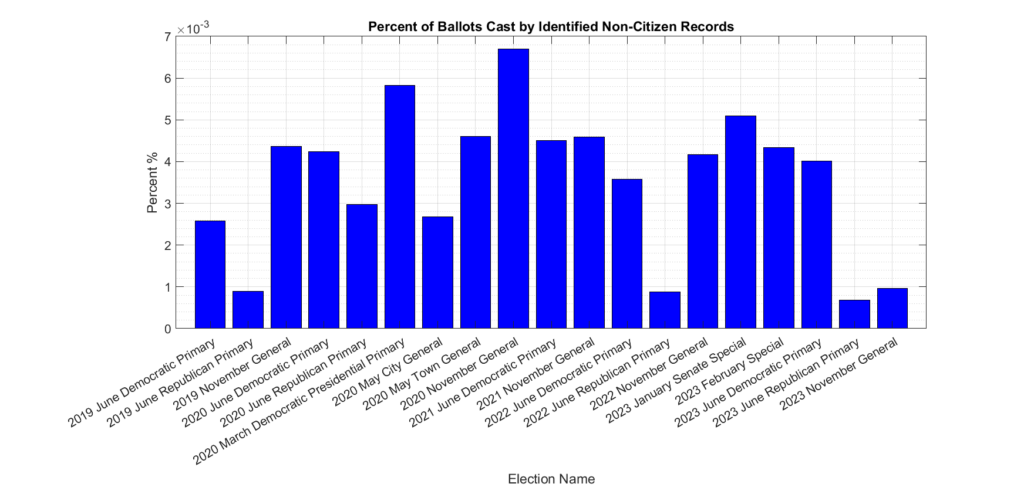
The distribution of the 838 ballots that were identified as being cast by non-citizen voters (yellow trace in Figure 1) in previous elections is shown in Figure 2a. The most significant spikes are in the 2019, 2020, 2021 and 2022 November General elections, as well as the 2020 March Democratic presidential primary. Figure 2b, which shows this distribution as a percentage of votes cast, was added on 3/24/2024 per feedback on X/Twitter after the initial posting of this article.
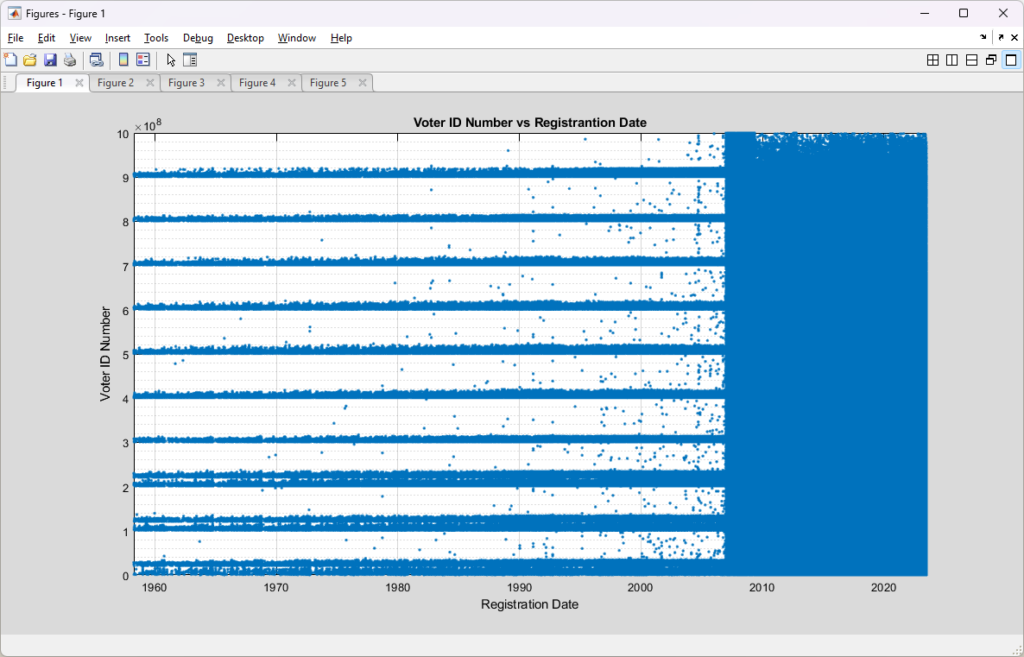
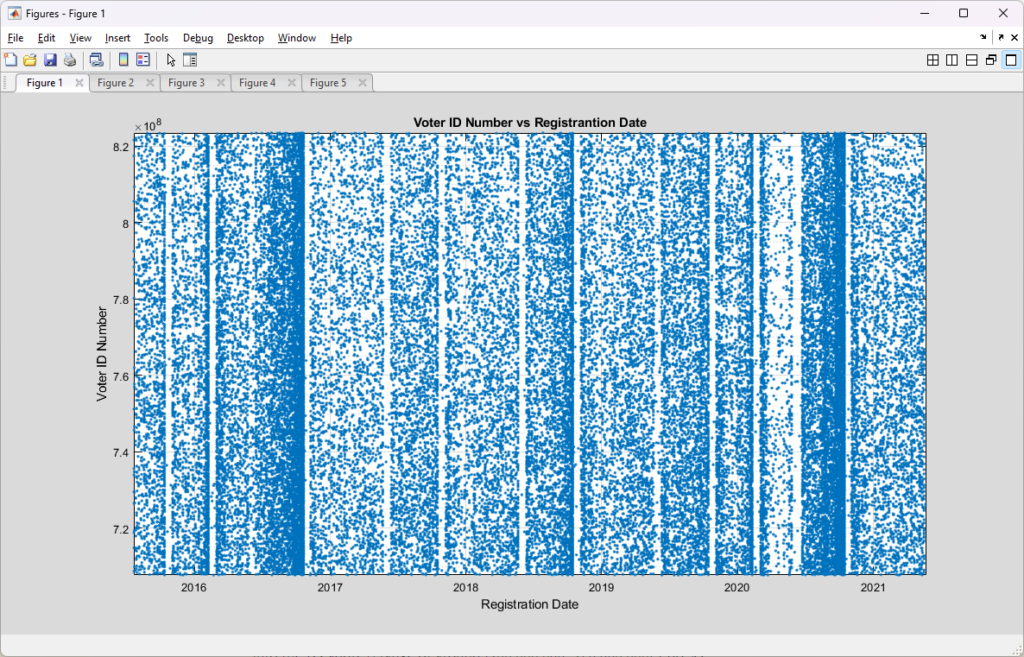
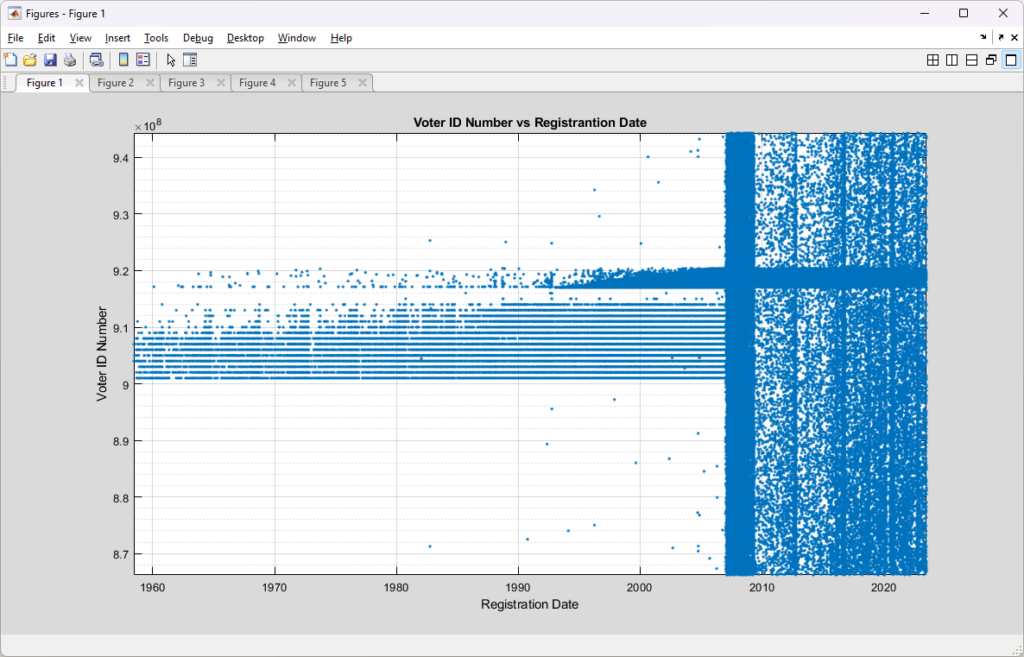
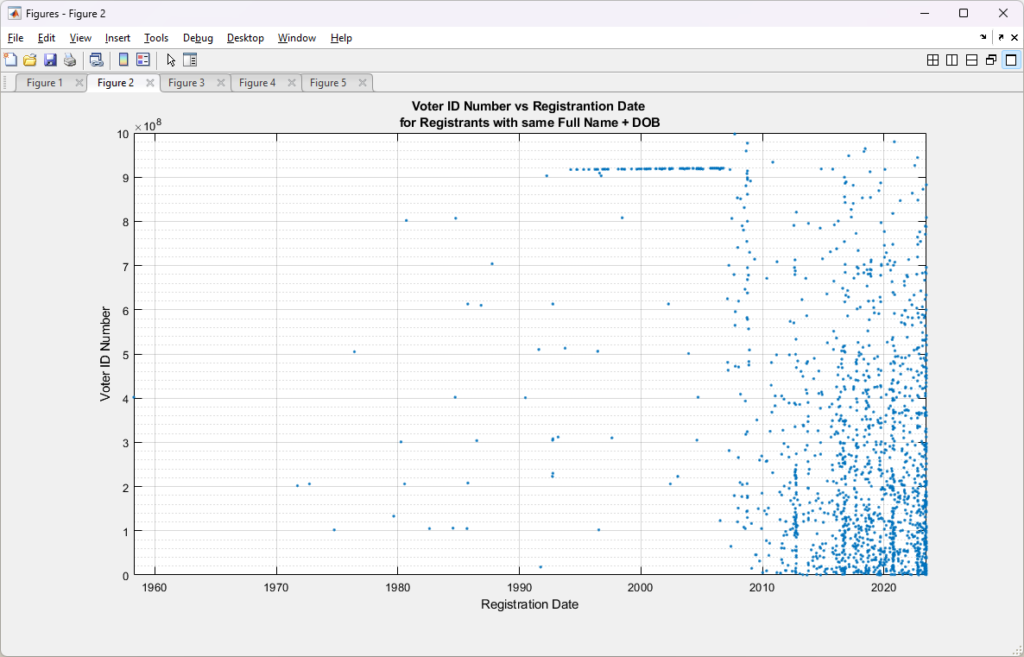
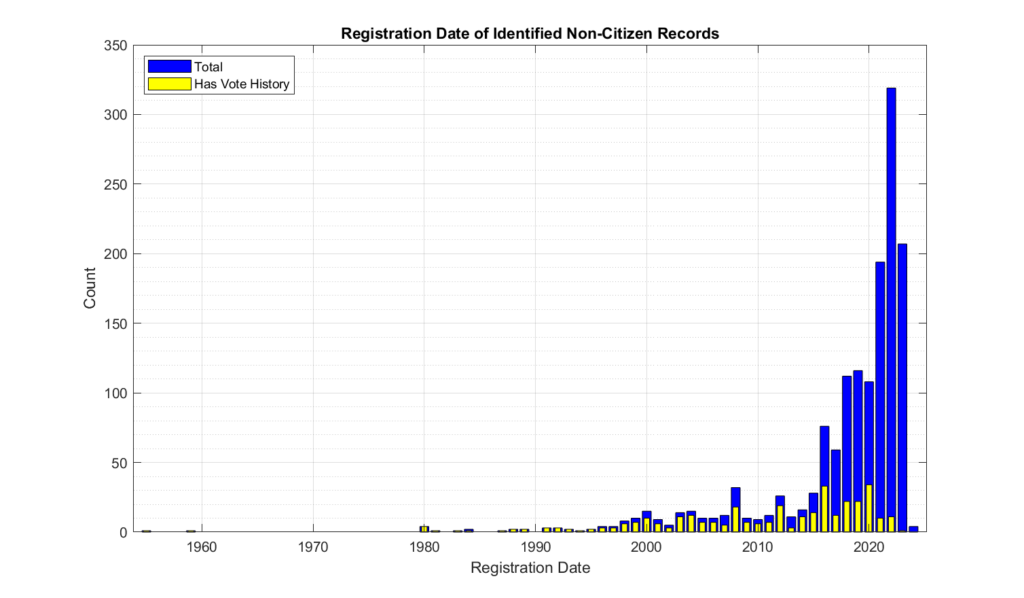
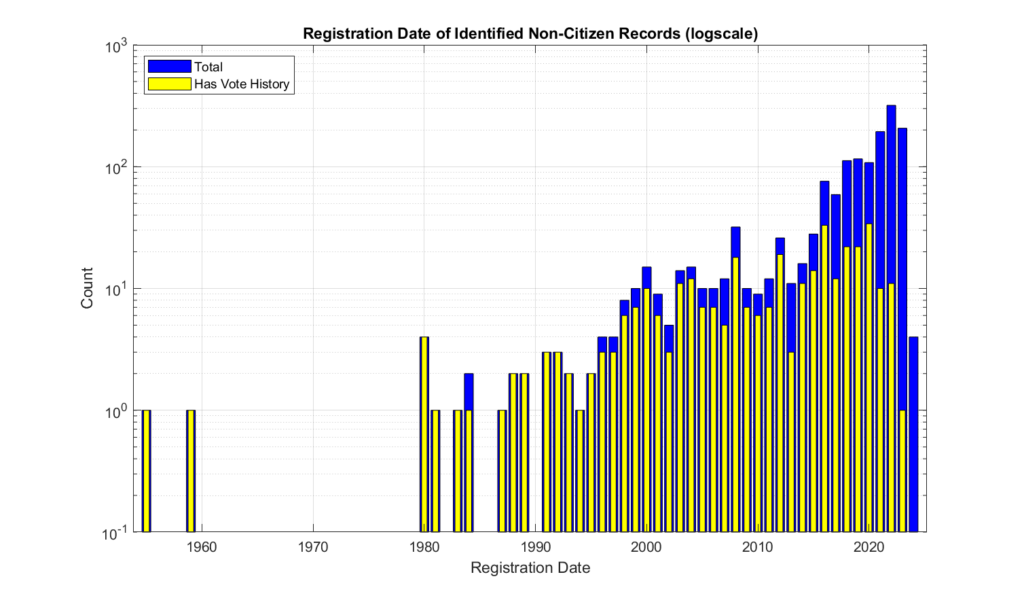
Figures 3 and 4 show the distribution of the registration dates of the identified non-citizen records. The same data is plotted in figure 3 and 4, with the only difference being the scale of the Y-axis in order to better observe the dynamic range of the values. When we look at the registration date of these identified records, we see that there is a distinct relative increase starting around 1996, and then again around 2012.
EPEC made a FOIA request to the VA Attorney General’s office on March 11, 2024 inquiring for any records regarding how many prosecutions for non-citizen voting had occurred since June of 2023. We received a response that the AG had no such relevant records.
It should be noted for completeness that if we consider records that have been “Determined Non-Citizen” at any point in the MUS logs, regardless of their current status, we find 1,532 individual records that have been determined non-citizens. Of the 1,532 there was 379 with corresponding vote histories, accounting for 1,019 ballots cast. Omitting the reinstated and reactivated records results in a percent difference of (1532-1481)/1532*100 = 3.33% diff in total determined non-citizen records, (379-335)/379*100 = 11.6% diff in number of determined non-citizen voters, and (1019-838)/1019*100 = 17.76% diff in number of determined non-citizen ballots.
Discussion
It appears from the MUS data, that the VA Department of Elections (ELECT) is doing routine identification, cleanup and removal of non-citizen registrations, which is a good thing and we commend them for their continued efforts to maintain clean voter registration lists.
However, the fact that a small number of these identified non-citizen registrations are also associated with (presumably … if the data from ELECT is accurate) illegally cast ballots in previous elections does raise a number of questions that citizens should be (politely) asking and discussing with their legislators, elected and appointed government officials. Each act of non-citizen voting is a de-facto disenfranchisement of legal voters rights, and is a punishable offense under VA law.
Q: How did these registrants get placed onto the voter rolls in the first place?
Q: What method and/or data sources are used by the state to identify non-citizen registrations for removal? If that process is exhaustive, and covers all registrations, then these numbers might be considered to represent a statistical complete picture of the problem. If that process is not exhaustive, in that it only uses serendipitous corroborating data sources, then these results likely under-represent the scale of the issues.
Q: As noted above, we are only considering here those individuals who have not had their records re-instated or reactivated after a determination of non-citizen status. We do not have enough information to determine how or why some records were first determined to be non-citizen, canceled and then subsequently re-instated. One potential area of concern is determining whether or not registrants might be falsely or errantly claiming to not be a citizen on official documents in order to be excused from jury duty, for example, and then work to re-instate their voting status once those documents percolate through the system to ELECT and are flagged for removal. This is a wholly separate but serious issue, as making false claims on official documents is itself a punishable offense.
Q: What procedures, processes and technical solutions are in place to prevent current or future registration and casting of ballots by non-citizens? This is especially pertinent given the current state of the flow of illegal immigrants crossing our national borders. According to a recent report by Yahoo Finance, VA is one of the top 30 destinations for illegal migrants, with both Loudoun County and Fairfax making the list.
Q: Why have none of the identified non-citizens who also cast ballots been investigated or prosecuted under VA Code 24.2-1004? As the identification of these ballots comes directly from looking at the official records produced by ELECT, it seems prudent for these to be forwarded by ELECT to the AG’s office with a recommendation to investigate and prosecute. Yet our FOIA request to the VA AG’s office inquiring as to any records associated with these types of investigations or prosecutions produced a “no relevant records exist” response.
Additionally, this evidence which is derived from only official state records, directly contradicts multiple news media reports and attestations that non-citizen voting is a “Myth”, and that non-citizen voting happens “almost never”. If the data from ELECT is accurate, then there are at least 838 ballots that have been cast by non-citizen voters just since 2019. Now, that is still very infrequent, but it is not “almost never.” It is a legitimate concern … and these discoveries are only the registrations that have been found and removed from the voter roles by ELECT and that we can observe in the data. We do not know how many exist that we do not know about.