Categories
Election Data Analysis Election Forensics Election Integrity Press Release

Multiple Errors Found in Virginia’s 2022 Election Scanner and Pollbook Data

At Least Two Precincts Showed Different Physical Ballot Count Compared to Scanner Counts

Non-profit electoral process group calls for a full audit of precincts with discrepancies before Commonwealth of Virginia certifies local and statewide election results.

November 14, 2022 — Electoral Process Education Corporation (EPEC), a non-profit 501c (3) that performs election data analysis, is urging Virginia’s public election officials to verify scanner machine ballot counts before certification of results in key precincts as a result of recent findings.

The recommendation comes after election officers, analysts and observers discovered discrepancies in the data reported to and provided by the Virginia Department of Elections (“ELECT”). The findings raise questions about the proper certification of the machines in question, and whether issues were addressed according to statewide election protocols.

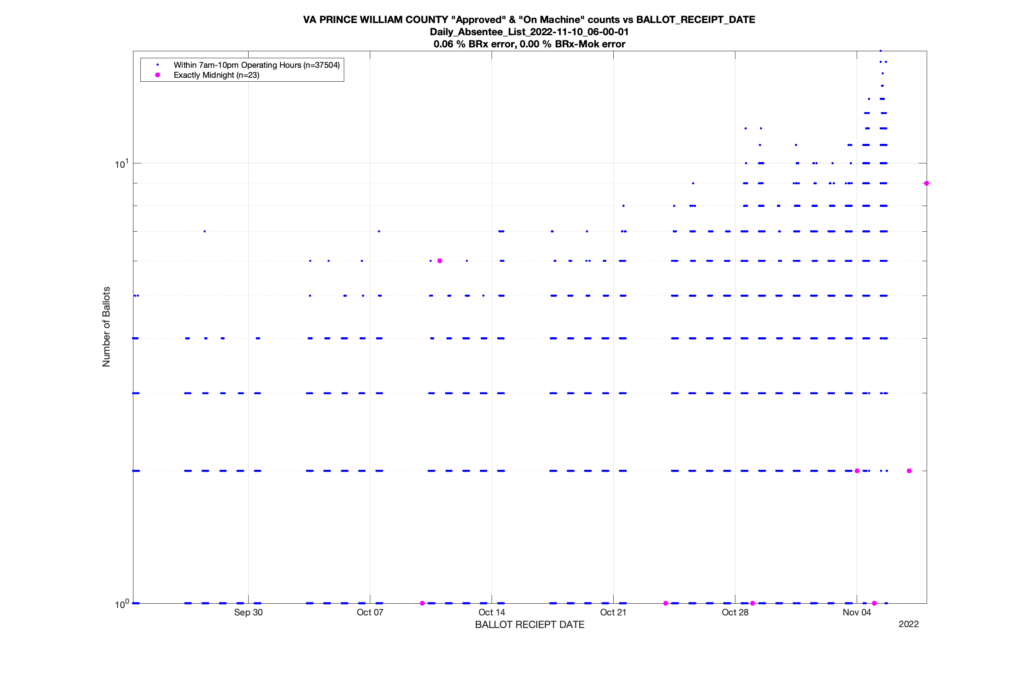
In at least two precincts in Prince William County (PWC) the number of physical ballots cast and accumulated was different than the machine scanner’s tally of ballots, as reported by election officers. The numbers must align as part of the precinct’s tracking of total ballots cast at the voting location.

Although the number of ballots impacted was small, the repeated findings raise questions about the origin of the errors and whether the machines were operating correctly.

In Virginia’s VA-7 Congressional District Race, election officers observed differences in ballot counts of voters who were checked in with pollbooks compared to the actual number of ballots in the machines throughout the day. When the election officers went to close out the polling station, they discovered a ballot scanner with 27 more ballots represented in the electronic total than physical ballots present inside the machine’s collection bin.  The scanner reported 531 ballots scanned and recorded, but only 504 physical ballots were in the collection bin underneath the scanner.

Election officers documented these issues with the General Registrar and Electoral Board and recorded the information in the official Statement of Results (SOR) and Chief’s notes. The officers proceeded to conduct a hand tabulation of the vote totals on the ballots in accordance with election procedures. They repeated this tabulation multiple times, with multiple officers witnessing the process.  The results of the hand tabulation, as compared to the scanner totals, is as follows:

The Democrat candidate received 22 of the unexplained votes, a 7.86% difference compared to the physical ballot tally for the candidate. The Republican candidate received another 3 votes, a 1.34% difference over the physical ballot tally for the candidate.  There were 2 write-in ballots.

In Virginia’s VA-10 Congressional District Race, elections officers also found a small difference between machine scans and physical ballots (approximately 5-10, out of 1505 cast). EPEC is working to confirm if this discrepancy was reported on the official Statements of Results or not.

EPEC’s collection and analysis of additional datasets resulted in the discovery of further issues and discrepancies, to include the following:
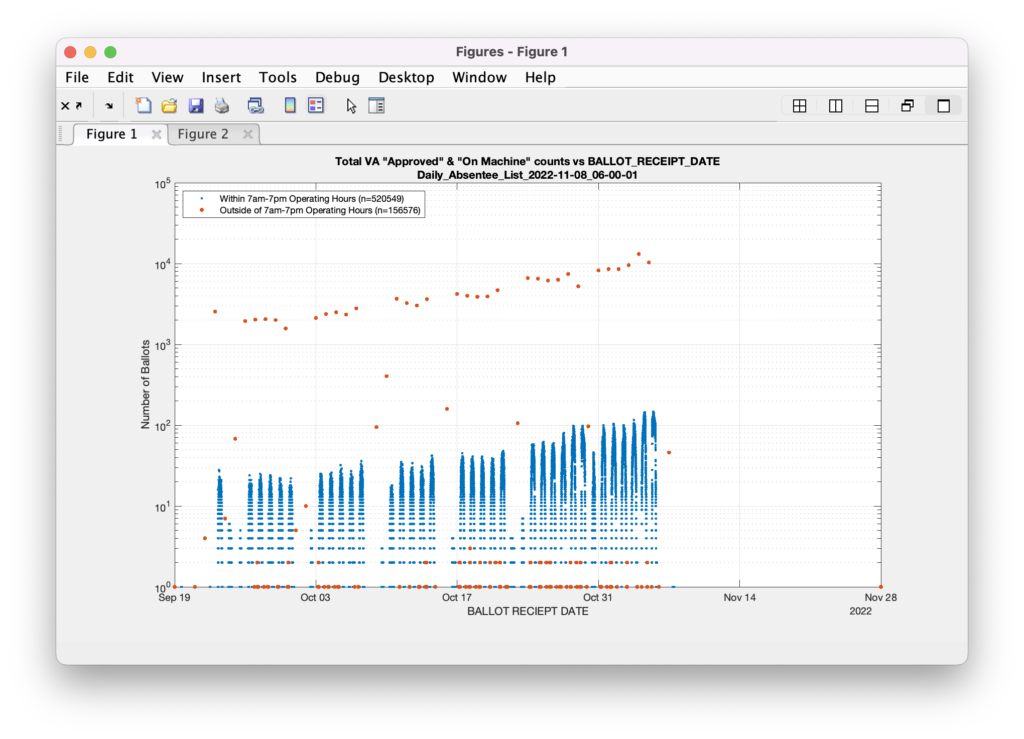
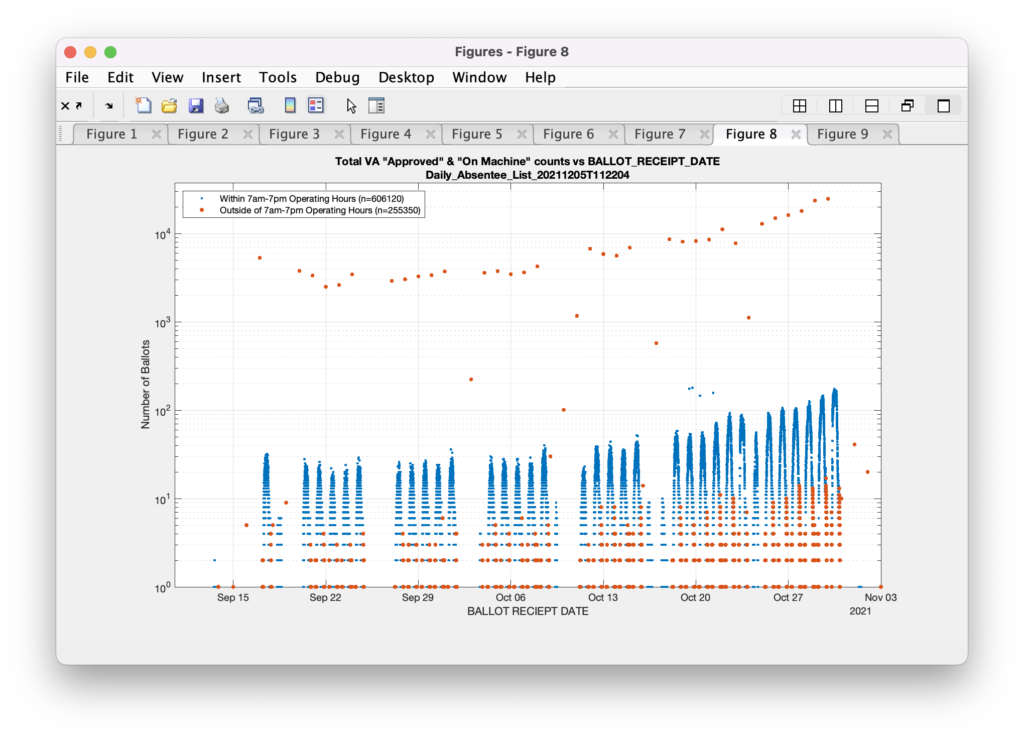
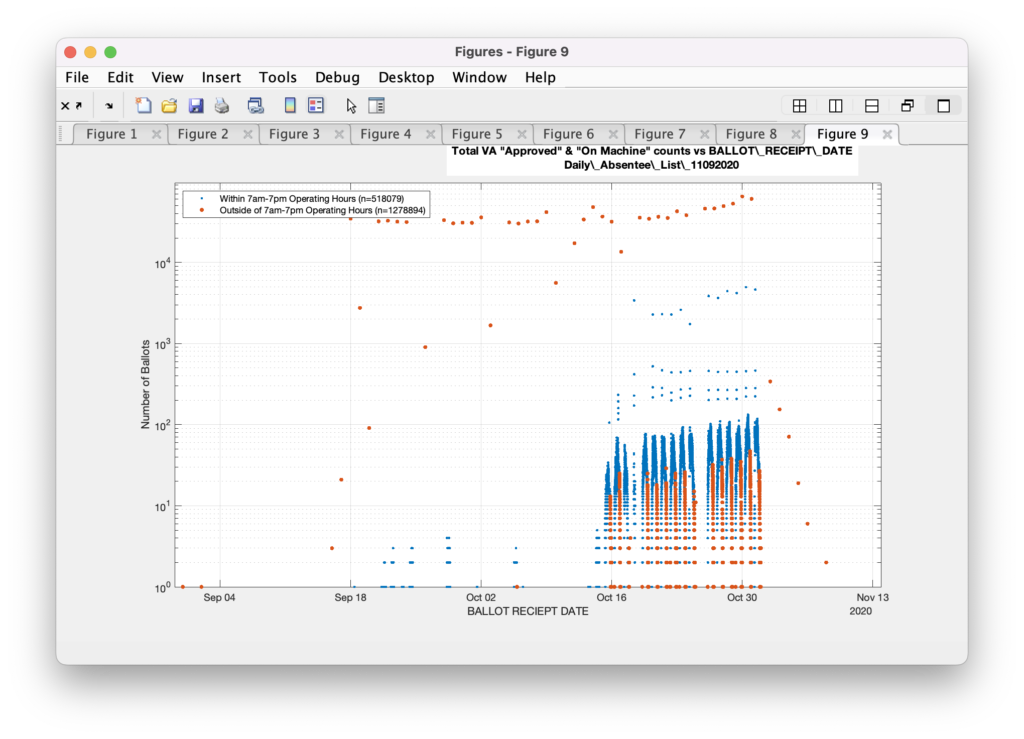
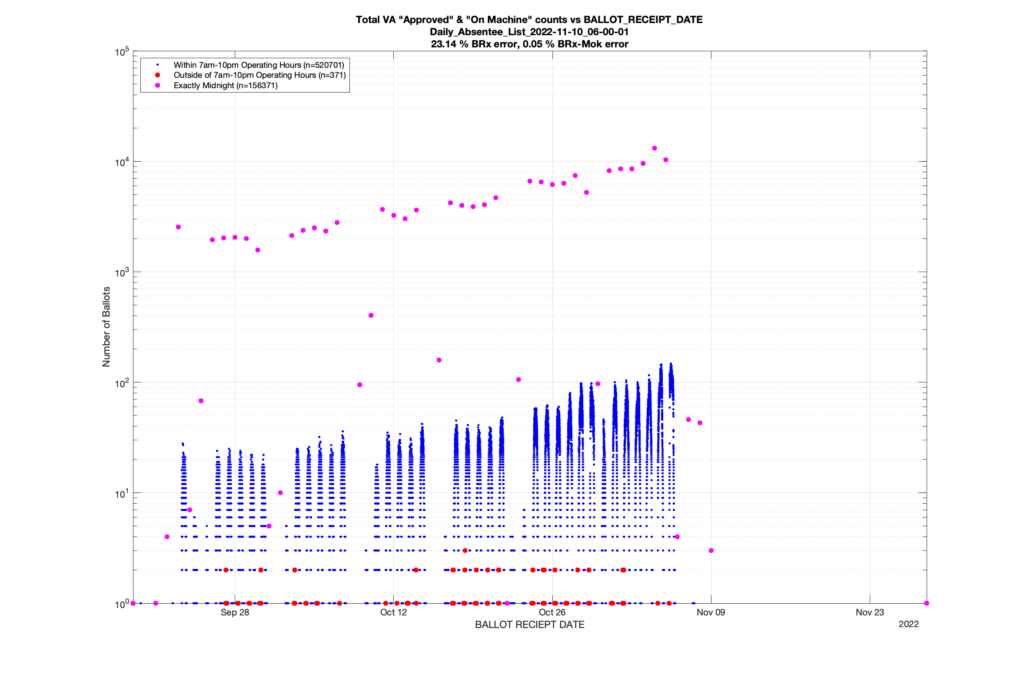
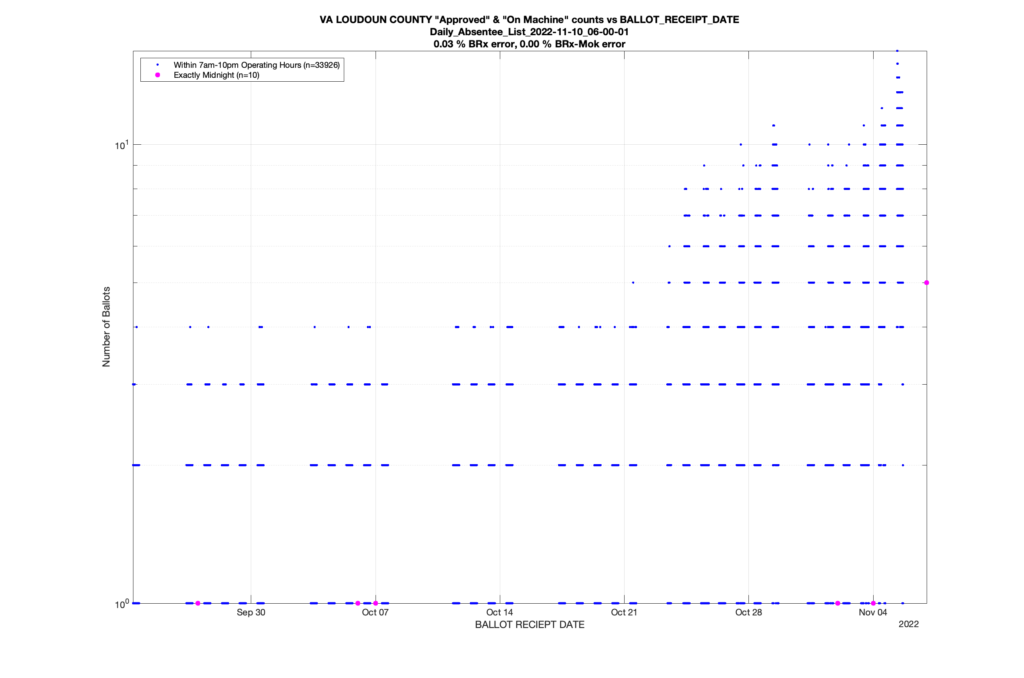
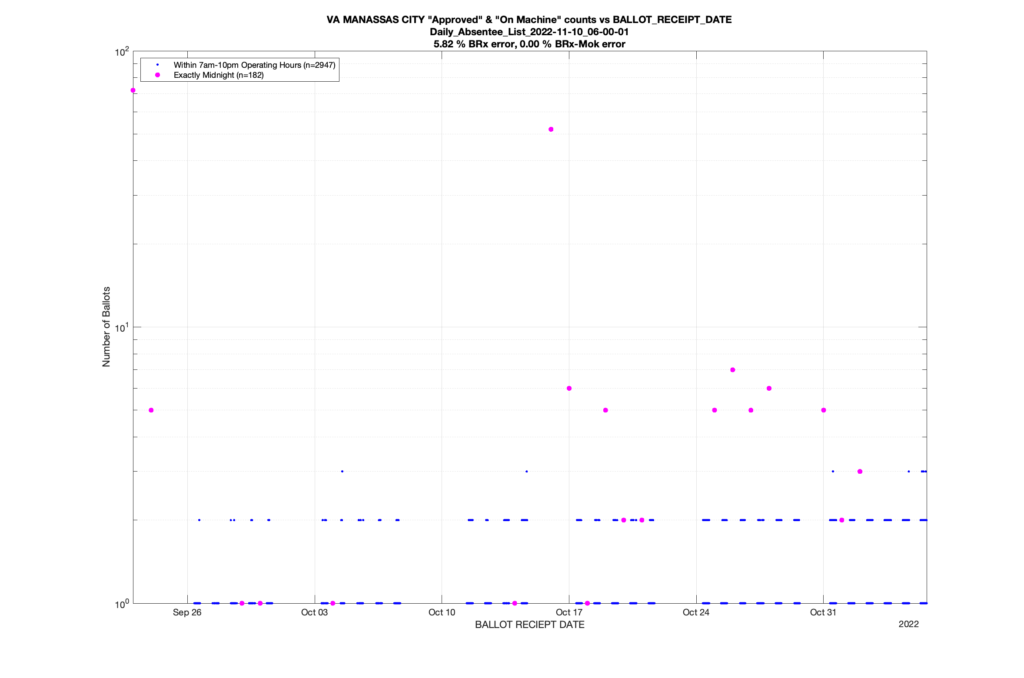
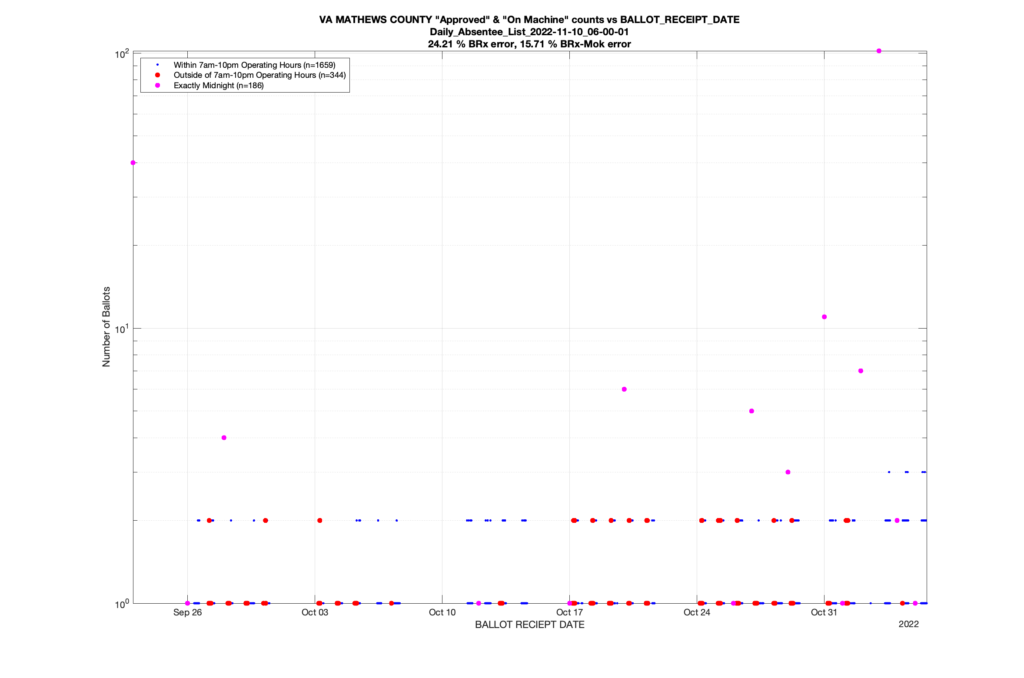
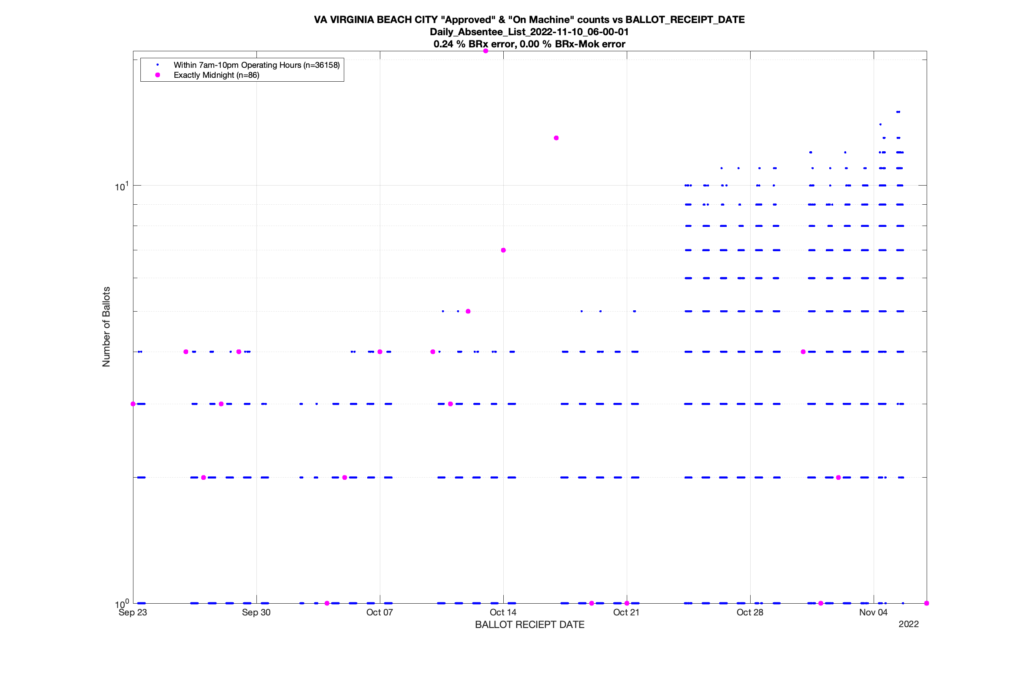
  • EPEC assisted poll watching teams with a unique web form for documenting observations. According to its analysis of 738 reports (at the time of this writing) by poll watchers in Virginia, 21% (155 reports) contained at least one serious issue flagged for further review; 10.16 % (75 reports) specifically flagged data discrepancies or equipment issues. The VA poll watcher reporting summary can be reviewed at https://digitalpollwatchers.org/2022-general-election-va-poll-watcher-reporting-summary/

The PWC Electoral Board is expected to meet Tuesday, Nov. 15th, to perform a final certification of local election results.  The State Board of Elections will subsequently meet to certify the results of the election statewide.

EPEC is urging VA election officials to perform a detailed, transparent process to explain and rectify these discrepancies. It has compiled a list of recommendations based on its analysis:

  • Sequester all equipment at voting precincts that found discrepancies between ballots and machine-counts, perform a full hand count and tabulation audit for these precincts.
  • Physical ballots should be compared with the Scanner Report Tapes, the full Cast Vote Record (CVR), Digital Ballot Images and other machine records and logs. 
  • Ensure election equipment complies with Virginia’s election statutes by certifying software, hardware, and programming hash codes, and then checking randomly selected precincts with the same equipment but with no reported issues.
  • Standard processes should be updated to require verification that the number of ballots in the scanner collection bin match the scanner result report tape. If the numbers do not match, an on-premises hand tabulation shall be performed by the election officers and the results recorded in the official public record.

Update 2022-11-16:

The Prince William County Board of Elections and Office of Elections heeded the call to investigate further and performed a hand recount of the ballots for the VA-7 precinct in question. See Virginia’s Prince William County Conducts Ballot Recount after Errors Reported in Election Scanner for more information.

Categories
Election Data Analysis Election Forensics Election Integrity technical

“On Machine” ballots with logically impossible time stamps

In looking over the VA DAL data, one interesting issue that is readily apparent, is that the BALLOT_RECIEPT_DATE field for in-person, on-machine early vote data is logically impossible.

These time-stamps are supposed to be generated by the electronic poll-books when a voter is checked in at an in-person early voting site. The appeal and rationale for utilizing electronic poll-books is exactly because the can automate the recording of check-in and (theoretically) minimize human error. The operating hours of VA in-person early voting sites are limited to 7am – 7pm. I’m not aware of any in-person early voting center that had extended hours past those. Therefore, logically, we would expect that the electronic poll book generated time stamps for check-ins for in-person on-machine early votes would fall within the 7am – 7pm bounds.

The plot below is generated directly from the Daily Absentee List (DAL) file pulled from the VA Department of Elections on 11/08/2022 at 6am. The x-axis gives the time (rounded to the nearest minute) of the BALLOT_RECIEPT_DATE field associated with recorded Early In-Person On-Machine ballots in the file. The (logrithmic) y-axis gives the total number of Early In-Person On-Machine records that were recorded with that unique timestamp. The blue trace represents all of the records that fall within the daily 7am – 7pm bounds, and the red trace represents the data outside of those bounds.

There were 520,549 records that fall within the expected time bounds, and 156,576 that fall outside of the bounds. From a purely systems perspective, that means that the ability of our electronic poll books (or the backend database they are tied to) to accurately record the check-in time of Early In-Person On-Machine voters has an error rate of 156576 / (156576+520549) = 23.12%.

Let me say that again. A 23.12% error rate.

23.12% of the time, our electronic poll-book based system is reporting a logically impossible time for a person to have physically walked into an open + operating early voting location to check-in and cast their ballot.

Now, if we want to be generous and allow for the possibility that maybe voting locations opened early or closed late and we pad our (7am – 7pm) bounds to be from (6am – 8pm) and run the same analysis, we still get an error rate of 23.09%.

If we pad the hours of operations limits even further to (5am – 9pm), we still get an error rate of 23.06%.

If we run the same analysis using the 7am – 7pm bounds on the 2021 and 2020 data we get 29.64% and 71.17% error rates, respectively.

Update 2022-11-13

I adjusted the allowed times to 7am-10pm and re-ran the most recent 2022, 2021 and 2020 DAL files, as well as breaking down by locality. While doing this I noticed that some localities had all timestamps set to midnight, while others still had invalid timestamps set to unique values (but outside operational hours), and some had combinations of both. I’ve delineated the plots such that magenta traces are from ballot receipt timestamps that are all set to midnight, red trace is invalid timestamps not set to midnight, and blue traces are valid within 7am-10pm hours of operation (which is very very generous).

There are two error percentages being computed and being displayrd in the graph title area. The first (“BRx error”) is as described above and results in a 23.14% error in the 2022 VA statewide data. The second (“BRx_Mok error”) is as described above except we allow for the uniformly midnight ballot receipt dates to be presumed allowable, and results in a 0.05% error metric.

The inclusion of the latter class of error computation is in order to account for the remote chance that a locality is legitimately using paper poll books or otherwise not recording the time of the voter checkin, but only recording the date information (which would be consistent with all timestamps at midnight). VA requires the use of electronic poll books, but there are still some that use manual entry paper poll-books as backup. So even IF that was the explanation for why so many entries were uniformly timestamped to midnight … (A) why did they have to go to their paper poll book backups in the first place? and (B) we still have a residual error of 0.05% across the state that needs to be explained even after removing uniform midnight timestamps from consideration. That might not seem a terribly huge error rate at first blush, but when you consider that most electronic data recording systems (at least that I am aware of) have error rate requirement thresholds for acceptance testing set to the order of 1/1,000,000 … thats still unacceptable. I have been unable to find a documented requirement for error rate threshold for the electronic poll book systems used in VA, as per the VA department of elections.

The complete tabulation of all errors for each locality is provided here:

Selected Locality Plots:

The segmented Prince William County (my home county) 2022 plot is below. There is a 0.06% error rate of invalid (all midnight) timestamps in the Ballot Receipt date data.

The segmented Loudoun County 2022 plot is below. There is a 0.03% error rate of invalid (all midnight) timestamps in the Ballot Receipt date data.

The segmented Manassass City 2022 plot is below. There is a 5.82% error rate of invalid (all midnight) timestamps in the Ballot Receipt date data.

The segmented Mathews County 2022 plot is below. There is a 24.21% error rate of total invalid timestamps in the Ballot Receipt date data, and a reduced error rate of 15.71% when allowing all midnight timestamps to be considered as valid.

The segmented Virginia Beach City 2022 plot is below. There is a 0.24% error rate of invalid (all midnight) timestamps in the Ballot Receipt date data.

The complete set of generated plots for every locality is included in the attached zip file:

Categories
Election Data Analysis Election Integrity Uncategorized

VA Daily Absentee List

The EPEC staff monitors the Virginia Daily Absentee List for unexpected values. We essentially “audit” the electoral process in Virginia during an election cycle. We are currently monitoring the 2022 General Election.

One of the areas of interest is the DAL – Daily Absentee List. It shows the current status of absentee voting in Virginia – by mail in ballot and early voting (absentee in person).

In Virginia, Absentee In-Person Early Voting started on Friday, September 23. Our initial DAL file was saved on Saturday, September 24, at 9 PM.

The official Ballot Status in the DAL at 9 PM was:

Issued: 290,095

Federal Worker Absentee Ballot (FWAB) 1

Marked: 2,118

On Machine: 8,397

Not Issued: 5,766

Unmarked: 546

Pre-Processed: 1

Deleted: 13,015

Grand Total: 319,939

Nearly 19,327 ballots – 6 % of those requested, were in a state which would not be counted if the election vote counting period were over today – Not Issued, Unmarked, or Deleted. There was also 1 ballot in a Pre-Processed Ballot Status state. The magnitude of ballots in one of these “states” is surprising but not alarming.

It appears Not Issued means there is either a backlog in mailing out ballots or an issue with voter registration – legal name, address of record in the registration database, citizenship, etc. Unless the backlog or issue is resolved, the voter will be denied a ballot.

Unmarked is associated with mail-in Absentee Ballots. A Marked ballot is moved to an Unmarked status if an election official notices an error with the associated absentee ballot documents such as a name or address error, missing signature, or missing signature verification. Election officers are required to contact voters if their ballot requires a cure – correction to the information accompanying the ballot. If the cure is not provided, the ballot will not be counted. Some voters choose to have a new ballot mailed to them if a cure is required, in which case a ballot in the Unmarked state will be spoiled and marked Deleted in the system. This is one of the reasons we see voters having one or more Deleted ballots associated with them in the DAL files.

Deleted ballots are not supposed to be processed (counted). We believe these are officially referred to as “spoiled ballots. The process to keep these separate from countable ballots is an interest area for election integrity observers. The most common reason for ballots to get Deleted (spoiled) is voter error. Examples: mistake when filling out a ballot in person resulting in the first ballot being spoiled and a new ballot issued, or a voter surrendering an absentee ballot to vote in person or receive a new one via the mail.

More accurate voter registration records MAY reduce the volume of initial Not Issued and Deleted ballots. Our post-election observations and recommendations will address this issue. Our initial hypothesis – changes in residency, relocation within Localities, ineligible voters requesting ballots, and voters passing away probably account for most of the unexpectedly large values of ballots in an “at risk” state.

Categories
Uncategorized

Multiple Active Ballots

Individual voters should NEVER have more than one (1) active ballot. If this occurs, there is a risk that human error by an election official will result in a voter having more than one ballot counted.

Virginia has 226 individuals with two or more active ballots according to the Daily Absentee List file as of 28 October, 6 AM. This is occurring in nearly half of the Localities in Virginia – 59 out of 133.

This is a process issue – either procedural, or ballot tracking. The process should make it impossible for more than one vote to be counted.

It is possible that these will be caught before they get counted … but mistakes are made when people get overloaded or distracted. Process software should prevent the possibility of this “defect” occurring to prevent the perception of malfeasance.

Categories
Election Data Analysis Uncategorized

VA “Provisional” Ballots

The number of ballots in “Provisional” status is growing. This is to be expected because Virginia began allowing “same day voter registration” on 1 October, and same-day votes are to be labeled Provisional.

A handful of ballots were Provisional status prior to 1 October, and this ought to be explained. The steady increase of Provisional ballots started on 19 October. The count of Provisional ballots is currently growing by approximately 200 ballots each day. This number is expected to grow exponentially as we approach election day.

The root cause of the Provisional ballot increase is most likely “same day registration and voting” but a detailed study has not yet been performed.

Categories
Uncategorized

Variances Observed in TX Early Vote Data

Recently I’ve started downloading all of the data from the TX secretary of state website multiple times per day. Each time I download the data I grab new versions of files representing how many Mail-In or In-Person votes have happened since mail-in votes have started to be accepted, according to the TX SOS. Note that this TX Early Voting return data, which is required by law to be publicly posted daily, is supposed to reflect the number of voted ballots (either In-Person or Mail-In) per the previous days in the ongoing election and serves as the official public record of these ballot transactions.

The TX SOS does site not post the cumulative results, but instead has individual links by day that show the totals of each category of voted ballot. I have downloaded copies all of this data over multiple days.

Now you would think, that if the TX SOS data was trustworthy and accurate, that I shouldn’t see differences in the historical data on the TX SOS site day to day. I should see new data as a newly available download, but the data associated with previous days results should stay the same.

… except it doesn’t.

In the gallery below are 3 separate graphs of the data pulled from the TX SOS site. Each pull of the data grabbed the entire history of the data.

If you play the images in sequence you will notice that between the 1st (captured on 10/26 @ ~3pm) and second image (captured 10/27 @ ~7am) there are a few thousand ballots that suddenly appear in the Mail-In ballot trace attributed to 10/22. Between the second and third image (captured 10/27 @ ~9PM) you will see that there are a handful (~10) of ballots that get retrospectively added to the In-Person ballot totals attributed to 10/17 and 10/18.

What is the explanation for these additions?

I’m happy to supply the raw downloaded and timestamped files to anyone who is interested. Feel free to contact me and I will send the latest zip files and source code used to download.

Categories
Uncategorized

2022 General Election GA Daily Absentee Report Statistics

Similar to the statistics that I have been computing for the VA Daily Absentee List (DAL), I have also been collecting the daily early voting reports from the GA secretary of states website. These are also a set of cumulative files that track the status of early and absentee ballots.

I’m using the same set of processing techniques on the GA data as I am doing with the VA datafiles, save for some slight tweaks due to differences in the datasets. (1) GA doesn’t have the ‘Marked’ or ‘Pre-Processed’ distinction in how they track their mail in ballots like VA does, those records are all simply labeled as ‘Mail-In’. (2) GA has an ‘Electronic’ category for ballots, which I’m assuming is the equivalent of the ‘FWAB’ category in VA.

There are two plots below representing the same data, one plot with a linear y-axis and the other with a logarithmic y-axis. The x-axis is the date that each DAL file processed was archived and pulled from the Dept of Elections servers. Solid traces are directly extracted data from the DAL files. Dashed traces are computed metrics such as the number of “vanished” voters detected. Red datapoints are placed on traces that exhibit questionable behavior, for example if the number of “approved” and “countable” ballots ever decreases, etc. Vertical dotted lines indicate important dates.

All of the latest plots for every locality and precinct as well as the corresponding underlying CSV data files will be updated daily, and you can download them here.

The semilog versions of the plots for all localities or precincts that appear in the DAL data per locality are shown in the gallery below. The image carousel below might take a moment to load, btw.

Categories
Election Data Analysis Election Forensics Election Integrity technical

2022 VA General Daily Changes to Voter Registration Totals

Here is the changes to the voter registration numbers for each VA locality over the course of the 2022 general election. These files will be updated automatically as the data becomes available. The first graph below is the percent change with the color coding clamped to +/- 3 x the standard deviation, and the second is the absolute percent change.

The computed csv file for the above data is here: https://digitalpollwatchers.org/files/2022/VA/registration-changes/2022-va-general-voter-registration-count-changes.csv

Categories
Election Data Analysis Election Forensics Election Integrity technical

2022 VA General Election DAL File Statistics

Update 10-17-2022: There has been an issue with the VERIS system (the database that runs behind the scenes at the VA department of elections) where updates to the DAL files have not progressed since 10/14. On 10/17 there was a published change to the data files but the report generated was incomplete and cutoff halfway through its listing of CARROL COUNTY data. I had a phone conversation on 10/17 with ELECT and they are aware of the issue and working to correct it. Also I have included a new gallery at the bottom of the page of all of the individual localities or precincts that are automatically flagged as having issues of concern. Issues detected include any number of “vanishing” voters as defined below, “On Machine” ballot counts that decrease day-to-day, “Marked” OR “Pre-Processed” counts that decrease day-to-day, etc.

Update 10-18-2022: The publication of the DAL files has resumed. I have queries in to the department of elections as to the exact cause of the issues and will update accordingly as I find out more information.

Below is the current set of statistics from the 2022 VA General Election Daily Absentee List (DAL) file records. There are two plots below representing the same data, one plot with a linear y-axis and the other with a logarithmic y-axis. The x-axis is the date that each DAL file processed was archived and pulled from the Dept of Elections (ELECT) servers. Solid traces are directly extracted data from the DAL files. Dashed traces are computed metrics such as the number of “vanished” voters detected (described below). Red datapoints are placed on traces that exhibit questionable behavior, for example if the number of “approved” and “countable” ballots ever decreases, etc. Vertical dotted lines indicate important dates.

There are two very important fields in the DAL file that we want to pay attention to here: the APP_STATUS field, and the BALLOT_STATUS field.

DAL records with APP_STATUS = “Approved” and BALLOT_STATUS = “Issued” indicate a ballot that has been mailed to a voter.

DAL records with APP_STATUS = “Approved” and BALLOT_STATUS = “Marked” indicate a mail-in ballot that has been mailed to a voter, and then subsequently returned.

DAL records with APP_STATUS = “Approved” and BALLOT_STATUS = “Pre-Processed” indicate a mail-in ballot that has been mailed to a voter, returned and the ballot envelope has been opened and the ballot processed.

DAL records with APP_STATUS = “Approved” and BALLOT_STATUS = “On Machine” indicate a ballot record from a voter who physically walked into an early voting site and cast their vote on a tabulator machine.

DAL records with APP_STATUS = “Approved” and BALLOT_STATUS = “FWAB” indicate a Federal Worker Absentee Ballot (FWAB) mail-in ballot that has been received.

The combination of all ballots that have APP_STATUS=Approved and BALLOT_STATUS = “Marked” | “Pre-Processed” | “On Machine” | “FWAB” we term as “Countable” ballots.

I’ve computed the number of countable records that have an invalid BALLOT_RECIEPT_DATE or an invalid APP_RECIEPT_DATE. (For example if the BALLOT_RECIEPT_DATE is before the start of early voting, etc.)

I am also attempting to detect the number of duplicate voter IDs in a “countable” (as described above) state, if any, for each DAL file.

Additionally, I’ve computed and plotted the number of “Vanished” voters seen as we process the DAL files in chronological order. As each publication of the the DAL file is intended to capture information on all of the absentee ballots to date during an election, we would expect that once a unique voter ID becomes a record in the DAL file, that all subsequent DAL files should have an entry for that ID, regardless of its status. However, we know there are multiple instances where a voter ID will show up in the DAL record on a given date, and then be completely missing from a future DAL file.

Upon asking the department of elections for clarification as to how this can occur, their answer given was that if the voter has their registration cancelled for any reason, they are also removed from the DAL file. This holds true, even if live ballots had been issued for that voter, or if the voters vote has already been fed into a tabulator. This means that there is NO ACCOUNTING for these ballots in the DAL record. Note that the department of elections also does the same thing with the Voter History List (VHL) and the List of Those Who Voted (LTWV) data files. This is apparently standard operating procedure for the VERIS database(s) at ELECT, and (I quote) “… nothing unusual …” or to be concerned about as far as the department of elections is concerned. I vehemently disagree, and think that removing these records from the DAL while the election is ongoing is extremely problematic, to put it politely.

I will continue to update these plots as the election progresses. as more data comes in I will also be publishing these types of graphs for selected localities and precincts.

All of the latest plots for every locality and precinct as well as the corresponding underlying CSV data files will be updated daily, and you can download them here.

The semilog versions of the plots for all localities or precincts that appear in the DAL data that have flagged issues of concern are shown in the gallery below. The image carousel below might take a moment to load, btw.

Categories
Uncategorized

Difference in number of duplicated records in the VA RVL from 2021-2022

Since I know there have been a number of registrars and volunteers around the state that have been working to try and improve the maintenance of the VA voters rolls, I thought people would be interested in some summary results that I can now compute. While there is still plenty of work to be done, we have at least made some progress.

Below you will find the graph of the number of detected duplicate records in the statewide VA Registered Voter Lists as pulled on 2021-11-06 and 2022-09-22. The duplicate detection is based on an exact match of the join of (First Name + Middle Name + Last Name + Suffix + DOB + Gender) fields.

The total number of duplicate records detected in the 2021-11-06 RVL was 1882, and the total number of duplicate records in the 2022-09-22 RVL was 1471. Thats a 21% reduction in the number of duplicated voter records!

Interestingly enough, many of the duplicates actually cross over between multiple localities, so it is possible that many of these duplicated records are people that legitimately moved, but for some reason were given a new voter ID in the new locality and the old locality never removed their record. (A persons voter ID is supposed to be unique to them and ‘follow’ them throughout moves, etc.)

Any registrars who are interested in reviewing the specific records identified, please feel free to contact us.