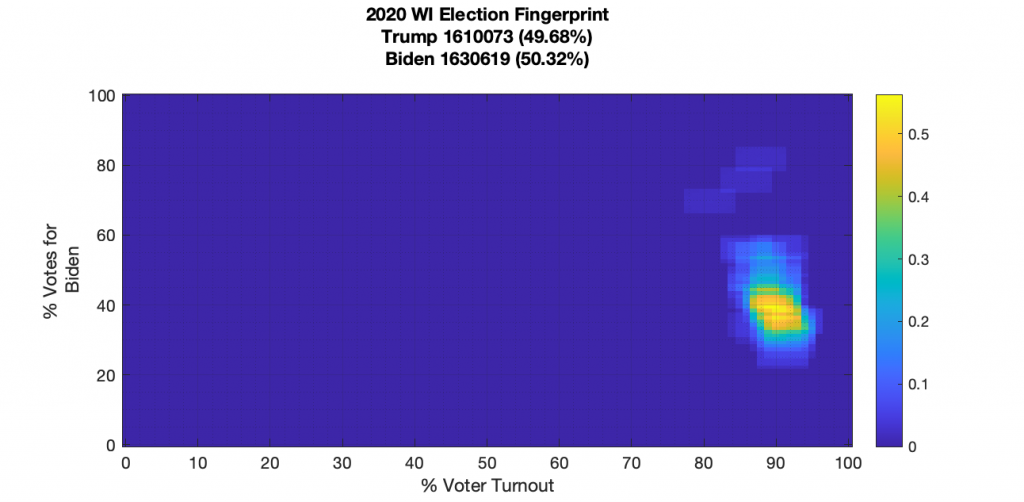
Shortly after posting some updated WI data analysis (here) I got pointed to an even better set of data to use for generating the fingerprints. This updated dataset uses the registration numbers as of Nov 3 and the per ward vote tallies provided on the https://elections.wi.gov/ site.
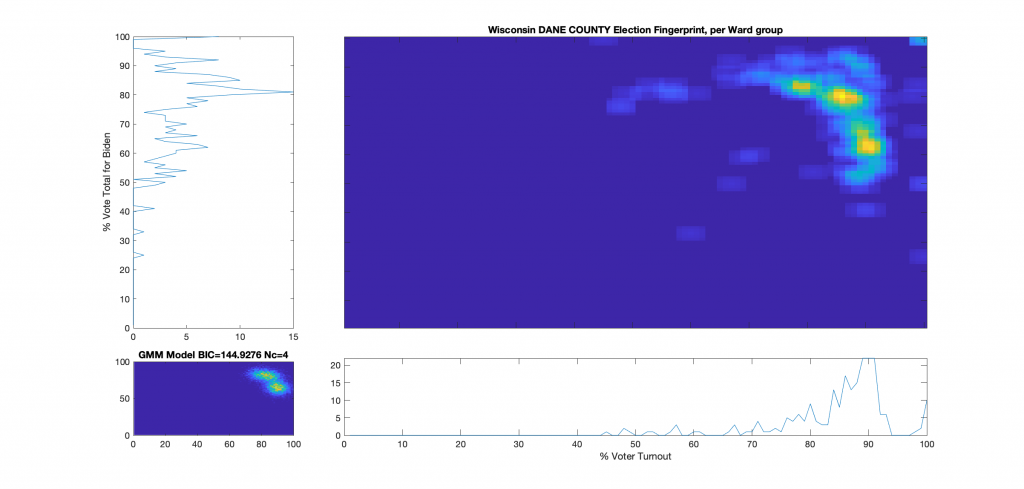
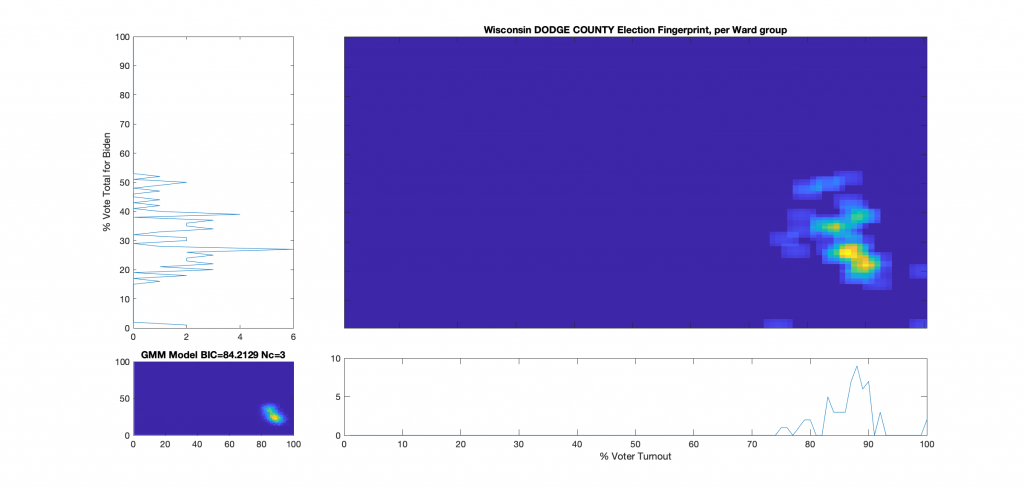
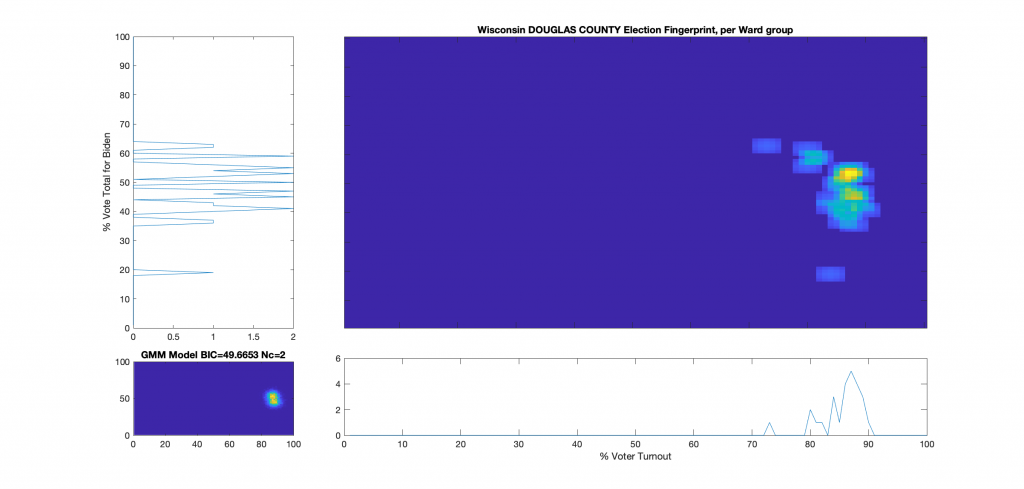
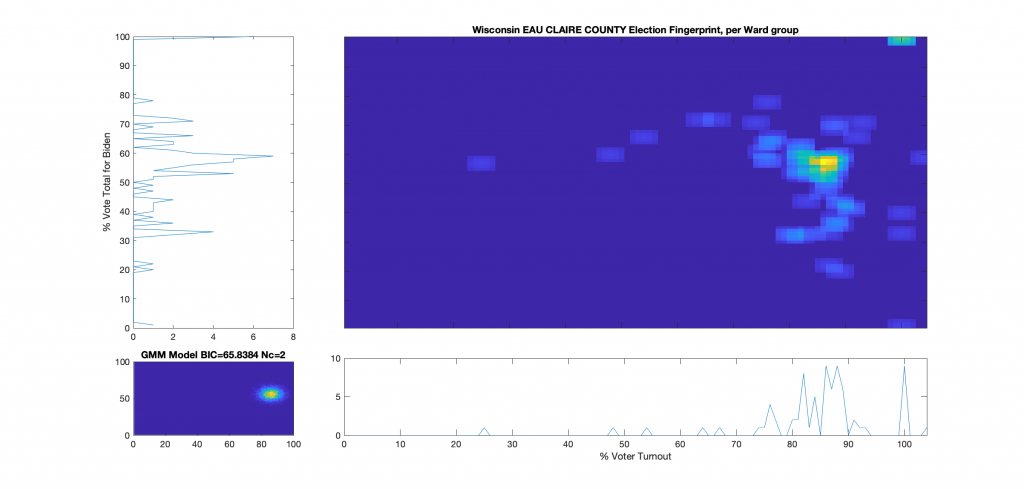
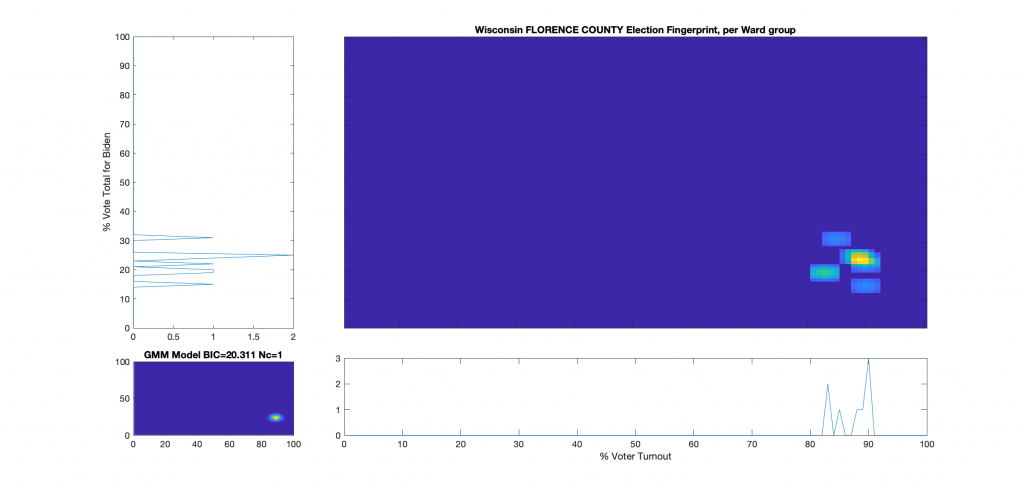
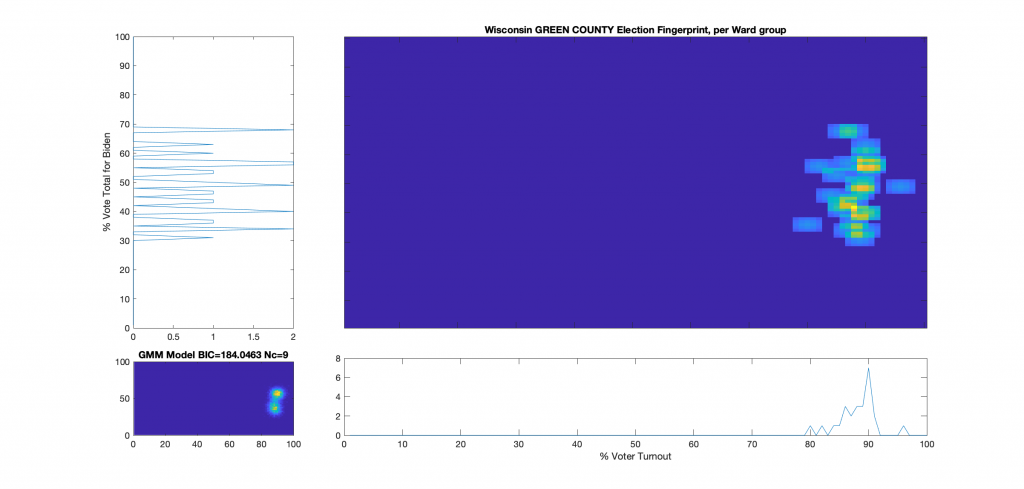
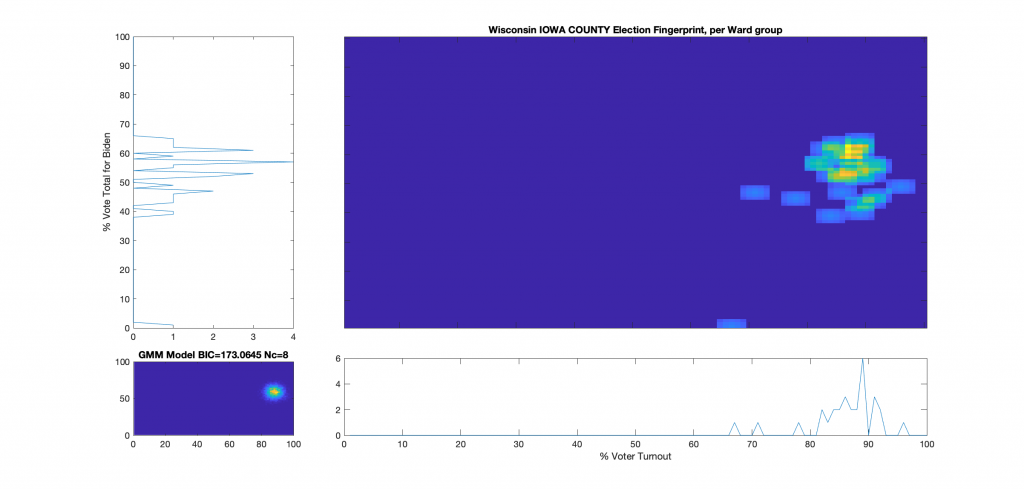
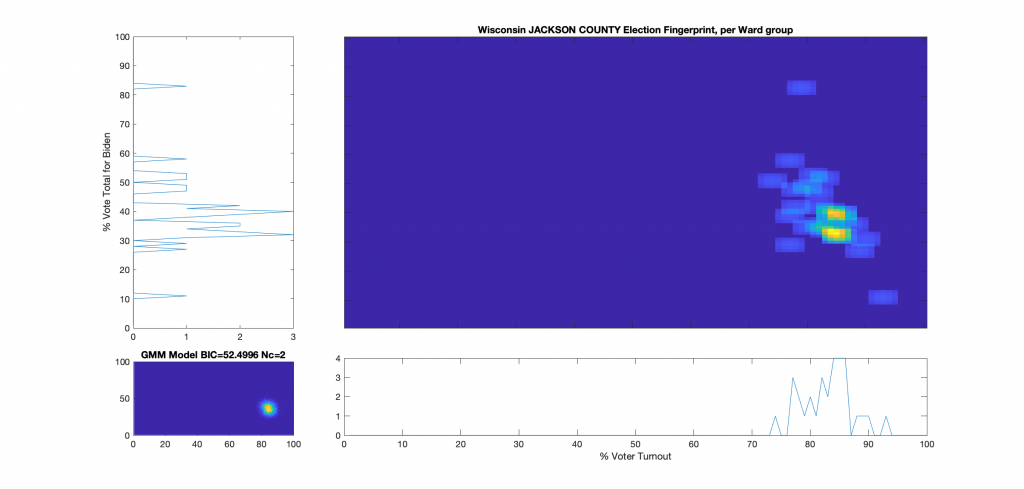
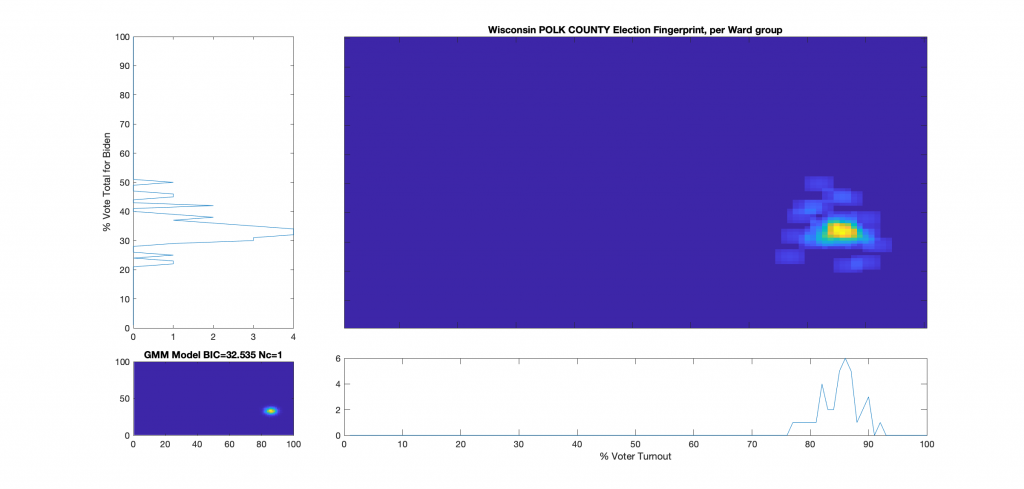
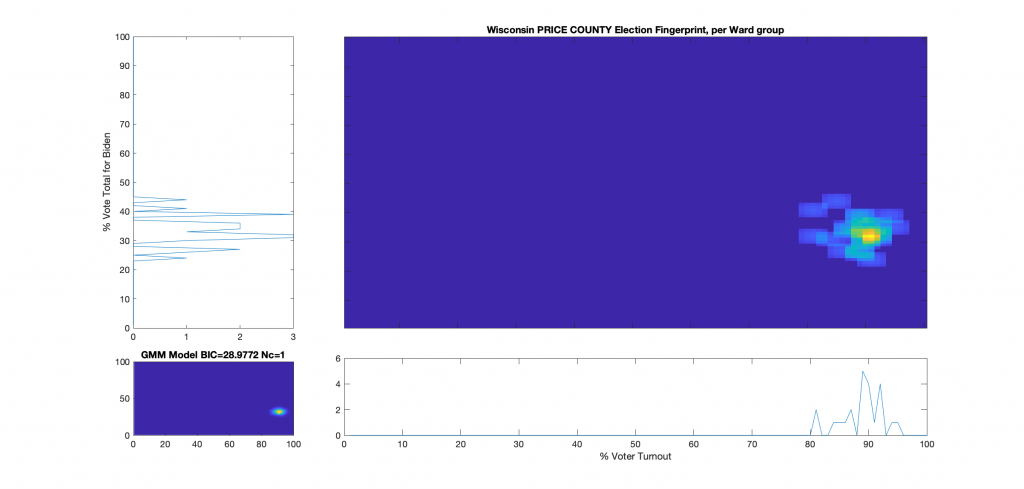
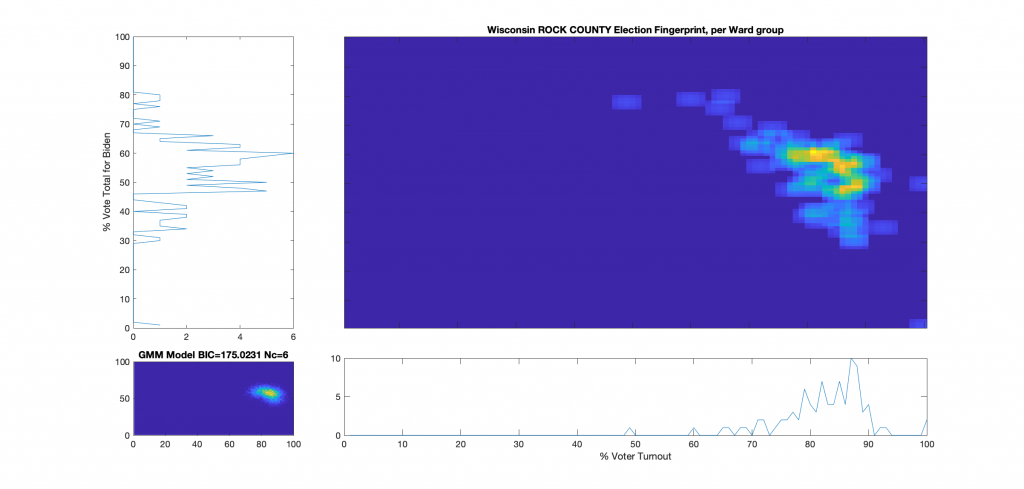
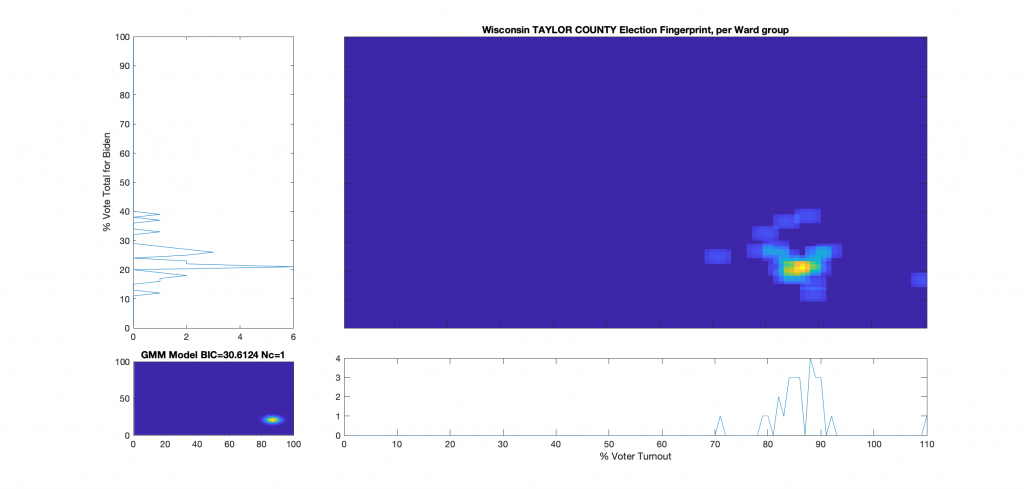
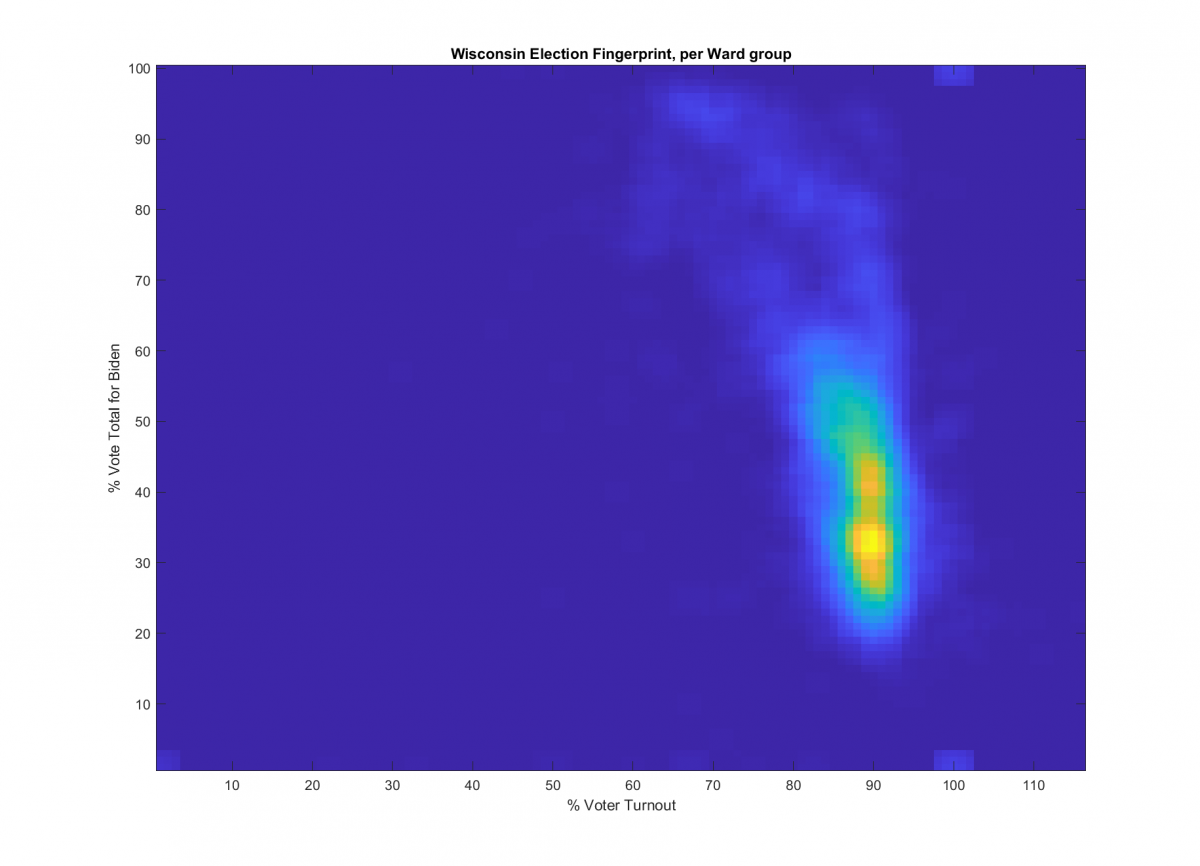
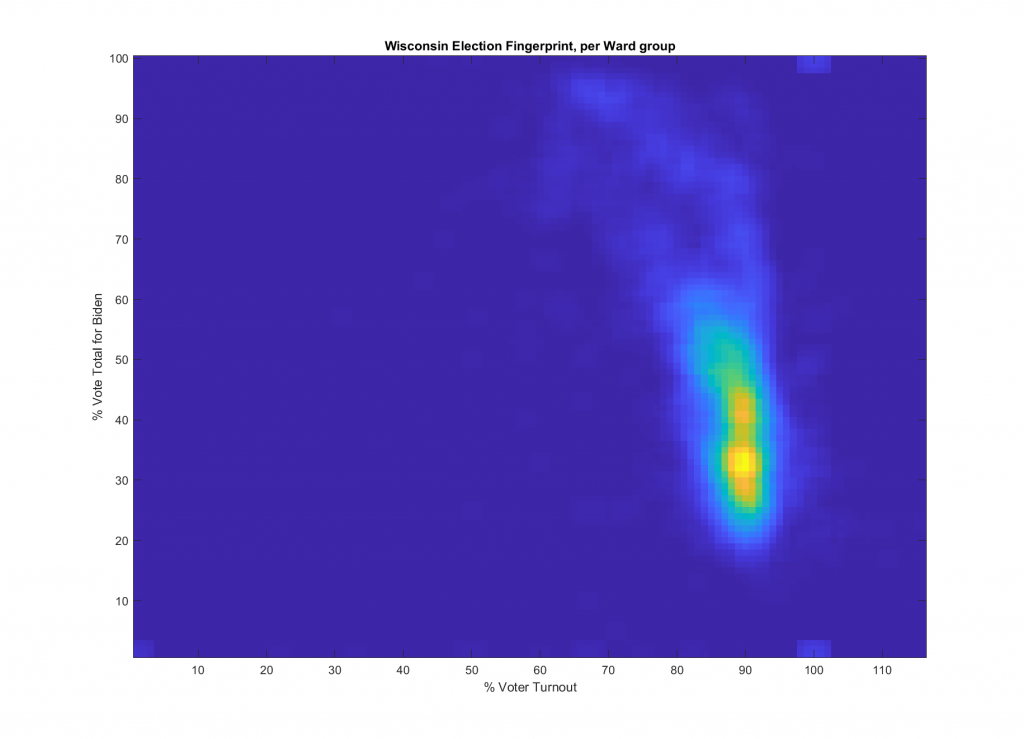
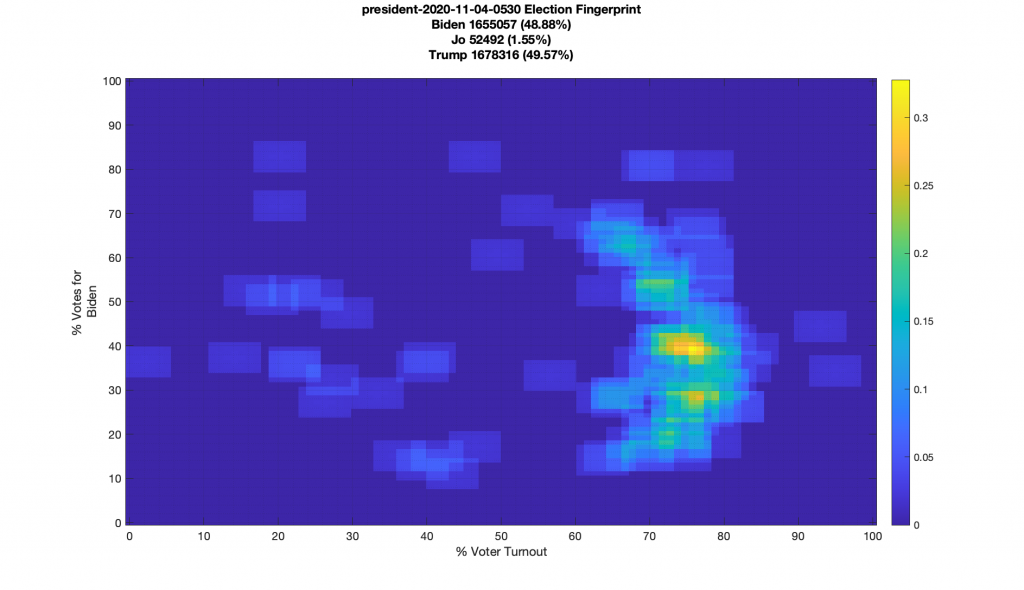
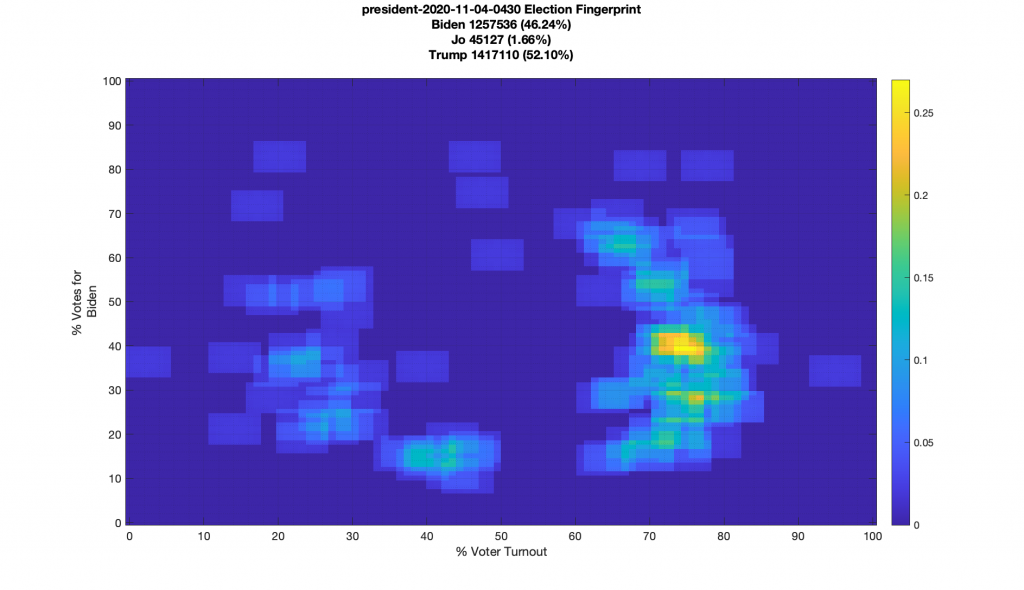
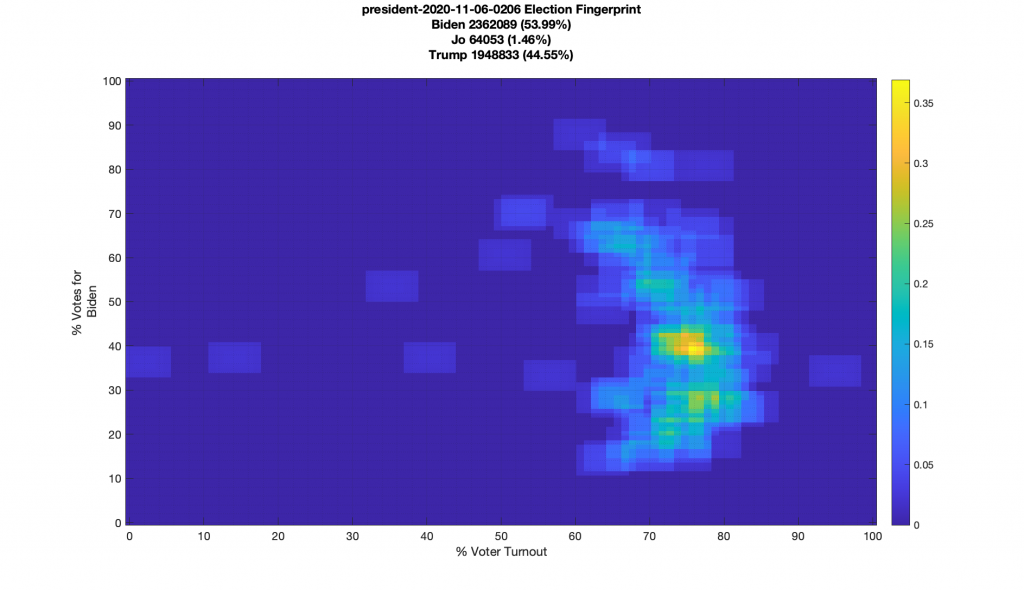
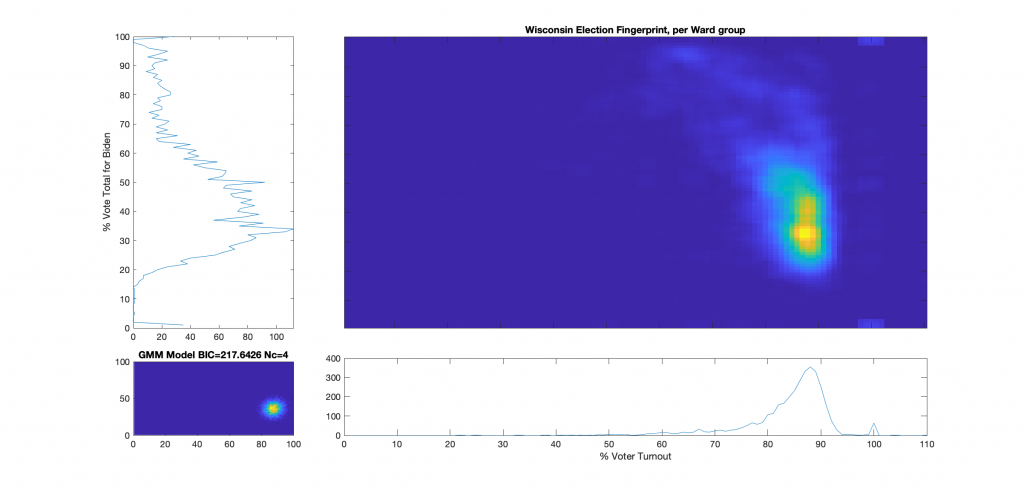
I also made some code modifications in order to compute an idealized model of what the Fingerprint “should” look like, similar to what was done in the original National Academy of Sciences paper. The ideal model is based on a 2D Gaussian Mixture Model fit to the locations of top histogram bins that are >= 70% of the max histogram value. The model uses a shared covariance matrix for all of the components based off of the sample covariance of the data. In the statewide plot below the Election Fingerprint is in the top right, with the ideal model in the bottom left. On the bottom right and top left are the sums of the Election Fingerprint image across the different dimensions.
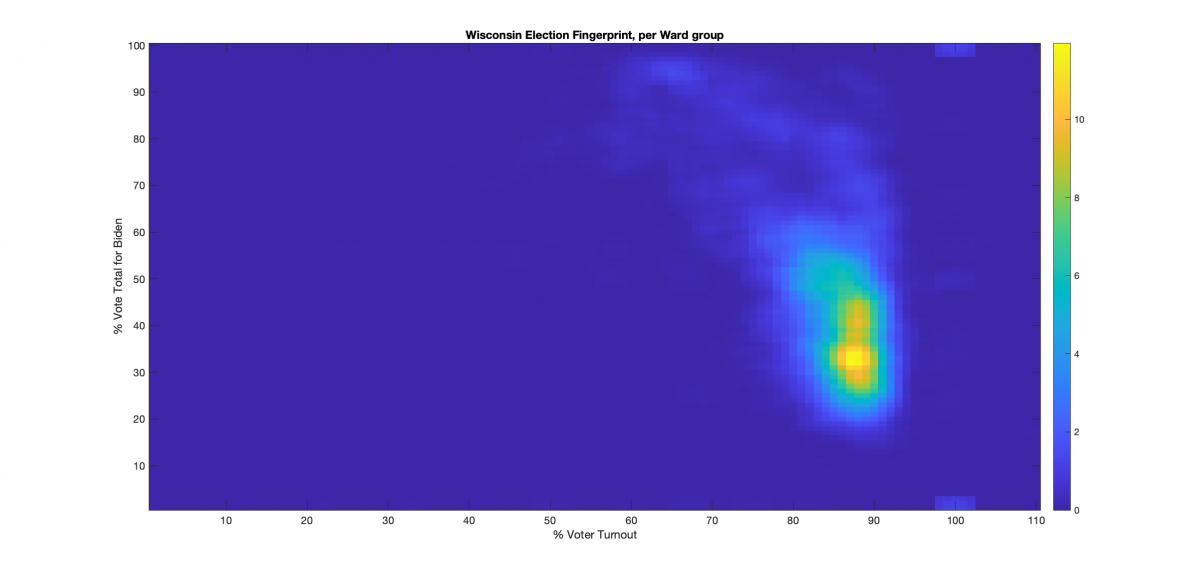
Statewide Election Fingerprint, per Ward group
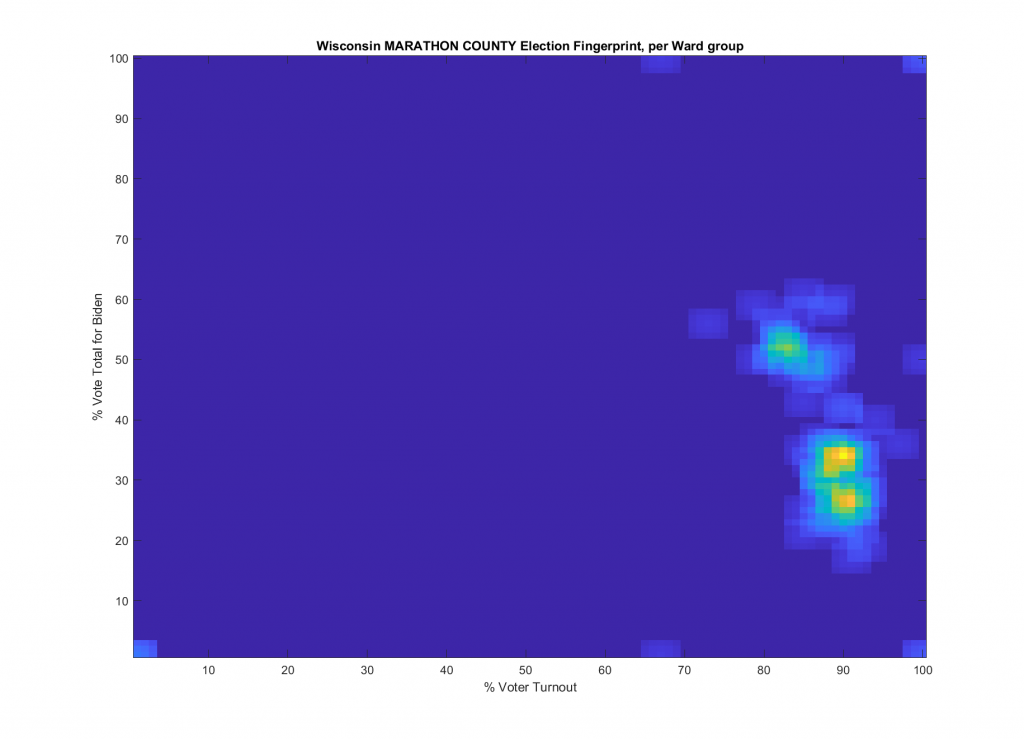
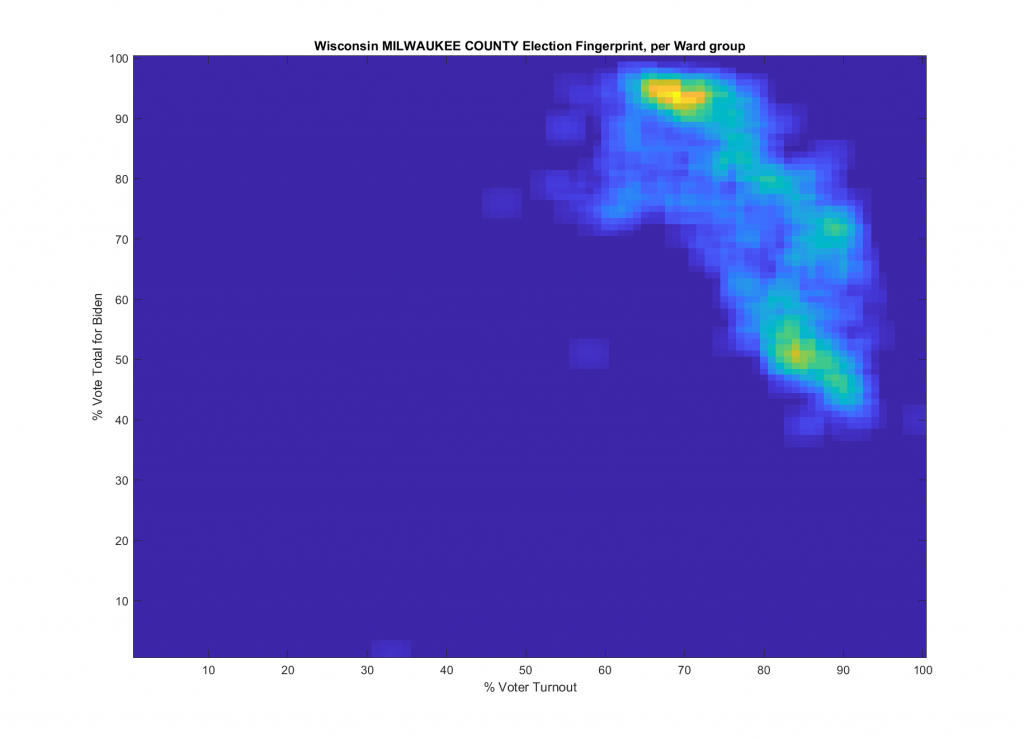
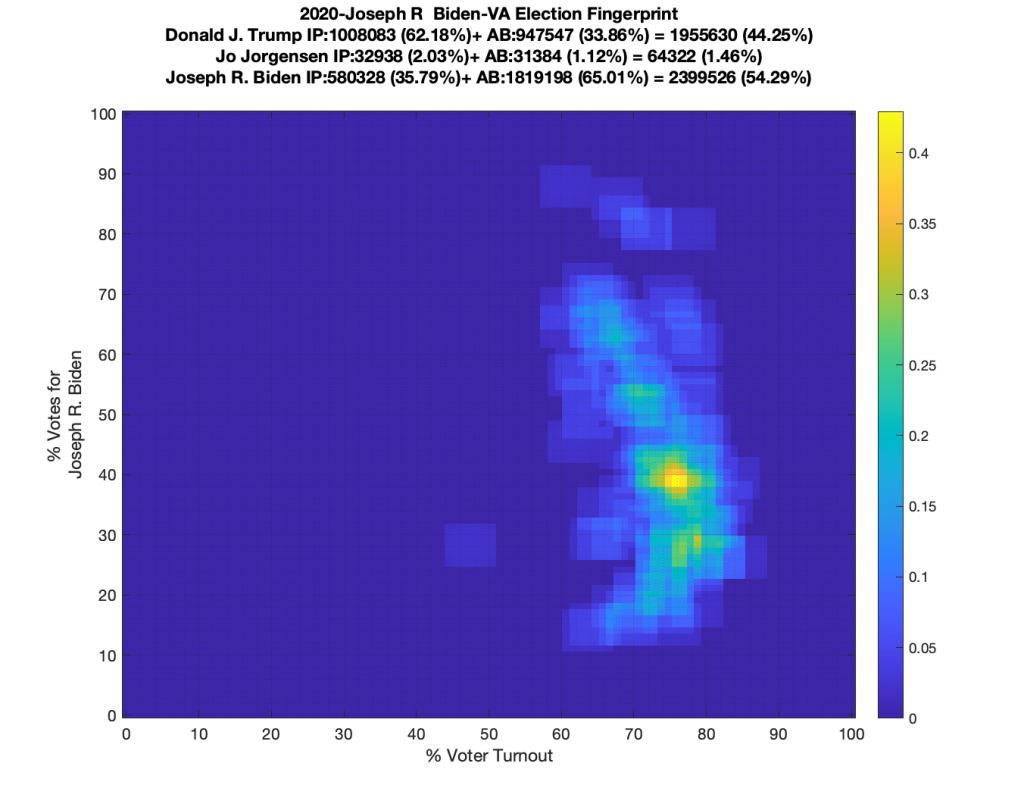
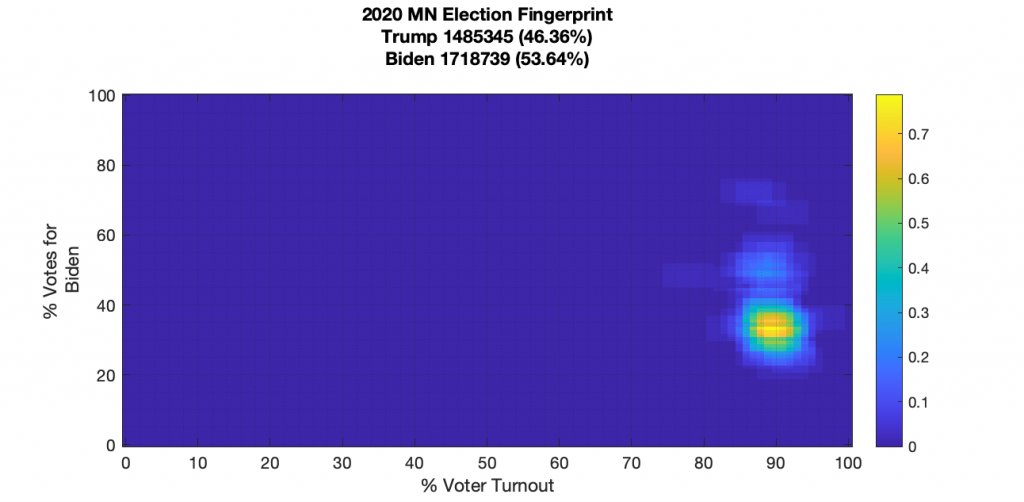
We see what looks like two (or even three) superimposed lobes around the 90% turnout and 40% per Biden bin, which is consistent with my earlier low-res version, and we have a lot more detail as to the upward kurtotic smear off the main distribution. There also are a few Ward Groupings that have exceptionally high % for Biden (rarely, if ever, does a candidate receive near 100% vote share), and there are Ward Groupings that are near/over the 100% turnout marker, with the addition that some of those are ALSO either 100% Biden or 0% Biden (all big red flags)!
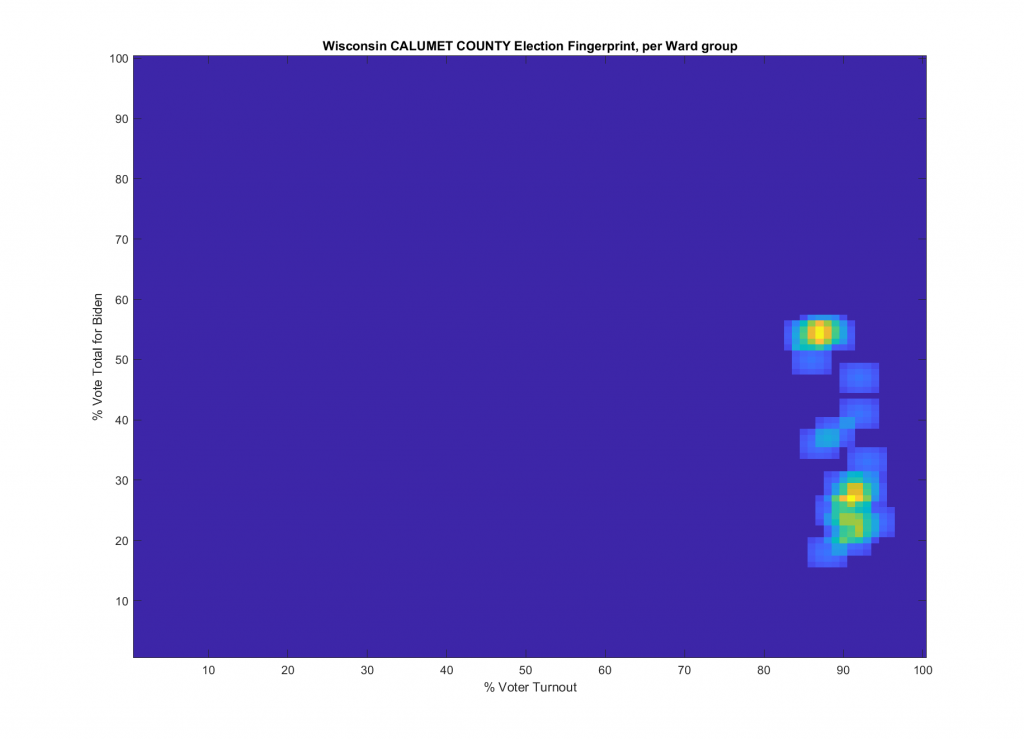
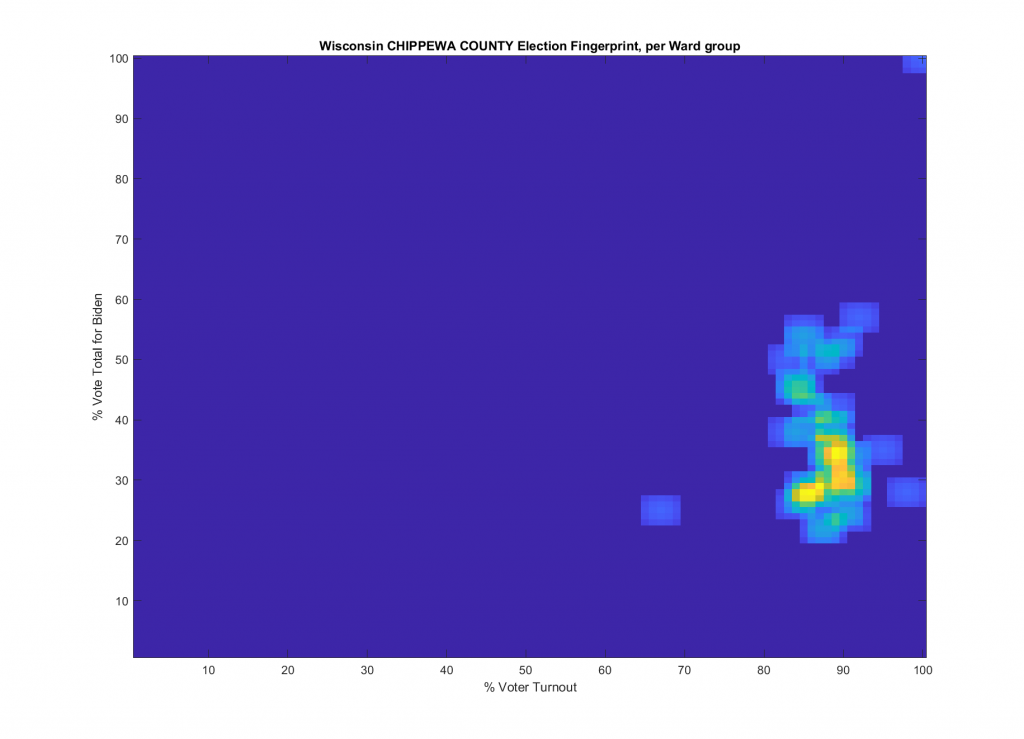
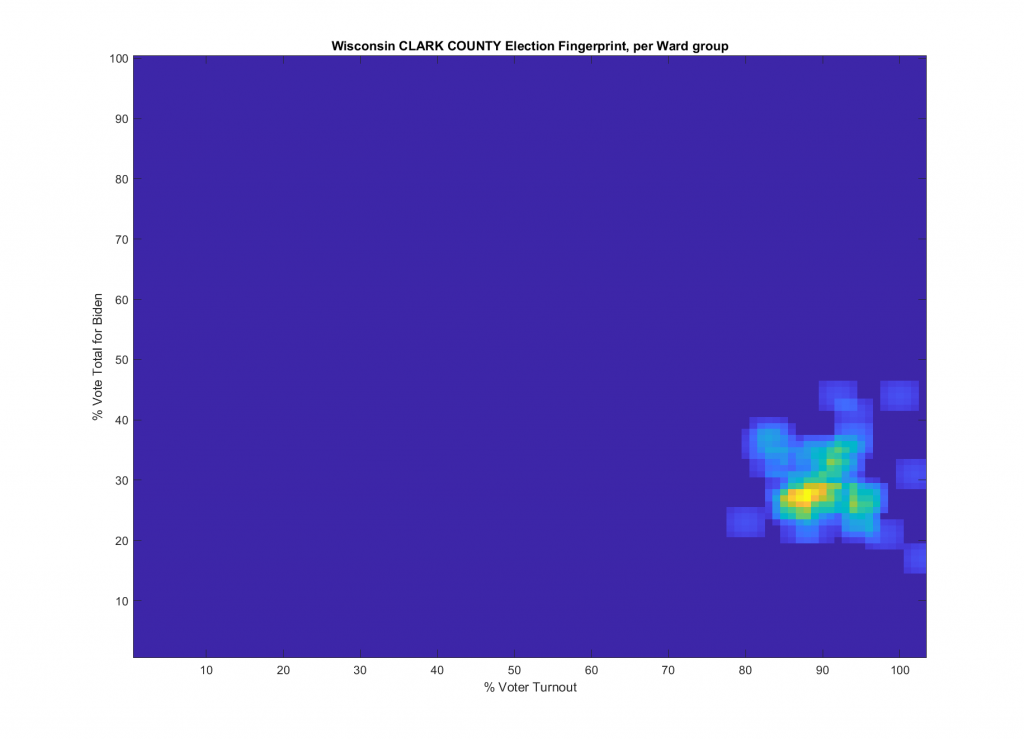
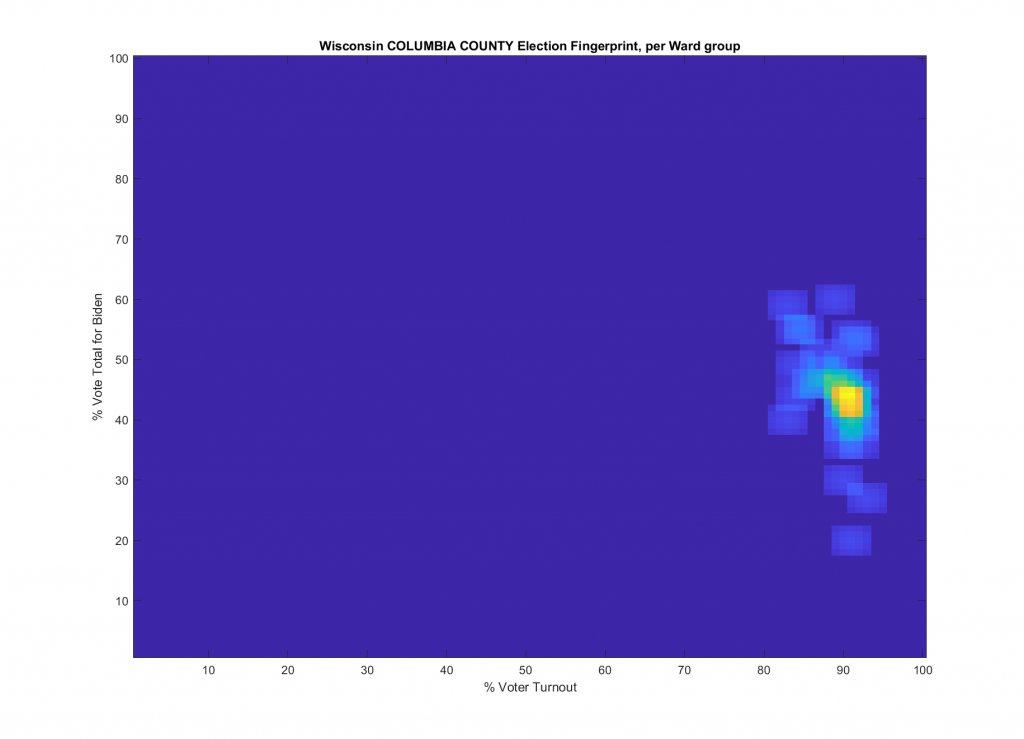
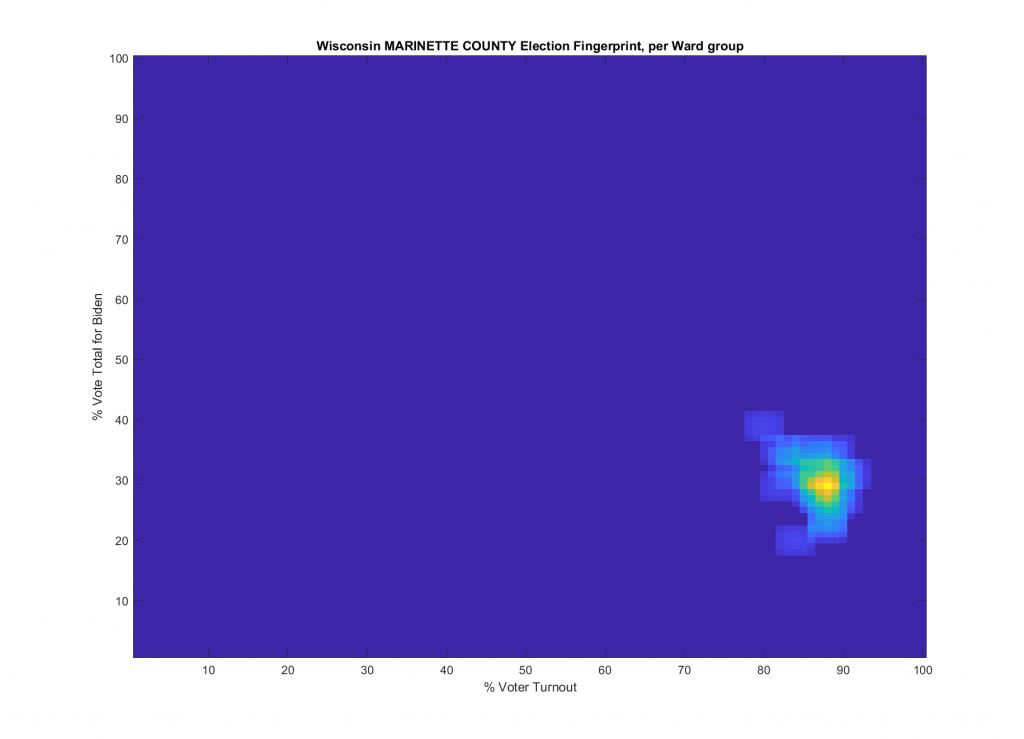
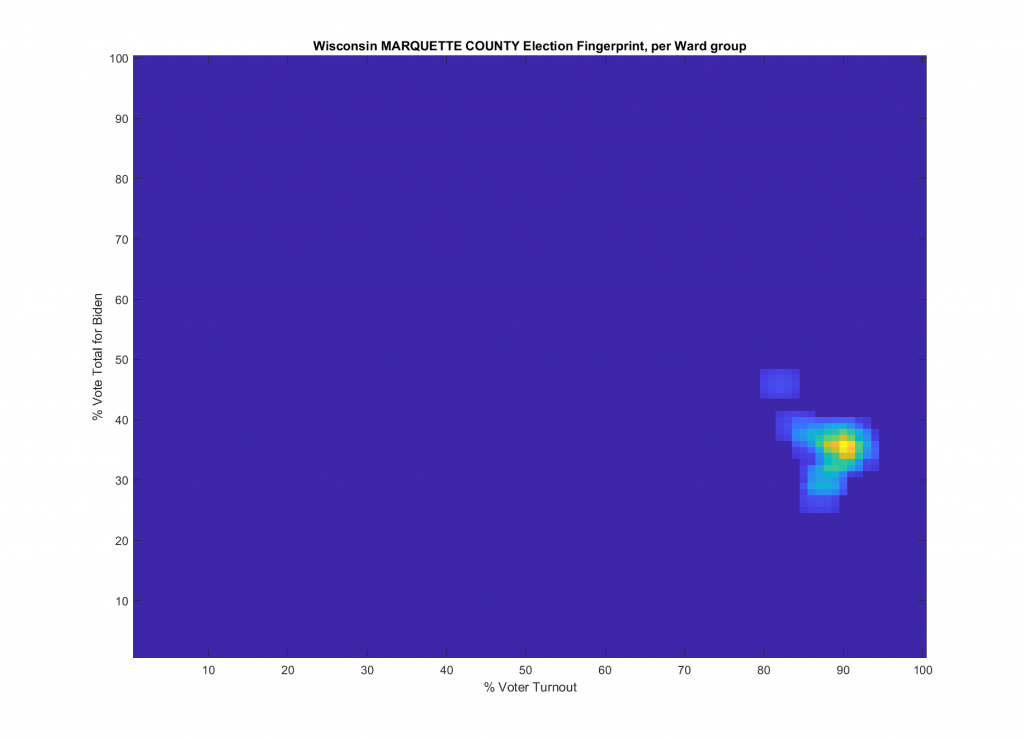
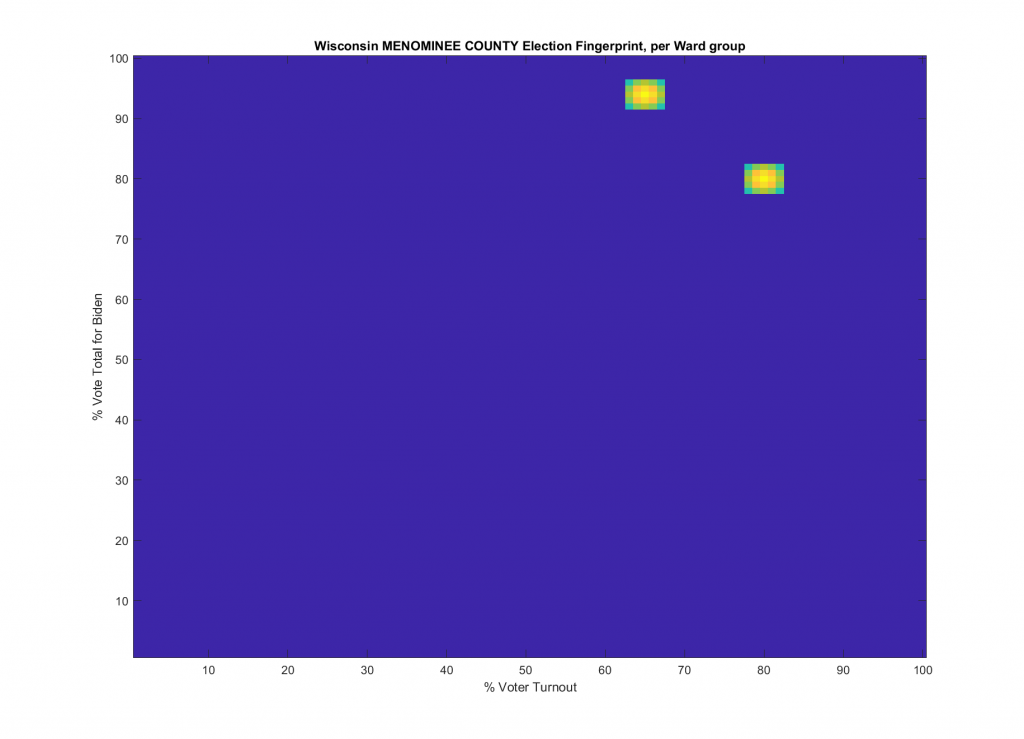
As discussed in the National Academy of Sciences paper that all of this work is based on, an idealized Election Fingerprint should look like a 2D Gaussian (or a multi-variate normal distribution). Or maybe, in an extremely divided populace, 2 overlapping Gaussian distributions. Deviations from this are, by definition, irregular and an indication that there might be an issue with the election. Distinct linear or non-linear features sloping away from the central lobes(s) could indicate voter manipulation or “ballot stuffing”; isolated regions at high turnout +/or very high vote percentage for one candidate could be an indication of extreme manipulation or vote substitution. Now, its true that no real Election Fingerprint will look perfectly Gaussian due to the realities of how elections operate, data errors, etc … but they should at least be close!
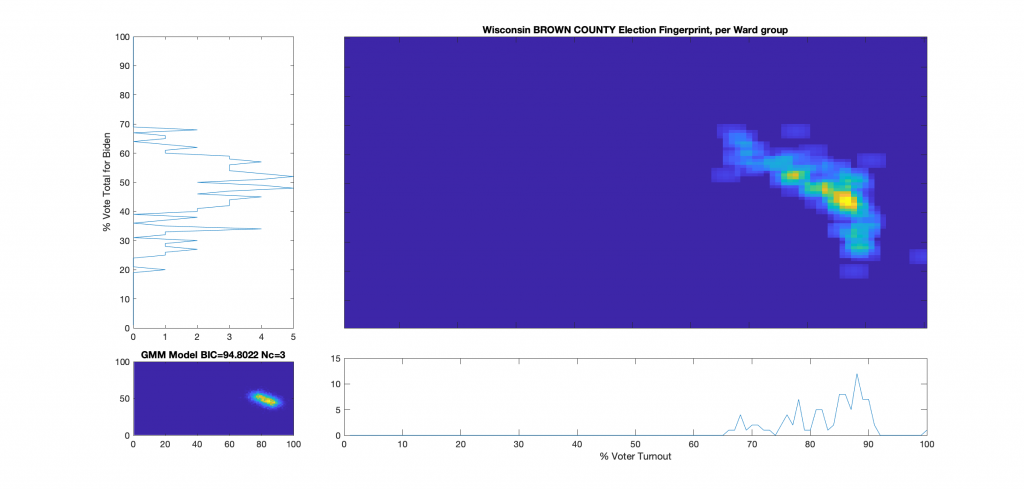
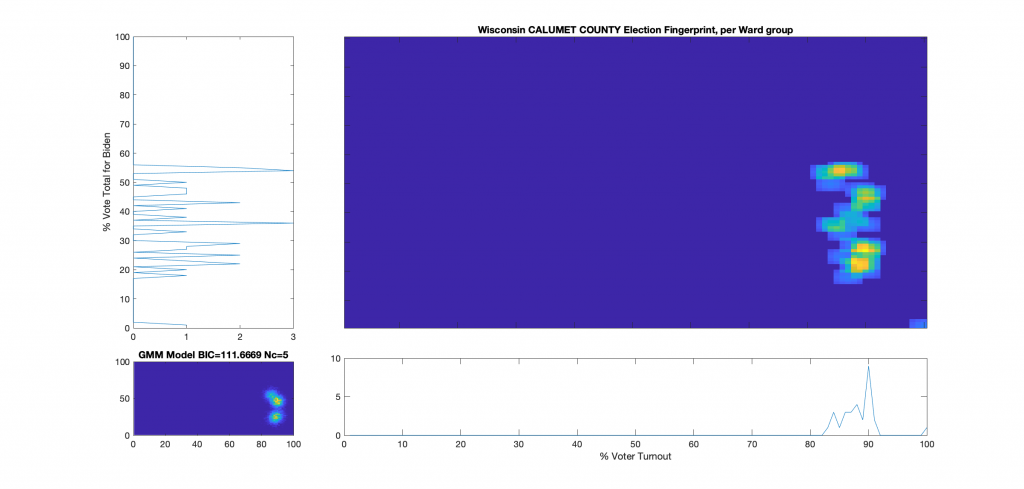
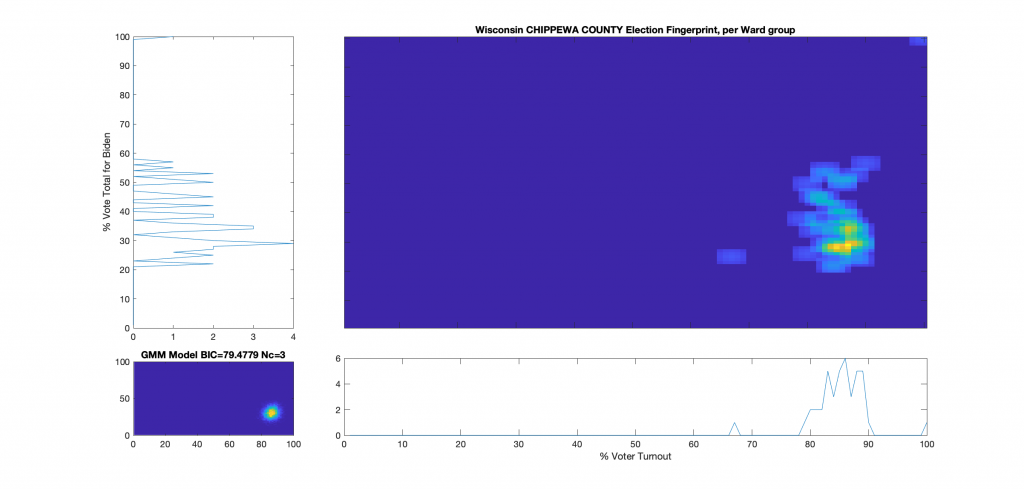
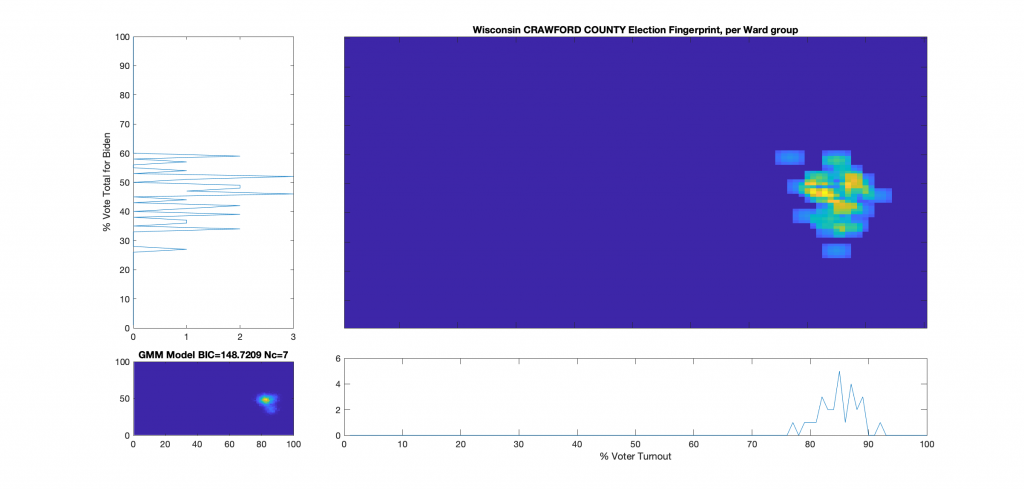
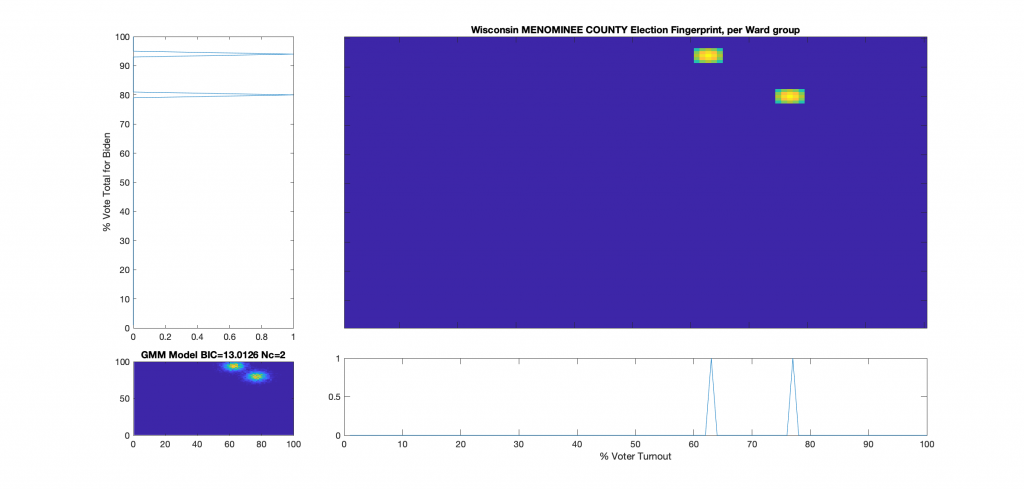
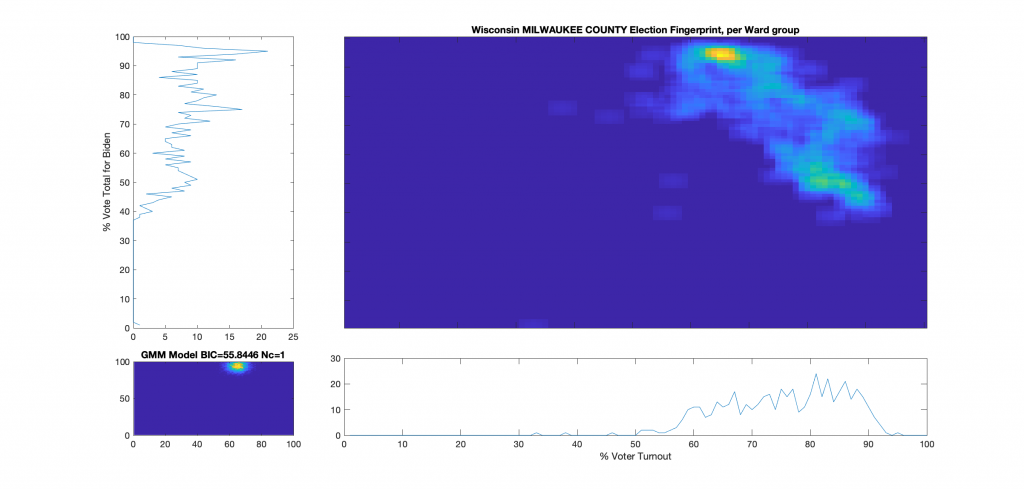
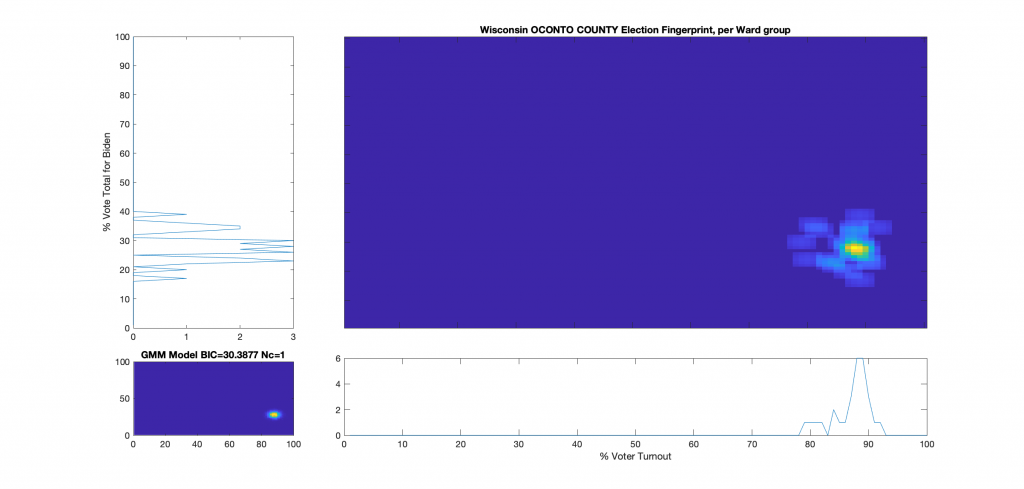
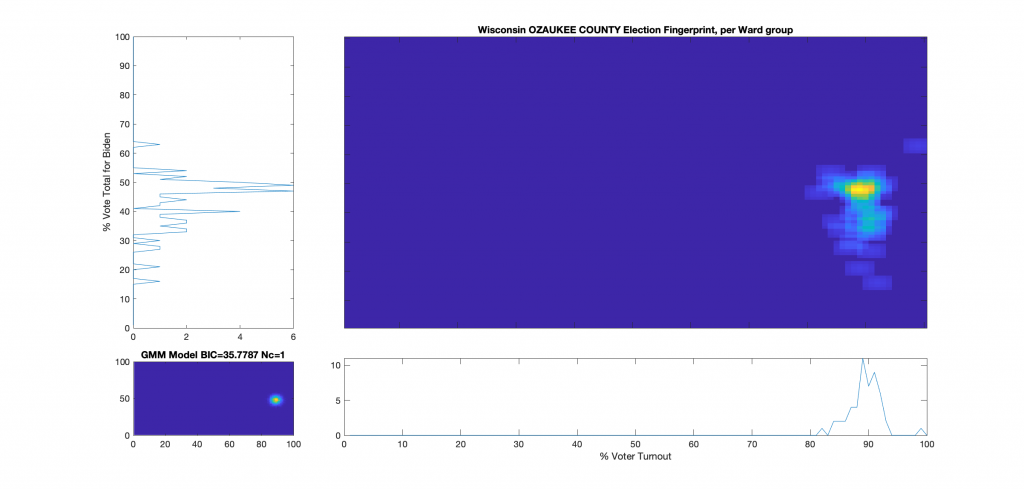
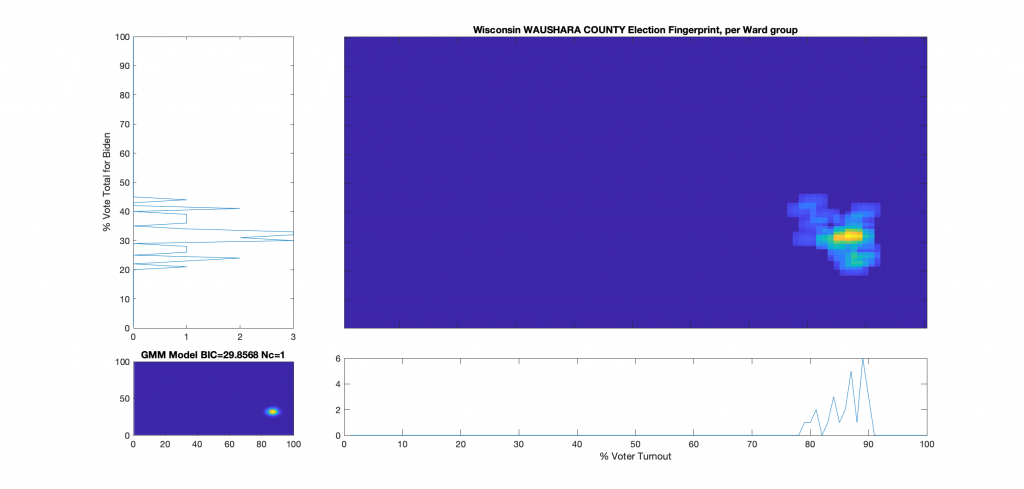
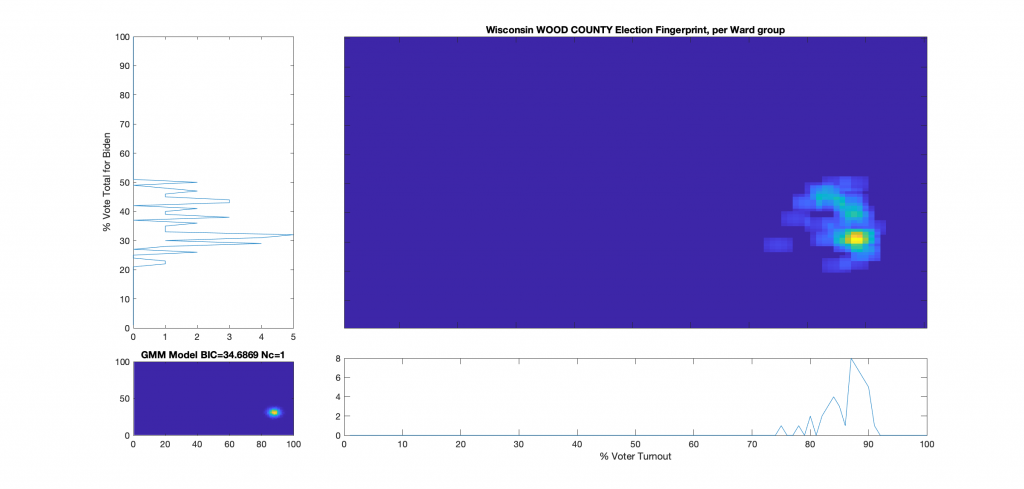
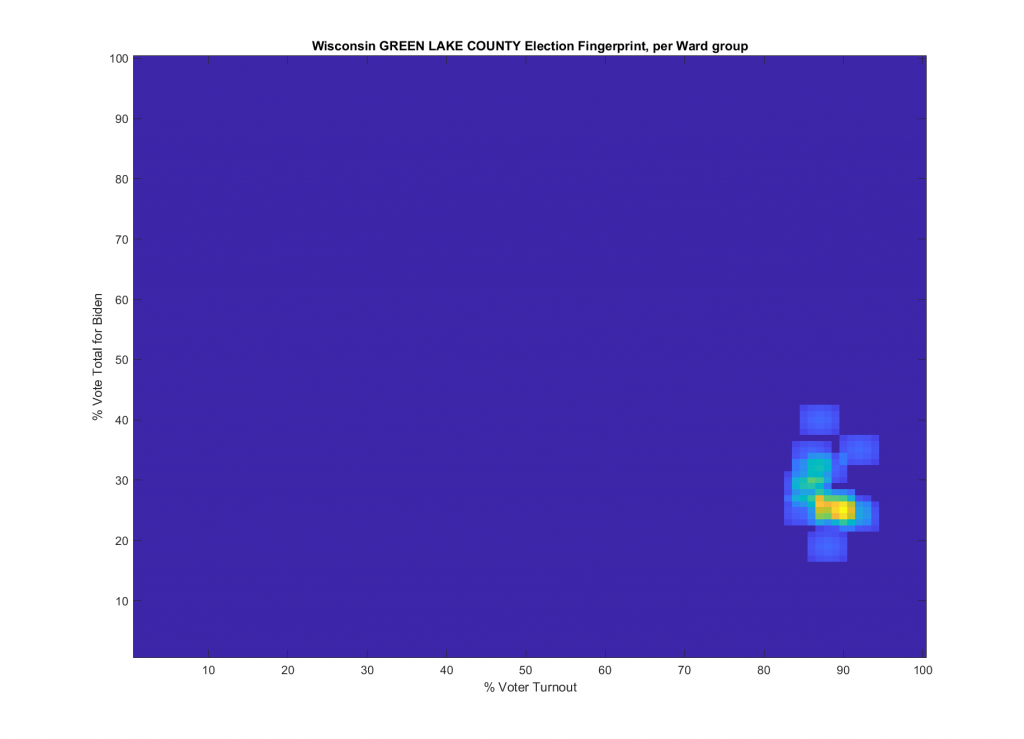
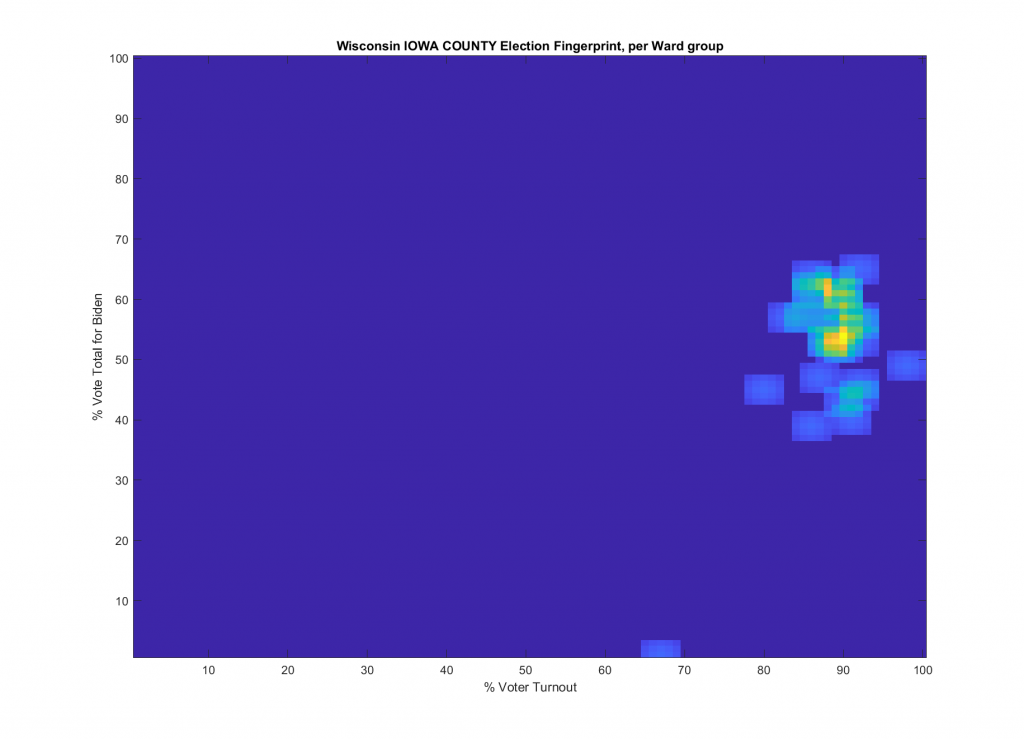
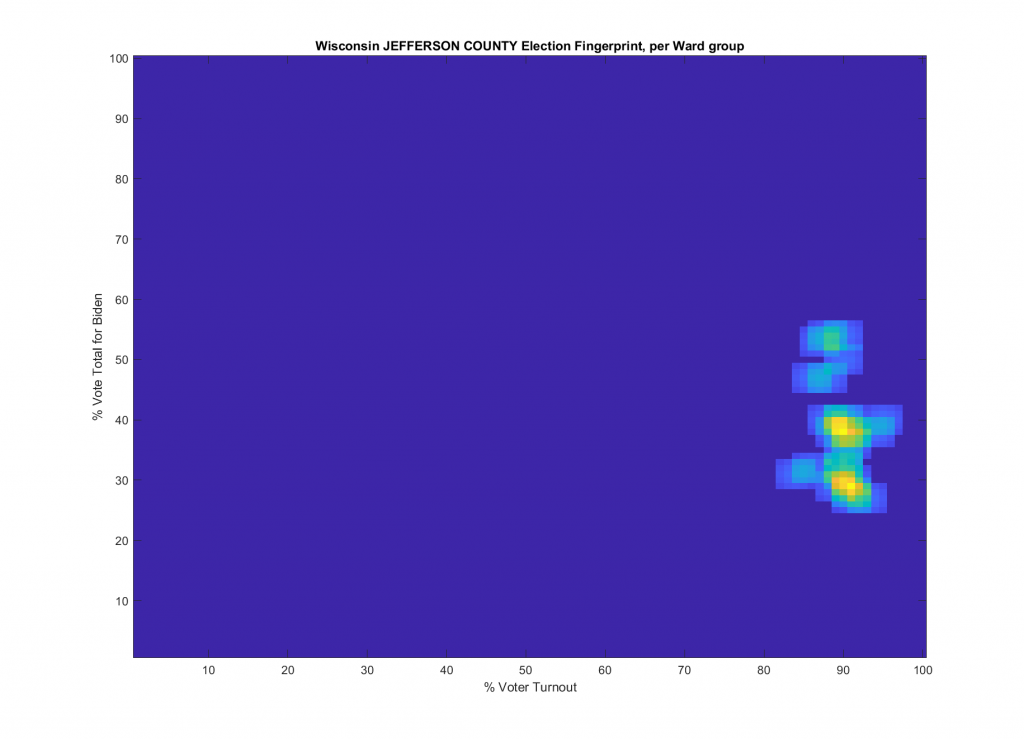
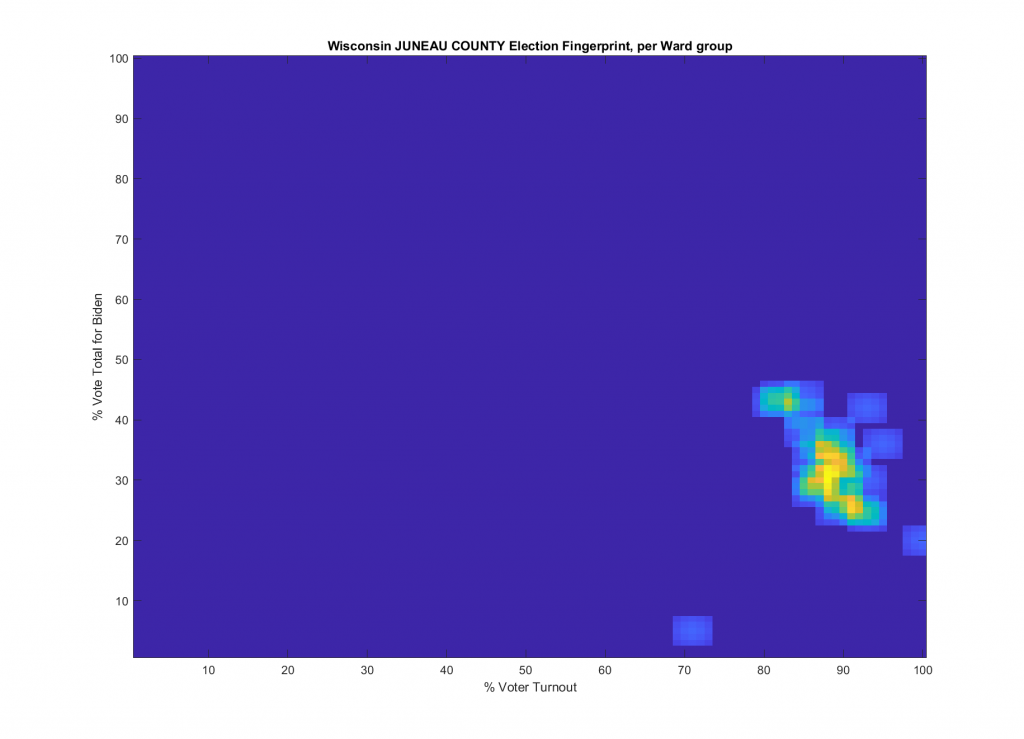
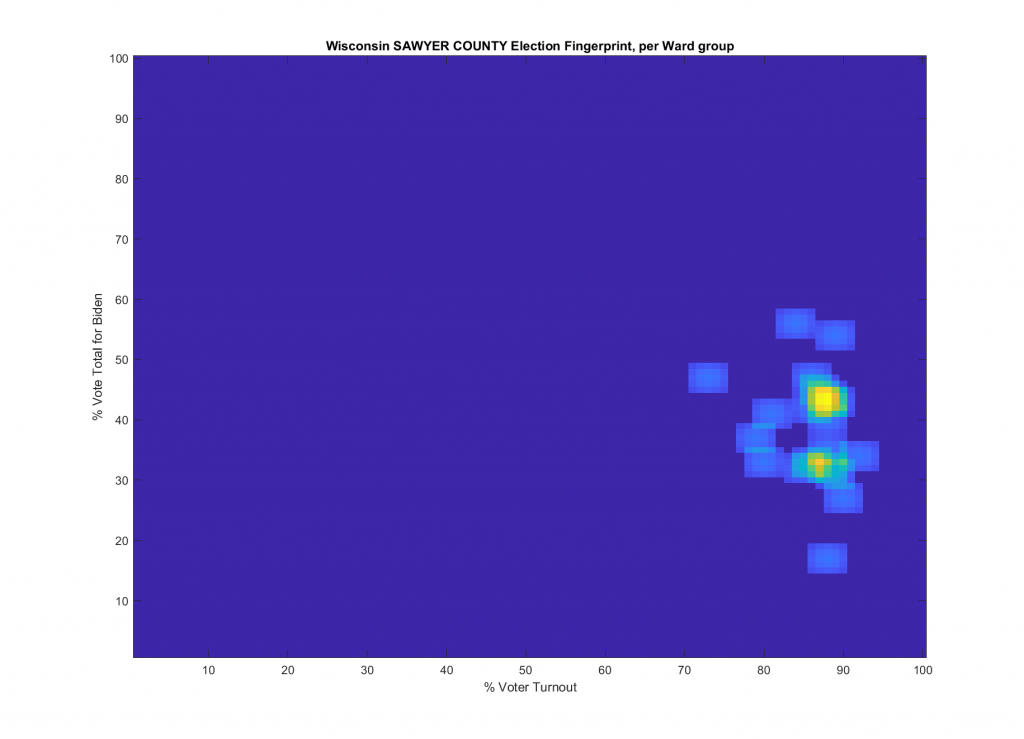
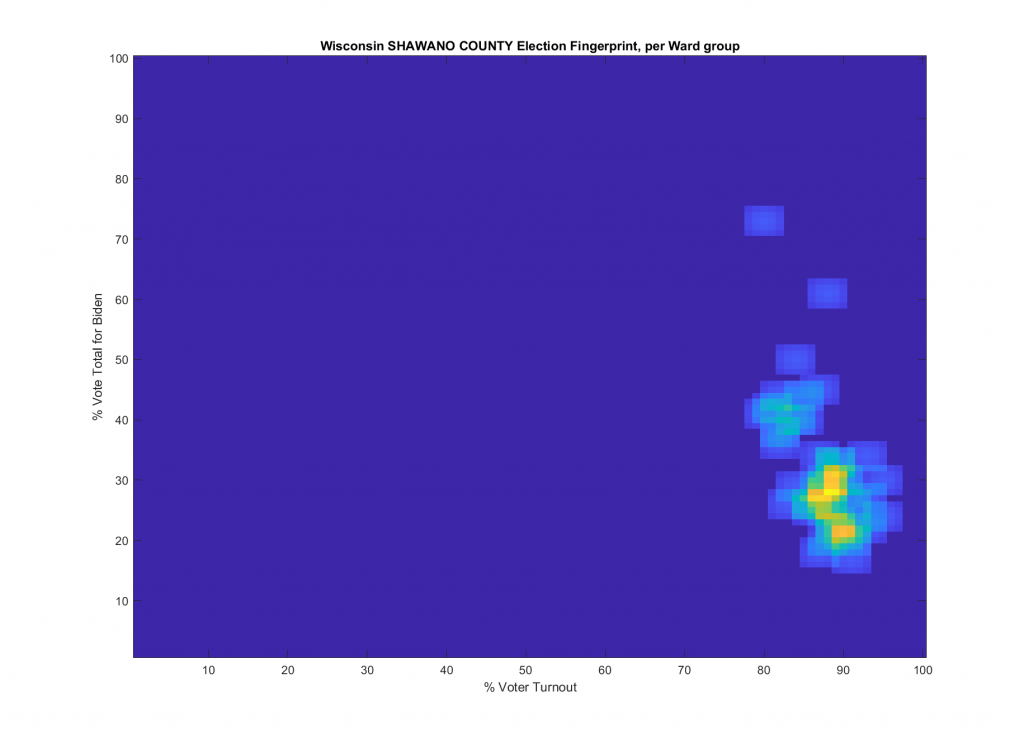
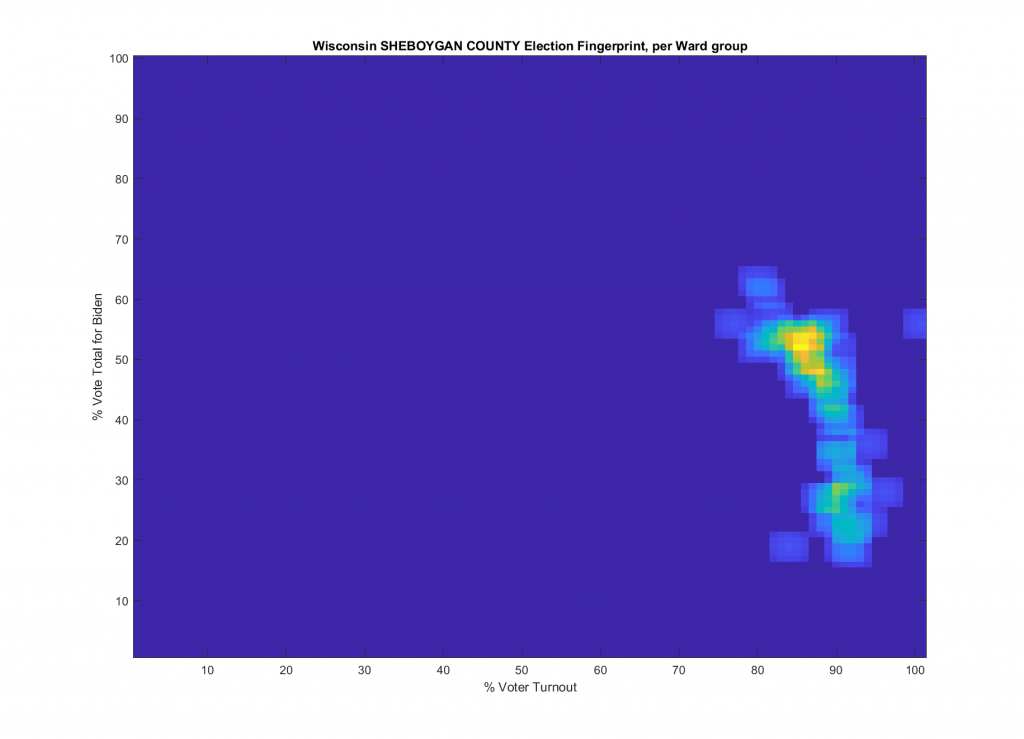
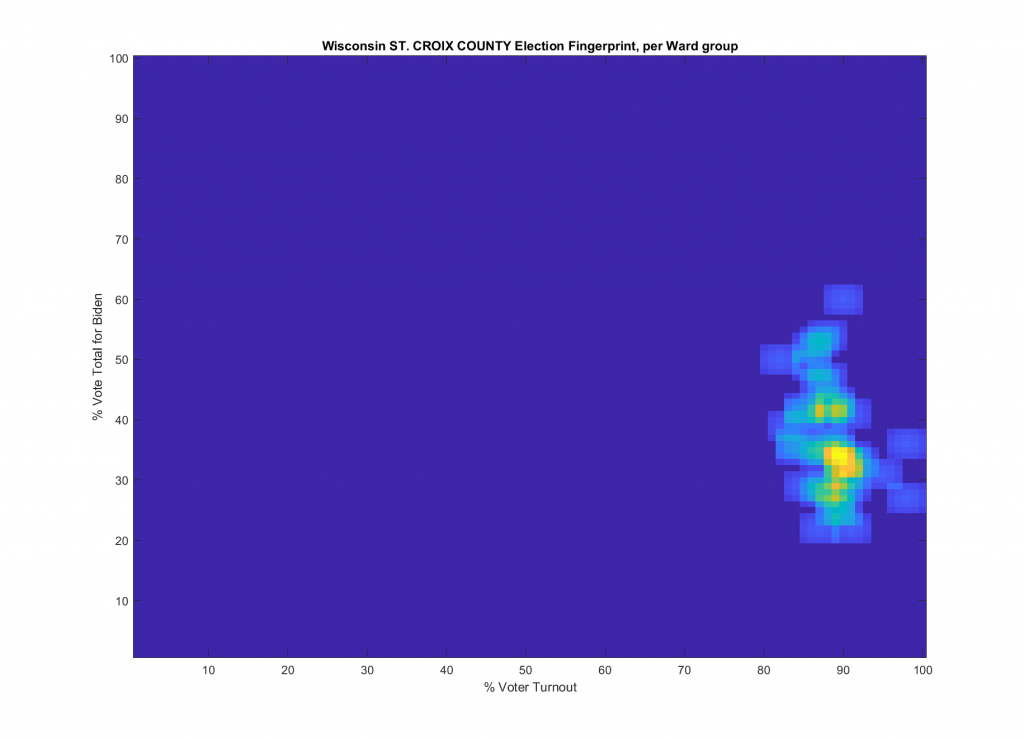
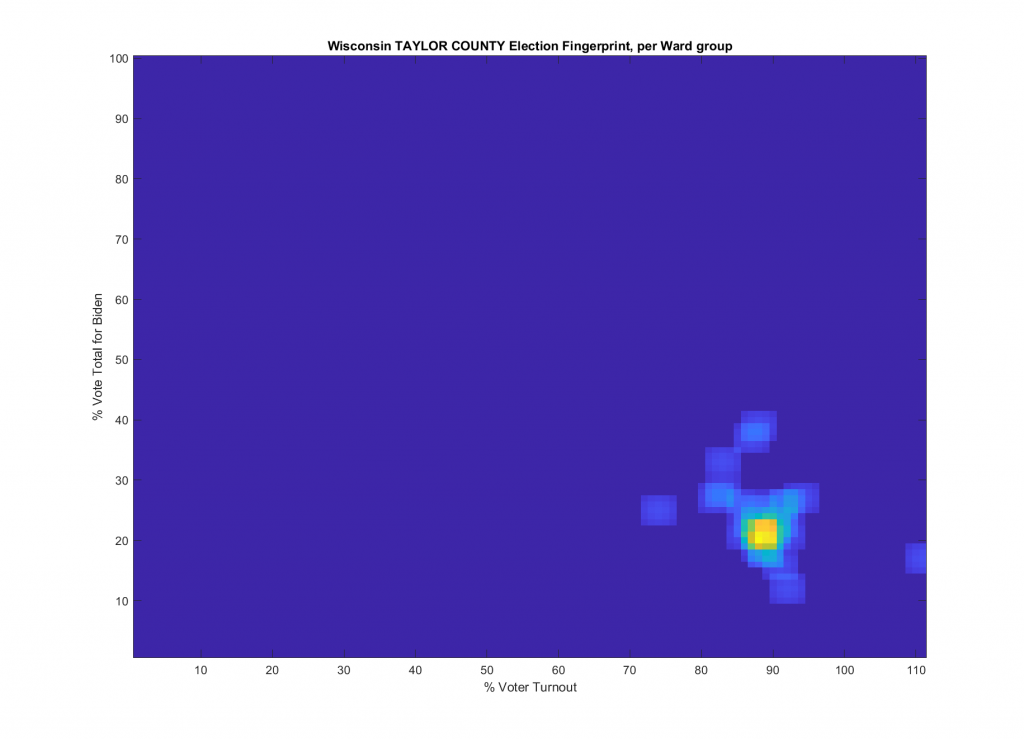
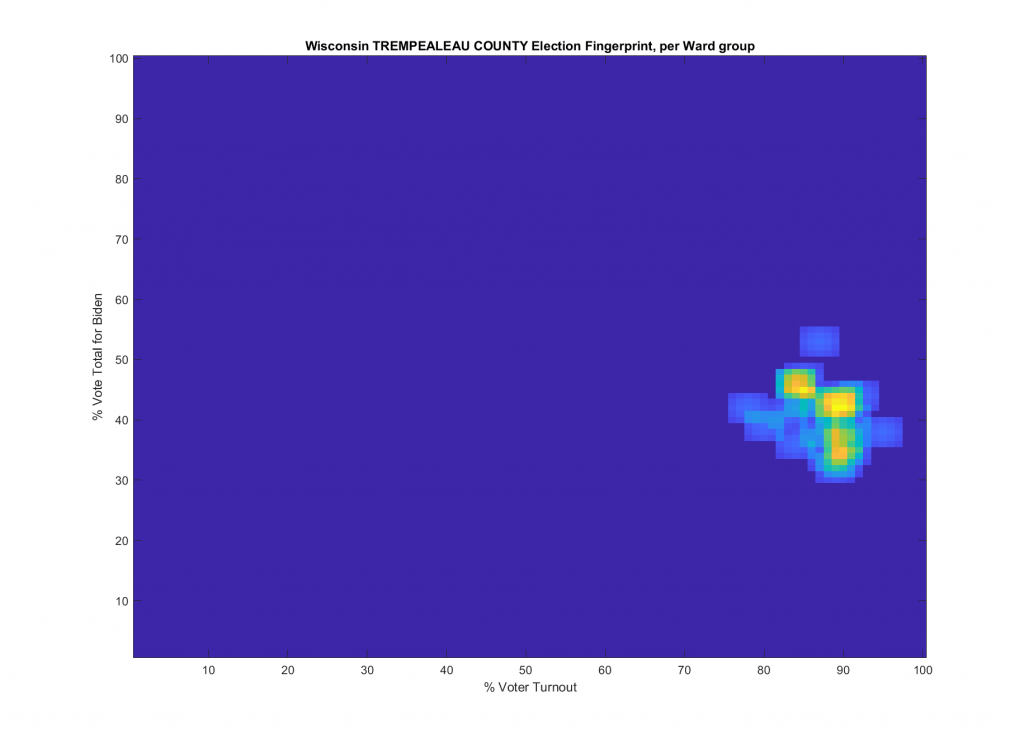
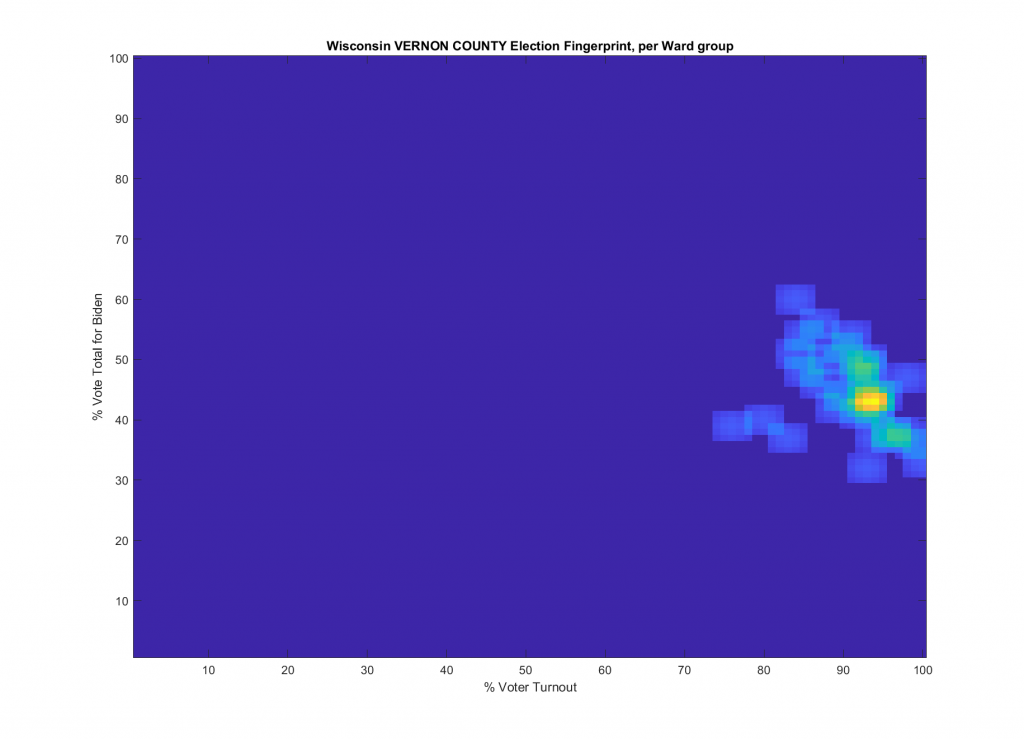
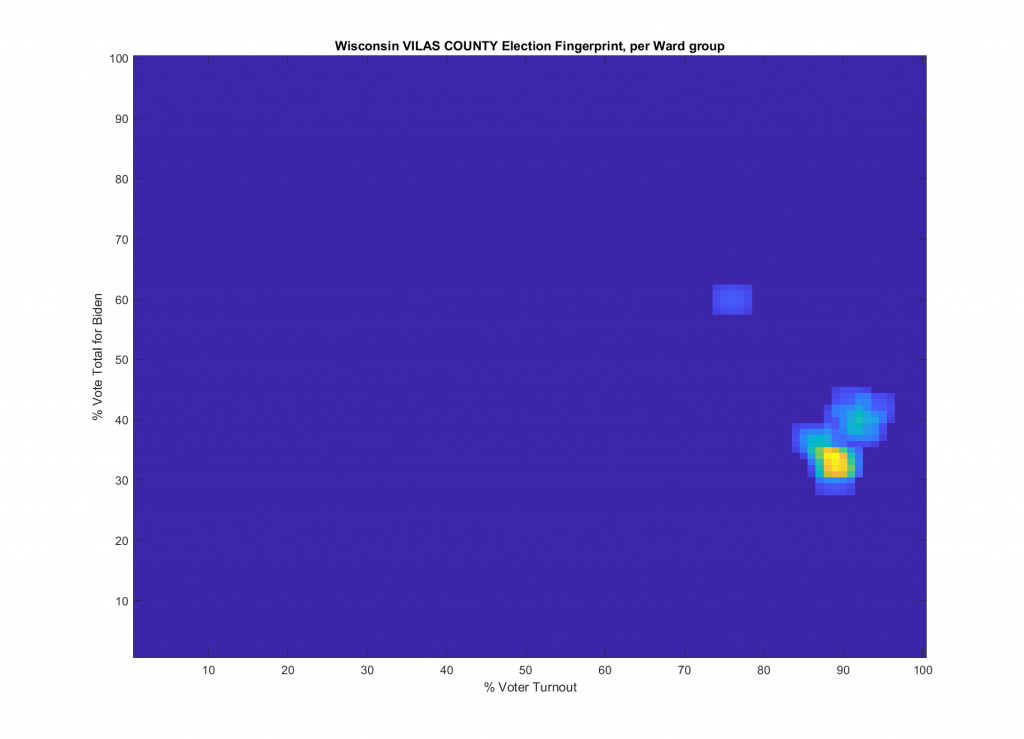
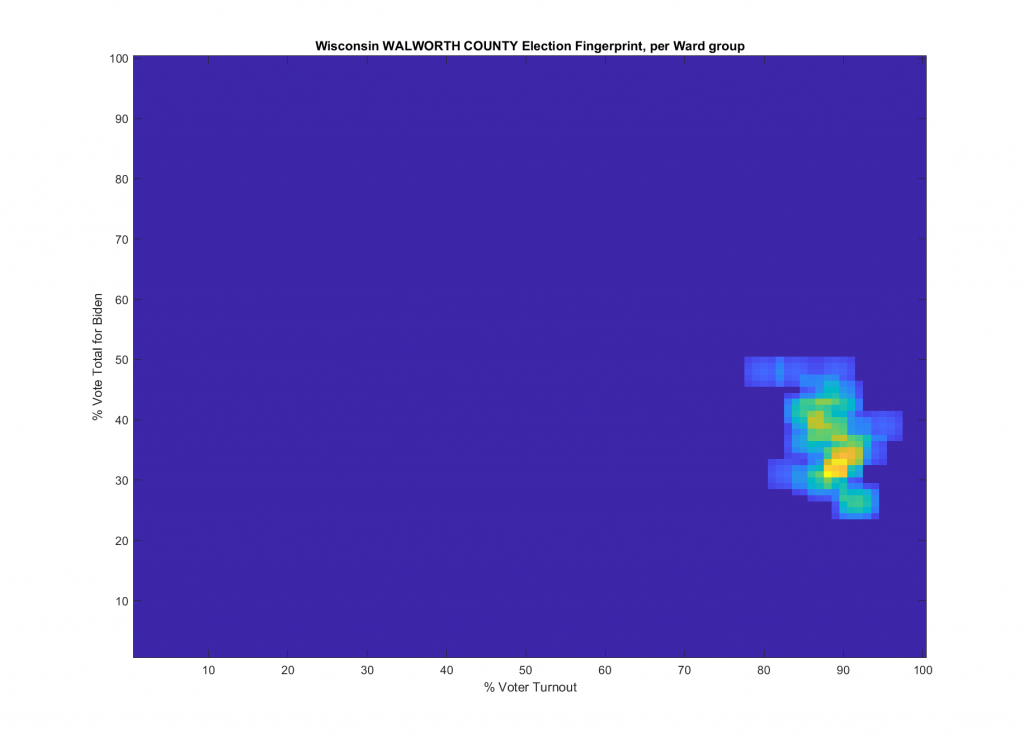
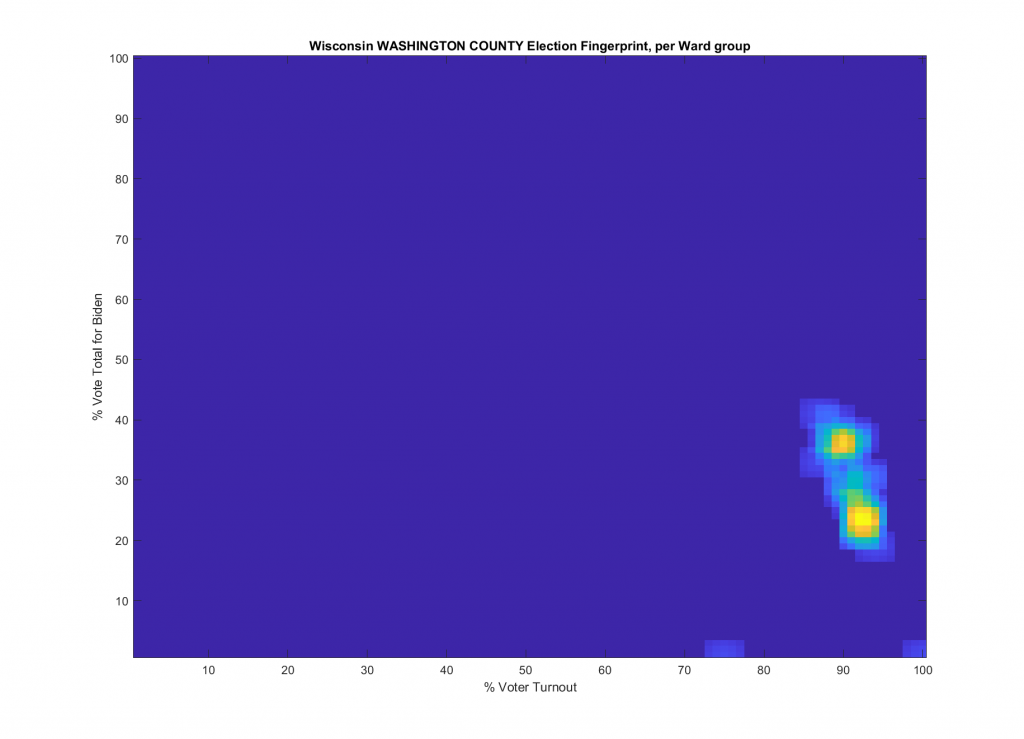
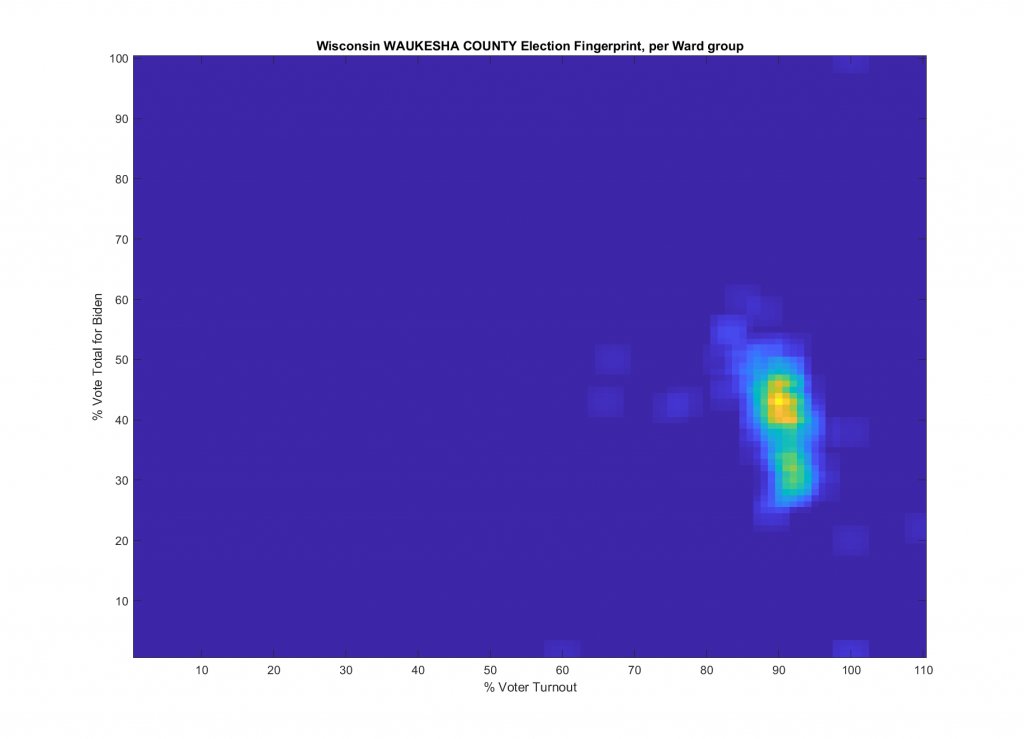
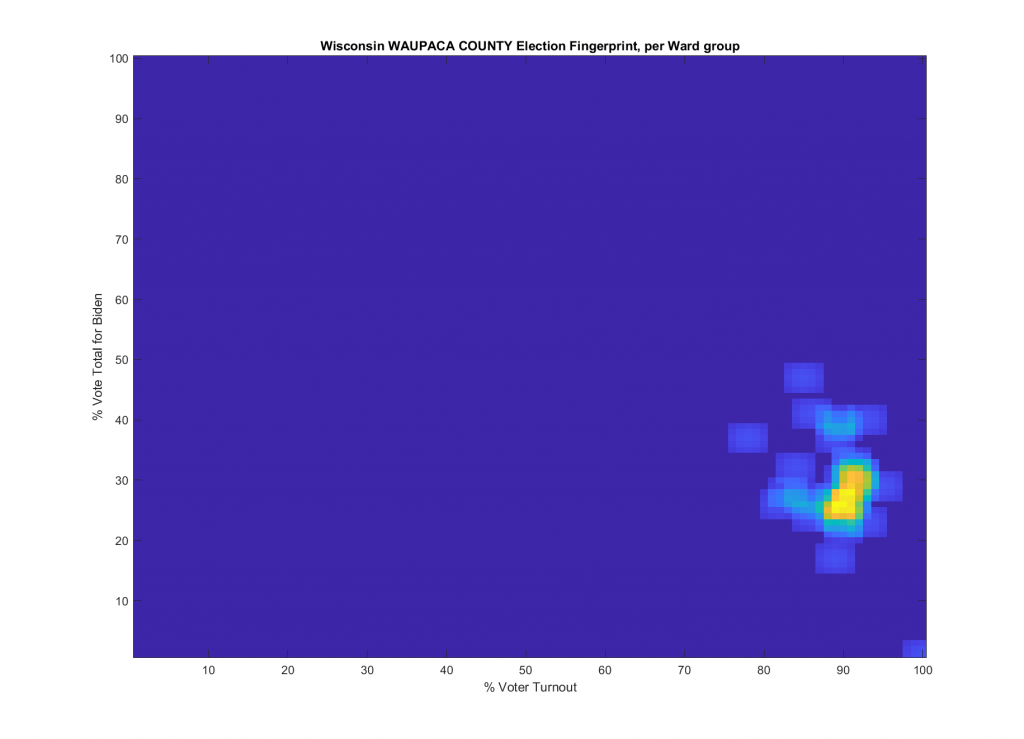
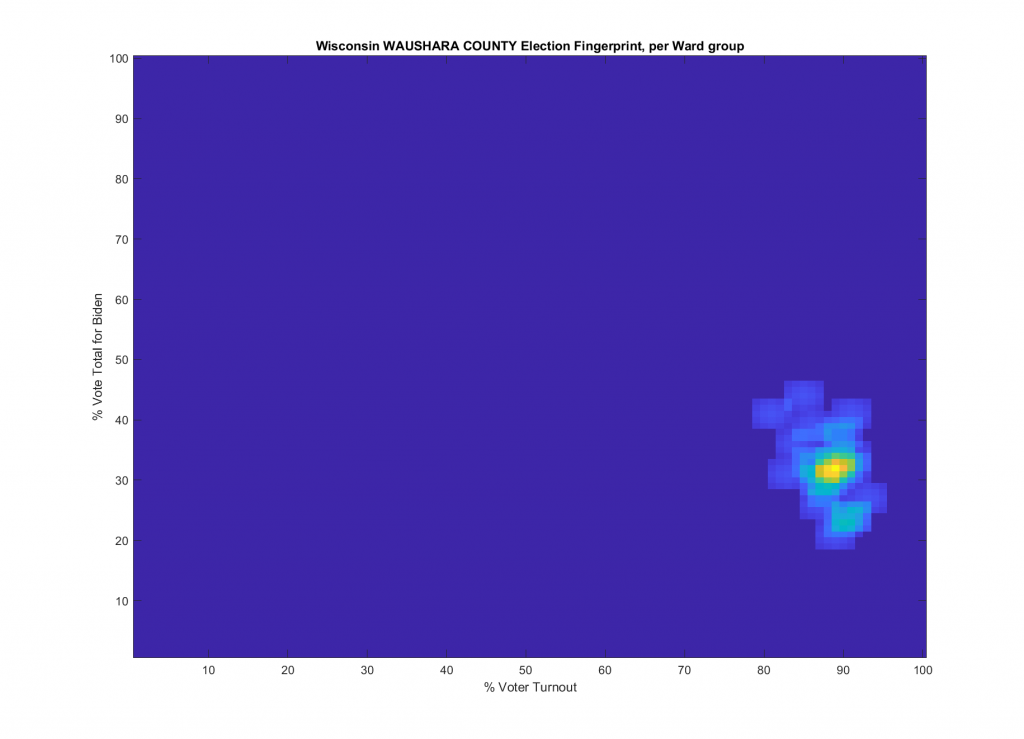
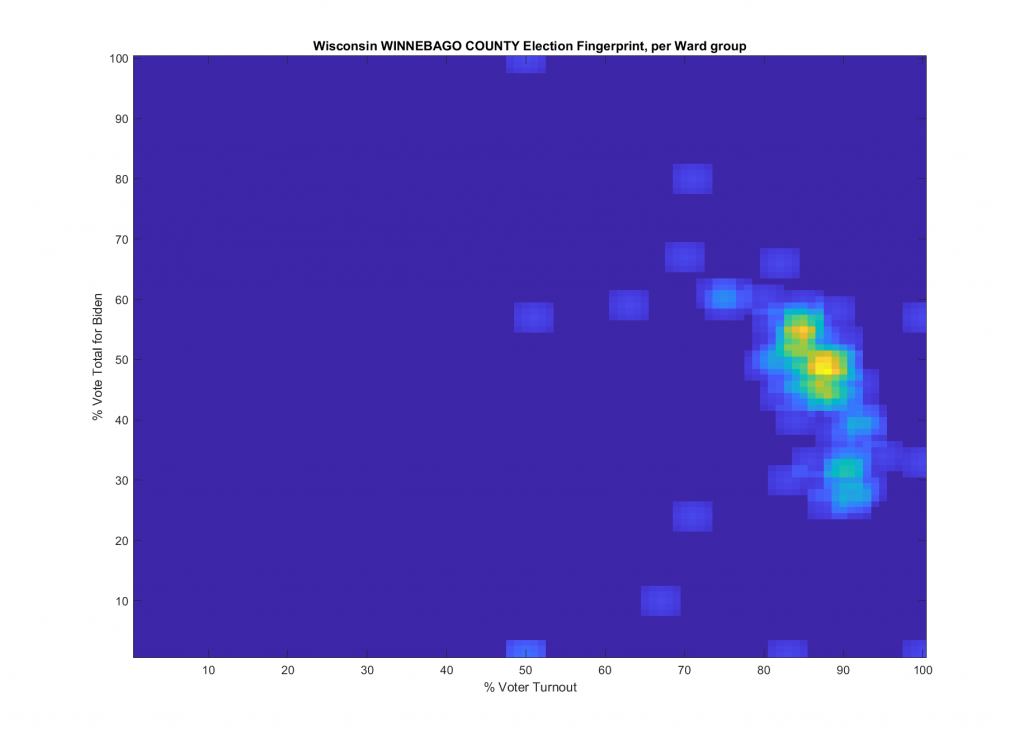
Testing specific Wards to check for outliers
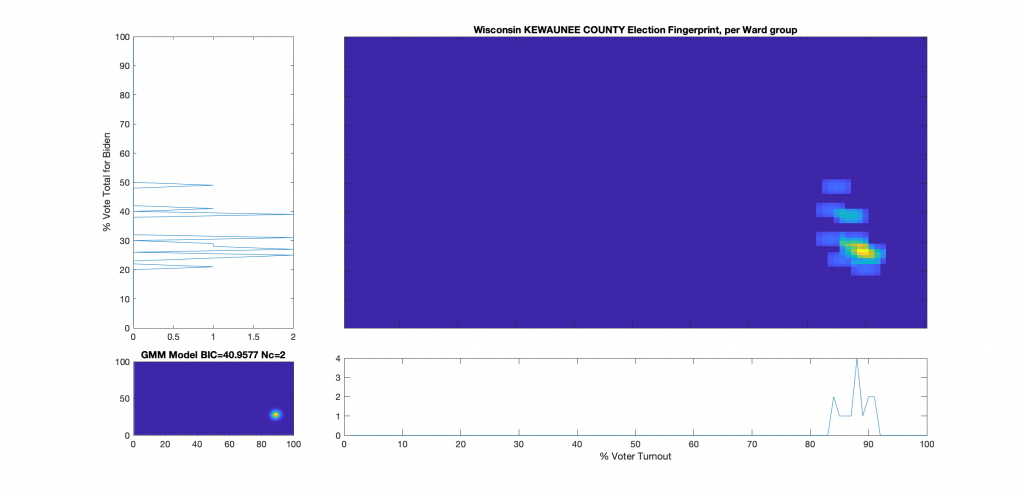
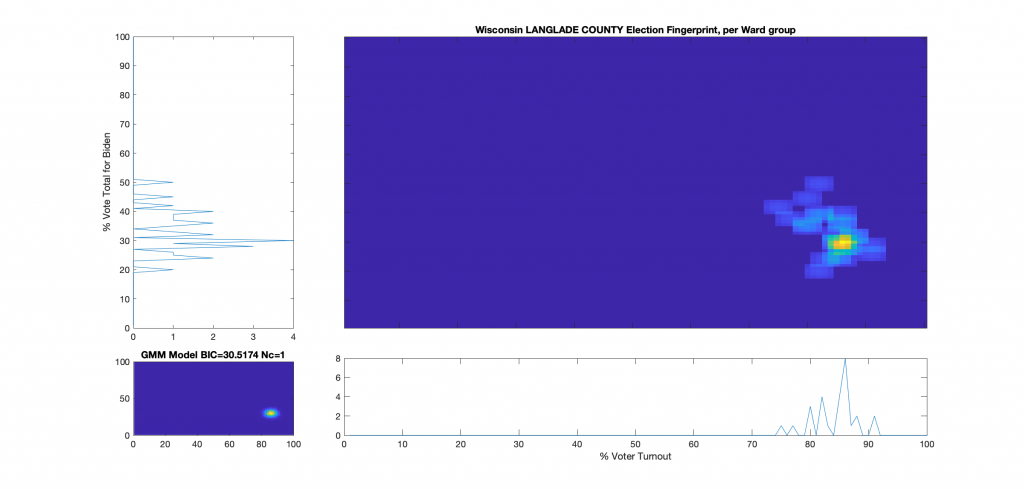
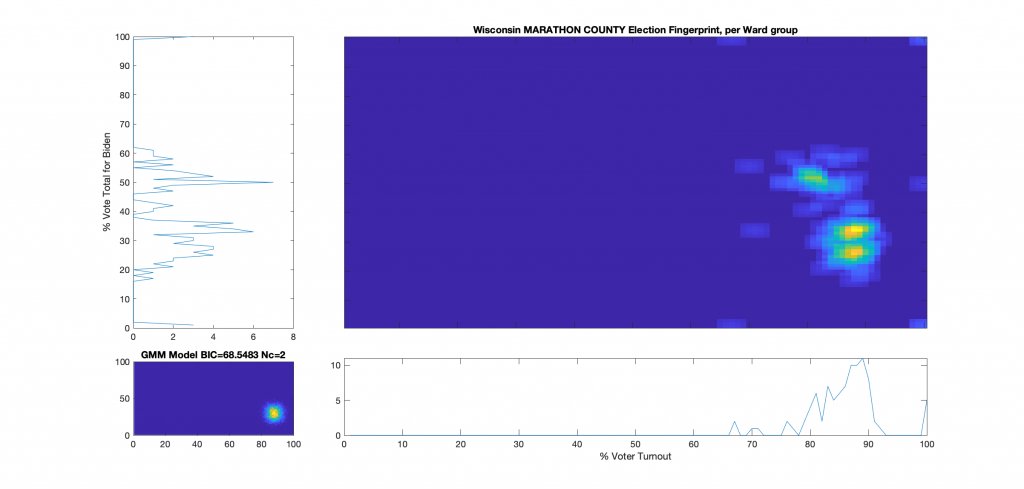
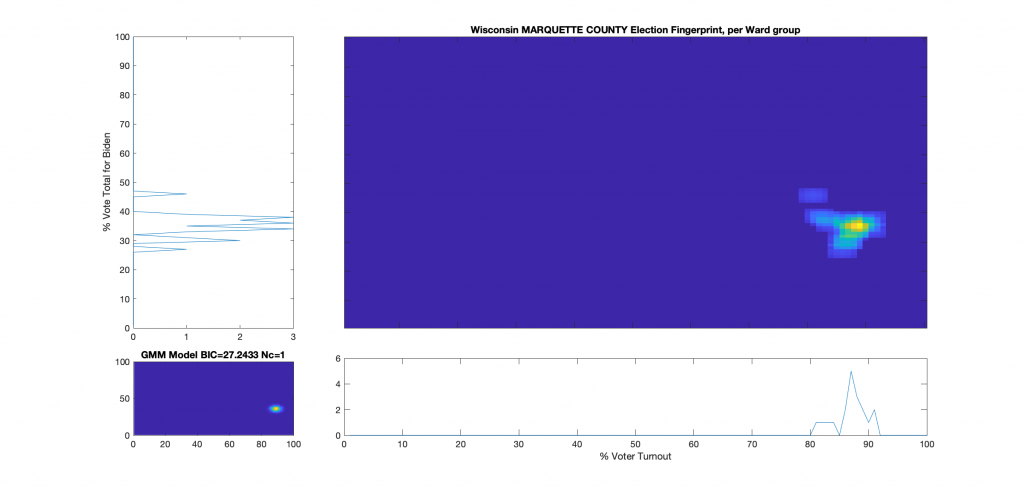
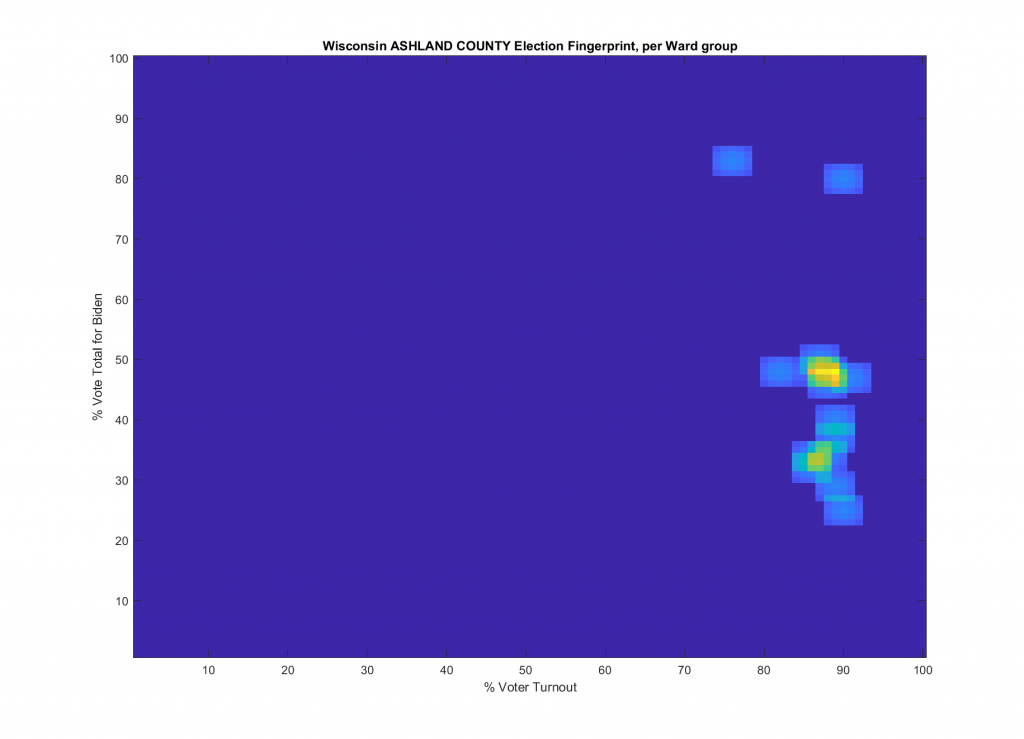
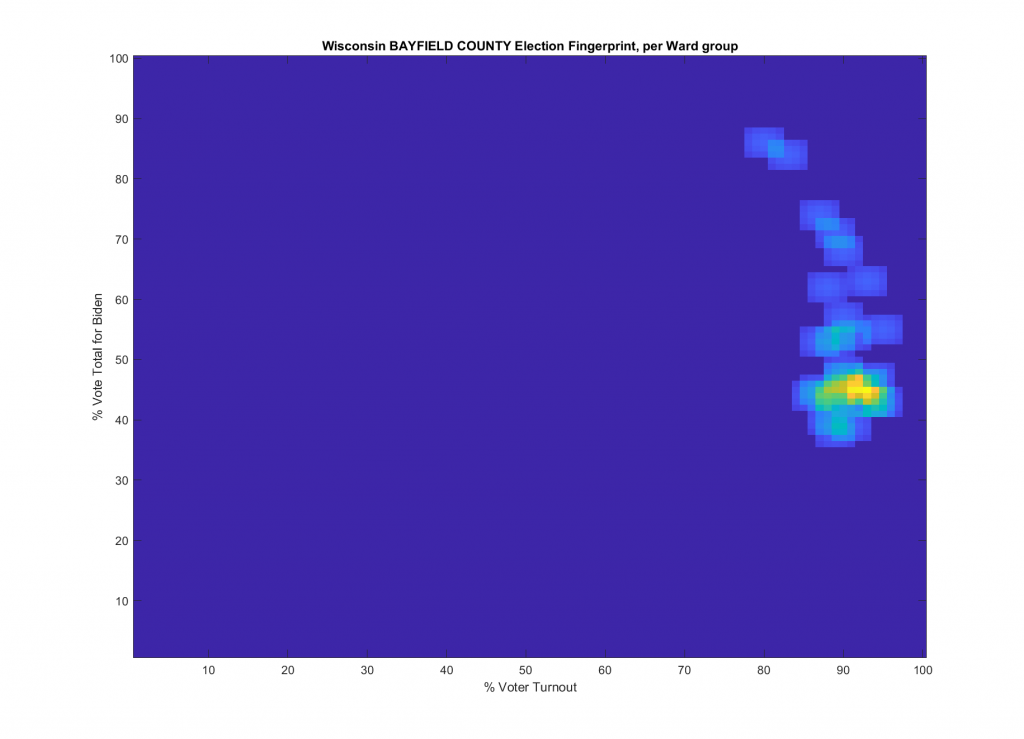
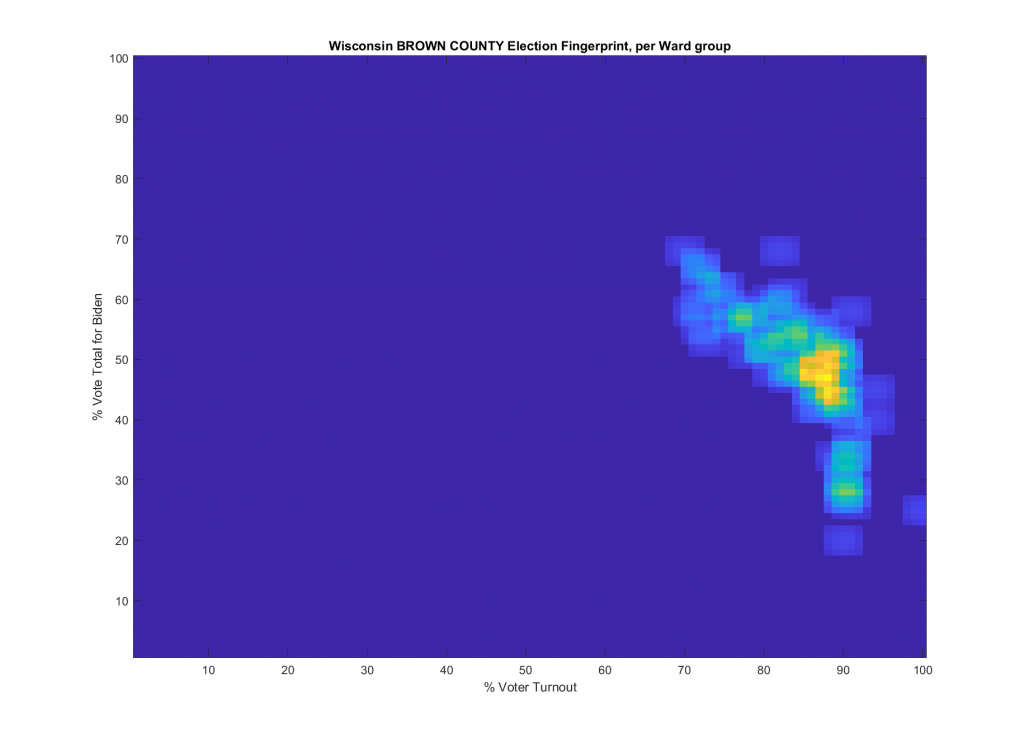
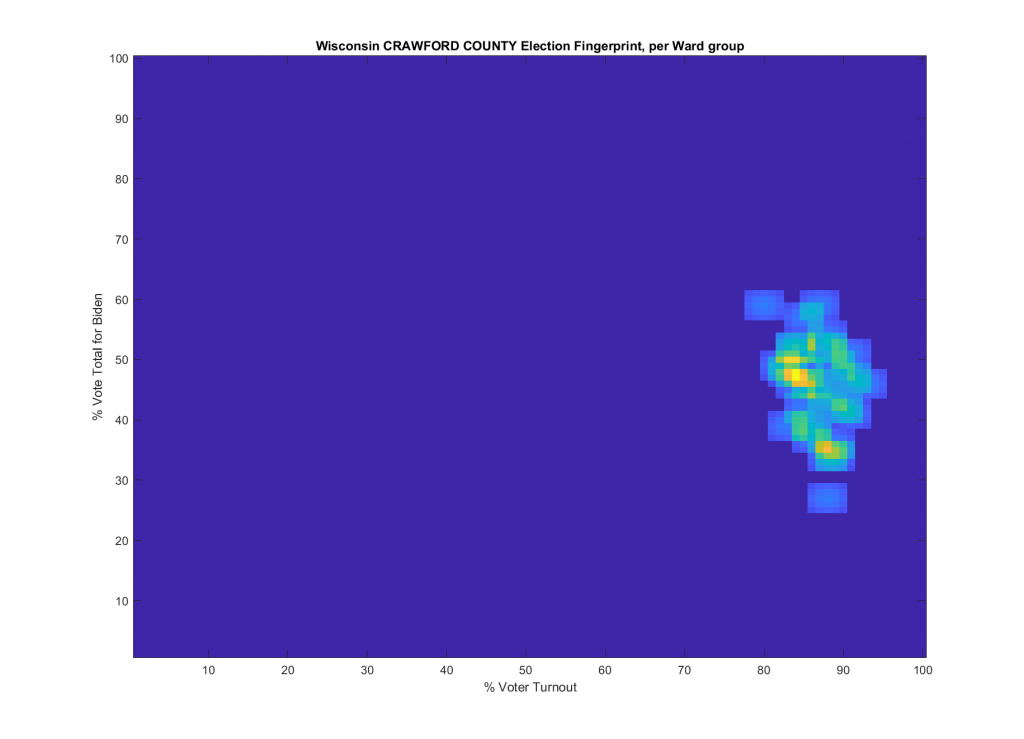
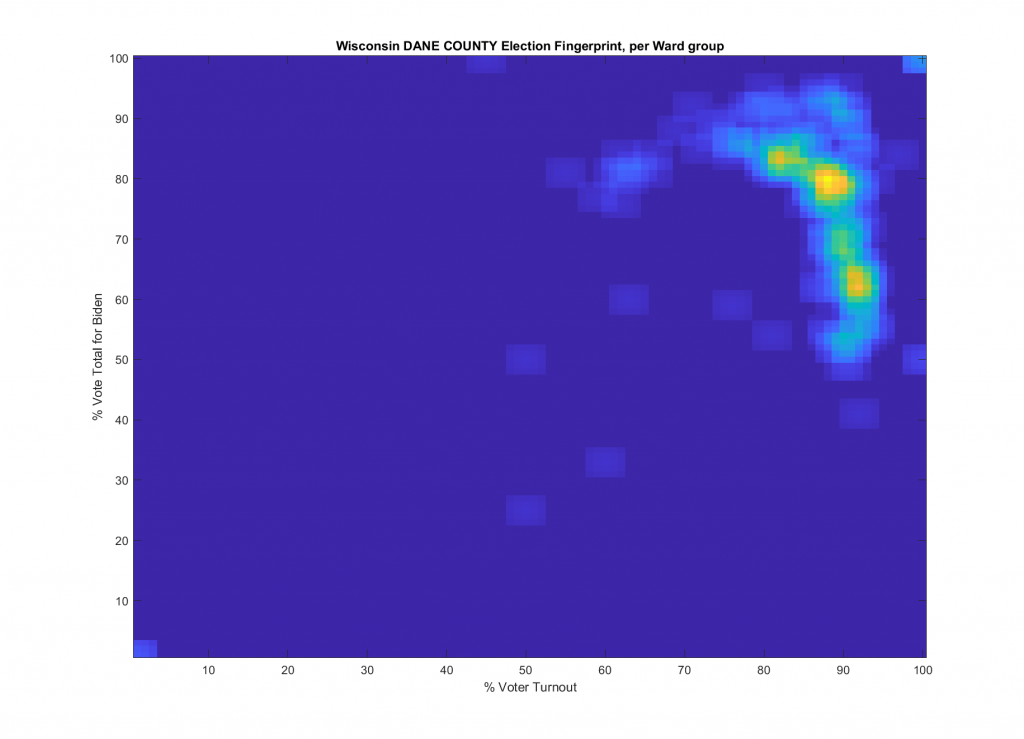
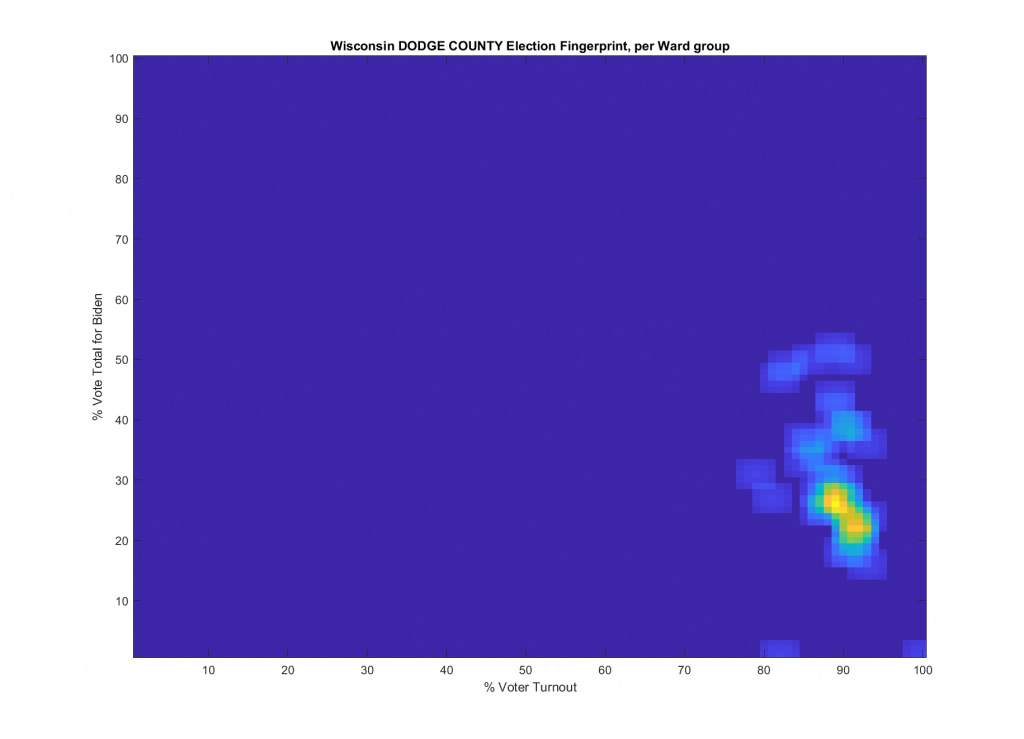
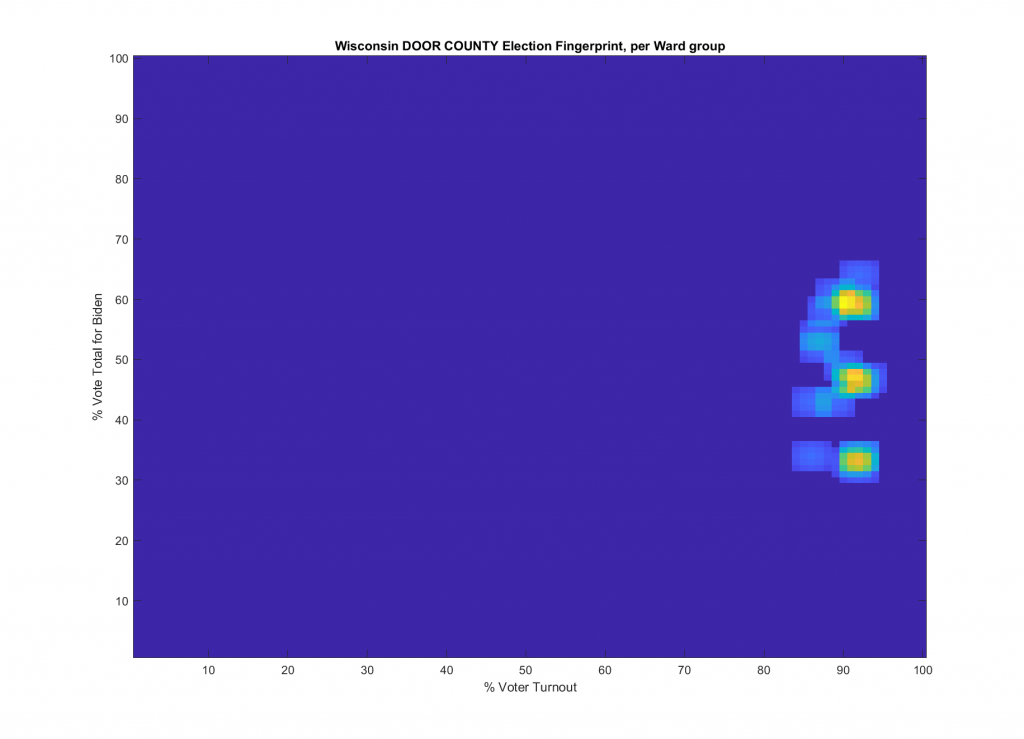
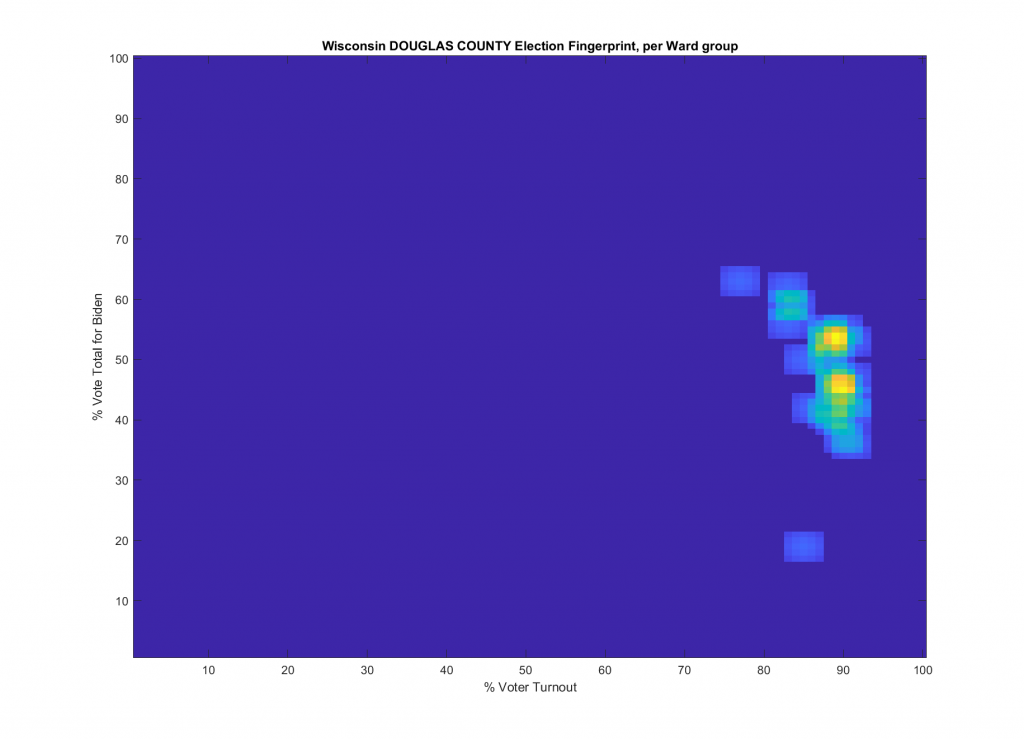
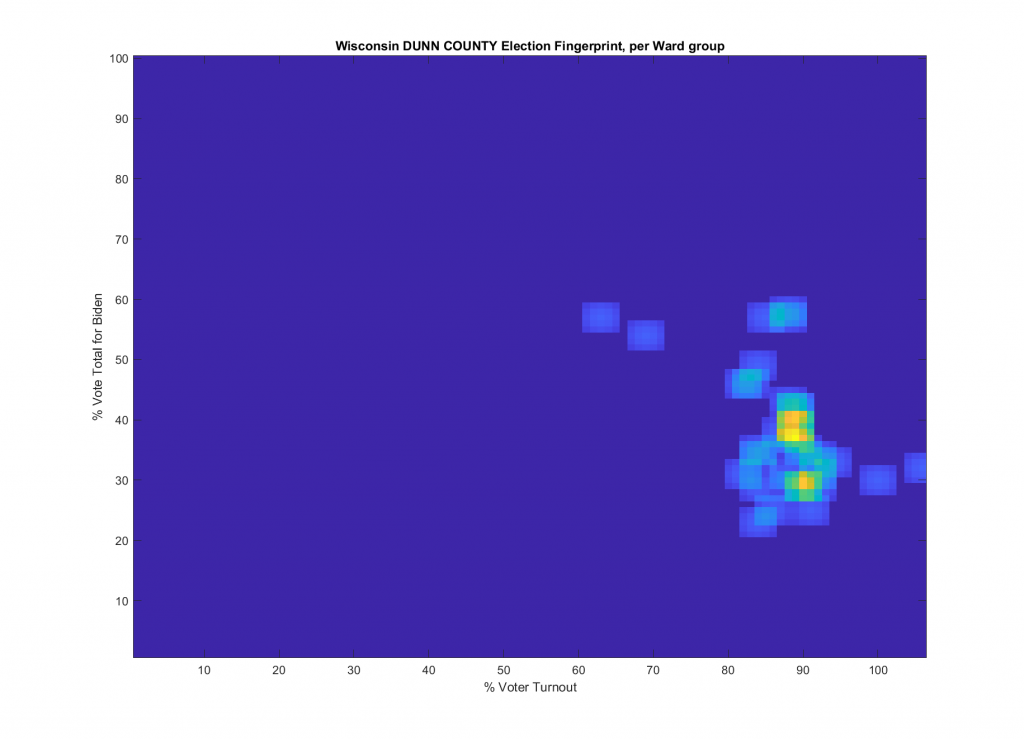
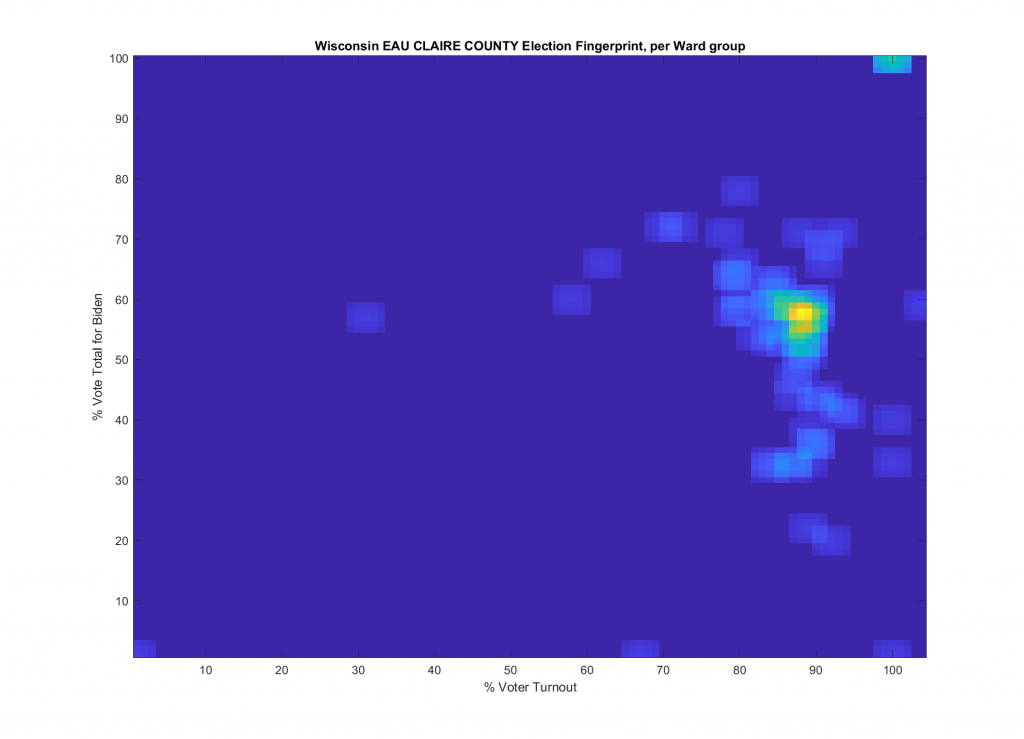
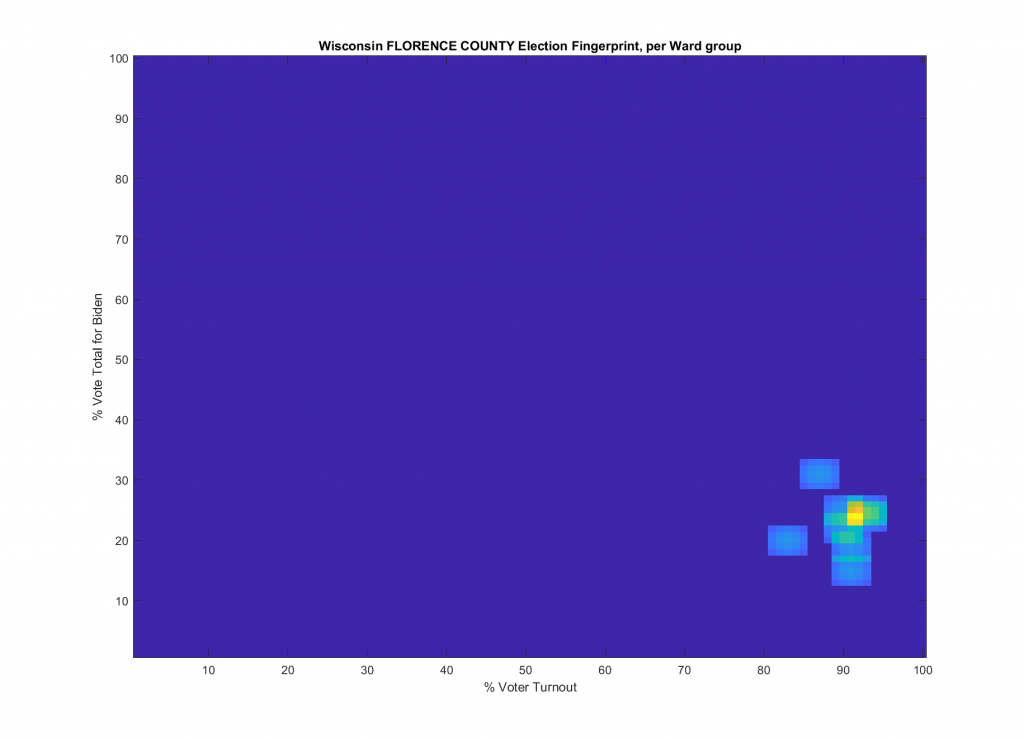
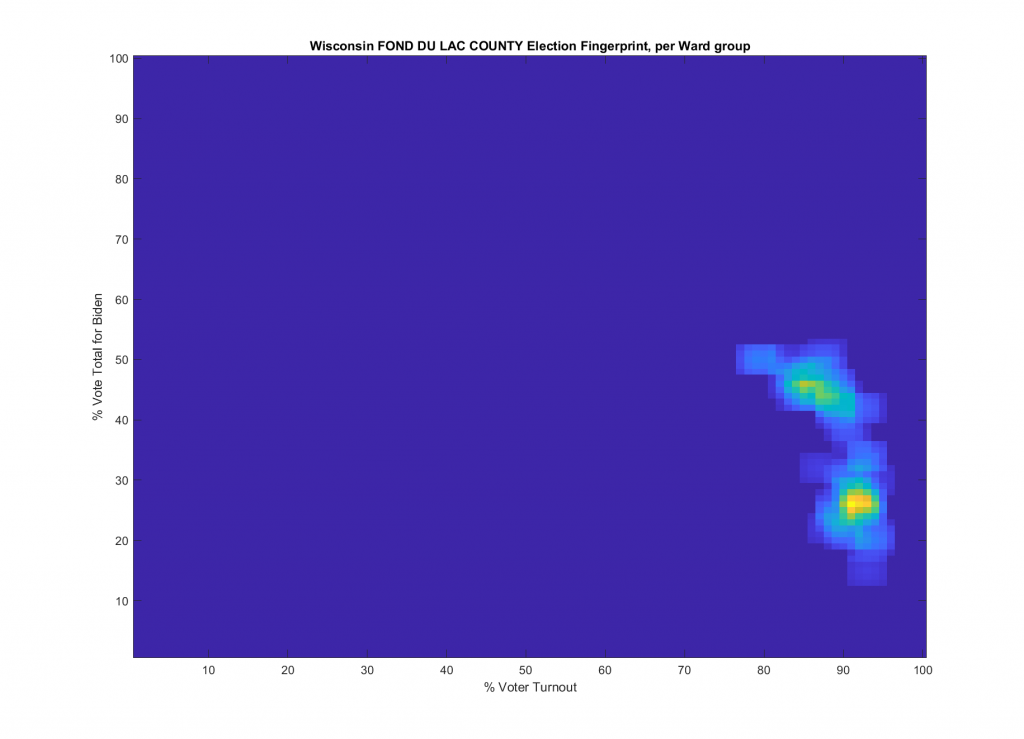
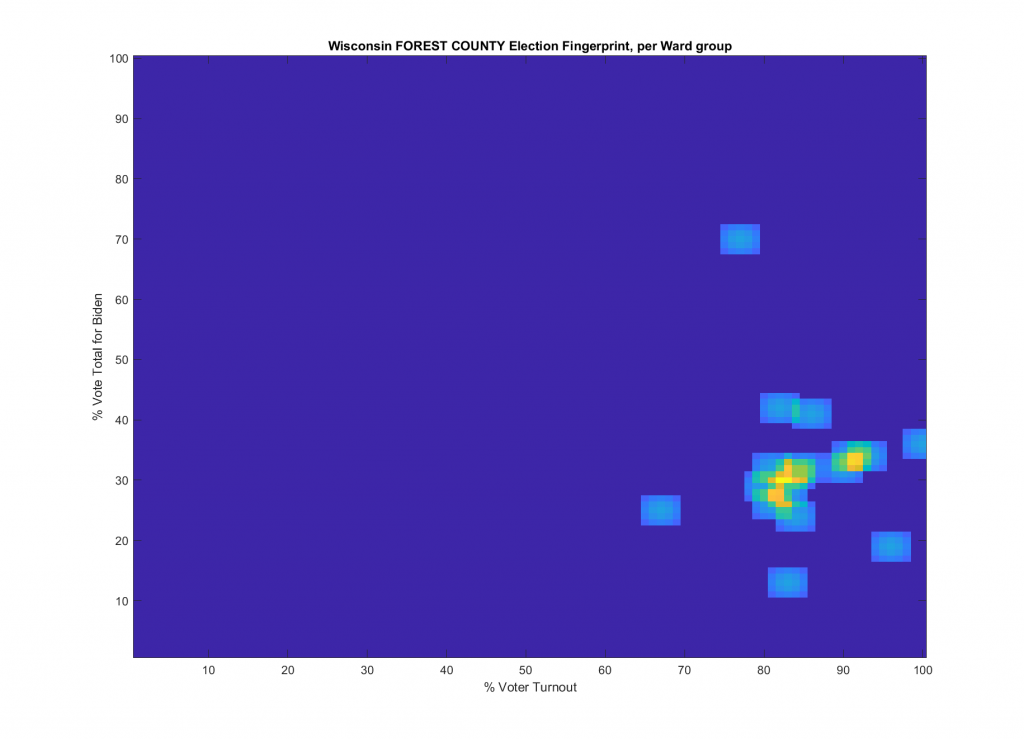
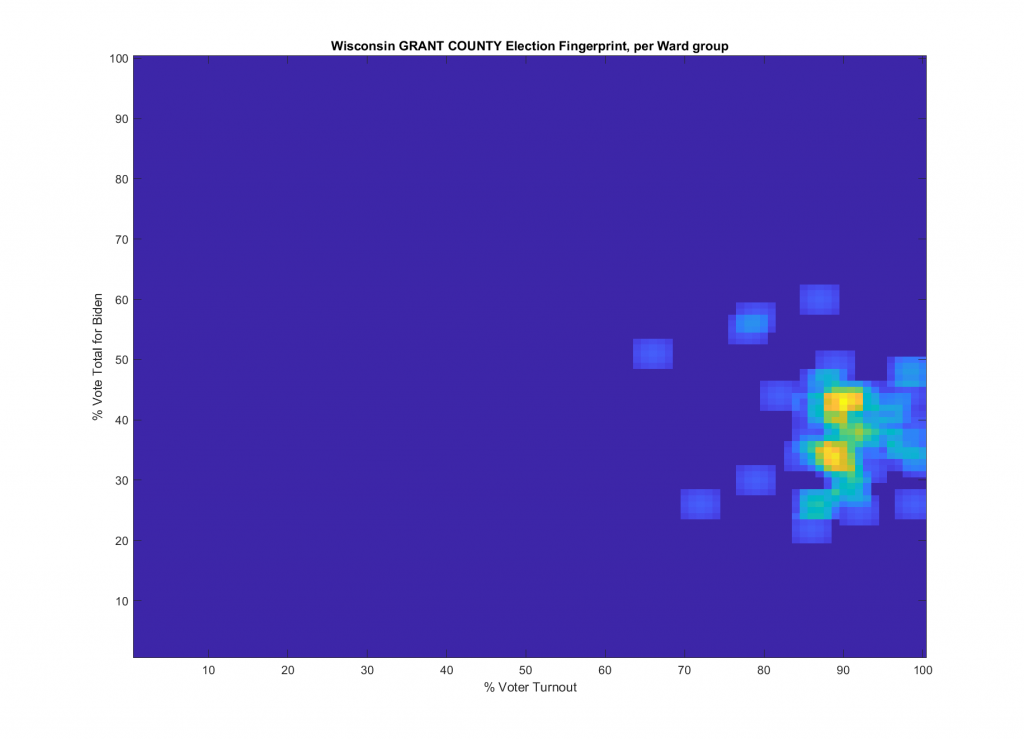
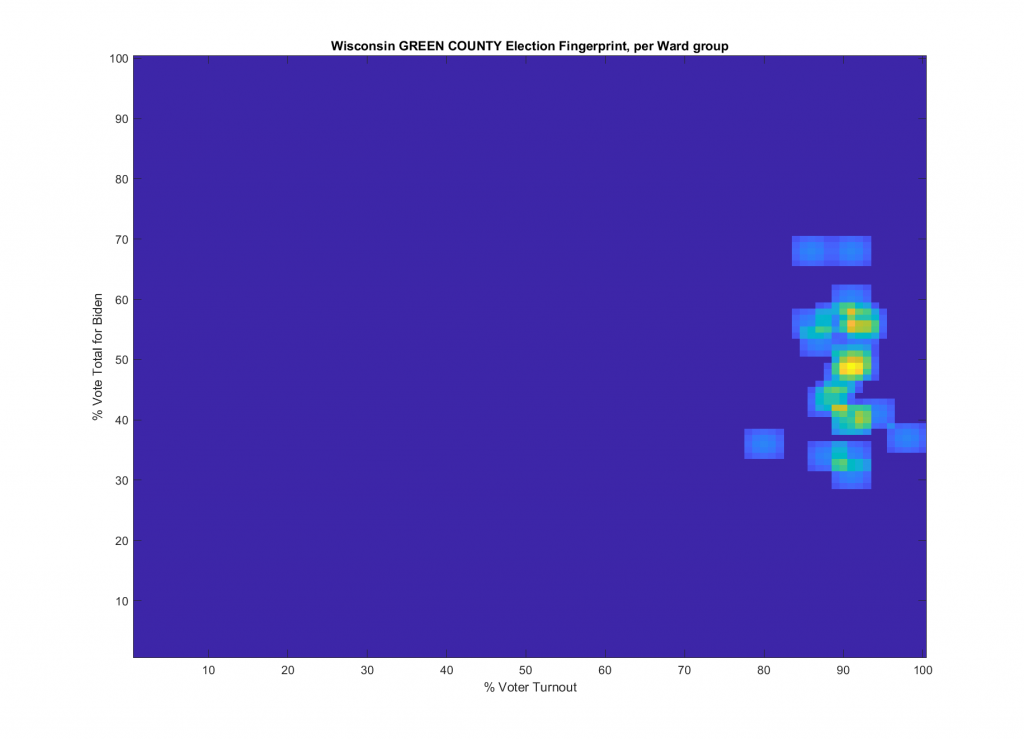
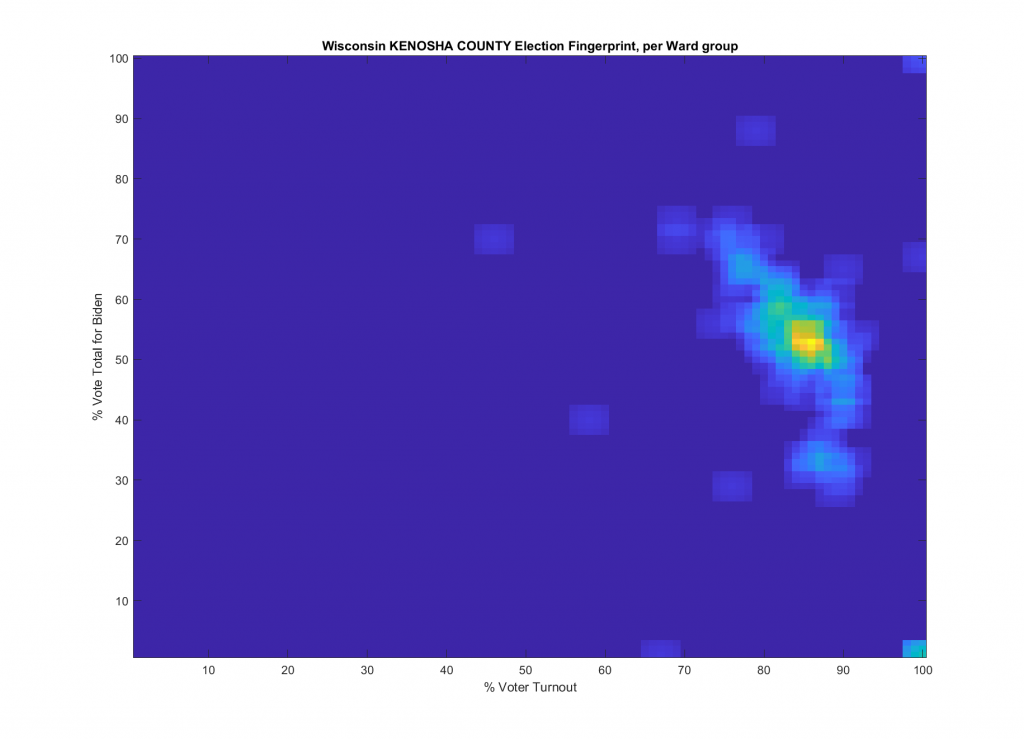
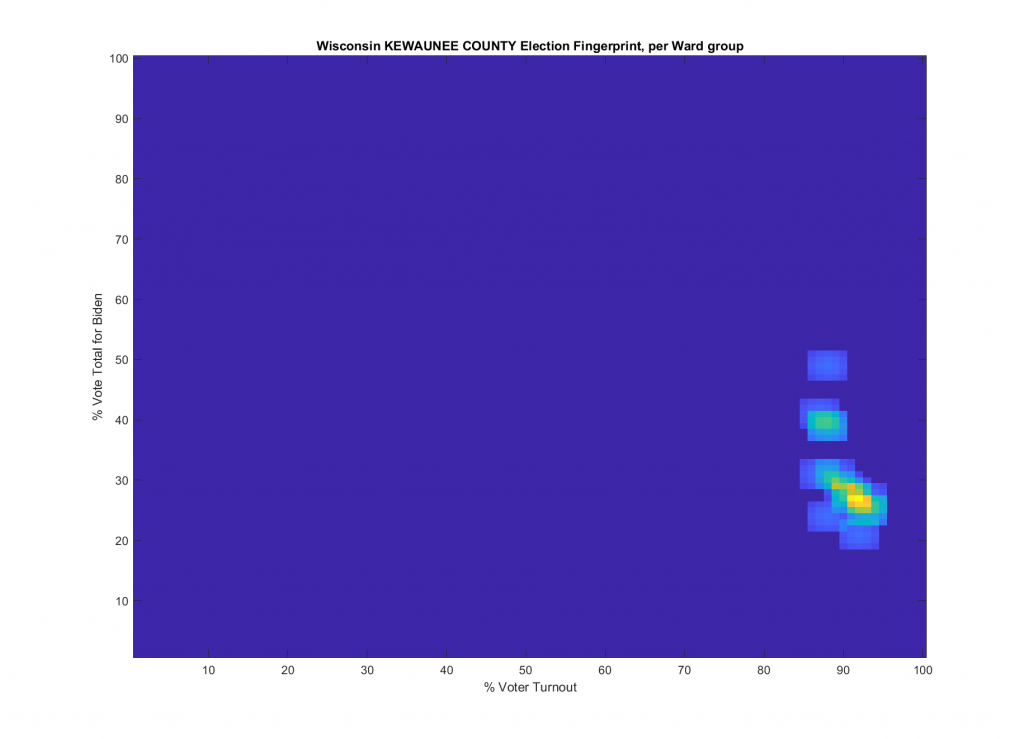
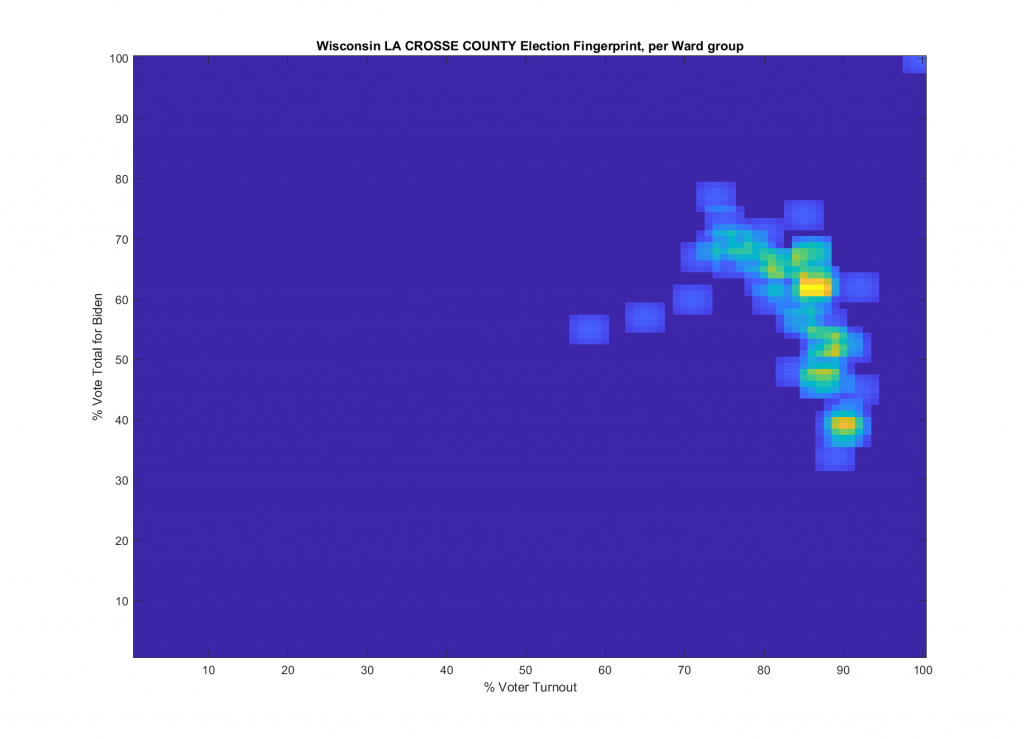
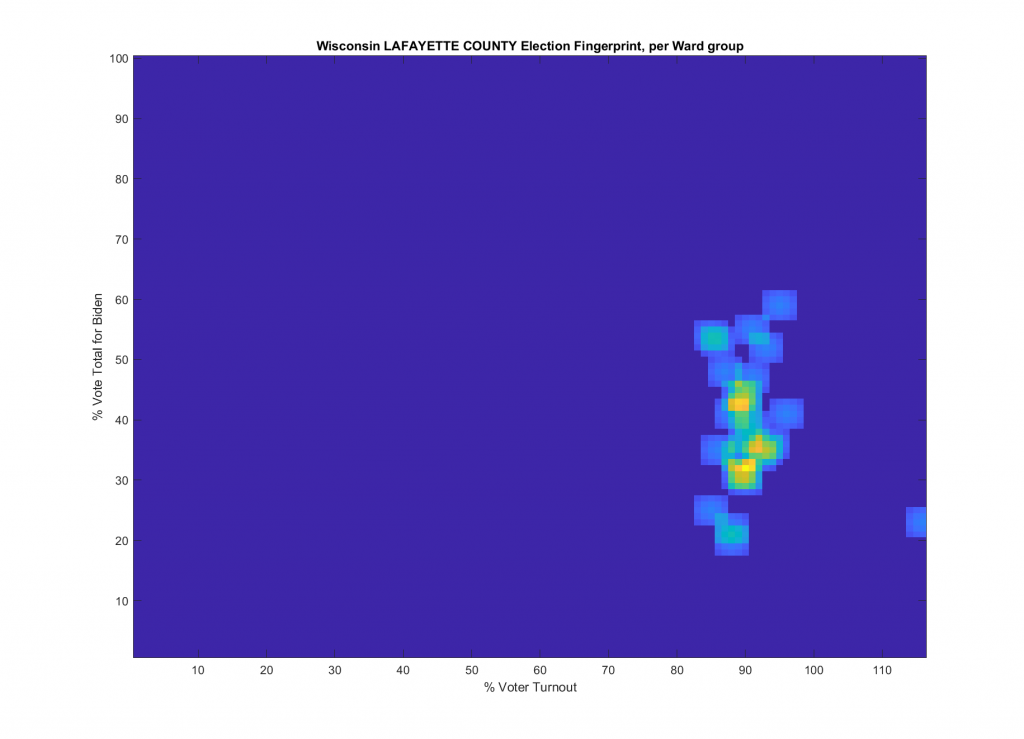
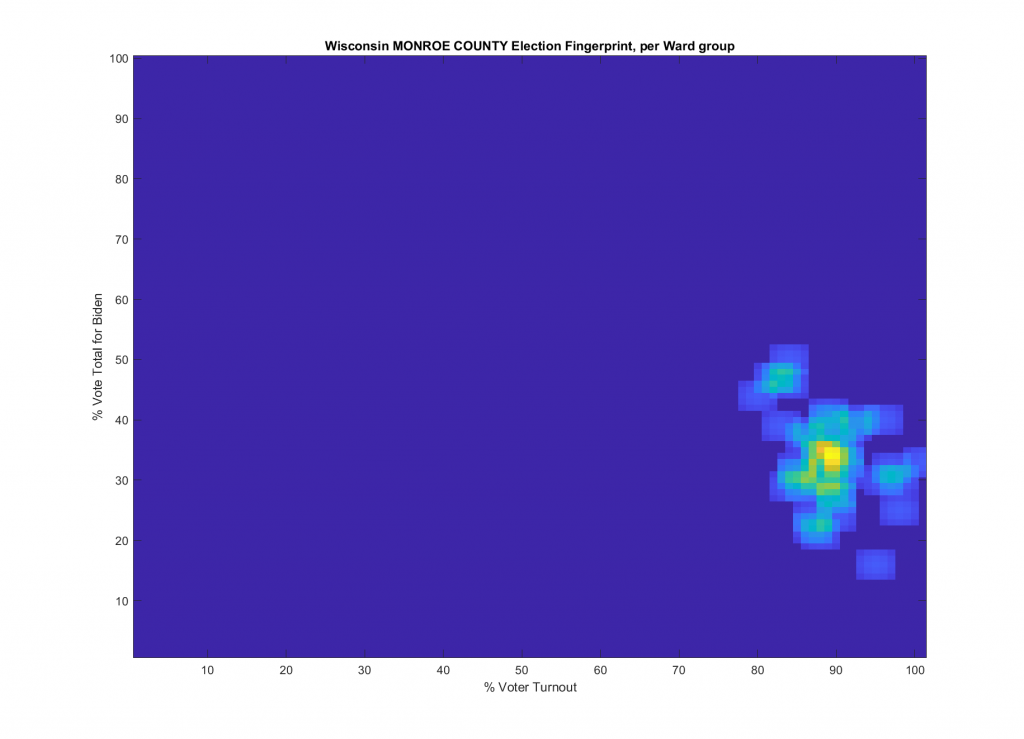
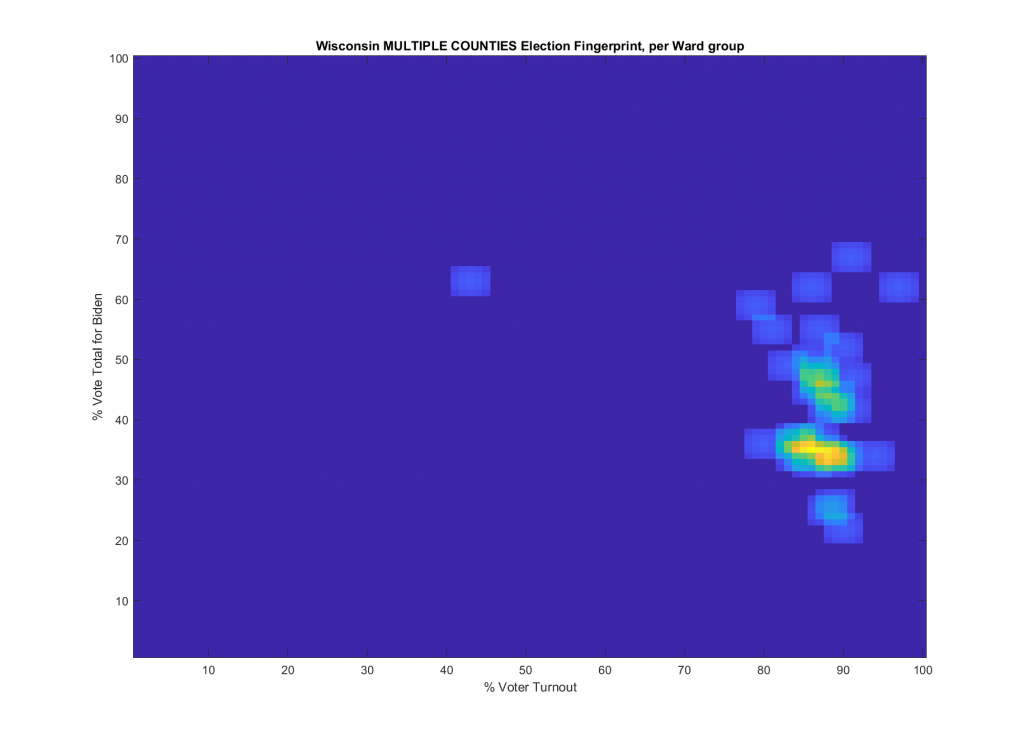
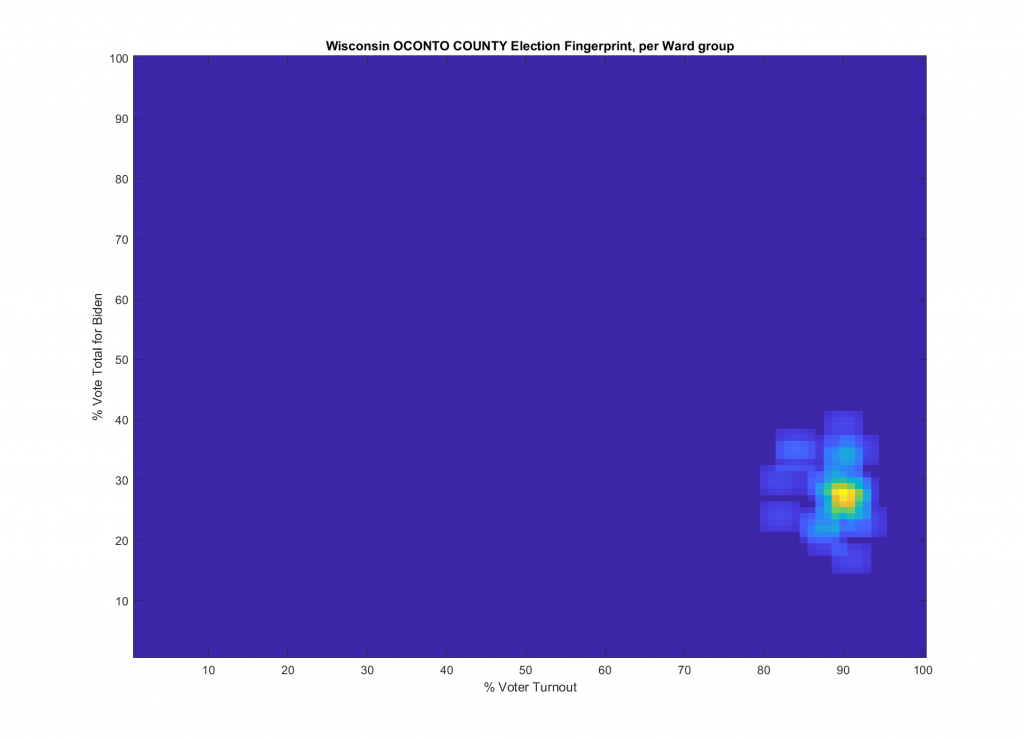
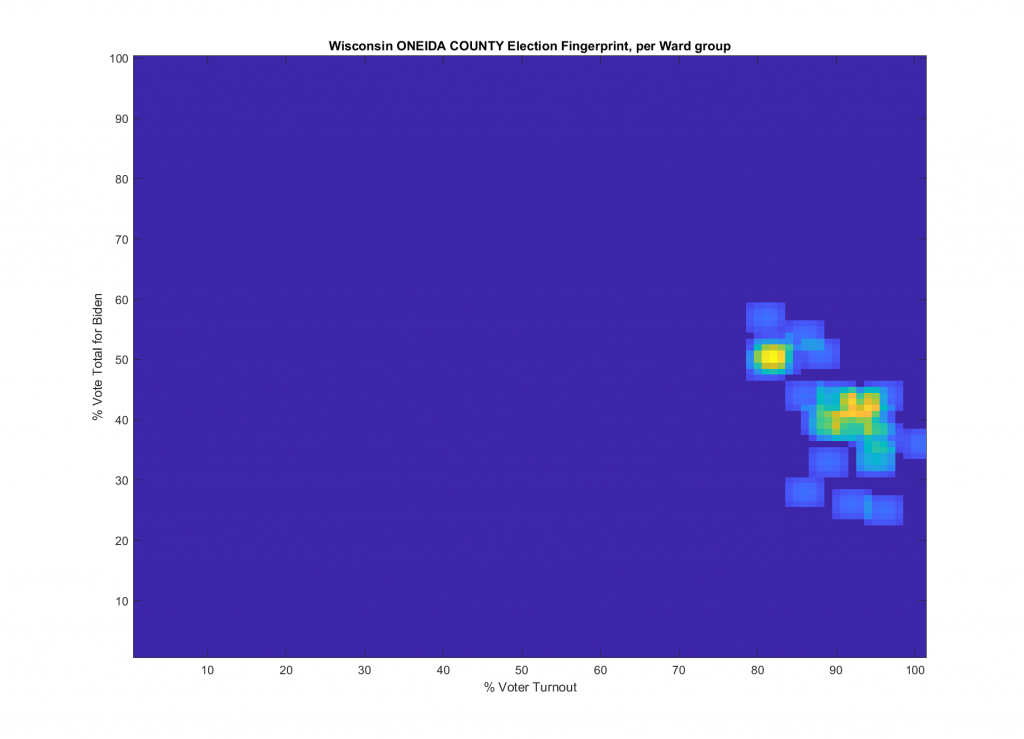
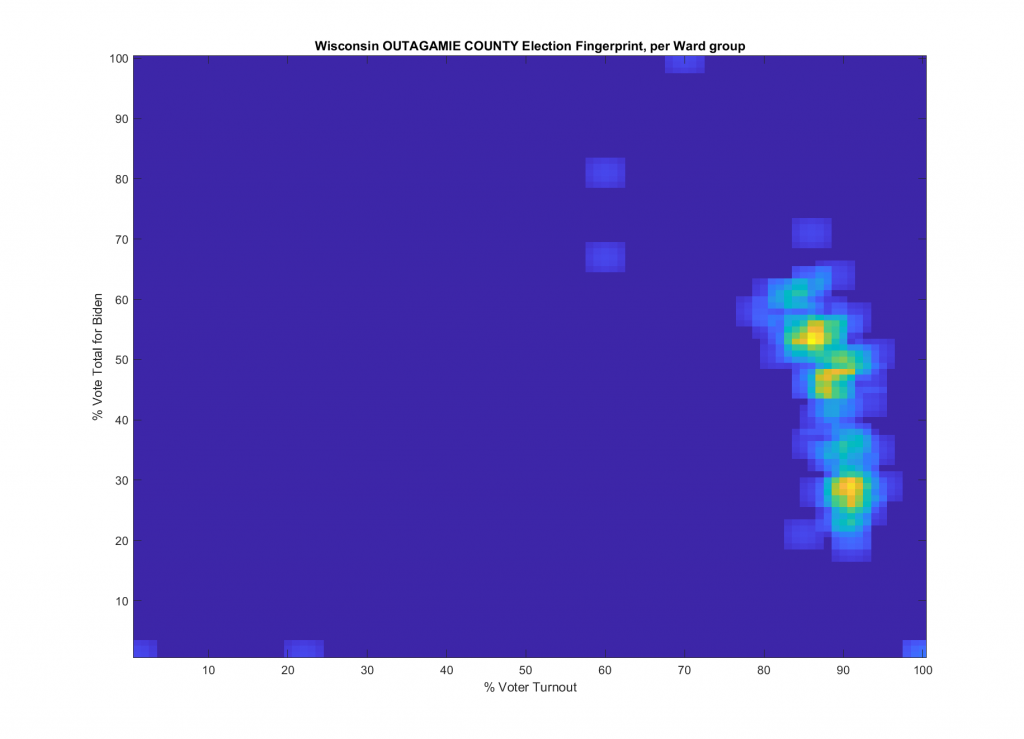
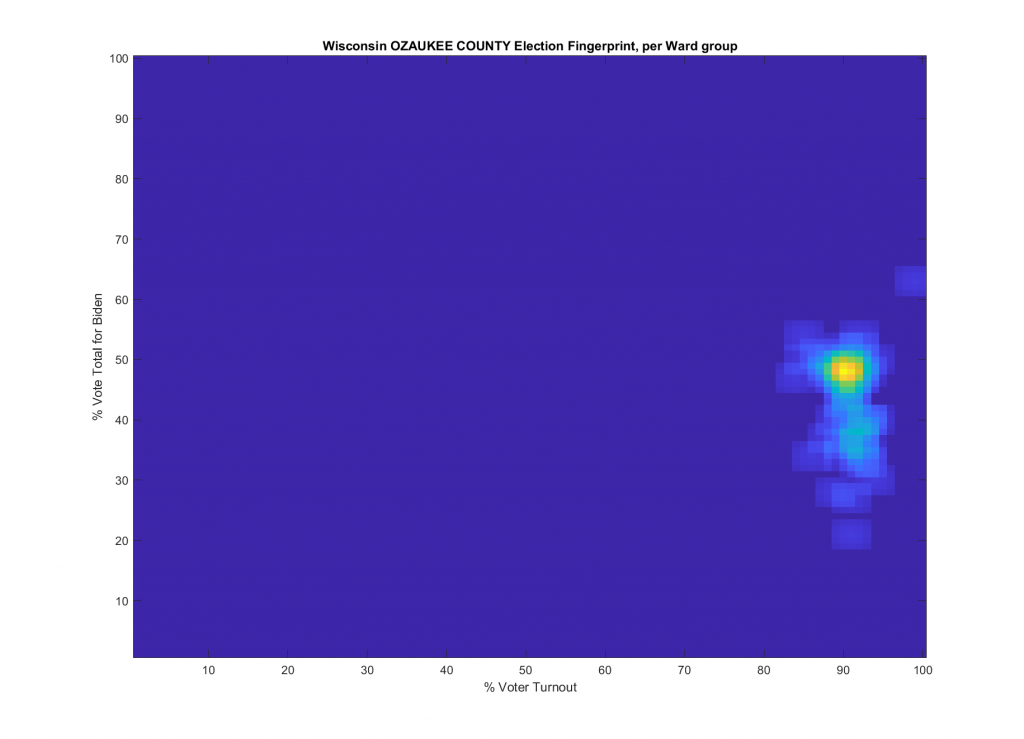
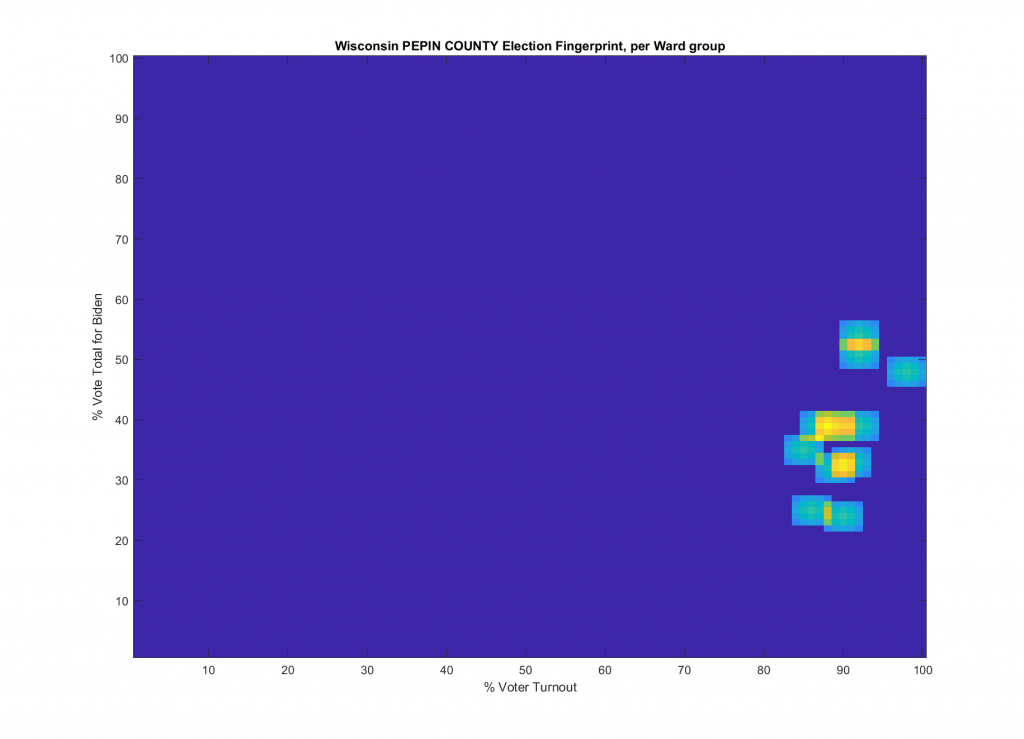
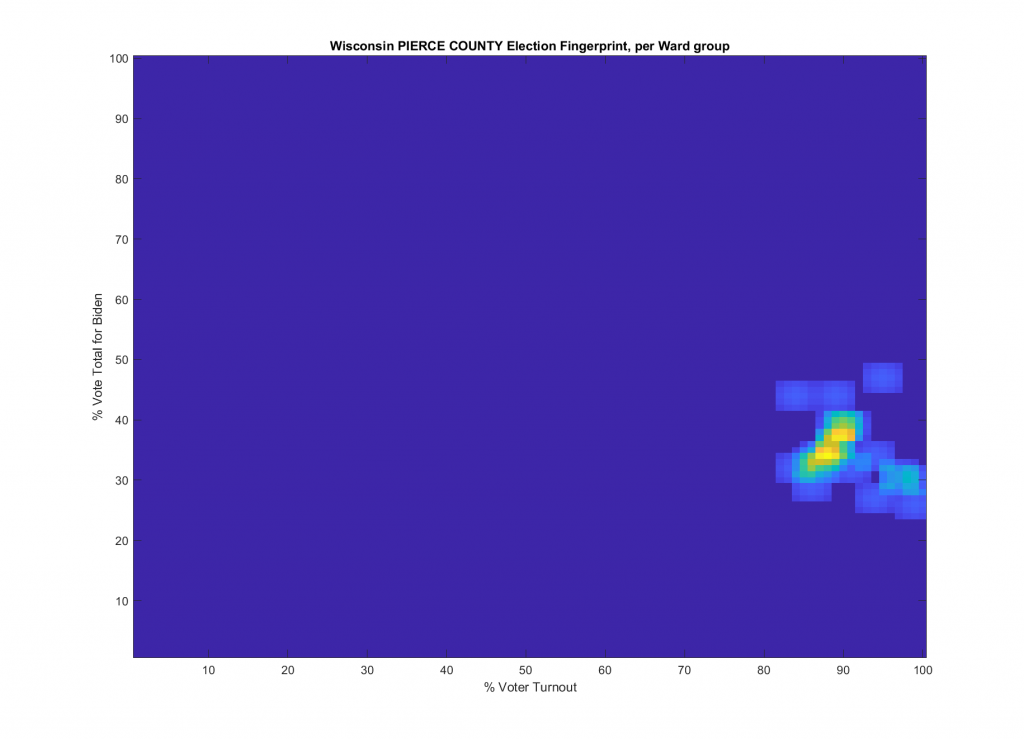
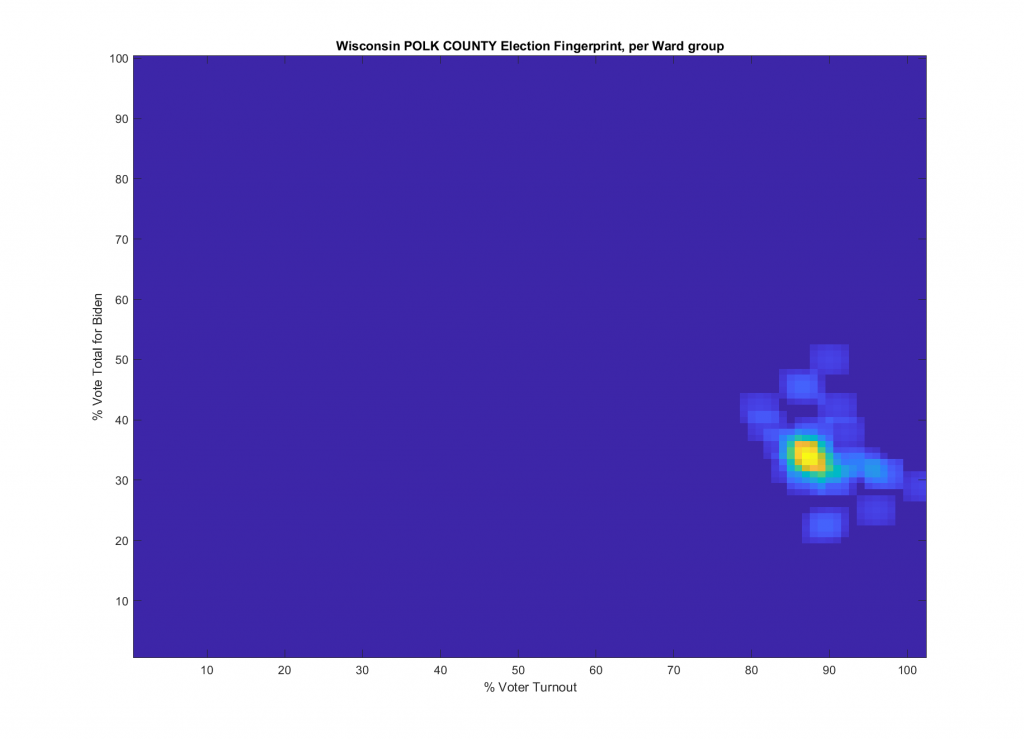
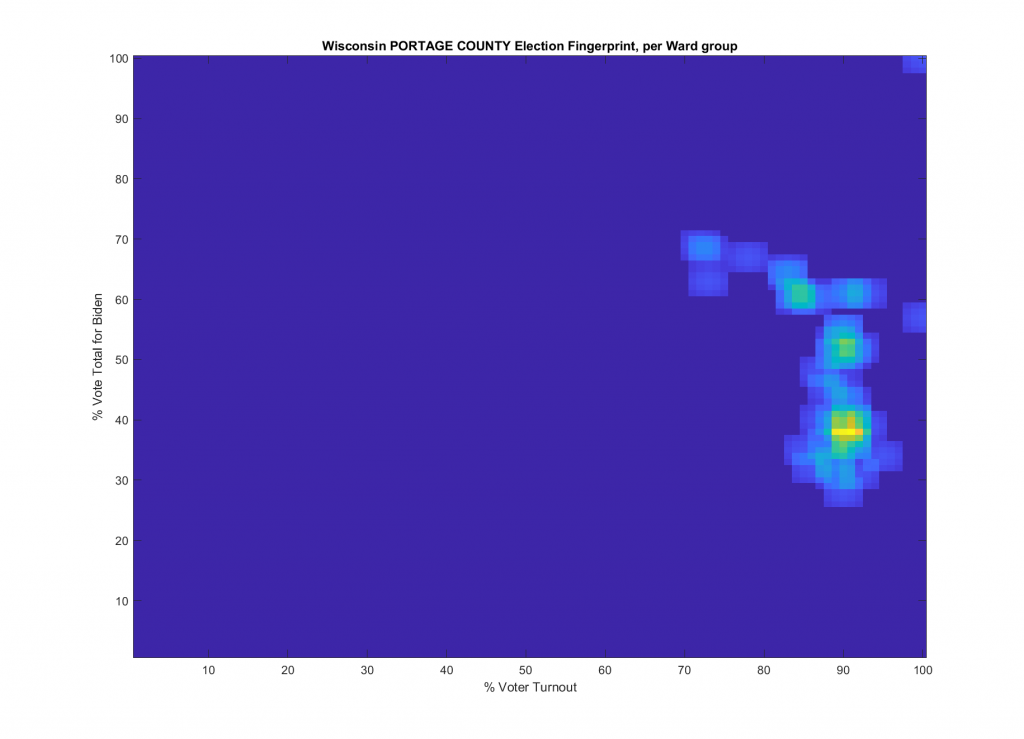
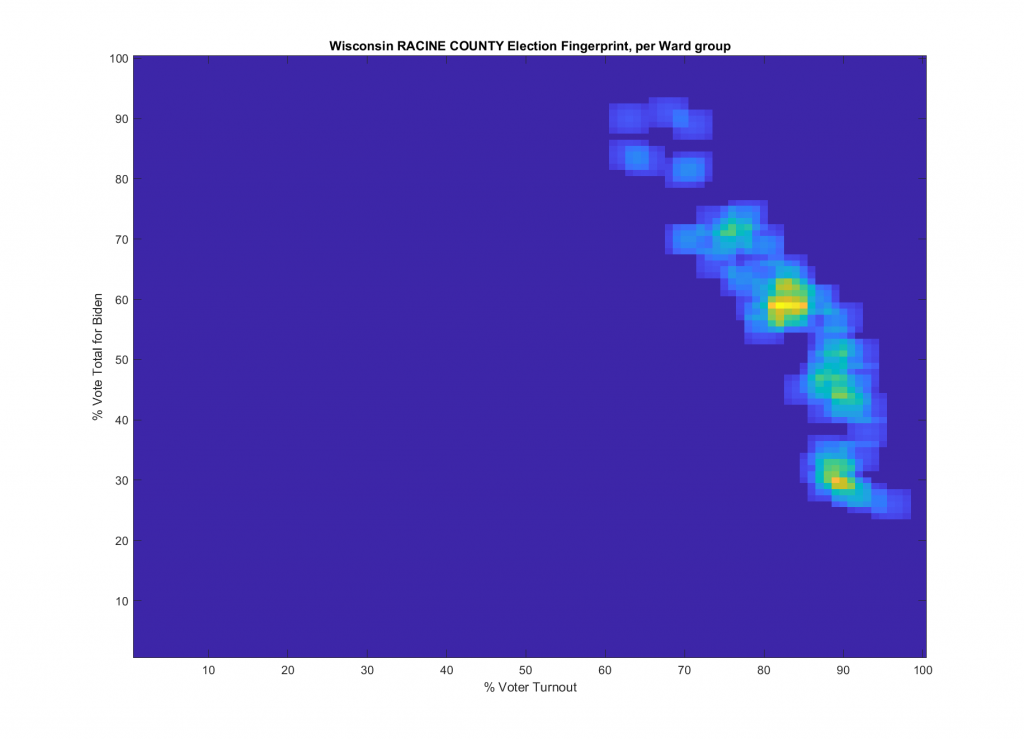
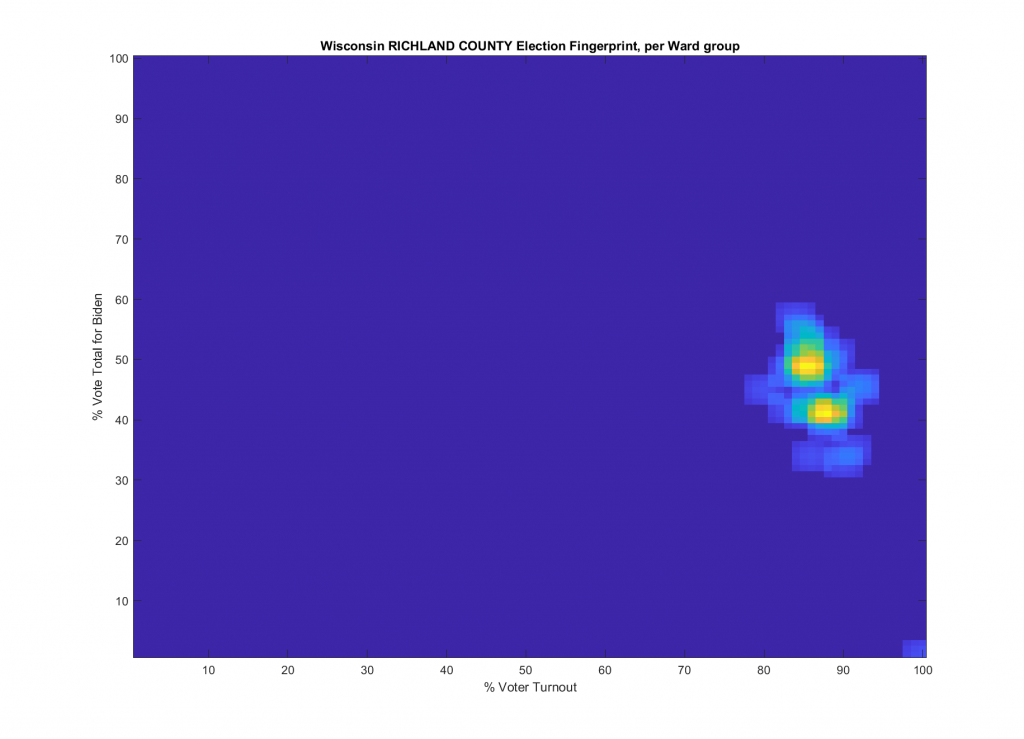
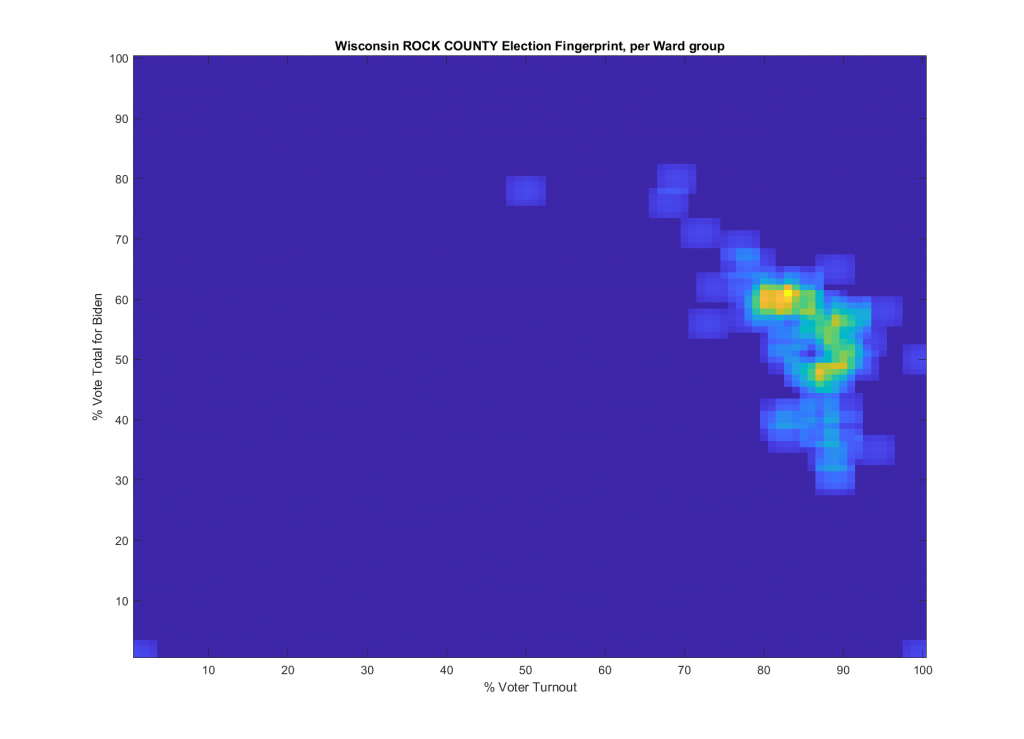
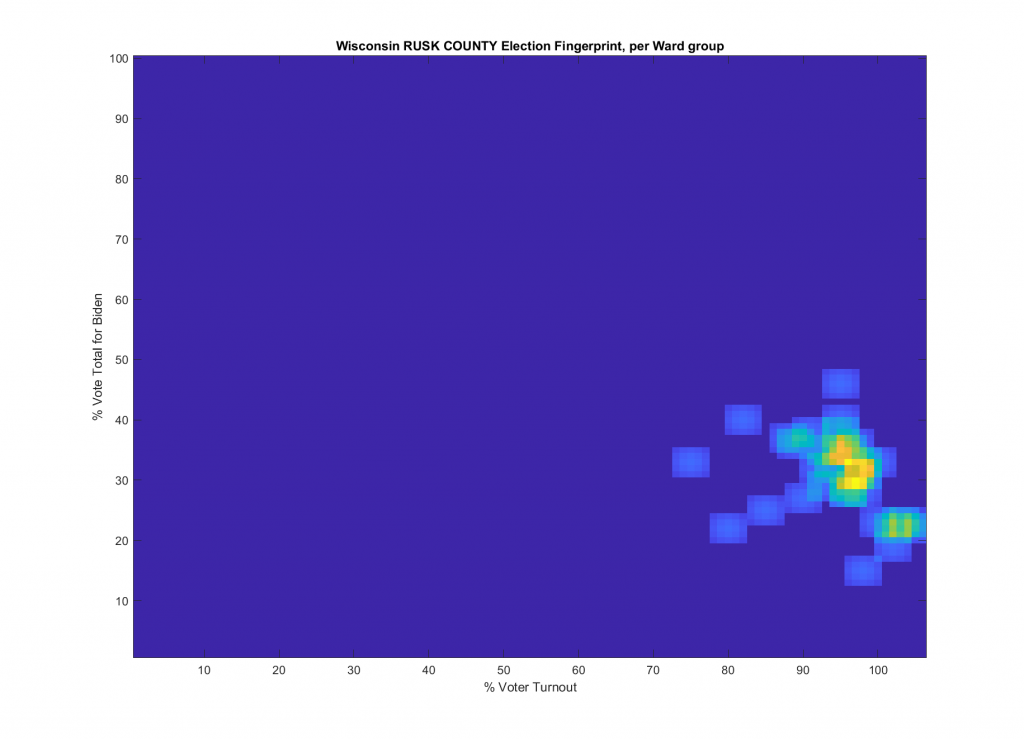
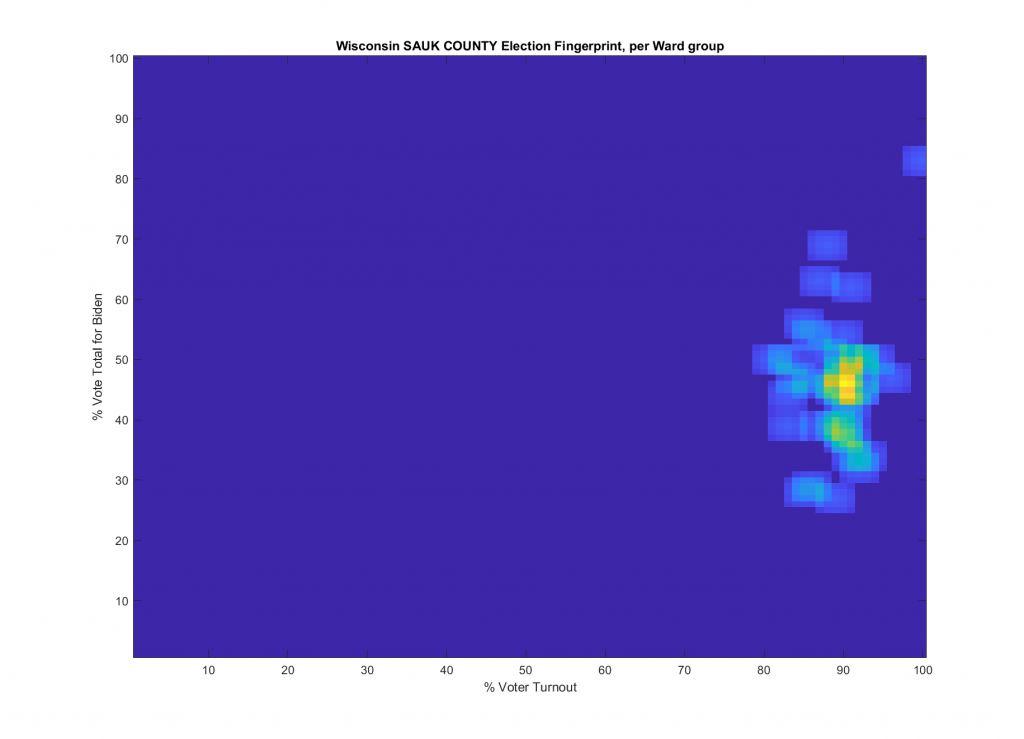
Just like before, I went through each individual counties data to make individual county specific Fingerprints. I also used the model to find a set of “interesting” wards by testing how well the ward fit against the probability density function (pdf) of the model. Wards are deemed outliers from the model if the ward group entry had (over 25 votes total) AND (it had over 97% turnout OR it had over 97% votes for Biden OR it had an evaluated pdf of < 1E-9 against the GMM Model). The complete list of outliers according to this model is below, along with the sums for the outlier wards.
| BidenVotes | TrumpVotes | TotalVotes | RegisteredVotes | |
| Sum | 213312 | 139381 | 359130 | 446866 |
| Locality | BidenVotes | TrumpVotes | TotalVotes | RegisteredVoters | Turnout | BidenPct | TrumpPct | Model Probability |
| ASHLAND COUNTY TOWN OF LA POINTE WARD 1 | 236 | 52 | 294 | 324 | 90.7407407407407 | 80.2721088435374 | 17.687074829932 | 1.92477676888761E-12 |
| ASHLAND COUNTY TOWN OF SANBORN WARDS 1-2 | 442 | 85 | 530 | 705 | 75.177304964539 | 83.3962264150943 | 16.0377358490566 | 6.11329669551507E-18 |
| BARRON COUNTY CITY OF BARRON WARDS 1-7 | 683 | 837 | 1532 | 1963 | 78.0438104941416 | 44.5822454308094 | 54.6344647519582 | 5.63608603904006E-10 |
| BAYFIELD COUNTY CITY OF BAYFIELD WARDS 1-4 | 314 | 57 | 373 | 454 | 82.15859030837 | 84.1823056300268 | 15.2815013404826 | 1.02971568650162E-21 |
| BAYFIELD COUNTY CITY OF WASHBURN WARDS 1-4 | 944 | 320 | 1283 | 1493 | 85.934360348292 | 73.5775526110678 | 24.9415432579891 | 4.1581192007984E-12 |
| BAYFIELD COUNTY TOWN OF BAYFIELD WARD 1 | 399 | 158 | 564 | 640 | 88.125 | 70.7446808510638 | 28.0141843971631 | 6.44035024538831E-10 |
| BAYFIELD COUNTY TOWN OF RUSSELL WARDS 1-2 | 601 | 91 | 699 | 912 | 76.6447368421053 | 85.9799713876967 | 13.0185979971388 | 7.1789626891056E-28 |
| BROWN COUNTY TOWN OF MORRISON WARDS 1-2 | 196 | 768 | 979 | 1112 | 88.0395683453237 | 20.0204290091931 | 78.4473953013279 | 5.20055002328544E-11 |
| COLUMBIA COUNTY TOWN OF RANDOLPH WARD 1 | 92 | 371 | 470 | 526 | 89.3536121673004 | 19.5744680851064 | 78.936170212766 | 1.49308448006707E-12 |
| DANE COUNTY CITY OF MADISON WARD 127 | 77 | 13 | 92 | 93 | 98.9247311827957 | 83.695652173913 | 14.1304347826087 | 6.39561194230751E-06 |
| DANE COUNTY CITY OF MADISON WARD 140 | 37 | 8 | 46 | 47 | 97.8723404255319 | 80.4347826086957 | 17.3913043478261 | 2.44340709557608E-05 |
| DANE COUNTY CITY OF MADISON WARD 48 | 659 | 148 | 819 | 1426 | 57.4333800841515 | 80.4639804639805 | 18.0708180708181 | 3.52762840567405E-10 |
| DANE COUNTY CITY OF MADISON WARD 49 | 1968 | 423 | 2427 | 4227 | 57.416607523066 | 81.0877626699629 | 17.4289245982695 | 3.68273621333911E-10 |
| DANE COUNTY CITY OF MADISON WARD 50 | 1462 | 238 | 1741 | 3074 | 56.6363044892648 | 83.9747271682941 | 13.6703044227455 | 1.25242937905889E-10 |
| DANE COUNTY CITY OF MADISON WARD 54 | 233 | 68 | 304 | 637 | 47.723704866562 | 76.6447368421053 | 22.3684210526316 | 5.70258703816946E-18 |
| DANE COUNTY CITY OF MADISON WARD 55 | 1346 | 270 | 1649 | 2939 | 56.1075195644777 | 81.6252274105518 | 16.3735597331716 | 5.509685735556E-11 |
| DANE COUNTY CITY OF MADISON WARD 56 | 655 | 195 | 866 | 1799 | 48.1378543635353 | 75.635103926097 | 22.5173210161663 | 9.6228505281742E-18 |
| DANE COUNTY CITY OF MADISON WARD 57 | 750 | 156 | 923 | 1791 | 51.535455053043 | 81.2567713976165 | 16.9014084507042 | 2.47205132607457E-14 |
| DANE COUNTY CITY OF MADISON WARD 58 | 341 | 58 | 406 | 760 | 53.4210526315789 | 83.9901477832512 | 14.2857142857143 | 7.30999920891661E-13 |
| DANE COUNTY CITY OF MADISON WARD 59 | 365 | 77 | 452 | 930 | 48.6021505376344 | 80.7522123893805 | 17.0353982300885 | 8.17744524385459E-17 |
| DANE COUNTY CITY OF SUN PRAIRIE WARDS 20-22,24-25,28 | 175 | 77 | 256 | 258 | 99.2248062015504 | 68.359375 | 30.078125 | 0.000158078462324593 |
| DOUGLAS COUNTY CITY OF SUPERIOR WARDS 17-19,30-32 | 1173 | 620 | 1856 | 2528 | 73.4177215189873 | 63.2004310344828 | 33.4051724137931 | 3.37051056052282E-11 |
| DOUGLAS COUNTY TOWN OF DAIRYLAND WARD 1 | 25 | 101 | 129 | 153 | 84.3137254901961 | 19.3798449612403 | 78.2945736434108 | 2.75440521379353E-13 |
| DUNN COUNTY CITY OF MENOMONIE WARD 6 | 353 | 257 | 620 | 831 | 74.6089049338147 | 56.9354838709677 | 41.4516129032258 | 4.75782477468469E-10 |
| DUNN COUNTY CITY OF MENOMONIE WARDS 3-4 | 523 | 369 | 919 | 1568 | 58.609693877551 | 56.9096844396083 | 40.1523394994559 | 1.08064146240878E-21 |
| DUNN COUNTY CITY OF MENOMONIE WARDS 5,7 | 361 | 279 | 673 | 1276 | 52.7429467084639 | 53.6404160475483 | 41.4561664190193 | 8.60680131606536E-27 |
| DUNN COUNTY CITY OF MENOMONIE WARDS 8-9 | 751 | 528 | 1308 | 1790 | 73.072625698324 | 57.4159021406728 | 40.3669724770642 | 5.1671988172534E-11 |
| EAU CLAIRE COUNTY CITY OF ALTOONA WARDS 12-16 | 16 | 11 | 27 | 26 | 103.846153846154 | 59.2592592592593 | 40.7407407407407 | 7.25926716445429E-07 |
| EAU CLAIRE COUNTY CITY OF EAU CLAIRE WARD 20 | 360 | 215 | 596 | 1246 | 47.8330658105939 | 60.4026845637584 | 36.0738255033557 | 6.79322707506469E-21 |
| EAU CLAIRE COUNTY CITY OF EAU CLAIRE WARD 5 | 451 | 209 | 679 | 1255 | 54.1035856573705 | 66.4212076583211 | 30.780559646539 | 3.54653273188261E-16 |
| EAU CLAIRE COUNTY CITY OF EAU CLAIRE WARD 6 | 535 | 186 | 743 | 1169 | 63.5585970915312 | 72.0053835800807 | 25.0336473755047 | 5.48820883152761E-11 |
| EAU CLAIRE COUNTY TOWN OF FAIRCHILD WARD 1 | 35 | 135 | 174 | 195 | 89.2307692307692 | 20.1149425287356 | 77.5862068965517 | 9.210877887475E-13 |
| EAU CLAIRE COUNTY TOWN OF WILSON WARD 1 | 49 | 172 | 223 | 257 | 86.7704280155642 | 21.9730941704036 | 77.1300448430493 | 1.18540801589859E-11 |
| FOND DU LAC COUNTY CITY OF FOND DU LAC WARD 1 | 360 | 424 | 788 | 988 | 79.7570850202429 | 45.6852791878173 | 53.8071065989848 | 6.79364522819134E-11 |
| FOND DU LAC COUNTY CITY OF FOND DU LAC WARD 11 | 310 | 298 | 618 | 810 | 76.2962962962963 | 50.1618122977346 | 48.2200647249191 | 2.55555808340175E-16 |
| FOND DU LAC COUNTY CITY OF FOND DU LAC WARD 13 | 309 | 322 | 649 | 809 | 80.2224969097651 | 47.6117103235747 | 49.6147919876733 | 1.11701213986908E-11 |
| FOND DU LAC COUNTY CITY OF FOND DU LAC WARD 16 | 338 | 351 | 698 | 830 | 84.0963855421687 | 48.4240687679083 | 50.2865329512894 | 2.97370363102557E-10 |
| FOND DU LAC COUNTY CITY OF FOND DU LAC WARD 17 | 114 | 104 | 222 | 262 | 84.7328244274809 | 51.3513513513513 | 46.8468468468468 | 5.93415306364651E-12 |
| FOND DU LAC COUNTY CITY OF FOND DU LAC WARD 19 | 336 | 371 | 721 | 879 | 82.0250284414107 | 46.6019417475728 | 51.4563106796116 | 4.52742910745579E-10 |
| FOND DU LAC COUNTY CITY OF FOND DU LAC WARD 2 | 329 | 316 | 659 | 830 | 79.3975903614458 | 49.9241274658574 | 47.9514415781487 | 1.15316292964617E-13 |
| FOND DU LAC COUNTY CITY OF FOND DU LAC WARD 5 | 683 | 661 | 1378 | 1626 | 84.7478474784748 | 49.5645863570392 | 47.9680696661829 | 9.37767055176873E-11 |
| FOND DU LAC COUNTY CITY OF FOND DU LAC WARD 9 | 341 | 326 | 679 | 885 | 76.7231638418079 | 50.220913107511 | 48.0117820324006 | 5.66905415025079E-16 |
| FOND DU LAC COUNTY CITY OF RIPON WARDS 4-6 | 415 | 403 | 829 | 1085 | 76.4055299539171 | 50.0603136308806 | 48.6127864897467 | 3.75104914617071E-16 |
| FOND DU LAC COUNTY CITY OF RIPON WARDS 9-11 | 540 | 592 | 1152 | 1396 | 82.5214899713467 | 46.875 | 51.3888888888889 | 5.52488291943727E-10 |
| FOREST COUNTY TOWN OF NASHVILLE WARD 2 | 131 | 54 | 186 | 250 | 74.4 | 70.4301075268817 | 29.0322580645161 | 5.58741907395928E-23 |
| GRANT COUNTY CITY OF PLATTEVILLE WARDS 5-6 | 335 | 294 | 662 | 1149 | 57.615317667537 | 50.6042296072508 | 44.4108761329305 | 3.46889241295325E-26 |
| GRANT COUNTY CITY OF PLATTEVILLE WARDS 7-9 | 855 | 625 | 1547 | 2129 | 72.6632221700329 | 55.2682611506141 | 40.4007756948933 | 1.43548705444654E-10 |
| GRANT COUNTY VILLAGE OF WOODMAN WARD 1 | 12 | 35 | 47 | 69 | 68.1159420289855 | 25.531914893617 | 74.468085106383 | 1.82801386794522E-13 |
| JACKSON COUNTY TOWN OF BEAR BLUFF WARD 1 | 11 | 89 | 100 | 108 | 92.5925925925926 | 11 | 89 | 1.36352878176187E-10 |
| JACKSON COUNTY TOWN OF KOMENSKY WARD 1 | 146 | 30 | 176 | 222 | 79.2792792792793 | 82.9545454545455 | 17.0454545454545 | 1.32889222362522E-25 |
| JEFFERSON COUNTY CITY OF WHITEWATER WARD 12 | 115 | 87 | 205 | 501 | 40.9181636726547 | 56.0975609756098 | 42.4390243902439 | 2.12872002012183E-42 |
| JEFFERSON COUNTY CITY OF WHITEWATER WARDS 10-11 | 351 | 223 | 590 | 758 | 77.8364116094987 | 59.4915254237288 | 37.7966101694915 | 2.13791245784257E-10 |
| JEFFERSON COUNTY VILLAGE OF CAMBRIDGE WARD 1 | 44 | 20 | 65 | 74 | 87.8378378378378 | 67.6923076923077 | 30.7692307692308 | 8.22755433390597E-15 |
| KENOSHA COUNTY CITY OF KENOSHA WARD 10 | 291 | 113 | 413 | 619 | 66.7205169628433 | 70.4600484261501 | 27.3607748184019 | 2.06776570315375E-10 |
| KENOSHA COUNTY CITY OF KENOSHA WARD 3 | 162 | 60 | 230 | 530 | 43.3962264150943 | 70.4347826086957 | 26.0869565217391 | 3.43956135655265E-34 |
| KENOSHA COUNTY CITY OF KENOSHA WARD 33 | 23 | 3 | 26 | 33 | 78.7878787878788 | 88.4615384615385 | 11.5384615384615 | 5.42133845876956E-13 |
| KENOSHA COUNTY CITY OF KENOSHA WARD 7 | 273 | 94 | 374 | 557 | 67.1454219030521 | 72.9946524064171 | 25.1336898395722 | 6.87529928579931E-11 |
| KEWAUNEE COUNTY CITY OF ALGOMA WARDS 1-6 | 825 | 819 | 1685 | 1980 | 85.1010101010101 | 48.9614243323442 | 48.6053412462908 | 9.13667635453448E-11 |
| LA CROSSE COUNTY CITY OF LA CROSSE WARD 11 | 200 | 144 | 349 | 614 | 56.8403908794788 | 57.3065902578797 | 41.2607449856734 | 4.45768797779824E-11 |
| LA CROSSE COUNTY CITY OF LA CROSSE WARD 8 | 518 | 398 | 936 | 2035 | 45.995085995086 | 55.3418803418803 | 42.5213675213675 | 3.353166809769E-20 |
| LANGLADE COUNTY CITY OF ANTIGO WARD 4 | 201 | 203 | 406 | 497 | 81.6901408450704 | 49.5073891625616 | 50 | 6.0338889427495E-11 |
| LANGLADE COUNTY CITY OF ANTIGO WARD 5 | 128 | 171 | 307 | 411 | 74.6958637469586 | 41.6938110749186 | 55.700325732899 | 4.05169423409582E-10 |
| MANITOWOC COUNTY CITY OF MANITOWOC WARDS 5-6 | 807 | 678 | 1520 | 1842 | 82.5190010857763 | 53.0921052631579 | 44.6052631578947 | 3.74295368009036E-12 |
| MANITOWOC COUNTY CITY OF MANITOWOC WARDS 7-8 | 498 | 540 | 1061 | 1371 | 77.3887673231218 | 46.9368520263902 | 50.8953817153629 | 2.85889433338131E-12 |
| MARATHON COUNTY CITY OF WAUSAU WARD 6 | 315 | 196 | 531 | 691 | 76.8451519536903 | 59.3220338983051 | 36.9114877589454 | 2.35008171069057E-11 |
| MARATHON COUNTY CITY OF WAUSAU WARD 8 | 279 | 208 | 500 | 712 | 70.2247191011236 | 55.8 | 41.6 | 1.41787361998521E-14 |
| MILWAUKEE COUNTY CITY OF CUDAHY WARDS 1-3 | 1225 | 729 | 1984 | 2433 | 81.5454171804357 | 61.7439516129032 | 36.7439516129032 | 7.55840876244649E-16 |
| MILWAUKEE COUNTY CITY OF CUDAHY WARDS 10-12 | 963 | 936 | 1924 | 2374 | 81.044650379107 | 50.051975051975 | 48.6486486486487 | 1.74595382047536E-23 |
| MILWAUKEE COUNTY CITY OF CUDAHY WARDS 13-15 | 1118 | 1050 | 2189 | 2633 | 83.1371059627801 | 51.0735495660119 | 47.9671082686158 | 1.04744228724223E-23 |
| MILWAUKEE COUNTY CITY OF CUDAHY WARDS 4-6 | 983 | 797 | 1819 | 2295 | 79.2592592592593 | 54.040681693238 | 43.8152831225948 | 9.06241072063201E-20 |
| MILWAUKEE COUNTY CITY OF CUDAHY WARDS 7-9 | 857 | 715 | 1595 | 2102 | 75.8801141769743 | 53.730407523511 | 44.8275862068966 | 8.54298236281862E-19 |
| MILWAUKEE COUNTY CITY OF FRANKLIN WARD 10 | 242 | 197 | 446 | 481 | 92.7234927234927 | 54.2600896860987 | 44.1704035874439 | 1.46465970777214E-27 |
| MILWAUKEE COUNTY CITY OF FRANKLIN WARD 11 | 540 | 653 | 1203 | 1354 | 88.8478581979321 | 44.8877805486284 | 54.2809642560266 | 4.20290665007461E-32 |
| MILWAUKEE COUNTY CITY OF FRANKLIN WARD 12 | 337 | 502 | 849 | 981 | 86.5443425076453 | 39.6937573616019 | 59.1283863368669 | 2.24476659505987E-35 |
| MILWAUKEE COUNTY CITY OF FRANKLIN WARD 13 | 552 | 635 | 1200 | 1344 | 89.2857142857143 | 46 | 52.9166666666667 | 1.90914119352679E-31 |
| MILWAUKEE COUNTY CITY OF FRANKLIN WARD 14 | 494 | 528 | 1033 | 1149 | 89.9042645778938 | 47.8218780251694 | 51.1132623426912 | 2.33294864294759E-30 |
| MILWAUKEE COUNTY CITY OF FRANKLIN WARD 15A | 209 | 330 | 543 | 650 | 83.5384615384615 | 38.4898710865562 | 60.7734806629834 | 7.5447895506994E-35 |
| MILWAUKEE COUNTY CITY OF FRANKLIN WARD 15B | 177 | 207 | 390 | 450 | 86.6666666666667 | 45.3846153846154 | 53.0769230769231 | 2.80359406780404E-30 |
| MILWAUKEE COUNTY CITY OF FRANKLIN WARD 16 | 528 | 692 | 1239 | 1387 | 89.3294881038212 | 42.6150121065375 | 55.8514931396287 | 1.90956073819003E-34 |
| MILWAUKEE COUNTY CITY OF FRANKLIN WARD 17 | 396 | 350 | 757 | 839 | 90.2264600715137 | 52.3117569352708 | 46.2351387054161 | 4.20442722572625E-27 |
| MILWAUKEE COUNTY CITY OF FRANKLIN WARD 18 | 212 | 256 | 472 | 517 | 91.2959381044487 | 44.9152542372881 | 54.2372881355932 | 8.35213158350655E-34 |
| MILWAUKEE COUNTY CITY OF FRANKLIN WARD 19 | 557 | 712 | 1279 | 1441 | 88.7578070784178 | 43.5496481626271 | 55.6684910086005 | 3.21836172741495E-33 |
| MILWAUKEE COUNTY CITY OF FRANKLIN WARD 2 | 631 | 878 | 1531 | 1668 | 91.7865707434053 | 41.2148922273024 | 57.3481384715872 | 1.68975552016341E-37 |
| MILWAUKEE COUNTY CITY OF FRANKLIN WARD 20 | 329 | 339 | 677 | 772 | 87.6943005181347 | 48.5967503692762 | 50.0738552437223 | 2.97205717497328E-28 |
| MILWAUKEE COUNTY CITY OF FRANKLIN WARD 21 | 174 | 127 | 311 | 402 | 77.363184079602 | 55.9485530546624 | 40.8360128617363 | 9.56678900628984E-18 |
| MILWAUKEE COUNTY CITY OF FRANKLIN WARD 22A | 317 | 396 | 718 | 803 | 89.4146948941469 | 44.150417827298 | 55.1532033426184 | 3.93357547643516E-33 |
| MILWAUKEE COUNTY CITY OF FRANKLIN WARD 22B | 280 | 386 | 677 | 739 | 91.6102841677943 | 41.3589364844904 | 57.0162481536189 | 3.12040163864428E-37 |
| MILWAUKEE COUNTY CITY OF FRANKLIN WARD 23 | 493 | 763 | 1275 | 1410 | 90.4255319148936 | 38.6666666666667 | 59.843137254902 | 6.22957831868089E-39 |
| MILWAUKEE COUNTY CITY OF FRANKLIN WARD 3 | 751 | 823 | 1598 | 1774 | 90.0789177001127 | 46.9962453066333 | 51.5018773466834 | 3.68125386891159E-31 |
| MILWAUKEE COUNTY CITY OF FRANKLIN WARD 4 | 321 | 470 | 798 | 951 | 83.9116719242902 | 40.2255639097744 | 58.8972431077694 | 2.2686537468804E-33 |
| MILWAUKEE COUNTY CITY OF FRANKLIN WARD 5 | 286 | 369 | 659 | 720 | 91.5277777777778 | 43.3990895295903 | 55.9939301972686 | 2.60219138859018E-35 |
| MILWAUKEE COUNTY CITY OF FRANKLIN WARD 6 | 495 | 582 | 1093 | 1222 | 89.443535188216 | 45.288197621226 | 53.2479414455627 | 3.67278895928314E-32 |
| MILWAUKEE COUNTY CITY OF FRANKLIN WARD 7 | 650 | 777 | 1437 | 1573 | 91.3541004450095 | 45.2331245650661 | 54.0709812108559 | 1.42346954750186E-33 |
| MILWAUKEE COUNTY CITY OF FRANKLIN WARD 8 | 553 | 428 | 1002 | 1172 | 85.4948805460751 | 55.189620758483 | 42.7145708582834 | 5.12738299716137E-22 |
| MILWAUKEE COUNTY CITY OF FRANKLIN WARD 9 | 522 | 469 | 1003 | 1154 | 86.9150779896014 | 52.0438683948156 | 46.7597208374875 | 4.17082445761439E-25 |
| MILWAUKEE COUNTY CITY OF GLENDALE WARD 8 | 356 | 172 | 529 | 592 | 89.3581081081081 | 67.296786389414 | 32.5141776937618 | 1.89068769493298E-17 |
| MILWAUKEE COUNTY CITY OF GLENDALE WARDS 1,7 | 984 | 347 | 1363 | 1555 | 87.6527331189711 | 72.1936903888481 | 25.4585473220836 | 3.16744713268672E-14 |
| MILWAUKEE COUNTY CITY OF GLENDALE WARDS 2,8S | 712 | 212 | 935 | 1076 | 86.8959107806692 | 76.1497326203208 | 22.6737967914439 | 2.28904788740795E-12 |
| MILWAUKEE COUNTY CITY OF GLENDALE WARDS 3,9 | 1053 | 459 | 1546 | 1764 | 87.6417233560091 | 68.111254851229 | 29.6895213454075 | 6.14813246126453E-16 |
| MILWAUKEE COUNTY CITY OF GLENDALE WARDS 4,10 | 1172 | 468 | 1657 | 1854 | 89.3743257820928 | 70.7302353651177 | 28.2438141219071 | 6.02930527494358E-16 |
| MILWAUKEE COUNTY CITY OF GLENDALE WARDS 5,11 | 934 | 357 | 1312 | 1480 | 88.6486486486487 | 71.1890243902439 | 27.2103658536585 | 2.86273338591949E-15 |
| MILWAUKEE COUNTY CITY OF GLENDALE WARDS 6,12 | 866 | 270 | 1153 | 1349 | 85.470719051149 | 75.1084128360798 | 23.417172593235 | 7.42416867151683E-12 |
| MILWAUKEE COUNTY CITY OF GREENFIELD WARD 1 | 576 | 438 | 1035 | 1261 | 82.0777160983346 | 55.6521739130435 | 42.3188405797101 | 6.75719273960832E-20 |
| MILWAUKEE COUNTY CITY OF GREENFIELD WARD 10 | 565 | 518 | 1102 | 1297 | 84.9653045489591 | 51.2704174228675 | 47.005444646098 | 1.54815447380789E-24 |
| MILWAUKEE COUNTY CITY OF GREENFIELD WARD 11 | 619 | 689 | 1323 | 1457 | 90.8030199039122 | 46.7876039304611 | 52.0786092214664 | 7.49110216197986E-32 |
| MILWAUKEE COUNTY CITY OF GREENFIELD WARD 12 | 609 | 767 | 1392 | 1576 | 88.3248730964467 | 43.75 | 55.1005747126437 | 9.38170717809966E-33 |
| MILWAUKEE COUNTY CITY OF GREENFIELD WARD 13 | 352 | 317 | 675 | 780 | 86.5384615384615 | 52.1481481481481 | 46.962962962963 | 8.46101282137081E-25 |
| MILWAUKEE COUNTY CITY OF GREENFIELD WARD 14 | 469 | 428 | 910 | 1124 | 80.9608540925267 | 51.5384615384615 | 47.032967032967 | 2.5923776457702E-22 |
| MILWAUKEE COUNTY CITY OF GREENFIELD WARD 15 | 431 | 467 | 912 | 1086 | 83.9779005524862 | 47.2587719298246 | 51.2061403508772 | 3.64452002818065E-27 |
| MILWAUKEE COUNTY CITY OF GREENFIELD WARD 16 | 182 | 200 | 385 | 475 | 81.0526315789474 | 47.2727272727273 | 51.9480519480519 | 1.03185649345929E-25 |
| MILWAUKEE COUNTY CITY OF GREENFIELD WARD 17 | 461 | 346 | 815 | 992 | 82.1572580645161 | 56.5644171779141 | 42.4539877300613 | 2.52239916433965E-19 |
| MILWAUKEE COUNTY CITY OF GREENFIELD WARD 18 | 426 | 448 | 888 | 1014 | 87.5739644970414 | 47.972972972973 | 50.4504504504504 | 1.11207447361166E-28 |
| MILWAUKEE COUNTY CITY OF GREENFIELD WARD 19 | 764 | 525 | 1298 | 1508 | 86.0742705570292 | 58.8597842835131 | 40.4468412942989 | 5.85375850169128E-20 |
| MILWAUKEE COUNTY CITY OF GREENFIELD WARD 2 | 445 | 447 | 903 | 1068 | 84.5505617977528 | 49.2801771871539 | 49.5016611295681 | 7.65010167785277E-26 |
| MILWAUKEE COUNTY CITY OF GREENFIELD WARD 20 | 685 | 665 | 1364 | 1590 | 85.7861635220126 | 50.2199413489736 | 48.7536656891496 | 8.26628576102177E-26 |
| MILWAUKEE COUNTY CITY OF GREENFIELD WARD 21 | 450 | 372 | 838 | 1027 | 81.5968841285297 | 53.6992840095465 | 44.3914081145585 | 5.02825498303287E-21 |
| MILWAUKEE COUNTY CITY OF GREENFIELD WARD 3 | 495 | 343 | 852 | 1071 | 79.5518207282913 | 58.0985915492958 | 40.2582159624413 | 3.60103037564101E-17 |
| MILWAUKEE COUNTY CITY OF GREENFIELD WARD 4 | 516 | 306 | 832 | 1100 | 75.6363636363636 | 62.0192307692308 | 36.7788461538462 | 1.96038822277719E-13 |
| MILWAUKEE COUNTY CITY OF GREENFIELD WARD 5 | 520 | 439 | 972 | 1211 | 80.2642444260941 | 53.4979423868313 | 45.1646090534979 | 1.42770280944536E-20 |
| MILWAUKEE COUNTY CITY OF GREENFIELD WARD 6 | 448 | 530 | 996 | 1143 | 87.1391076115486 | 44.9799196787149 | 53.2128514056225 | 6.42641640780174E-31 |
| MILWAUKEE COUNTY CITY OF GREENFIELD WARD 7 | 629 | 643 | 1296 | 1518 | 85.3754940711462 | 48.5339506172839 | 49.6141975308642 | 6.70730734893469E-27 |
| MILWAUKEE COUNTY CITY OF GREENFIELD WARD 8 | 612 | 504 | 1127 | 1361 | 82.8067597354886 | 54.3034605146406 | 44.7204968944099 | 3.49143853336436E-21 |
| MILWAUKEE COUNTY CITY OF GREENFIELD WARD 9 | 550 | 499 | 1065 | 1244 | 85.6109324758843 | 51.6431924882629 | 46.8544600938967 | 1.26351449266701E-24 |
| MILWAUKEE COUNTY CITY OF MILWAUKEE WARD 107 | 588 | 10 | 604 | 909 | 66.4466446644664 | 97.3509933774834 | 1.65562913907285 | 0.00607290997487753 |
| MILWAUKEE COUNTY CITY OF MILWAUKEE WARD 116 | 395 | 10 | 407 | 663 | 61.3876319758673 | 97.051597051597 | 2.45700245700246 | 0.00442900875815082 |
| MILWAUKEE COUNTY CITY OF MILWAUKEE WARD 130 | 267 | 78 | 352 | 928 | 37.9310344827586 | 75.8522727272727 | 22.1590909090909 | 5.06449448879178E-16 |
| MILWAUKEE COUNTY CITY OF MILWAUKEE WARD 132 | 1255 | 359 | 1633 | 1969 | 82.935500253936 | 76.852418860992 | 21.9840783833435 | 6.22621280143243E-10 |
| MILWAUKEE COUNTY CITY OF MILWAUKEE WARD 144 | 334 | 6 | 344 | 559 | 61.5384615384615 | 97.0930232558139 | 1.74418604651163 | 0.0045609717682438 |
| MILWAUKEE COUNTY CITY OF MILWAUKEE WARD 15 | 535 | 218 | 768 | 921 | 83.3876221498371 | 69.6614583333333 | 28.3854166666667 | 8.50493764715297E-13 |
| MILWAUKEE COUNTY CITY OF MILWAUKEE WARD 186 | 1795 | 696 | 2541 | 3271 | 77.6826658514216 | 70.6414797323888 | 27.3907910271547 | 6.8232933072707E-10 |
| MILWAUKEE COUNTY CITY OF MILWAUKEE WARD 191 | 399 | 141 | 550 | 1204 | 45.6810631229236 | 72.5454545454545 | 25.6363636363636 | 3.99914771473777E-12 |
| MILWAUKEE COUNTY CITY OF MILWAUKEE WARD 205 | 572 | 197 | 792 | 965 | 82.0725388601036 | 72.2222222222222 | 24.8737373737374 | 4.24373565136365E-11 |
| MILWAUKEE COUNTY CITY OF MILWAUKEE WARD 206 | 479 | 163 | 654 | 757 | 86.3936591809776 | 73.2415902140673 | 24.9235474006116 | 4.72113232055249E-13 |
| MILWAUKEE COUNTY CITY OF MILWAUKEE WARD 207 | 446 | 270 | 730 | 928 | 78.6637931034483 | 61.0958904109589 | 36.986301369863 | 5.36175276901475E-15 |
| MILWAUKEE COUNTY CITY OF MILWAUKEE WARD 208 | 512 | 302 | 834 | 1027 | 81.207400194742 | 61.3908872901679 | 36.21103117506 | 6.79004252066778E-16 |
| MILWAUKEE COUNTY CITY OF MILWAUKEE WARD 209 | 453 | 295 | 762 | 907 | 84.013230429989 | 59.4488188976378 | 38.7139107611549 | 1.95546986299735E-18 |
| MILWAUKEE COUNTY CITY OF MILWAUKEE WARD 210 | 355 | 315 | 689 | 921 | 74.8099891422367 | 51.5239477503628 | 45.7184325108853 | 4.27579491035909E-20 |
| MILWAUKEE COUNTY CITY OF MILWAUKEE WARD 211 | 461 | 285 | 770 | 998 | 77.1543086172345 | 59.8701298701299 | 37.012987012987 | 3.56231589937219E-15 |
| MILWAUKEE COUNTY CITY OF MILWAUKEE WARD 212 | 514 | 310 | 842 | 1123 | 74.9777382012467 | 61.0451306413302 | 36.8171021377672 | 8.4094687651029E-14 |
| MILWAUKEE COUNTY CITY OF MILWAUKEE WARD 213 | 569 | 294 | 883 | 1155 | 76.4502164502164 | 64.4394110985277 | 33.2955832389581 | 2.2623703277218E-12 |
| MILWAUKEE COUNTY CITY OF MILWAUKEE WARD 243 | 852 | 215 | 1083 | 1238 | 87.4798061389338 | 78.6703601108033 | 19.8522622345337 | 5.41723117940624E-12 |
| MILWAUKEE COUNTY CITY OF MILWAUKEE WARD 245 | 556 | 135 | 702 | 828 | 84.7826086956522 | 79.2022792022792 | 19.2307692307692 | 3.00331841376544E-10 |
| MILWAUKEE COUNTY CITY OF MILWAUKEE WARD 261 | 337 | 174 | 523 | 632 | 82.753164556962 | 64.4359464627151 | 33.2695984703633 | 5.82555622850465E-15 |
| MILWAUKEE COUNTY CITY OF MILWAUKEE WARD 262 | 665 | 388 | 1064 | 1305 | 81.5325670498084 | 62.5 | 36.4661654135338 | 2.04151668899336E-15 |
| MILWAUKEE COUNTY CITY OF MILWAUKEE WARD 263 | 374 | 199 | 579 | 757 | 76.4861294583884 | 64.594127806563 | 34.3696027633851 | 2.65171157727609E-12 |
| MILWAUKEE COUNTY CITY OF MILWAUKEE WARD 264 | 676 | 485 | 1185 | 1444 | 82.0637119113573 | 57.0464135021097 | 40.9282700421941 | 5.79902239092725E-19 |
| MILWAUKEE COUNTY CITY OF MILWAUKEE WARD 265 | 351 | 267 | 628 | 776 | 80.9278350515464 | 55.8917197452229 | 42.515923566879 | 3.34925682107936E-19 |
| MILWAUKEE COUNTY CITY OF MILWAUKEE WARD 266 | 340 | 360 | 721 | 900 | 80.1111111111111 | 47.1567267683773 | 49.9306518723994 | 2.13915754083083E-25 |
| MILWAUKEE COUNTY CITY OF MILWAUKEE WARD 267 | 362 | 285 | 657 | 792 | 82.9545454545455 | 55.0989345509893 | 43.37899543379 | 1.04876863667821E-20 |
| MILWAUKEE COUNTY CITY OF MILWAUKEE WARD 268 | 798 | 634 | 1452 | 1788 | 81.2080536912752 | 54.9586776859504 | 43.66391184573 | 5.79255390176922E-20 |
| MILWAUKEE COUNTY CITY OF MILWAUKEE WARD 269 | 451 | 388 | 857 | 1076 | 79.6468401486989 | 52.6254375729288 | 45.2742123687281 | 6.07513589006184E-21 |
| MILWAUKEE COUNTY CITY OF MILWAUKEE WARD 270 | 411 | 376 | 799 | 992 | 80.5443548387097 | 51.4392991239049 | 47.0588235294118 | 3.33979654311459E-22 |
| MILWAUKEE COUNTY CITY OF MILWAUKEE WARD 271 | 817 | 634 | 1472 | 1834 | 80.2617230098146 | 55.5027173913043 | 43.070652173913 | 3.58022181504136E-19 |
| MILWAUKEE COUNTY CITY OF MILWAUKEE WARD 272 | 512 | 567 | 1096 | 1266 | 86.5718799368089 | 46.7153284671533 | 51.7335766423358 | 4.28503366875072E-29 |
| MILWAUKEE COUNTY CITY OF MILWAUKEE WARD 273 | 313 | 290 | 610 | 719 | 84.8400556328234 | 51.3114754098361 | 47.5409836065574 | 1.95369959606737E-24 |
| MILWAUKEE COUNTY CITY OF MILWAUKEE WARD 274 | 296 | 297 | 610 | 763 | 79.9475753604194 | 48.5245901639344 | 48.6885245901639 | 3.26718700327756E-24 |
| MILWAUKEE COUNTY CITY OF MILWAUKEE WARD 275 | 772 | 633 | 1423 | 1854 | 76.7529665587918 | 54.2515811665495 | 44.4834855938159 | 1.05215494863984E-18 |
| MILWAUKEE COUNTY CITY OF MILWAUKEE WARD 276 | 672 | 600 | 1295 | 1527 | 84.8068107400131 | 51.8918918918919 | 46.3320463320463 | 5.54486888719382E-24 |
| MILWAUKEE COUNTY CITY OF MILWAUKEE WARD 277 | 688 | 602 | 1320 | 1640 | 80.4878048780488 | 52.1212121212121 | 45.6060606060606 | 1.1395279941763E-21 |
| MILWAUKEE COUNTY CITY OF MILWAUKEE WARD 278 | 370 | 359 | 740 | 916 | 80.7860262008734 | 50 | 48.5135135135135 | 2.07680960722687E-23 |
| MILWAUKEE COUNTY CITY OF MILWAUKEE WARD 279 | 573 | 445 | 1040 | 1265 | 82.2134387351779 | 55.0961538461539 | 42.7884615384615 | 2.42738130289664E-20 |
| MILWAUKEE COUNTY CITY OF MILWAUKEE WARD 280 | 1124 | 481 | 1630 | 2065 | 78.9346246973366 | 68.9570552147239 | 29.5092024539877 | 4.4239076774363E-11 |
| MILWAUKEE COUNTY CITY OF MILWAUKEE WARD 281 | 474 | 265 | 747 | 957 | 78.0564263322884 | 63.4538152610442 | 35.475234270415 | 1.89778550535121E-13 |
| MILWAUKEE COUNTY CITY OF MILWAUKEE WARD 283 | 473 | 252 | 736 | 983 | 74.8728382502543 | 64.2663043478261 | 34.2391304347826 | 5.45437704403475E-12 |
| MILWAUKEE COUNTY CITY OF MILWAUKEE WARD 286 | 277 | 136 | 420 | 580 | 72.4137931034483 | 65.9523809523809 | 32.3809523809524 | 1.56448201263501E-10 |
| MILWAUKEE COUNTY CITY OF MILWAUKEE WARD 287 | 331 | 141 | 483 | 597 | 80.9045226130653 | 68.5300207039337 | 29.1925465838509 | 4.2570324619449E-12 |
| MILWAUKEE COUNTY CITY OF MILWAUKEE WARD 288 | 673 | 386 | 1077 | 1350 | 79.7777777777778 | 62.4883936861653 | 35.8402971216342 | 1.19076439246385E-14 |
| MILWAUKEE COUNTY CITY OF MILWAUKEE WARD 292 | 428 | 198 | 632 | 797 | 79.297365119197 | 67.7215189873418 | 31.3291139240506 | 8.75090412574107E-12 |
| MILWAUKEE COUNTY CITY OF MILWAUKEE WARD 293 | 495 | 277 | 789 | 953 | 82.791185729276 | 62.7376425855513 | 35.1077313054499 | 6.82907019712108E-16 |
| MILWAUKEE COUNTY CITY OF MILWAUKEE WARD 294 | 418 | 191 | 621 | 733 | 84.7203274215553 | 67.3107890499195 | 30.7568438003221 | 1.43489007810167E-14 |
| MILWAUKEE COUNTY CITY OF MILWAUKEE WARD 295 | 541 | 191 | 750 | 931 | 80.5585392051557 | 72.1333333333333 | 25.4666666666667 | 1.9406997206457E-10 |
| MILWAUKEE COUNTY CITY OF MILWAUKEE WARD 296 | 671 | 288 | 982 | 1154 | 85.0953206239168 | 68.3299389002037 | 29.3279022403259 | 2.61839983551383E-14 |
| MILWAUKEE COUNTY CITY OF MILWAUKEE WARD 297 | 637 | 197 | 849 | 1021 | 83.1537708129285 | 75.0294464075383 | 23.2037691401649 | 1.26537229672712E-10 |
| MILWAUKEE COUNTY CITY OF MILWAUKEE WARD 298 | 542 | 162 | 723 | 856 | 84.4626168224299 | 74.9654218533887 | 22.4066390041494 | 2.44713694663658E-11 |
| MILWAUKEE COUNTY CITY OF MILWAUKEE WARD 299 | 653 | 249 | 921 | 1081 | 85.1988899167438 | 70.9011943539631 | 27.0358306188925 | 2.92696461989792E-13 |
| MILWAUKEE COUNTY CITY OF MILWAUKEE WARD 300 | 967 | 224 | 1215 | 1410 | 86.1702127659574 | 79.5884773662551 | 18.4362139917695 | 6.00326630881646E-11 |
| MILWAUKEE COUNTY CITY OF MILWAUKEE WARD 301 | 769 | 361 | 1153 | 1359 | 84.8417954378219 | 66.6955767562879 | 31.3096270598439 | 6.25191697293189E-15 |
| MILWAUKEE COUNTY CITY OF MILWAUKEE WARD 302 | 476 | 309 | 792 | 951 | 83.2807570977918 | 60.1010101010101 | 39.0151515151515 | 1.17316695988034E-17 |
| MILWAUKEE COUNTY CITY OF MILWAUKEE WARD 303 | 722 | 429 | 1172 | 1365 | 85.8608058608059 | 61.6040955631399 | 36.6040955631399 | 3.38458923045215E-18 |
| MILWAUKEE COUNTY CITY OF MILWAUKEE WARD 304 | 531 | 379 | 928 | 1165 | 79.656652360515 | 57.2198275862069 | 40.8405172413793 | 8.90270006142794E-18 |
| MILWAUKEE COUNTY CITY OF MILWAUKEE WARD 305 | 567 | 344 | 932 | 1159 | 80.4141501294219 | 60.8369098712446 | 36.9098712446352 | 7.29125476826321E-16 |
| MILWAUKEE COUNTY CITY OF MILWAUKEE WARD 306 | 476 | 215 | 700 | 931 | 75.187969924812 | 68 | 30.7142857142857 | 3.05481514364101E-10 |
| MILWAUKEE COUNTY CITY OF MILWAUKEE WARD 307 | 486 | 302 | 802 | 986 | 81.3387423935091 | 60.5985037406484 | 37.6558603491272 | 2.04179924025003E-16 |
| MILWAUKEE COUNTY CITY OF MILWAUKEE WARD 309 | 645 | 453 | 1114 | 1378 | 80.8417997097242 | 57.8994614003591 | 40.6642728904847 | 7.56341300405146E-18 |
| MILWAUKEE COUNTY CITY OF MILWAUKEE WARD 311 | 368 | 277 | 656 | 847 | 77.4498229043684 | 56.0975609756098 | 42.2256097560976 | 1.12321636456187E-17 |
| MILWAUKEE COUNTY CITY OF MILWAUKEE WARD 312 | 553 | 389 | 950 | 1077 | 88.2079851439183 | 58.2105263157895 | 40.9473684210526 | 1.07820265316607E-21 |
| MILWAUKEE COUNTY CITY OF MILWAUKEE WARD 313 | 950 | 762 | 1743 | 2182 | 79.8808432630614 | 54.5037292025244 | 43.7177280550775 | 1.06521933847579E-19 |
| MILWAUKEE COUNTY CITY OF MILWAUKEE WARD 314 | 347 | 320 | 680 | 812 | 83.743842364532 | 51.0294117647059 | 47.0588235294118 | 4.70010708286927E-24 |
| MILWAUKEE COUNTY CITY OF MILWAUKEE WARD 315 | 466 | 436 | 916 | 1604 | 57.1072319201995 | 50.8733624454148 | 47.5982532751092 | 4.13471102377506E-20 |
| MILWAUKEE COUNTY CITY OF MILWAUKEE WARD 316 | 373 | 370 | 750 | 925 | 81.0810810810811 | 49.7333333333333 | 49.3333333333333 | 9.49352292125111E-24 |
| MILWAUKEE COUNTY CITY OF MILWAUKEE WARD 317 | 533 | 352 | 901 | 1087 | 82.8886844526219 | 59.1564927857936 | 39.0677025527192 | 4.96013279980341E-18 |
| MILWAUKEE COUNTY CITY OF MILWAUKEE WARD 33 | 1324 | 684 | 2039 | 2510 | 81.2350597609562 | 64.9337910740559 | 33.5458558116724 | 5.60180949248076E-14 |
| MILWAUKEE COUNTY CITY OF MILWAUKEE WARD 81 | 384 | 230 | 632 | 779 | 81.1296534017972 | 60.7594936708861 | 36.3924050632911 | 3.1634316099815E-16 |
| MILWAUKEE COUNTY CITY OF MILWAUKEE WARD 82 | 528 | 301 | 843 | 975 | 86.4615384615385 | 62.6334519572954 | 35.70581257414 | 5.64360612254358E-18 |
| MILWAUKEE COUNTY CITY OF MILWAUKEE WARD 83 | 662 | 323 | 1009 | 1222 | 82.569558101473 | 65.609514370664 | 32.01189296333 | 2.86383247830138E-14 |
| MILWAUKEE COUNTY CITY OF MILWAUKEE WARD 84 | 465 | 224 | 710 | 867 | 81.8915801614764 | 65.4929577464789 | 31.5492957746479 | 5.33119079644663E-14 |
| MILWAUKEE COUNTY CITY OF MILWAUKEE WARD 85 | 623 | 302 | 945 | 1146 | 82.4607329842932 | 65.9259259259259 | 31.957671957672 | 4.65866813999447E-14 |
| MILWAUKEE COUNTY CITY OF MILWAUKEE WARD 86 | 629 | 274 | 926 | 1110 | 83.4234234234234 | 67.92656587473 | 29.5896328293737 | 1.37729902611045E-13 |
| MILWAUKEE COUNTY CITY OF MILWAUKEE WARD 87 | 434 | 150 | 593 | 729 | 81.3443072702332 | 73.1871838111299 | 25.2951096121417 | 2.15106739253755E-10 |
| MILWAUKEE COUNTY CITY OF MILWAUKEE WARD 88 | 605 | 183 | 804 | 964 | 83.402489626556 | 75.2487562189055 | 22.7611940298507 | 1.11543465562254E-10 |
| MILWAUKEE COUNTY CITY OF MILWAUKEE WARD 93 | 495 | 170 | 676 | 790 | 85.5696202531646 | 73.2248520710059 | 25.1479289940828 | 1.42556748420486E-12 |
| MILWAUKEE COUNTY CITY OF OAK CREEK WARDS 1-3 | 1701 | 1744 | 3522 | 4009 | 87.852332252432 | 48.2964224872232 | 49.5173197047132 | 1.34995380021904E-28 |
| MILWAUKEE COUNTY CITY OF OAK CREEK WARDS 10-12 | 1596 | 2090 | 3758 | 4268 | 88.0506091846298 | 42.4693986162853 | 55.6146886641831 | 1.00089661325203E-33 |
| MILWAUKEE COUNTY CITY OF OAK CREEK WARDS 13-15 | 1559 | 2056 | 3664 | 4075 | 89.9141104294479 | 42.5491266375546 | 56.1135371179039 | 6.55292766071753E-35 |
| MILWAUKEE COUNTY CITY OF OAK CREEK WARDS 16-19 | 1565 | 1307 | 2929 | 3521 | 83.1865947174098 | 53.4312051894845 | 44.6227381358826 | 5.40429558312339E-22 |
| MILWAUKEE COUNTY CITY OF OAK CREEK WARDS 4-6 | 1777 | 1607 | 3453 | 4087 | 84.4873990702227 | 51.4624963799595 | 46.5392412395019 | 3.97596480799759E-24 |
| MILWAUKEE COUNTY CITY OF OAK CREEK WARDS 7-9 | 1652 | 1758 | 3461 | 3954 | 87.5316135558928 | 47.731869401907 | 50.7945680439179 | 7.52545559662631E-29 |
| MILWAUKEE COUNTY CITY OF SOUTH MILWAUKEE WARDS 1-4 | 1502 | 1252 | 2824 | 3348 | 84.3488649940263 | 53.1869688385269 | 44.3342776203966 | 8.79048436758186E-23 |
| MILWAUKEE COUNTY CITY OF SOUTH MILWAUKEE WARDS 13-16 | 1354 | 1345 | 2753 | 3303 | 83.3484710868907 | 49.1827097711587 | 48.8557936796222 | 2.79916556081515E-25 |
| MILWAUKEE COUNTY CITY OF SOUTH MILWAUKEE WARDS 5-8 | 1240 | 1179 | 2464 | 3013 | 81.7789578493196 | 50.3246753246753 | 47.849025974026 | 1.3006965302369E-23 |
| MILWAUKEE COUNTY CITY OF SOUTH MILWAUKEE WARDS 9-12 | 1543 | 1570 | 3154 | 3679 | 85.7298178852949 | 48.9220038046925 | 49.7780596068484 | 8.55077535471153E-27 |
| MILWAUKEE COUNTY CITY OF ST. FRANCIS WARDS 1-4 | 966 | 688 | 1688 | 2022 | 83.4817012858556 | 57.2274881516588 | 40.7582938388626 | 1.48833787683868E-19 |
| MILWAUKEE COUNTY CITY OF ST. FRANCIS WARDS 5-8 | 1045 | 742 | 1818 | 2111 | 86.120322122217 | 57.4807480748075 | 40.8140814081408 | 7.37392790023734E-21 |
| MILWAUKEE COUNTY CITY OF ST. FRANCIS WARDS 9-12 | 1370 | 807 | 2206 | 2541 | 86.8162140889414 | 62.1033544877607 | 36.5820489573889 | 1.73670652459223E-18 |
| MILWAUKEE COUNTY CITY OF WAUWATOSA WARD 1 | 935 | 352 | 1313 | 1461 | 89.8699520876112 | 71.2109672505712 | 26.8088347296268 | 4.29199717483575E-16 |
| MILWAUKEE COUNTY CITY OF WAUWATOSA WARD 10 | 1009 | 379 | 1425 | 1682 | 84.7205707491082 | 70.8070175438597 | 26.5964912280702 | 4.96976046265056E-13 |
| MILWAUKEE COUNTY CITY OF WAUWATOSA WARD 11 | 942 | 370 | 1335 | 1541 | 86.6320571057755 | 70.561797752809 | 27.7153558052434 | 3.04969908063255E-14 |
| MILWAUKEE COUNTY CITY OF WAUWATOSA WARD 12 | 1009 | 540 | 1578 | 1743 | 90.5335628227194 | 63.9416983523447 | 34.2205323193916 | 5.90182535799617E-20 |
| MILWAUKEE COUNTY CITY OF WAUWATOSA WARD 13 | 538 | 175 | 734 | 852 | 86.150234741784 | 73.2970027247956 | 23.841961852861 | 6.91680405682294E-13 |
| MILWAUKEE COUNTY CITY OF WAUWATOSA WARD 14 | 1019 | 333 | 1386 | 1599 | 86.6791744840525 | 73.5209235209235 | 24.025974025974 | 4.00745124345971E-13 |
| MILWAUKEE COUNTY CITY OF WAUWATOSA WARD 15 | 1128 | 325 | 1487 | 1701 | 87.419165196943 | 75.857431069267 | 21.8560860793544 | 8.72613807561488E-13 |
| MILWAUKEE COUNTY CITY OF WAUWATOSA WARD 16 | 1056 | 489 | 1590 | 1753 | 90.7016543069025 | 66.4150943396226 | 30.7547169811321 | 8.10244077319936E-19 |
| MILWAUKEE COUNTY CITY OF WAUWATOSA WARD 17 | 796 | 527 | 1349 | 1485 | 90.8417508417509 | 59.006671608599 | 39.0659747961453 | 5.17912850085271E-23 |
| MILWAUKEE COUNTY CITY OF WAUWATOSA WARD 18 | 756 | 369 | 1137 | 1345 | 84.5353159851301 | 66.490765171504 | 32.4538258575198 | 7.35436406286319E-15 |
| MILWAUKEE COUNTY CITY OF WAUWATOSA WARD 19 | 836 | 455 | 1315 | 1527 | 86.1165684348396 | 63.574144486692 | 34.6007604562738 | 2.95934324139749E-17 |
| MILWAUKEE COUNTY CITY OF WAUWATOSA WARD 2 | 1006 | 298 | 1321 | 1505 | 87.7740863787375 | 76.1544284632854 | 22.558667676003 | 6.45221760442866E-13 |
| MILWAUKEE COUNTY CITY OF WAUWATOSA WARD 20 | 998 | 686 | 1716 | 1990 | 86.2311557788945 | 58.1585081585082 | 39.97668997669 | 1.71666108579506E-20 |
| MILWAUKEE COUNTY CITY OF WAUWATOSA WARD 21 | 683 | 459 | 1167 | 1350 | 86.4444444444444 | 58.5261353898886 | 39.3316195372751 | 2.17866869555251E-20 |
| MILWAUKEE COUNTY CITY OF WAUWATOSA WARD 22 | 859 | 484 | 1377 | 1552 | 88.7242268041237 | 62.3819898329702 | 35.1488743645606 | 1.49463701960189E-19 |
| MILWAUKEE COUNTY CITY OF WAUWATOSA WARD 23 | 668 | 519 | 1215 | 1384 | 87.7890173410405 | 54.9794238683128 | 42.7160493827161 | 1.47783902838351E-23 |
| MILWAUKEE COUNTY CITY OF WAUWATOSA WARD 24 | 702 | 338 | 1058 | 1276 | 82.9153605015674 | 66.351606805293 | 31.9470699432892 | 4.48324575884219E-14 |
| MILWAUKEE COUNTY CITY OF WAUWATOSA WARD 3 | 981 | 401 | 1404 | 1625 | 86.4 | 69.8717948717949 | 28.5612535612536 | 2.16209341470747E-14 |
| MILWAUKEE COUNTY CITY OF WAUWATOSA WARD 4 | 1264 | 589 | 1896 | 2116 | 89.6030245746692 | 66.6666666666667 | 31.0654008438819 | 6.41887343588786E-18 |
| MILWAUKEE COUNTY CITY OF WAUWATOSA WARD 5 | 747 | 333 | 1095 | 1331 | 82.2689706987228 | 68.2191780821918 | 30.4109589041096 | 7.11539536094584E-13 |
| MILWAUKEE COUNTY CITY OF WAUWATOSA WARD 6 | 733 | 267 | 1019 | 1213 | 84.0065952184666 | 71.9332679097154 | 26.2021589793916 | 3.42786865328096E-12 |
| MILWAUKEE COUNTY CITY OF WAUWATOSA WARD 7 | 1020 | 509 | 1564 | 1777 | 88.0135059088351 | 65.2173913043478 | 32.5447570332481 | 1.42365789266778E-17 |
| MILWAUKEE COUNTY CITY OF WAUWATOSA WARD 8 | 414 | 276 | 698 | 853 | 81.8288393903869 | 59.3123209169054 | 39.541547277937 | 2.03410688133861E-17 |
| MILWAUKEE COUNTY CITY OF WAUWATOSA WARD 9 | 783 | 631 | 1447 | 1698 | 85.2179034157833 | 54.1119557705598 | 43.6074637180373 | 1.31727251710136E-22 |
| MILWAUKEE COUNTY CITY OF WEST ALLIS WARD 1 | 552 | 302 | 875 | 1165 | 75.107296137339 | 63.0857142857143 | 34.5142857142857 | 1.09341656007839E-12 |
| MILWAUKEE COUNTY CITY OF WEST ALLIS WARD 10 | 671 | 414 | 1107 | 1453 | 76.18719889883 | 60.6142728093948 | 37.3983739837398 | 2.05397477403839E-14 |
| MILWAUKEE COUNTY CITY OF WEST ALLIS WARD 11 | 702 | 679 | 1402 | 1726 | 81.2282734646582 | 50.0713266761769 | 48.4308131241084 | 1.49191405531741E-23 |
| MILWAUKEE COUNTY CITY OF WEST ALLIS WARD 12 | 582 | 663 | 1265 | 1554 | 81.4028314028314 | 46.0079051383399 | 52.4110671936759 | 6.25448622497098E-27 |
| MILWAUKEE COUNTY CITY OF WEST ALLIS WARD 13 | 843 | 829 | 1715 | 2012 | 85.2385685884692 | 49.1545189504373 | 48.3381924198251 | 2.50898219645981E-26 |
| MILWAUKEE COUNTY CITY OF WEST ALLIS WARD 14 | 531 | 355 | 906 | 1204 | 75.2491694352159 | 58.6092715231788 | 39.1832229580574 | 2.38701616746422E-15 |
| MILWAUKEE COUNTY CITY OF WEST ALLIS WARD 15 | 527 | 434 | 987 | 1264 | 78.0854430379747 | 53.3941236068896 | 43.9716312056738 | 8.88322217068542E-20 |
| MILWAUKEE COUNTY CITY OF WEST ALLIS WARD 16 | 496 | 473 | 996 | 1249 | 79.7437950360288 | 49.7991967871486 | 47.4899598393574 | 4.05804724716096E-23 |
| MILWAUKEE COUNTY CITY OF WEST ALLIS WARD 17 | 680 | 641 | 1348 | 1668 | 80.8153477218225 | 50.4451038575668 | 47.5519287833828 | 4.45060932552017E-23 |
| MILWAUKEE COUNTY CITY OF WEST ALLIS WARD 18 | 754 | 771 | 1550 | 1882 | 82.3591923485654 | 48.6451612903226 | 49.741935483871 | 3.27839997095381E-25 |
| MILWAUKEE COUNTY CITY OF WEST ALLIS WARD 19 | 736 | 649 | 1413 | 1707 | 82.7768014059754 | 52.0877565463553 | 45.930644019816 | 9.1547815357996E-23 |
| MILWAUKEE COUNTY CITY OF WEST ALLIS WARD 2 | 838 | 365 | 1223 | 1619 | 75.5404570722668 | 68.5200327064595 | 29.8446443172527 | 4.15549638821068E-10 |
| MILWAUKEE COUNTY CITY OF WEST ALLIS WARD 20 | 559 | 453 | 1025 | 1242 | 82.5281803542673 | 54.5365853658537 | 44.1951219512195 | 6.98704542708123E-21 |
| MILWAUKEE COUNTY CITY OF WEST ALLIS WARD 21 | 683 | 572 | 1279 | 1609 | 79.4903666873835 | 53.4010946051603 | 44.7224394057858 | 2.56434663338589E-20 |
| MILWAUKEE COUNTY CITY OF WEST ALLIS WARD 22 | 566 | 410 | 990 | 1288 | 76.8633540372671 | 57.1717171717172 | 41.4141414141414 | 9.11106723907263E-17 |
| MILWAUKEE COUNTY CITY OF WEST ALLIS WARD 23 | 686 | 730 | 1440 | 1739 | 82.8062104657849 | 47.6388888888889 | 50.6944444444444 | 3.01938597867455E-26 |
| MILWAUKEE COUNTY CITY OF WEST ALLIS WARD 24 | 552 | 357 | 922 | 1199 | 76.8974145120934 | 59.8698481561822 | 38.7201735357918 | 4.34927337209287E-15 |
| MILWAUKEE COUNTY CITY OF WEST ALLIS WARD 25 | 654 | 686 | 1365 | 1579 | 86.4471184293857 | 47.9120879120879 | 50.2564102564103 | 4.94212313828082E-28 |
| MILWAUKEE COUNTY CITY OF WEST ALLIS WARD 3 | 523 | 280 | 828 | 1103 | 75.0679963735267 | 63.1642512077295 | 33.8164251207729 | 1.2380705237555E-12 |
| MILWAUKEE COUNTY CITY OF WEST ALLIS WARD 4 | 714 | 488 | 1225 | 1565 | 78.2747603833866 | 58.2857142857143 | 39.8367346938776 | 1.49370039073485E-16 |
| MILWAUKEE COUNTY CITY OF WEST ALLIS WARD 5 | 585 | 401 | 1000 | 1276 | 78.3699059561128 | 58.5 | 40.1 | 1.87650274487038E-16 |
| MILWAUKEE COUNTY CITY OF WEST ALLIS WARD 6 | 490 | 399 | 916 | 1230 | 74.4715447154472 | 53.4934497816594 | 43.5589519650655 | 1.46418702181846E-18 |
| MILWAUKEE COUNTY CITY OF WEST ALLIS WARD 7 | 675 | 470 | 1175 | 1534 | 76.5971316818774 | 57.4468085106383 | 40 | 1.68103981731446E-16 |
| MILWAUKEE COUNTY CITY OF WEST ALLIS WARD 8 | 565 | 337 | 925 | 1231 | 75.1421608448416 | 61.0810810810811 | 36.4324324324324 | 7.92817234717319E-14 |
| MILWAUKEE COUNTY CITY OF WEST ALLIS WARD 9 | 735 | 523 | 1280 | 1653 | 77.4349667271627 | 57.421875 | 40.859375 | 8.44200178825207E-17 |
| MILWAUKEE COUNTY VILLAGE OF BAYSIDE WARD 5 | 508 | 192 | 706 | 779 | 90.6290115532734 | 71.9546742209632 | 27.1954674220963 | 2.44456563873148E-16 |
| MILWAUKEE COUNTY VILLAGE OF BAYSIDE WARDS 1,3 | 719 | 323 | 1049 | 1242 | 84.4605475040258 | 68.5414680648236 | 30.791229742612 | 7.3531014466122E-14 |
| MILWAUKEE COUNTY VILLAGE OF BAYSIDE WARDS 1S,3S | 47 | 24 | 71 | 75 | 94.6666666666667 | 66.1971830985916 | 33.8028169014084 | 5.20072614807201E-22 |
| MILWAUKEE COUNTY VILLAGE OF BAYSIDE WARDS 2,4 | 911 | 327 | 1254 | 1416 | 88.5593220338983 | 72.6475279106858 | 26.0765550239234 | 1.21537753246468E-14 |
| MILWAUKEE COUNTY VILLAGE OF BROWN DEER WARDS 1-2 | 1891 | 553 | 2488 | 2949 | 84.3675822312648 | 76.0048231511254 | 22.2266881028939 | 6.03006145464191E-11 |
| MILWAUKEE COUNTY VILLAGE OF BROWN DEER WARDS 3-4 | 1684 | 772 | 2490 | 2892 | 86.0995850622407 | 67.6305220883534 | 31.004016064257 | 3.2746666274357E-15 |
| MILWAUKEE COUNTY VILLAGE OF BROWN DEER WARDS 5-6 | 1749 | 686 | 2477 | 2925 | 84.6837606837607 | 70.6096083972547 | 27.6947920872023 | 4.32055702907867E-13 |
| MILWAUKEE COUNTY VILLAGE OF FOX POINT WARDS 1-4 | 1533 | 641 | 2201 | 2468 | 89.1815235008104 | 69.6501590186279 | 29.1231258518855 | 2.8694532937401E-16 |
| MILWAUKEE COUNTY VILLAGE OF FOX POINT WARDS 5-9 | 1959 | 788 | 2786 | 3098 | 89.9289864428664 | 70.3158650394831 | 28.2842785355348 | 1.67529969347659E-16 |
| MILWAUKEE COUNTY VILLAGE OF GREENDALE WARDS 1-2 | 824 | 916 | 1765 | 1954 | 90.3275332650972 | 46.685552407932 | 51.8980169971671 | 1.35248528592402E-31 |
| MILWAUKEE COUNTY VILLAGE OF GREENDALE WARDS 3-4 | 1061 | 904 | 2007 | 2324 | 86.3597246127367 | 52.8649725959143 | 45.0423517688092 | 3.63389937076315E-24 |
| MILWAUKEE COUNTY VILLAGE OF GREENDALE WARDS 5-6 | 912 | 845 | 1782 | 2030 | 87.7832512315271 | 51.1784511784512 | 47.4186307519641 | 2.67310357712138E-26 |
| MILWAUKEE COUNTY VILLAGE OF GREENDALE WARDS 7-8 | 900 | 824 | 1756 | 1990 | 88.2412060301507 | 51.25284738041 | 46.9248291571754 | 1.53793346484194E-26 |
| MILWAUKEE COUNTY VILLAGE OF GREENDALE WARDS 9-10 | 1087 | 1024 | 2127 | 2409 | 88.293897882939 | 51.1048425011754 | 48.142924306535 | 1.0979100727427E-26 |
| MILWAUKEE COUNTY VILLAGE OF HALES CORNERS WARDS 1-3 | 726 | 878 | 1637 | 1877 | 87.2136387852957 | 44.3494196701283 | 53.6346976175932 | 1.63033371187735E-31 |
| MILWAUKEE COUNTY VILLAGE OF HALES CORNERS WARDS 4-6 | 751 | 829 | 1603 | 1860 | 86.1827956989247 | 46.849656893325 | 51.715533374922 | 9.50129837887944E-29 |
| MILWAUKEE COUNTY VILLAGE OF HALES CORNERS WARDS 7-9 | 763 | 772 | 1552 | 1763 | 88.0317640385706 | 49.1623711340206 | 49.7422680412371 | 5.09051745202475E-28 |
| MILWAUKEE COUNTY VILLAGE OF RIVER HILLS WARDS 1-3 | 715 | 535 | 1259 | 1413 | 89.101203113942 | 56.791104050834 | 42.4940428911835 | 3.34151147982707E-23 |
| MILWAUKEE COUNTY VILLAGE OF SHOREWOOD WARDS 1-4 | 2851 | 606 | 3509 | 4079 | 86.0259867614611 | 81.2482188657737 | 17.2698774579652 | 1.82789251970963E-10 |
| MILWAUKEE COUNTY VILLAGE OF SHOREWOOD WARDS 5-8 | 2460 | 435 | 2939 | 3365 | 87.3402674591382 | 83.701939435182 | 14.8009527050017 | 9.12181429933463E-11 |
| MILWAUKEE COUNTY VILLAGE OF SHOREWOOD WARDS 9-12 | 2389 | 419 | 2845 | 3236 | 87.9171817058096 | 83.9718804920914 | 14.7275922671353 | 4.38025974823043E-11 |
| MILWAUKEE COUNTY VILLAGE OF WEST MILWAUKEE WARDS 1-2,5 | 519 | 249 | 781 | 1075 | 72.6511627906977 | 66.4532650448143 | 31.8822023047375 | 2.45436618393263E-10 |
| MILWAUKEE COUNTY VILLAGE OF WEST MILWAUKEE WARDS 3-4,6 | 611 | 290 | 920 | 1168 | 78.7671232876712 | 66.4130434782609 | 31.5217391304348 | 3.38065145202773E-12 |
| MILWAUKEE COUNTY VILLAGE OF WHITEFISH BAY WARD 12 | 667 | 310 | 997 | 1084 | 91.9741697416974 | 66.900702106319 | 31.0932798395186 | 1.58783909593186E-19 |
| MILWAUKEE COUNTY VILLAGE OF WHITEFISH BAY WARD 7 | 614 | 208 | 833 | 942 | 88.4288747346072 | 73.7094837935174 | 24.9699879951981 | 3.64155504598521E-14 |
| MILWAUKEE COUNTY VILLAGE OF WHITEFISH BAY WARDS 1-2 | 1044 | 550 | 1614 | 1787 | 90.3189703413542 | 64.6840148698885 | 34.0768277571252 | 2.05819451025194E-19 |
| MILWAUKEE COUNTY VILLAGE OF WHITEFISH BAY WARDS 3-4 | 1052 | 437 | 1508 | 1674 | 90.0836320191159 | 69.7612732095491 | 28.9787798408488 | 7.59867496717096E-17 |
| MILWAUKEE COUNTY VILLAGE OF WHITEFISH BAY WARDS 5-6 | 1148 | 501 | 1668 | 1875 | 88.96 | 68.8249400479616 | 30.0359712230216 | 1.76565509275726E-16 |
| MILWAUKEE COUNTY VILLAGE OF WHITEFISH BAY WARDS 8,10 | 1344 | 483 | 1844 | 2064 | 89.3410852713178 | 72.885032537961 | 26.1930585683297 | 4.439862753817E-15 |
| MILWAUKEE COUNTY VILLAGE OF WHITEFISH BAY WARDS 9,11 | 1211 | 378 | 1615 | 1871 | 86.3174772848744 | 74.984520123839 | 23.405572755418 | 2.1467920231762E-12 |
| MONROE COUNTY VILLAGE OF WILTON WARD 1 | 123 | 122 | 247 | 311 | 79.4212218649518 | 49.7975708502024 | 49.3927125506073 | 1.20704010552853E-10 |
| OUTAGAMIE COUNTY CITY OF APPLETON WARD 8 | 663 | 144 | 820 | 1415 | 57.9505300353357 | 80.8536585365854 | 17.5609756097561 | 1.45780801269311E-21 |
| OZAUKEE COUNTY TOWN OF FREDONIA WARDS 1-4 | 284 | 1073 | 1380 | 1542 | 89.4941634241245 | 20.5797101449275 | 77.7536231884058 | 1.38655200184393E-14 |
| OZAUKEE COUNTY VILLAGE OF BAYSIDE WARD 6 | 59 | 33 | 93 | 94 | 98.936170212766 | 63.4408602150538 | 35.4838709677419 | 2.00129596830969E-11 |
| OZAUKEE COUNTY VILLAGE OF NEWBURG WARD 3 | 9 | 46 | 55 | 60 | 91.6666666666667 | 16.3636363636364 | 83.6363636363636 | 5.63503296502046E-19 |
| PIERCE COUNTY CITY OF RIVER FALLS WARDS 12-14 | 932 | 724 | 1712 | 2223 | 77.0130454340981 | 54.4392523364486 | 42.2897196261682 | 5.61509915169131E-11 |
| PIERCE COUNTY CITY OF RIVER FALLS WARDS 6-8 | 1260 | 770 | 2092 | 2613 | 80.0612323000383 | 60.2294455066922 | 36.8068833652008 | 5.8496683463879E-13 |
| PIERCE COUNTY CITY OF RIVER FALLS WARDS 9-11 | 665 | 537 | 1264 | 1923 | 65.730629225169 | 52.6107594936709 | 42.4841772151899 | 1.09797839673096E-20 |
| POLK COUNTY CITY OF ST. CROIX FALLS WARDS 1-4 | 635 | 621 | 1278 | 1560 | 81.9230769230769 | 49.6870109546166 | 48.5915492957746 | 4.87553890759147E-10 |
| PORTAGE COUNTY CITY OF STEVENS POINT WARDS 1-3 | 718 | 306 | 1065 | 1435 | 74.2160278745645 | 67.4178403755869 | 28.7323943661972 | 5.75731642041891E-16 |
| PORTAGE COUNTY CITY OF STEVENS POINT WARDS 10-12 | 707 | 375 | 1113 | 1404 | 79.2735042735043 | 63.5220125786163 | 33.6927223719677 | 3.13559487680873E-11 |
| PORTAGE COUNTY CITY OF STEVENS POINT WARDS 13-15 | 820 | 393 | 1252 | 1549 | 80.8263395739187 | 65.4952076677316 | 31.3897763578275 | 1.05043079569372E-11 |
| PORTAGE COUNTY CITY OF STEVENS POINT WARDS 31-33 | 474 | 244 | 747 | 1112 | 67.1762589928058 | 63.4538152610442 | 32.6639892904953 | 3.85556315207787E-19 |
| PORTAGE COUNTY CITY OF STEVENS POINT WARDS 4-6 | 569 | 245 | 841 | 1248 | 67.3878205128205 | 67.6575505350773 | 29.1319857312723 | 2.78068480164296E-21 |
| PORTAGE COUNTY CITY OF STEVENS POINT WARDS 7-9 | 512 | 207 | 743 | 1149 | 64.6649260226284 | 68.9098250336474 | 27.8600269179004 | 1.19090420839269E-24 |
| RACINE COUNTY CITY OF RACINE WARD 18 | 325 | 35 | 363 | 596 | 60.9060402684564 | 89.5316804407714 | 9.64187327823691 | 1.61620200534854E-18 |
| RACINE COUNTY CITY OF RACINE WARD 19 | 269 | 47 | 321 | 522 | 61.4942528735632 | 83.8006230529595 | 14.6417445482866 | 1.45532182383773E-15 |
| RACINE COUNTY CITY OF RACINE WARD 2 | 536 | 98 | 644 | 1007 | 63.9523336643495 | 83.2298136645963 | 15.2173913043478 | 1.42908976350886E-13 |
| RACINE COUNTY CITY OF RACINE WARD 4 | 516 | 49 | 569 | 859 | 66.2398137369034 | 90.6854130052724 | 8.6115992970123 | 2.22596252082422E-15 |
| RACINE COUNTY CITY OF RACINE WARD 5 | 414 | 43 | 463 | 664 | 69.7289156626506 | 89.4168466522678 | 9.28725701943845 | 6.42199163428323E-13 |
| RACINE COUNTY CITY OF RACINE WARD 7 | 385 | 74 | 470 | 684 | 68.7134502923977 | 81.9148936170213 | 15.7446808510638 | 2.65763243490565E-10 |
| RACINE COUNTY CITY OF RACINE WARD 8 | 492 | 106 | 604 | 887 | 68.0947012401353 | 81.4569536423841 | 17.5496688741722 | 1.8659463263179E-10 |
| ROCK COUNTY CITY OF BELOIT WARD 13 | 350 | 76 | 438 | 660 | 66.3636363636364 | 79.9086757990868 | 17.351598173516 | 3.86795309941425E-11 |
| ROCK COUNTY CITY OF BELOIT WARD 14 | 422 | 121 | 552 | 844 | 65.4028436018957 | 76.4492753623188 | 21.9202898550725 | 5.01839456532688E-10 |
| ROCK COUNTY CITY OF BELOIT WARD 16 | 454 | 117 | 579 | 1188 | 48.7373737373737 | 78.4110535405872 | 20.2072538860104 | 5.60799598953891E-24 |
| ROCK COUNTY CITY OF BELOIT WARD 8 | 34 | 8 | 43 | 72 | 59.7222222222222 | 79.0697674418605 | 18.6046511627907 | 1.58318773614765E-14 |
| SHAWANO COUNTY TOWN OF BARTELME WARD 1 | 260 | 88 | 354 | 454 | 77.9735682819383 | 73.4463276836158 | 24.8587570621469 | 8.27419151174227E-30 |
| SHAWANO COUNTY TOWN OF RED SPRINGS WARDS 1-2 | 328 | 210 | 540 | 628 | 85.9872611464968 | 60.7407407407407 | 38.8888888888889 | 9.12515507152146E-16 |
| ST. CROIX COUNTY CITY OF HUDSON WARDS 1-2 | 553 | 538 | 1117 | 1402 | 79.6718972895863 | 49.5076096687556 | 48.16472694718 | 3.01168489100185E-10 |
| ST. CROIX COUNTY CITY OF HUDSON WARDS 9-10 | 823 | 512 | 1371 | 1621 | 84.5774213448489 | 60.0291757840992 | 37.345003646973 | 4.66935435278649E-13 |
| TAYLOR COUNTY TOWN OF MAPLEHURST WARD 1 | 36 | 179 | 218 | 199 | 109.547738693467 | 16.5137614678899 | 82.1100917431193 | 1.08923188875317E-14 |
| TAYLOR COUNTY TOWN OF PERSHING WARD 1 | 34 | 52 | 88 | 100 | 88 | 38.6363636363636 | 59.0909090909091 | 4.20619321566663E-10 |
| VILAS COUNTY TOWN OF LAC DU FLAMBEAU WARDS 1-7 | 977 | 634 | 1624 | 2191 | 74.1214057507987 | 60.1600985221675 | 39.0394088669951 | 2.71781088739366E-22 |
| WALWORTH COUNTY CITY OF WHITEWATER WARD 7 | 147 | 111 | 267 | 597 | 44.7236180904523 | 55.0561797752809 | 41.5730337078652 | 4.20346919413067E-28 |
| WALWORTH COUNTY CITY OF WHITEWATER WARD 9 | 194 | 96 | 296 | 576 | 51.3888888888889 | 65.5405405405405 | 32.4324324324324 | 1.08258816705731E-25 |
| WALWORTH COUNTY CITY OF WHITEWATER WARDS 3-4 | 547 | 305 | 875 | 1242 | 70.450885668277 | 62.5142857142857 | 34.8571428571429 | 1.21363190304917E-11 |
| WALWORTH COUNTY CITY OF WHITEWATER WARDS 8,13 | 92 | 35 | 129 | 256 | 50.390625 | 71.3178294573643 | 27.1317829457364 | 6.78349828881846E-30 |
| WAUKESHA COUNTY CITY OF WAUKESHA WARD 25 | 330 | 290 | 641 | 868 | 73.8479262672811 | 51.4820592823713 | 45.2418096723869 | 5.93869651342477E-10 |
| WAUKESHA COUNTY CITY OF WAUKESHA WARD 27 | 53 | 32 | 89 | 119 | 74.7899159663866 | 59.5505617977528 | 35.9550561797753 | 5.34798400477303E-12 |
| WAUKESHA COUNTY VILLAGE OF MERTON WARDS 5-6 | 20 | 71 | 92 | 94 | 97.8723404255319 | 21.7391304347826 | 77.1739130434783 | 4.6967624756401E-11 |
| WAUPACA COUNTY CITY OF WAUPACA WARDS 1-13 | 1409 | 1557 | 3030 | 3676 | 82.4265505984766 | 46.5016501650165 | 51.3861386138614 | 1.098732231727E-10 |
| WINNEBAGO COUNTY CITY OF OSHKOSH WARD 3 | 193 | 137 | 339 | 903 | 37.5415282392027 | 56.9321533923304 | 40.4129793510324 | 1.12053944116867E-30 |
| WINNEBAGO COUNTY CITY OF OSHKOSH WARD 4 | 312 | 203 | 525 | 1028 | 51.0700389105058 | 59.4285714285714 | 38.6666666666667 | 6.31136222801884E-17 |
| WOOD COUNTY CITY OF MARSHFIELD WARDS 4,14 | 571 | 553 | 1138 | 1342 | 84.7988077496274 | 50.1757469244288 | 48.5940246045694 | 6.46363645172154E-10 |