Adding on to my previous report (old version is here).
Fixed a few typos and formatting issues.
Added some discussion about the fact that the VA DOE did correct the turnout statistic error I found, but did not make any sort of statement or explanation as to why the error was there in the first place; why did it go undiscovered for nearly a year until I pointed it out; what procedures and policies are in place to make sure errors like this don’t happen again?
Added a section documenting the discovery that a small number of public records have been retroactively adjusted and specific entries are now missing from the public archives regarding the registered voter totals.
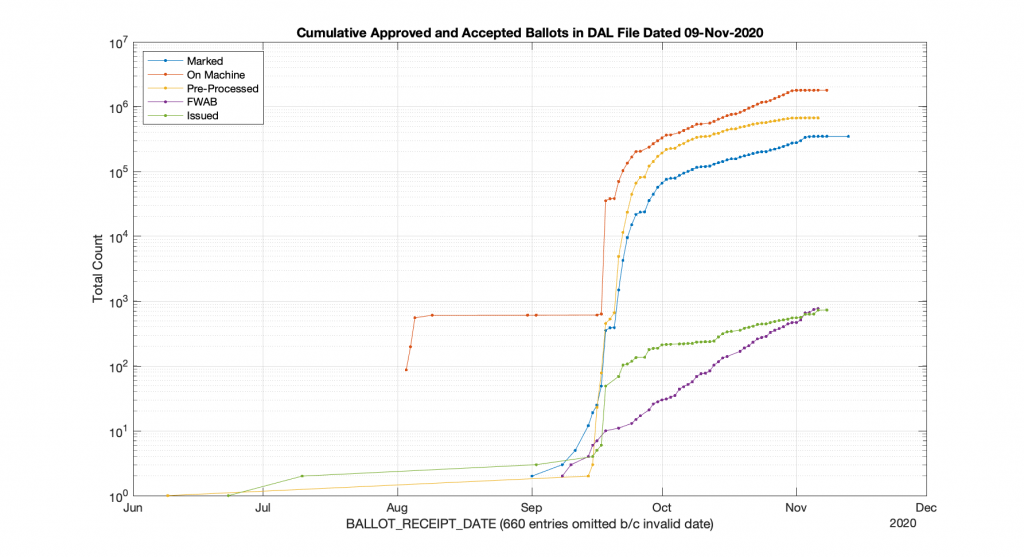
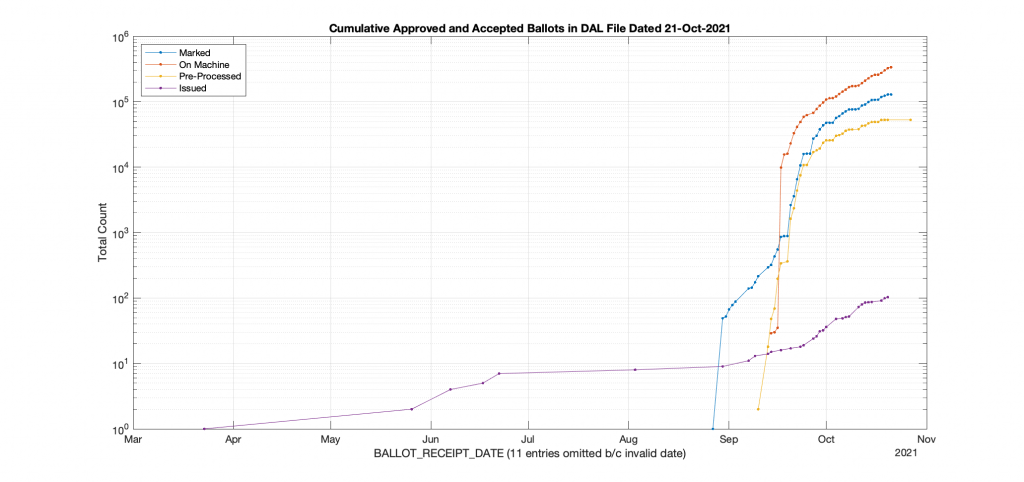
I got asked a question earlier this evening as to how the current 2021 VA election early vote/absentee data was shaping up in comparison to the 2020, so I did some quick processing and plotting of the Daily Absentee List (DAL) from just after the 2020 election (11-09-2020), and the current DAL as of today (10-21-2021).
The below graphs plot the APP_STATUS=”Approved” entries in the DAL, broken out by BALLOT_STATUS and plotted vs their BALLOT_RECEIPT_DATE. One major difference is that we haven’t had any Federal Write-In Absentee Ballots (FWAB) entered into the DAL in 2021 yet that have a valid BALLOT_RECEIPT_DATE, and the 2020 FWAB counts had a very different general curve than the other ballots. We also had a little less than 1000 ballots entered “On Machine” before early voting started in 2020. We see ballots issued earlier in the year for 2021, but no major “On Machine” counts. Note these graphs are logarithmic in the y-axis for easier viewing, and I had to discard 660 entries for 2020 and 11 entries for 2021 because the BALLOT_RECEIPT_DATE was invalid.
Per request by a reviewer of my most recent election irregularities report in VA (here), here’s a little more technical detail as to how the “ideal” model is computed in accordance with the original 2012 National Academy of Sciences paper that I based this work off of.
The generalized summary in my report for VA reads as follows:
“The upper right image was computed per the NAS paper; the bottom left image shows what an idealized model of the data could or should look like, based on the reported voter turnout and vote share for the winner. This ideal model is allowed to have up to 3 Gaussian lobes based on the peak locations and standard deviations in the reported Virginia results.”
While that description is absolutely accurate, it glosses over some of the implementation as I didn’t want the reader to go all glassy-eyed on me! A more explicit technical definition is as follows: All of the localized maximal peaks in the 2D histogram that are above pThresh (~= 0.7) x the value of the global maximum peak are used as the centroids of a Gaussian Mixture model, with shared covariance matrix equal to 1.5 x sqrt of the covariance matrix of all of the data points. (Thats a lot of mathematics packed into one sentence, but its accurate!) In the case of the VA per county per cong district data this give us either 2 or 3 peaks dependent on the value that is used for the pThresh threshold. The value of 0.7 was chosen after observing results from multiple states data that I have been doing fingerprint analysis on. The MATLAB imregionalmax(…) function from the Image Processing Toolbox is used to find the candidate localized peaks, and the gmdistribution(…) function from the Statistics toolbox generated the final idealized model.
% HBf is the 2D Histogram image
BW = imregionalmax(HBf);
v = HBf(BW);
[r,c] = find(BW.*HBf >=  max(v(:))*pThresh);
mu = [r,c];
s = 1.5;

cv = diag(diag(s*sqrt(cov(rawData))));
GMModel = gmdistribution(mu,cv);
The end result of this is shown below (bottom left) with the Bayesian Information Criterion (BIC) and number of Gaussian components listed in the title of the bottom left “ideal” plot.
The US National Academy of Sciences (NAS) published a paper in 2012 titled “Statistical detection of systematic election irregularities.” [1] The paper asked the question, “How can it be distinguished whether an election outcome represents the will of the people or the will of the counters?” The study reviewed the results from elections in Russia and other countries, where widespread fraud was suspected. The study was published in the proceedings of the National Academy of Sciences as well as referenced in multiple election guides by USAID [2][3], among other citations.
The study authors’ thesis was that with a large sample of the voting data, they would be able to see whether or not voting patterns deviated from the voting patterns of elections where there was no fraud. The results of their study proved that there were indeed significant deviations from the expected, normal voting patterns in the elections where fraud was suspected.
Statistical results are often graphed, to provide a visual representation of how normal data should look. A particularly useful visual representation of election data is the election fingerprint. When used to analyze election data, the election fingerprint typically analyzes the votes for the winner versus voter turnout by voting district. The expected shape of the fingerprint is of that of a 2D Gaussian (a.k.a. “Normal”) distribution [4]. (See this MIT News article for a great additional description and primer on the Gaussian or Normal distribution: https://news.mit.edu/2012/explained-sigma-0209)
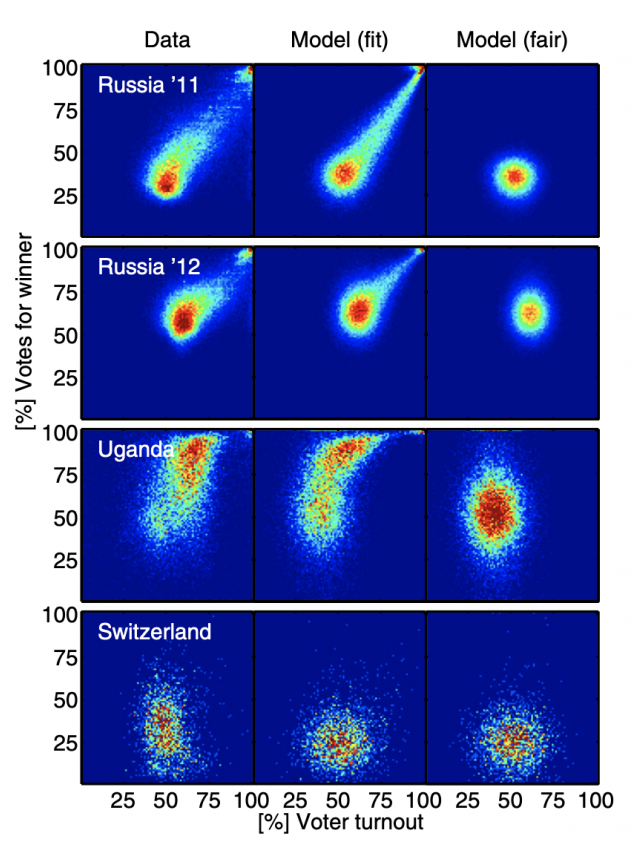
Here is an example reprinted from the referenced National Academy of Sciences paper:
The actual election results in Russia, Uganda and Switzerland appear in the left column, the right column is the expected appearance in a fair election with little fraud, and the middle column is the researchers’ model with fraud included.
As you can see, the election in Switzerland shows a range of voter turnout, from approximately 30 – 70% across voting districts, and a similar range of votes for the winner.
What do the clusters mean in the Russia 2011 and 2012 elections? Of particular concern are the top right corners, showing nearly 100% turnout of voters, and nearly 100% of them voted for the winner.
Both of those events (more than 90% of registered voters turning out to vote and more than 90% of the voters voting for the winner) are statistically improbable, even for very contested elections. Election results that show a strong linear streak away from the main fingerprint lobe indicates ‘ballot stuffing,’ where ballots are added at a specific rate. Voter turnout over 100% indicates ‘extreme fraud’. [1][5]
Election results with ‘outliers’ – results that fall outside of normal voting patterns – are not in and of themselves definitive proof of outright fraud. But additional reviews of voting patterns and election results should be conducted whenever deviations from normal patterns occur in an election. Additionally it should be noted that “the absence of evidence is not the evidence of absence”: Election Fingerprints that look otherwise normal might still have underlying issues that are just simply not readily apparent with this view of the data.
Using this studies methodology, in late 2020 and 2021, multiple researchers in the US have applied the same analysis to the US 2020 election results, as well as the results of previous elections.
Records of Voter Rolls Pre-Election Day, On Election Day, and marked as Absentee. (Note that due to personal privacy considerations, this raw dataset is not openly published and the raw data must be obtained via request. The summaries of this dataset is included in the “2020-NH-Combined-Data.csv” file included below)
Election Fingerprint:
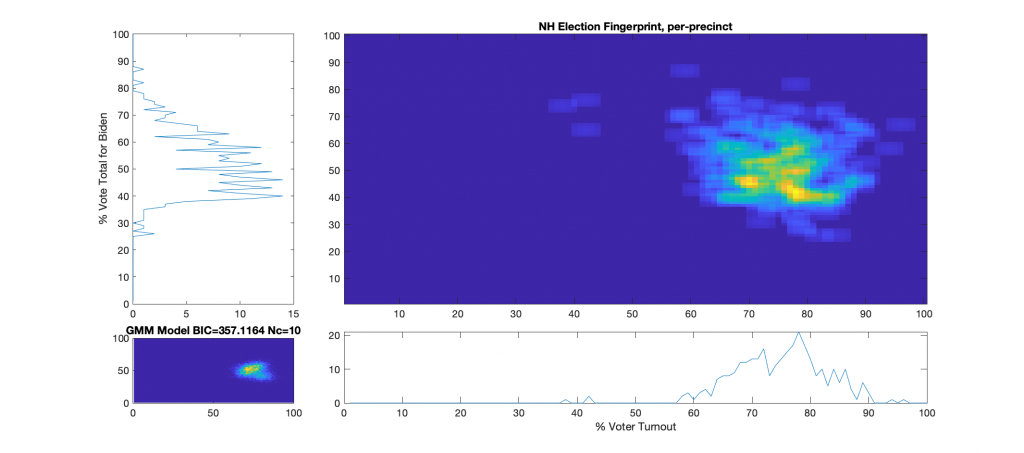
The upper right image in the following graphic is the computed election fingerprint, computed according to the NAS paper and using official state reported voter turnout and votes for the statewide winner. The color scale moves from precincts with low counts as deep blue, to precincts with high numbers represented as bright yellow. Note that a small blurring filter was applied to the computed image for ease of viewing small isolated histogram hits.
The bottom left image of the graphic shows what an “idealized” model of the data could look like. The upper right image was computed per the NAS paper; the bottom left image shows what an idealized mixture-of-Gaussian model of the data should look like, based on the reported voter turnout and vote share for the winner.
The top-left and bottom-right plots show the sum of the rows and columns of the fingerprint image. The top-left graph corresponds to the sum of the rows in the upper right image and is the histogram of the vote share for Biden across precincts. The bottom right plot corresponds sum of the columns of the upper right image, and is the histogram of the % turnout across the precincts.
Observations/Conclusions:
There does not appear to be any majorly distinct linear correlations, over 100% turnout precincts, or otherwise major red flags even though there is some patterned noise. The distribution is very large and diffuse, and has a definite skew, which is curious, but not necessarily indicative.
There are a small number of outlier precincts outside of the main distribution lobe, most notably the cluster along the 40% turnout line (Lempster, Newport & Claremont Ward 3), and two precincts above 90% turnout (Randolph & Ellsworth).
There are at least two major peaks in the main lobe, which is consistent with the theory of a split electorate.
The % Vote Share for Biden plot (Upper-Left) is “lop-sided” and shows a distinct skew in the data above the 40% Vote Share mark.
Looking at the difference between the Total Reported Votes from Source B and Total Votes count from official Source C shows 10,666 unaccounted for votes. The total number of Write-In votes from Source D was only 1158 and not nearly enough to account for this difference.
Looking at the difference between the registered voters from Source E and the Registered voters from Source A, there is a difference of 122,248 registrations.
References:
[1] “Statistical detection of election irregularities” Peter Klimek, Yuri Yegorov, Rudolf Hanel, Stefan Thurner Proceedings of the National Academy of Sciences Oct 2012, 109 (41) 16469-16473; DOI: 10.1073/pnas.1210722109 (https://www.pnas.org/content/109/41/16469)
[5] Mebane, Walter R. and Kalinin, Kirill, Comparative Election Fraud Detection (2009). APSA 2009 Toronto Meeting Paper, Available at SSRN: https://ssrn.com/abstract=1450078
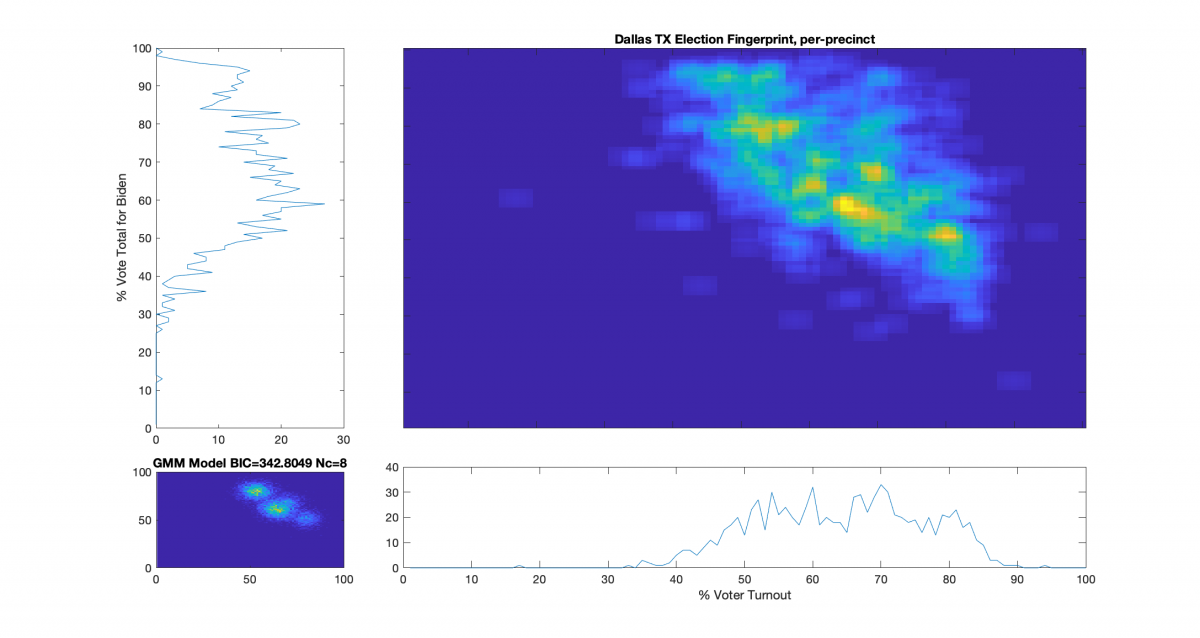
Election Fingerprint for Dallas, TX polling places – All Vote Types:
Conclusions:
The results have a rotated and elongated orientation, and looks like a number of distinct “hot-spots” within the larger cluster.
Vote share near or over 100% is highly irregular and indicates a strong potential for fraud in any election. In the image above, there is what looks like a cluster centered around 50% turnout and spreading across multiple turnout bins of near 100% vote share for Biden. Even in contentious elections, voter turnout over 90% is statistically unlikely, but not impossible.
Of the 868 precincts in this dataset, 87 are in the > 90% vote share for Biden band, 46 had > 93%, 15 had > 95%, and 2 had > 97%.
This fingerprint shows modest items of interest, but is inconclusive.
Hat tip to Ed Solomon for collating the data on this one. There’s a bunch more coming as Ed’s done the heavy lifting on a bunch of localities, and I’m working through them.
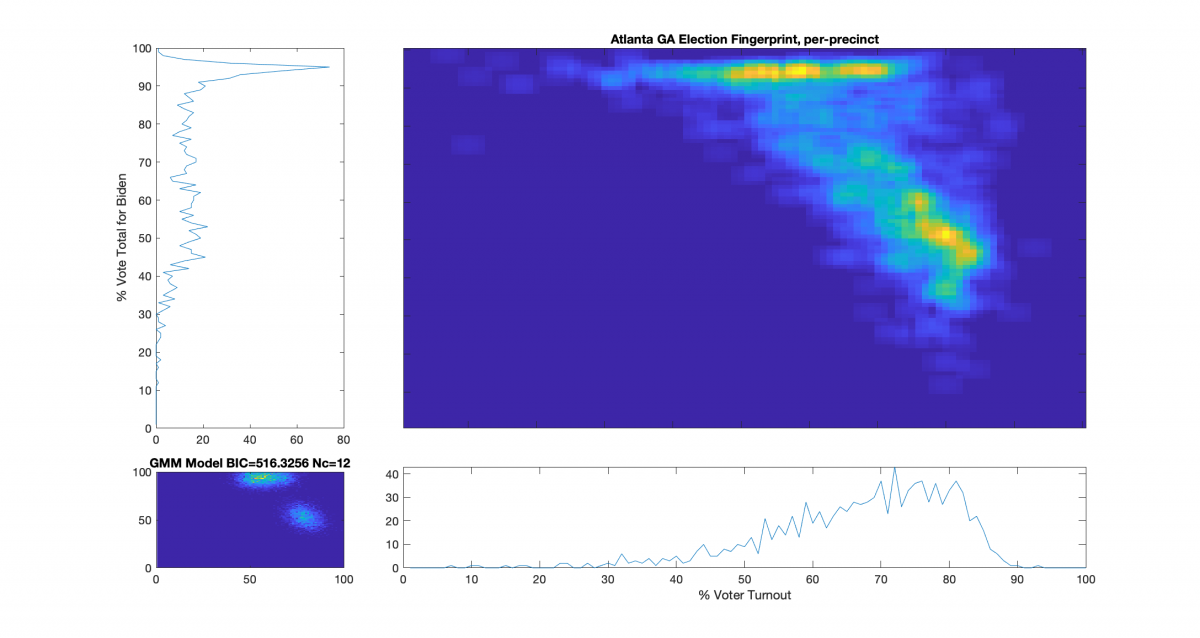
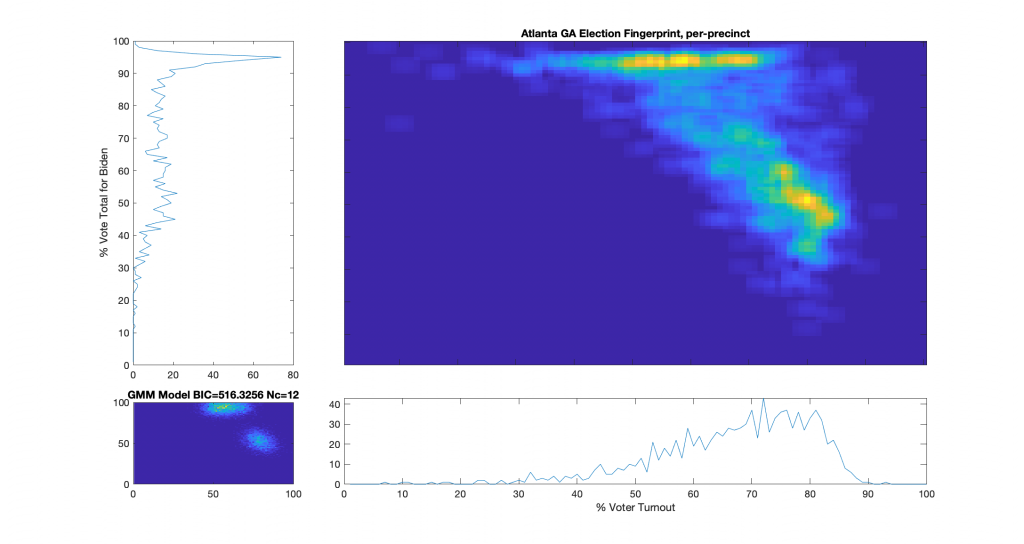
Election Fingerprint for Atlanta, GA polling places – All Vote Types:
Conclusions:
The results do not form a normal Gaussian distribution, and are therefore, by definition, an “irregular” distribution. The main lobe of the ‘fingerprint’ also has a diffuse linear streak up and to the left. According to the authors of the NAS paper, election results that show a strong streaking away from the main lobe may indicate ‘ballot stuffing,’ where ballots are added (or subtracted) at a specific rate. The election fingerprint is in the form of a main lobe and streak, although the streak is not as pronounced as the NAS paper’s Russia results.
Vote share near or over 100% is highly irregular and indicates a strong potential for fraud in any election. In the image above, there is a distinct and shape line across multiple turnout bins of near 100% vote share for Biden. Even in contentious elections, voter turnout over 90% is statistically unlikely, but not impossible.
Of the 1022 polling places in Atlanta, 252 are in the > 90% vote share for Biden band, 201 had > 93%, 84 had > 95%, and 8 had > 97%.
These findings indicate significant election irregularities that warrant additional scrutiny and investigation. It should be reiterated that the observed irregularities discussed above can serve as useful indicators and warnings of issues with an election, but do not constitute absolute proof of fraud on their own.
USAID pulled two of their recent publications sometime after Nov 8 2020 on election integrity from their website. Specifically two publications that discuss election integrity forensics, including referencing the same National Academy of sciences paper that describes the Election Fingerprinting process that I’ve been using as a basis for my work. Luckily … there’s the wayback machine … and I made copies.
“ASSESSING AND VERIFYING ELECTION RESULTS: A DECISION-MAKER’S GUIDE TO PARALLEL VOTE TABULATION AND OTHER TOOLS” (original URL: https://pdf.usaid.gov/pdf_docs/PA00KGWR.pdf)
After getting a pointer to the higher fidelity per-ward WI data and redoing that analysis (here), which was not only able to produce the election fingerprints but also a statistical model for each county that could identify statistically outlying wards for further scrutiny, I wanted to go back to the VA data and see if I could update that analysis to do the same thing. There is a problem with the VA data, however, as VA uses “virtual” absentee and provisional ballot counting precincts and collects all absentee and provisional ballots at the county congressional district level. That means that there is no direct mapping for the absentee or provisional ballots back to the precincts that they came from in the data published by the Virginia Department of Elections. What I really need to have is all of the votes (in person, absentee, provisional) accounted for at the per precinct level.
In theory, if the reported totals from VA DoE are accurate and truly represent the sum of what occurred at the precinct level, such a mapping should be trivial to produce with standard optimization methods. That doesn’t mean that such a produced mapping would be necessarily accurate to specific real precinct vote tallies, just that mathematically there should be at least one, if not many, possible such mappings of vote shares at the precinct level that sum to the results presented by VA DoE and obey all of the constraints due to voter turnout, reported absentee registrations and returned ballots, etc. One of those possible mappings should also correctly represent what the real votes shares were for the election.
Side Note: I’d argue that the fact that VA has tallied and published their data in such a way that makes it near impossible to transparently review precinct level results is reason enough to audit the entire VA vote, and needs to be addressed by our legislature.Even if there was absolutely no flaws, errors, or fraud in the VA election … the vote should still be thoroughly and completely audited across the state, and reporting standards should be updated to make inspection of the per precinct results transparent without needing to perform advanced algorithms as described below.
Previously I tried adjusting the “registered voter” counts for each virtual district by subtracting off the number of actual votes counted in person in their constituent real precincts. That method is accurate and produces self-consistent data for the “virtual precincts” which are summed at the county congressional district level, but it does nothing for being able to plot accurate fingerprints at the real per-precinct level.
But then I had an idea (ding!) after my discussions with Ed Solomon as to how to “unwrap” and distribute the Absentee and Provisional ballots from the virtual precinct sums back to the component real precincts. We can use the fact that we have the actual county level sums, and the real precinct level turnout numbers as constraints to perform a non-linear model fit that estimates the numbers of votes for Biden and Trump for each precinct that should be summed into the virtual district results.
Fair Warning: If you’ve been following my other blog posts, this one is going to get way more technical. I’ll still try to make sure that I include ample descriptions and educational cross-links … but buckle up!
Input Data:
The input data to this is the same as the input data to all of the VA Election Fingerprint analysis. Direct from the VA Dept of Elections, we need the per precinct vote tallies and the voter registrations numbers. We’d like the registered voter results as close to the nov election as possible. Links to the most recently updated versions of these files from VA DoE are below. I’ve made one addition to the standard dataset, which is that I’ve used the Daily Absentee List (DAL) from the 2020 November General provided by VA DoE to estimate the number of accepted and returned absentee ballots per precinct.
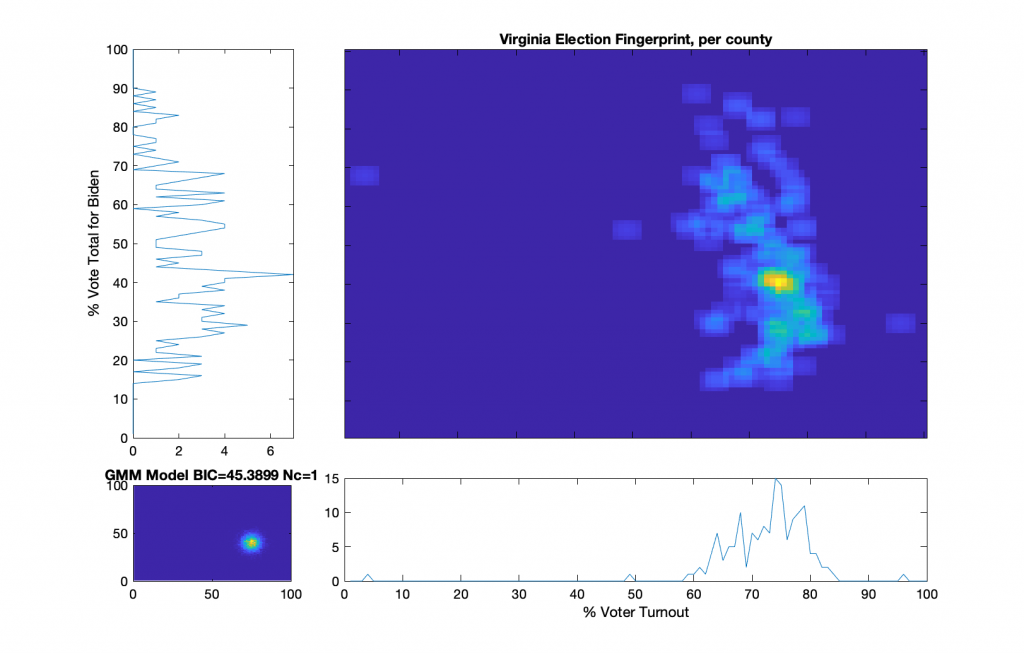
We know the per county per congressional district vote tallies and registration numbers [note that I routinely just refer to this as the “per county” data, but its really per county per congressional district], including all In-Person and Absentee ballots. We can compute the per County fingerprint in the standard manner according to the methods in the NAS paper that describes the Election Fingerprint method, as I did previously here and here. We take the data provided from the links above and sum them into per county results, and creating a 2D histogram of the (% Vote Share for Biden) vs (% Voter Turnout).
Per County Election Fingerprint based on the raw data provided by the VA DoE
I’ll mention quickly about how the Fingerprint above from the reported data appears to have significant irregularities and correlations that deviate from a 2D Gaussian. We see a central lobe with some very distinct intersecting curves overlaid. This distribution does not comport with the theory of a free and fair election. That is not the focus of this post however.
I (and others) would like the ability to accurately examine the data at the per–precinct level. We know the per precinct In-Person vote total from the VA DoE data, but not the per precinct Absentee votes for each candidate. Which means that the VA per precinct maps I produced before, while useful for looking at the In-Person, Absentee or Provisional votes independently, are not really suited for performing hypothesis testing for outlier precincts in relation to the election results as a whole. This is because the In-Person and Absentee votes share the same universe of possible voters (e.g. registered voters) with an unknown “mixing” coefficient (also known as a set of latent or hidden variables), and the Central Absentee Precinct (CAP) data from VA DoE encompass a number of summed component real precinct data. We also know that a large portion of the 2020 election was due to non-In-Person ballots, so this is a pretty gaping hole in our ability to understand what happened in VA.
We therefore need to estimate the number of additional (absentee or provisional) votes for Trump and Biden that should be attributed to each real precinct. Since we are missing important data from the VA DoE published data, we going to have to try and model this data using a non-linear optimization subject to a number of constraints. The desired end result of this is a self-consistent (but modeled) per precinct data set that accounts for all In-Person and Absentee ballots AND sums within each county congressional district to equal the per county fingerprints that we produced previously AND does not violate any of the expectations of a free and fair election (i.e. no over 100% turnout, no linear correlations in the histogram, etc). I will caveat again that this modeled result is only one possible solution to the “unmixing” optimization problem, albeit the most likely, given the constraints. If we can find such a mapping, then we have an existence proof. If the election was truly free and fair, and the data has not been manipulated, then there should exist at least one such mapping that can be discovered by the optimization process.
We’re going to perform this modeling under the following assumptions and constraints:
The total number of votes (In-Person, Absentee) allocated to a precinct should not exceed the number of registered voters for the precinct. Our optimization function will include a penalty when this is violated.
The total number of Absentee votes allocated to a precinct should not exceed the number of returned absentee ballots for the precinct (computed from the DAL). Our optimization function will include a penalty when this is violated.
The sum of the vote totals in all of the component precincts of a county congressional district should equal the data as provided by VA DoE (Votes Trump, Votes Biden, Total Absentee Votes, etc). Our optimization function will include a penalty when this is violated.
We’ll use the MATLAB optimization toolbox lsqnonlin function, which uses a Trust-Region-Reflective or Levenberg-Marquradt algorithm, and try and create this new model by finding the additive factors (x Abs Vote for Biden, y Abs Votes for Trump) for each precinct’s Biden and Trump votes that warp the In-Person dataset such that each precincts data incorporates the contributions from Absentee votes. We are also going to clamp each of the (x, y) factors to be greater than 0 and less than the total number of estimated absentee ballots per precinct. Note that if the only limit was this clamping we could still have 2x the number of allocated absentee votes since there are two variables, so this limit serves only as an extreme upper bound for numerical stability reasons and computation speed.
The objective function for the MATLABlsqnonlin(...) algorithm is given below. I’ve also parameterized which penalties are to be included so that I can try different permutations.
function [y, a, b, c, v] = ofunc2(abVotes,pivotMatrix,ipVotes,countyVotes,doA,doB,doC)
% abVotes is the current estimate of absentee votes for trump and biden
% attributed per precinct
%
% pivotMatrix is a boolean sparse matrix that sums the component precinct
% level data into their respective county gongressional district units.
%
% ipVotes is the in person [Biden, Trump, ..., TotalIP, RegisteredVoters,
% AcceptedAndReturnedAbsentee] tallies per precinct
%
% countyVotes is the total [Biden, Trump, ..., Total, RegisteredVoters, ...,
% TotalAbsenteeVotes] tallies per county congressional district

dim = size(abVotes,2);
xvotes = ipVotes;
xvotes(:,1:dim) = xvotes(:,1:dim)+abVotes;
mvotes = pivotMatrix*xvotes;        % Modeled votes per county
avotes = pivotMatrix*abVotes;       % Absentee votes per county

% extra penalty for breaking the rules...
exPen  = 1;
if nargin < 5 || isempty(doA)
    doA = true;
end
if nargin < 6 || isempty(doB)
    doB = true;
end
if nargin < 7 || isempty(doC)
    doC = true;
end

v = {};
a = [];
b = [];
c = [];

y = [];

% Difference at the county vote tally level
a = (mvotes(:,1:dim)-countyVotes(:,1:dim));
if nargout > 1 && sum(abs(a(:))) > 0
    v{end+1} = ['Violation of County Vote Tally: ',num2str(sum(abs(a(:))))];
end

if doA
    % Penalize for going over number of registered voters per county
    a(:,dim+1) = exPen * (sum(mvotes(:,1:dim),2) - countyVotes(:,dim+2));
    a(a(:,dim+1)<0,dim+1) = 0; % No penalty if we dont go over limit

    if nargout > 1 && sum(abs(a(:,dim+1))) > 0
        v{end+1} = ['Violation of County Registered Voters: ',num2str(sum(abs(a(:,3))))];
    end

    % Penalize for difference from number of absentee voters per county
    a(:,dim+2) = exPen * (countyVotes(:,end-1) - sum(avotes(:,1:dim),2));
    if nargout > 1 && sum(abs(a(:,dim+2))) > 0
        v{end+1} = ['Violation of County Absentee Votes: ',num2str(sum(abs(a(:,dim+2))))];
    end
end
y = [y;a(:)];

if doB
    % Penalize difference from number of computed absentee votes per precinct
    b = exPen * (sum(abVotes,2)-ipVotes(:,end));
    %b(b<0) = 0;  % No penalty if we dont go over limit
    y = [y;b(:)];

    if nargout > 1 && sum(abs(b(:))) > 0
        v{end+1} = ['Violation of Precinct Approved and Returned Absentee Ballots: ',num2str(sum(abs(b(:))))];
    end
end

if doC
    % Penalize going over the total number of registered voters per precinct
    c = exPen * (sum(xvotes(:,1:dim),2)-ipVotes(:,dim+2));
    c(c<0) = 0;  % No penalty if we dont go over limit
    y = [y;c(:)];

    if nargout > 1 && sum(abs(c(:))) > 0
        v{end+1} = ['Violation of Precinct Registered Voters: ',num2str(sum(abs(c(:))))];
    end
end
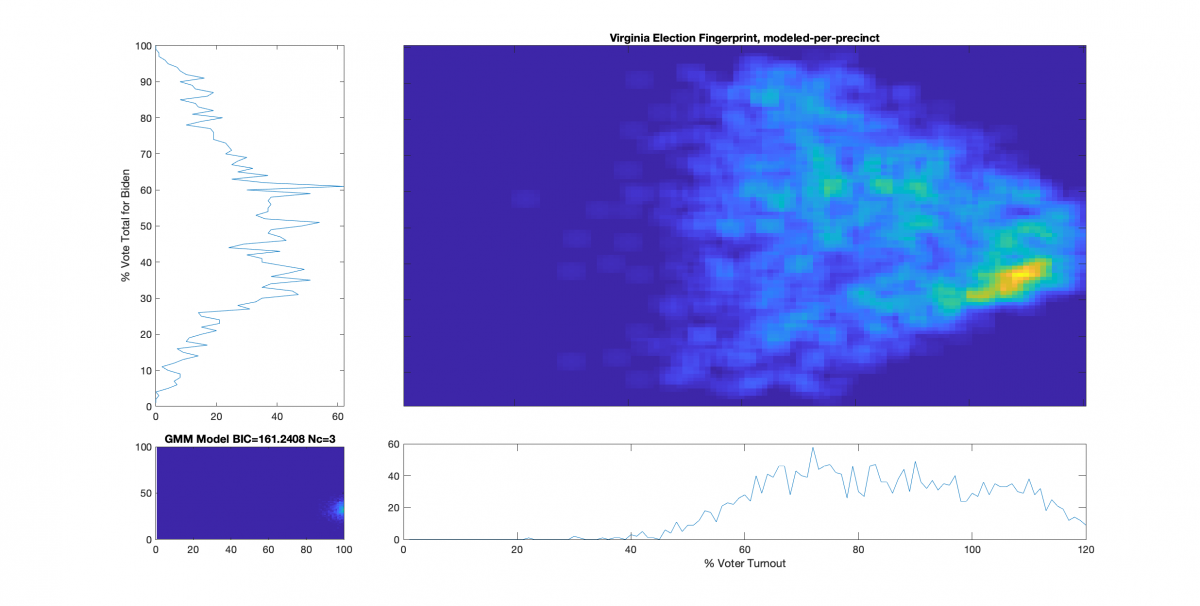
Rsults:
I was unable to find a solution using ANY of the constraint permutations that satisfied mathematical consistency. While I was able to produce estimates of absentee vote share per precinct, none of the solutions generated fell completely within the reported turnout, reported absentee ballot splits, or other constraints as defined by the published and certified VA DoE results.
Based on the deviations otherwise observed and reported by VA DoE, an error threshold of 0.1% on reconstructed totals using the modeled absentee ballot distributions should be readily achievable, with exact matches the ideal and desired result . The closest solution I have achieved so far is off by a min of 0.35% (for reconstructed Trump vote total) and a max of 0.62% (for the reconstructed total number of votes cast).
I have issued on FB, Twitter and Telegram an open challenge and reward of $1000 to the first person that can provide such a solution. I do not believe that such a solution exists.
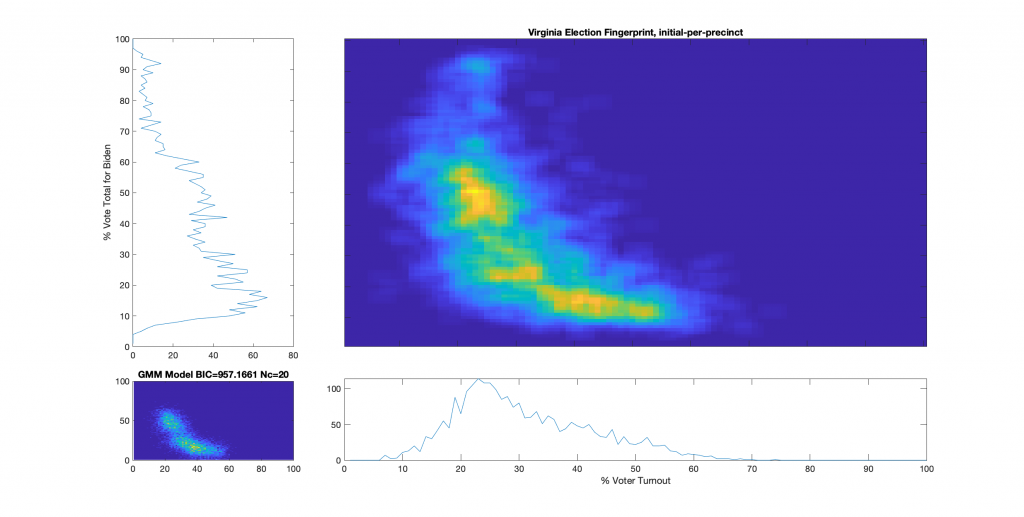
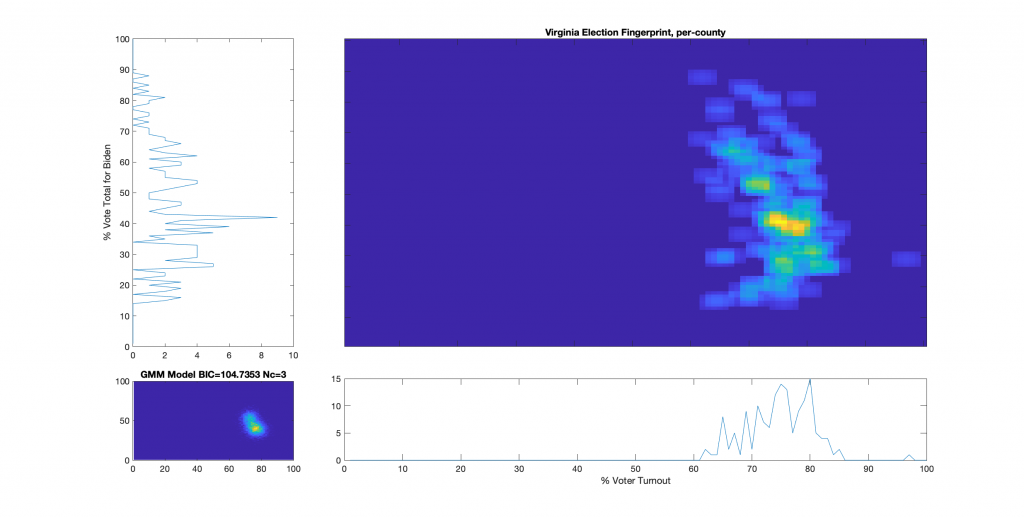
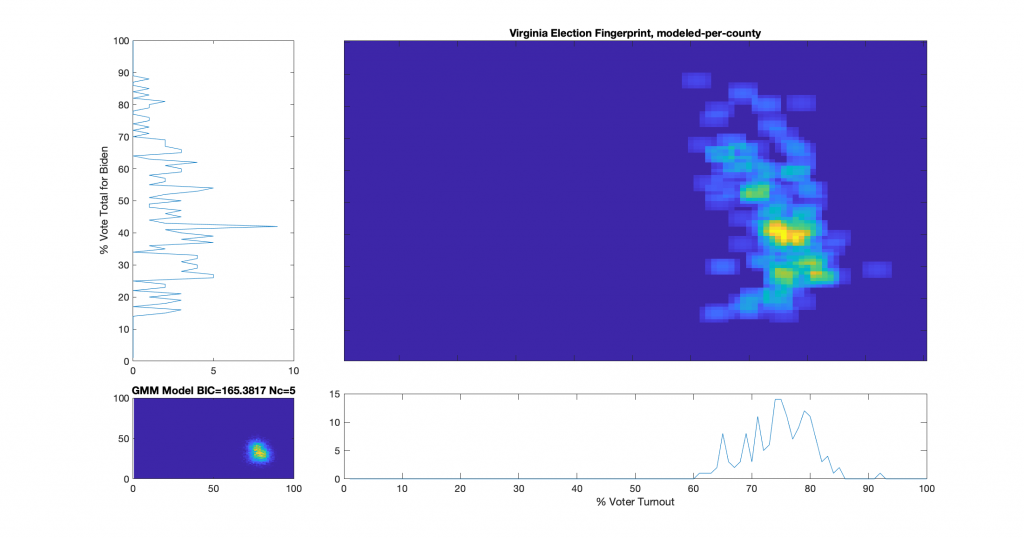
Original Per Precinct (In Person Only) Election FingerprintOriginal Per County Election FingerprintModeled Per County Election Fingerprint using all constraints aboveModeled Per Precinct (In Person + Absentee) Election Fingerprint using all constraints above
A bugfix, but still no solution found … (update @ 2021-08-17 3:19pm)
There was a bug in the objective function posted above. The penalty score for going over the number of registered voters per county and the penalty score for going over the number of registered voters in the precinct should have had a negative sign in front of them. This has been fixed in the program listing above. While the LM optimization gets much closer with this bugfix, I have still yet to find a solution that satisfies all constraints and matches the results reported by VA DoE.
The “best bad” solution I could find … (update @ 2021-08-26 0:09 am)
After weeks of running different variations the “best bad” numerical solution I can find still busts the constraints derived from the reported VA data. The error function code and the resultant images have been updated. The following deviations are the mathematical minimum amount of deviations that I could achieve using the Levenberg-Marquardt optimization. There does not appear to be a mathematical solution to the absentee unwrapping problem in VA that does not violate the published tallies from VA DoE. There *should* be an entire universe of possibilities. The fact that there isn’t one is near irrefutable proof that the election vote tallies certified by VA are egregiously flawed.
Violation of County Vote Tally: 1401
Violation of County Absentee Votes: 1267
Violation of Precinct Approved and Returned Absentee Ballots: 15255
Violation of Precinct Registered Voters: 1808
The “worst bad” solution, which only tried to constrain the problem based on reported vote tallies, performed significantly worse.
Violation of County Vote Tally: 2382
Violation of County Absentee Votes: 970
Violation of Precinct Approved and Returned Absentee Ballots: 559492
Violation of Precinct Registered Voters: 75041
Yes. I’ve been watching the Mike Lindell cyber symposium.
I was invited to attend (thank you again to Amanda Freeman Chase), but due to timing, my day job, and my understanding of the event format … I thought I could be more effective watching from home with the ability multi-task and to research things I heard real-time and continue my ongoing work in the background.
There’s a lot of fluff that was presented, which is fine. But Dr. Frank’s presentation was very very good, which was the first presentation I caught, and while I haven’t cross checked his methods (yet), they mostly corroborate the artifacts that I have seen as well using very different and rigorous techniques … at least at first blush going off of his presentation. (It’s now on my todo list to replicate his results.)
I am less convinced of the PCAP’s, and the theory that there was an organized (China backed) conspiracy to commit fraud as I’m still not sure as to some of the details as to data origin, methods, etc. I do find it very plausible. I just need more details. (I’m very familiar with PCAP’s, etc. but there are a lot more details that are required.)
However, until I get a better in depth look at the PCAP data and the code used to reconstruct Mike’s “corrected” maps, I think there is a simpler explanation: It is not required that fraud, manipulation or incompetence needs to have been organized to be effective. There does not need to be a nefarious man-behind-the-curtain. I think it more likely that we are looking at many mechanisms affecting our elections (plural), not a major singular effort. Thats my operating theory anyway.
Note: As of Update 2021-08-13 (see below) the discrepancy is now 382176 Votes.
This needs to be explained. I hope this is just a mistake on my part or it can be attributed to a documented clerical or reporting error. I’ve gone over this a number of times now and triple checked my data sources and methods (all described or linked here). I’m only using the publicly available data from the VA Dept of Elections website and a doing a fairly basic consistency check between the machine readable data (csv) and what is presented on their site.
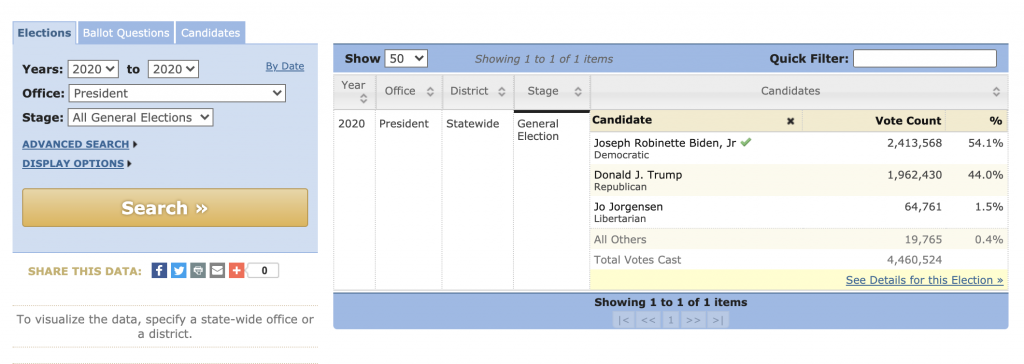
The VA Dept of Election summarizes the voting results for the 2020 Presidential election as follows. We note that even just taking screen shots from the VA DoE website we can notice that the vote totals for the same elections have some error in them. The first screen shot shows the total number of votes in the 2020 Presidential Election as 4,486,821 while the second shows the number of votes cast as 4,460,524. Now that is not a major difference in relation to the margin of victory or the number of votes cast, so it’s not something that bothers me. The two reported numbers are close enough that it is plausible that one includes overvotes/undervotes and the other doesn’t, or something similar. But it IS a noted difference, none the less. (issue # 1)
The VA DoE also publishes the 2020 General Election results (here) as a csv file. (I pulled a fresh copy as of 2021-08-10 to run this analysis, but its too large to upload to the site). One would expect the data in the csv and the data presented on the VA DoE website to match, or at least be close enough to chalk up any errors to something simple like over-votes/undervotes, etc.. They don’t. Not only do they not match, but they don’t match in a very peculiar way. Let’s walk through the process of grabbing the data from the csv and tabulating metrics above in a very simple MATLAB script, shall we?
% %%%%%%%%%%%%%%%%%%%%%%%%%%%%%%%%%%%%%%%%%%%%%%%%%%%%%%%%%%%%%%%%%%%%%%%%%
% Import the November General vote totals and collate ...
NovemberGeneral = importVAVotefile("SourceData/2020 November General.csv", [2, Inf]);
NovemberGeneral = NovemberGeneral(NovemberGeneral.OfficeTitle == 'President and Vice President',:);
LocalityName = NovemberGeneral.LocalityName;
DistrictName = NovemberGeneral.DistrictName;
PrecinctName = NovemberGeneral.PrecinctName;

uid = join(cat(2,string(LocalityName),string(DistrictName),string(PrecinctName)),' : ');

[uuids, ui,ua] = unique(uid);
[ulns, uci,uca] = unique(NovemberGeneral.LastName);
votes = accumarray([ua,uca],NovemberGeneral.TOTAL_VOTES);
votes(isnan(votes)) = 0;
votes(:,end+1) = sum(votes,2);

isAbsentee = contains(string(uuids),"Central Absentee Precinct");
isProvisional = contains(string(uuids),"Provisional");

% Compute the sum of all ballots
TotalVotes = sum(votes(:,end))

% Compute the sum of the in person ballots
InPersonVotes = sum(votes(~isAbsentee & ~isProvisional,end))

% Compute the sum of the provisional or absentee ballots
Absentee = sum(votes(isAbsentee | isProvisional,end))
>> TotalVotes = 4462600
>> InPersonVotes = 1630833
>> Absentee = 2831767
Wait a minute?? … the data from the first link show the Absentee vote being 2,687,304. Yet the “2020 November General.csv” file shows 2,831,767 absentee votes. Thats a difference of somewhere around 144,463 votes! Even more interesting is the fact that the total number of votes is still consistent with the published summary screenshots above. Thats a significant enough discrepancy that I get my worry beads out. Now, granted, this could … in some convoluted Rube Goldberg esque manner … be just be a clerical error, or maybe I’m just missing something totally obvious about the data. But no matter the reason, this NEEDS to be explained.
Update 2021-08-10 6:57pm
I’ve received a update that further corroborates the discontinuity in these numbers. In response to a FOIA request, the VA Dept of Elections supplied a summary file of the counts of all requested and returned absentee ballots per county.
This data file comes from ashley.coles@elections.virginia.gov. It contains only two data columns, the Total Requested and the Total Returned. Summing the Total Returned column produces a result of 2,829,037. which is only off from my result by 2730 (<< 1%). So we have yet another official source of VA election data that shows a discrepancy from the official results that were certified by VA. No fancy MATLAB scripts required to process, just simple sum of the table columns.
Update 2021-08-13 3:00 PM
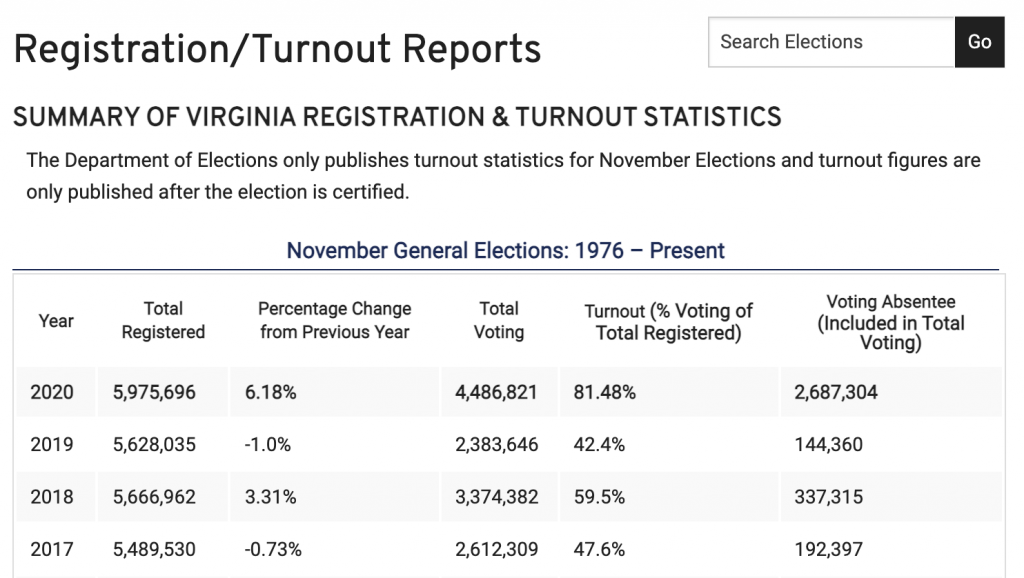
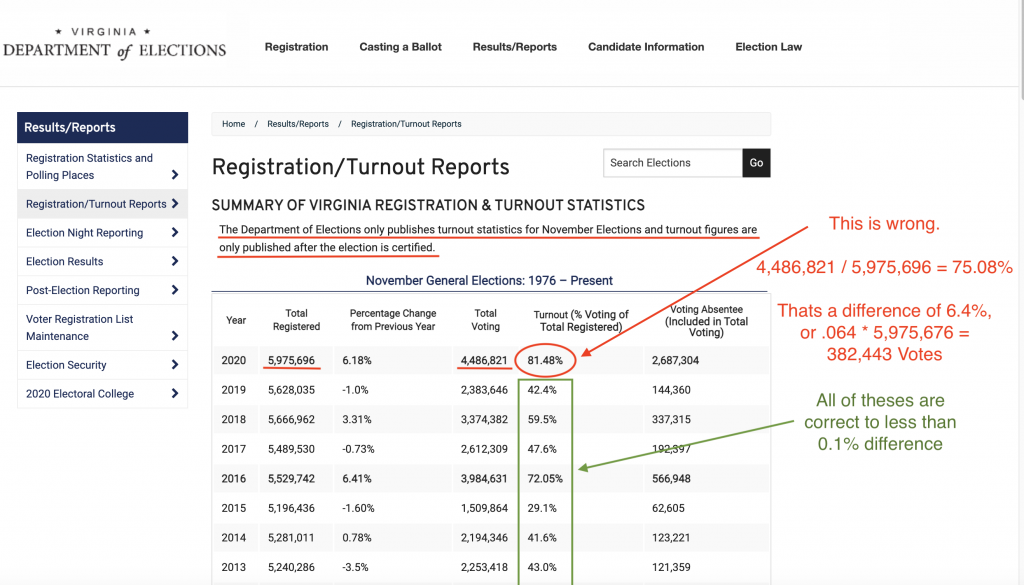
Looking closer at the official certified results from the VA DoE (first graphic and link above), they report that in 2020 the Total Registered = 5,975,696, the Total Voting = 4,486,821, and the % Turnout = 81.48%. They define the “Turnout” metric in the header as “% Voting of Total Registered”. So according to VA DoE … Total Voting / Total Registered * 100 = 4486821 / 5975696 * 100 = 81.48. Simple, right?
Except its wrong. Way wrong. Go ahead … grab a calculator. Try it for yourself.
4486821 / 5975696 * 100 = 75.0845 is what you’ll come up with. That’s a Difference of 6.40% from the reported turnout. .064 * Total Registered = .064 * 5,975,696= 382,176 (rounded) Unaccounted for votes.
But Jon … you say … surely you are just misinterpreting their metric! They wouldn’t have published the certified results with that glaring of an error. There has to be some other variable that’s counted in the turnout numbers that they just forgot to describe in the header line of the report.
If that were the case, we would expect the other election totals in the subsequent rows to show similar errors then, right? Yeah … not so much. Every other year in this same report has a difference of less than 0.1%.
Remember these are the numbers that VA certified to congress. Even if this is just a clerical error, we need to know how and why it happened and make sure it doesn’t happen again. We need a full audit of the VA 2020 Election.
Year
Total Registered
Percentage Change from Previous Year
Total Voting
Turnout (% Voting of Total Registered)
Voting Absentee (Included in Total Voting)
Total Voting / Total Registered
Difference From Reported Turnout
2020
5,975,696
6.18%
4,486,821
81.48%
2,687,304
75.08%
6.40%
2019
5,628,035
-1.00%
2,383,646
42.40%
144,360
42.35%
0.05%
2018
5,666,962
3.31%
3,374,382
59.50%
337,315
59.54%
-0.04%
2017
5,489,530
-0.73%
2,612,309
47.60%
192,397
47.59%
0.01%
2016
5,529,742
6.41%
3,984,631
72.05%
566,948
72.06%
-0.01%
2015
5,196,436
-1.60%
1,509,864
29.10%
62,605
29.06%
0.04%
2014
5,281,011
0.78%
2,194,346
41.60%
123,221
41.55%
0.05%
2013
5,240,286
-3.50%
2,253,418
43.00%
121,359
43.00%
0.00%
2012
5,428,833
6.10%
3,858,043
71.06%
447,907
71.07%
-0.01%
2011
5,116,929
1.68%
1,463,761
28.61%
59,519
28.61%
0.00%
2010
5,032,144
1.54%
2,214,503
44.01%
106,888
44.01%
0.00%
2009
4,955,750
-1.57%
2,000,812
40.40%
88,182
40.37%
0.03%
2008
5,034,660
10.70%
3,723,260
74.00%
506,672
73.95%
0.05%
2007
4,549,864
-0.10%
1,374,526
30.20%
30,619
30.21%
-0.01%
2006
4,554,683
2.30%
2,398,589
52.70%
116,629
52.66%
0.04%
2005
4,452,225
-1.50%
2,000,052
44.92%
75,982
44.92%
0.00%
2004
4,517,980
7.10%
3,198,367
70.79%
222,059
70.79%
0.00%
2003
4,217,227
-0.10%
1,296,955
30.80%
35,716
30.75%
0.05%
2002
4,219,957
2.70%
1,331,915
31.56%
44,493
31.56%
0.00%
2001
4,109,127
0.90%
1,905,511
46.40%
52,344
46.37%
0.03%
2000
4,073,644
7.00%
2,739,447
67.20%
150,414
67.25%
-0.05%
1999
3,808,754
2.30%
1,373,527
36.10%
10,686
36.06%
0.04%
1998
3,724,683
4.50%
1,229,139
33.00%
31,494
33.00%
0.00%
1997
3,565,697
7.30%
1,764,476
49.50%
47,571
49.48%
0.02%
1996
3,322,740
9.40%
2,416,642
72.70%
116,606
72.73%
-0.03%
1995
3,038,394
1.30%
1,585,783
52.20%
45,785
52.19%
0.01%
1994
3,000,560
0.90%
2,078,106
69.30%
81,636
69.26%
0.04%
1993
2,975,121
-2.60%
1,817,777
61.10%
53,904
61.10%
0.00%
1992
3,055,486
9.40%
2,558,665
83.70%
141,123
83.74%
-0.04%
Summary:
In summary, I can rectify the “2020 November General” and the “Daily_Registrant_Count_By_Locality” data files to give the following results compared to the HTML web report. The additional cross check of the response from FOIA request, matches my number to within a few thousand. All of this data is provided by VA DoE. All of it is supposed to be authoritative and definitive. And none of it makes any sense.
VA DoE Certified Results
Biden Vote
Trump Vote
Total Voting
Total Registered
% Change from previous year
(Reported) Turnout (Total Voting / Total Registered)
I will note for completeness here that the importVAVotefile(...) function referenced above is auto-generated by the MATLAB Import Data tool. I’ve listed it below for the record.
function NovemberGeneral = importVAVotefile(filename, dataLines)
%IMPORTFILE Import data from a text file
%  NOVEMBERGENERAL = IMPORTFILE(FILENAME) reads data from text file
%  FILENAME for the default selection.  Returns the data as a table.
%
%  NOVEMBERGENERAL = IMPORTFILE(FILE, DATALINES) reads data for the
%  specified row interval(s) of text file FILENAME. Specify DATALINES as
%  a positive scalar integer or a N-by-2 array of positive scalar
%  integers for dis-contiguous row intervals.
%
%  Example:
%  NovemberGeneral = importVAVotefile("2020 November General.csv", [2, Inf]);
%
%  See also READTABLE.
%
% Auto-generated by MATLAB on 07-Aug-2021 14:36:17

%% Input handling

% If dataLines is not specified, define defaults
if nargin < 2
    dataLines = [2, Inf];
end

%% Set up the Import Options and import the data
opts = delimitedTextImportOptions("NumVariables", 22);

% Specify range and delimiter
opts.DataLines = dataLines;
opts.Delimiter = ",";

% Specify column names and types
opts.VariableNames = ["CandidateUid", "FirstName", "MiddleName", "LastName", "Suffix", "TOTAL_VOTES", "Party", "WriteInVote", "LocalityUid", "LocalityCode", "LocalityName", "PrecinctUid", "PrecinctName", "DistrictUid", "DistrictType", "DistrictName", "OfficeUid", "OfficeTitle", "ElectionUid", "ElectionType", "ElectionDate", "ElectionName"];
opts.VariableTypes = ["categorical", "categorical", "categorical", "categorical", "categorical", "double", "categorical", "categorical", "categorical", "double", "categorical", "categorical", "categorical", "categorical", "categorical", "categorical", "categorical", "categorical", "categorical", "categorical", "string", "categorical"];

% Specify file level properties
opts.ExtraColumnsRule = "ignore";
opts.EmptyLineRule = "read";

% Specify variable properties
opts = setvaropts(opts, "ElectionDate", "WhitespaceRule", "preserve");
opts = setvaropts(opts, ["CandidateUid", "FirstName", "MiddleName", "LastName", "Suffix", "Party", "WriteInVote", "LocalityUid", "LocalityName", "PrecinctUid", "PrecinctName", "DistrictUid", "DistrictType", "DistrictName", "OfficeUid", "OfficeTitle", "ElectionUid", "ElectionType", "ElectionDate", "ElectionName"], "EmptyFieldRule", "auto");

% Import the data
NovemberGeneral = readtable(filename, opts);

end